Efficient Explicit-Solvent Molecular Dynamics Simulations ...

Monte Carlo simulations and moleculardynamics ∗
Daan Frenkel
January 4, 2007
1 Molecular Dynamics Simulations
Molecular Dynamics simulation is a technique to compute the equilibrium andtransport properties of a classical many-body system. In this context, the wordclassical means that the nuclear motion of the constituent particles obeys thelaws of classical mechanics. This is an excellent approximation for a wide rangeof materials. Only when we consider the translational or rotational motion oflight atoms or molecules (He, H2, D2) or vibrational motion with a frequencyν such that hν > kBT , should we worry about quantum effects.
Of course, our discussion of this vast subject is necessarily incomplete.Other aspects of the Molecular Dynamics techniques can be found in [1–4].
1.1 Molecular Dynamics: The Idea
Molecular Dynamics simulations are in many respects very similar to real ex-periments. When we perform a real experiment, we proceed as follows. Weprepare a sample of the material that we wish to study. We connect this sam-ple to a measuring instrument (e.g., a thermometer, manometer, or viscosime-ter), and we measure the property of interest during a certain time interval. Ifour measurements are subject to statistical noise (as most measurements are),then the longer we average, the more accurate our measurement becomes. Ina Molecular Dynamics simulation, we follow exactly the same approach. First,we prepare a sample: we select a model system consisting of N particles andwe solve Newton’s equations of motion for this system until the propertiesof the system no longer change with time (we equilibrate the system). Afterequilibration, we perform the actual measurement. In fact, some of the mostcommon mistakes that can be made when performing a computer experimentare very similar to the mistakes that can be made in real experiments (e.g., thesample is not prepared correctly, the measurement is too short, the system un-dergoes an irreversible change during the experiment, or we do not measurewhat we think).
To measure an observable quantity in a Molecular Dynamics simulation,we must first of all be able to express this observable as a function of the po-sitions and momenta of the particles in the system. For instance, a convenientdefinition of the temperature in a (classical) many-body system makes use of
∗This text is largely, but not exclusively, based on the book Understanding Molecular Simulationby Daan Frenkel and Berend Smit

1.2 Molecular Dynamics: A Program 2
the equipartition of energy over all degrees of freedom that enter quadraticallyin the Hamiltonian of the system. In particular for the average kinetic energyper degree of freedom, we have
⟨1
2mv2
α
⟩=
1
2kBT. (1.1)
In a simulation, we use this equation as an operational definition of the tem-perature. In practice, we would measure the total kinetic energy of the systemand divide this by the number of degrees of freedom Nf(= 3N − 3 for a systemof N particles with fixed total momentum1). As the total kinetic energy of asystem fluctuates, so does the instantaneous temperature:
T(t) =
N∑
i=1
miv2i (t)
kBNf. (1.2)
The relative fluctuations in the temperature will be of order 1/√
Nf. As Nf istypically of the order of 102–103, the statistical fluctuations in the temperatureare of the order of 5–10 %. To get an accurate estimate of the temperature, oneshould average over many fluctuations.
1.2 Molecular Dynamics: A Program
The best introduction to Molecular Dynamics simulations is to consider a sim-ple program. The program we consider is kept as simple as possible to illus-trate a number of important features of Molecular Dynamics simulations.
The program is constructed as follows:
1. We read in the parameters that specify the conditions of the run (e.g.,initial temperature, number of particles, density, time step).
2. We initialize the system (i.e., we select initial positions and velocities).
3. We compute the forces on all particles.
4. We integrate Newton’s equations of motion. This step and the previousone make up the core of the simulation. They are repeated until we havecomputed the time evolution of the system for the desired length of time.
5. After completion of the central loop, we compute and print the averagesof measured quantities, and stop.
Algorithm 1 is a short pseudo-algorithm that carries out a Molecular Dynamicssimulation for a simple atomic system. We discuss the different operations inthe program in more detail.
1.2.1 Initialization
To start the simulation, we should assign initial positions and velocities to allparticles in the system. The particle positions should be chosen compatiblewith the structure that we are aiming to simulate. In any event, the particlesshould not be positioned at positions that result in an appreciable overlap of
1Actually, if we define the temperature of a microcanonical ensemble through (kBT)−1 =(∂ ln Ω/∂E), then we find that, for a d-dimensional system of N atoms with fixed total momentum,kBT is equal to 2E/(d(N − 1) − 2).

1.2 Molecular Dynamics: A Program 3
Algorithm 1 (A Simple Molecular Dynamics Program)
program md simple MD program
call init initializationt=0do while (t.lt.tmax) MD loop
call force(f,en) determine the forcescall integrate(f,en) integrate equations of motiont=t+deltcall sample sample averages
enddostopend
Comment to this algorithm:
1. Subroutines init, force, integrate, and sample will be described inAlgorithms 2, 3, and 4, respectively. Subroutine sample is used to calculateaverages like pressure or temperature.
the atomic or molecular cores. Often this is achieved by initially placing theparticles on a cubic lattice.
In the present case (Algorithm 2), we have chosen to start our run froma simple cubic lattice. Assume that the values of the density and initial tem-perature are chosen such that the simple cubic lattice is mechanically unstableand melts rapidly. First, we put each particle on its lattice site and then we at-tribute to each velocity component of every particle a value that is drawn froma uniform distribution in the interval [−0.5, 0.5]. This initial velocity distribu-tion is Maxwellian neither in shape nor even in width. Subsequently, we shiftall velocities, such that the total momentum is zero and we scale the resultingvelocities to adjust the mean kinetic energy to the desired value. We know that,in thermal equilibrium, the following relation should hold:
⟨v2
α
⟩= kBT/m, (1.3)
where vα is the α component of the velocity of a given particle. We can use thisrelation to define an instantaneous temperature at time t T(t):
kBT(t) ≡N∑
i=1
mv2α,i(t)
Nf. (1.4)
Clearly, we can adjust the instantaneous temperature T(t) to match the desiredtemperature T by scaling all velocities with a factor (T/T(t))1/2. This initialsetting of the temperature is not particularly critical, as the temperature willchange anyway during equilibration.
As will appear later, we do not really use the velocities themselves in ouralgorithm to solve Newton’s equations of motion. Rather, we use the positionsof all particles at the present (x) and previous (xm) time steps, combined withour knowledge of the force (f) acting on the particles, to predict the positions atthe next time step. When we start the simulation, we must bootstrap this pro-

1.2 Molecular Dynamics: A Program 4
Algorithm 2 (Initialization of a Molecular Dynamics Program)
subroutine init initialization of MD programsumv=0sumv2=0do i=1,npart
x(i)=lattice pos(i) place the particles on a latticev(i)=(ranf()-0.5) give random velocitiessumv=sumv+v(i) velocity center of masssumv2=sumv2+v(i)**2 kinetic energy
enddosumv=sumv/npart velocity center of masssumv2=sumv2/npart mean squared velocityfs=sqrt(3*temp/sumv2) scale factor of the velocitiesdo i=1,npart set desired kinetic energy and set
v(i)=(v(i)-sumv)*fs velocity center of mass to zeroxm(i)=x(i)-v(i)*dt position previous time step
enddoreturnend
Comments to this algorithm:
1. Function lattice pos gives the coordinates of lattice position i and ranf()gives a uniformly distributed random number. We do not use a Maxwell-Boltzmann distribution for the velocities, on equilibration it will become aMaxwell-Boltzmann distribution.
2. In computing the number of degrees of freedom, we assume a three-dimensionalsystem (in fact, we approximate Nf by 3N).
cedure by generating approximate previous positions. Without much consid-eration for any law of mechanics but the conservation of linear momentum, weapproximate x for a particle in a direction by xm(i) = x(i) - v(i)*dt. Ofcourse, we could make a better estimate of the true previous position of eachparticle. But as we are only bootstrapping the simulation, we do not worryabout such subtleties.
1.2.2 The Force Calculation
What comes next is the most time-consuming part of almost all Molecular Dy-namics simulations: the calculation of the force acting on every particle. If weconsider a model system with pairwise additive interactions (as we do in thepresent case), we have to consider the contribution to the force on particle i
due to all its neighbors. If we consider only the interaction between a particleand the nearest image of another particle, this implies that, for a system of N
particles, we must evaluate N× (N − 1)/2 pair distances.This implies that, if we use no tricks, the time needed for the evaluation
of the forces scales as N2. There exist efficient techniques to speed up theevaluation of both short-range and long-range forces in such a way that thecomputing time scales as N, rather than N2. In Appendix C of ref. [5], wedescribe some of the more common techniques to speed up the simulations.

1.2 Molecular Dynamics: A Program 5
Algorithm 3 (Calculation of the Forces)
subroutine force(f,en) determine the forceen=0 and energydo i=1,npart
f(i)=0 set forces to zeroenddodo i=1,npart-1do j=i+1,npart loop over all pairs
xr=x(i)-x(j)xr=xr-box*nint(xr/box) periodic boundary conditionsr2=xr**2if (r2.lt.rc2) then test cut-offr2i=1/r2r6i=r2i**3ff=48*r2i*r6i*(r6i-0.5) Lennard-Jones potentialf(i)=f(i)+ff*xr update forcef(j)=f(j)-ff*xren=en+4*r6i*(r6i-1)-ecut update energy
endifenddo
enddoreturnend
Comments to this algorithm:
1. For efficiency reasons the factors 4 and 48 are usually taken out of the force loopand taken into account at the end of the calculation for the energy.
2. The term ecut is the value of the potential at r = rc; for the Lennard-Jonespotential, we have
ecut = 4
(1
r12c
−1
r6c
).
Although the examples in this appendix apply to Monte Carlo simulations, thesame techniques can also be used in a Molecular Dynamics simulation. How-ever, in the present, simple example (see Algorithm 3) we will not attempt tomake the program particularly efficient and we shall, in fact, consider all pos-sible pairs of particles explicitly.
We first compute the current distance in the x, y, and z directions betweeneach pair of particles i and j. These distances are indicated by xr. As in theMonte Carlo case, we use periodic boundary conditions. In the present exam-ple, we use a cutoff at a distance rc in the explicit calculation of intermolecularinteractions, where rc is chosen to be less than half the diameter of the periodicbox. In that case we can always limit the evaluation of intermolecular inter-actions between i and j to the interaction between i and the nearest periodicimage of j.
In the present case, the diameter of the periodic box is denoted by box. Ifwe use simple cubic periodic boundary conditions, the distance in any direc-tion between i and the nearest image of j should always be less (in absolutevalue) than box/2. A compact way to compute the distance between i and

1.2 Molecular Dynamics: A Program 6
the nearest periodic image of j uses the nearest integer function (nint(x) inFORTRAN). The nint function simply rounds a real number to the nearest in-teger.2 Starting with the x-distance (say) between i and any periodic imageof j, xr, we compute the x-distance between i and the nearest image of jas xr=xr-box*nint(xr/box). Having thus computed all Cartesian com-ponents of rij, the vector distance between i and the nearest image of j, wecompute r2
ij (denoted by r2 in the program). Next we test if r2ij is less than r2
c,the square of the cutoff radius. If not, we immediately skip to the next valueof j. It perhaps is worth emphasizing that we do not compute |rij| itself, be-cause this would be both unnecessary and expensive (as it would involve theevaluation of a square root).
If a given pair of particles is close enough to interact, we must computethe force between these particles, and the contribution to the potential energy.Suppose that we wish to compute the x-component of the force
fx(r) = −∂u(r)
∂x
= −(x
r
) (∂u(r)
∂r
).
For a Lennard-Jones system (in reduced units),
fx(r) =48x
r2
(1
r12− 0.5
1
r6
).
1.2.3 Integrating the Equations of Motion
Now that we have computed all forces between the particles, we can integrateNewton’s equations of motion. Algorithms have been designed to do this.Some of these will be discussed in a bit more detail. In the program (Algo-rithm 4), we have used the so-called Verlet algorithm. This algorithm is notonly one of the simplest, but also usually the best.
To derive it, we start with a Taylor expansion of the coordinate of a particle,around time t,
r(t + ∆t) = r(t) + v(t)∆t +f(t)
2m∆t2 +
∆t3
3!
...r +O(∆t4),
similarly,
r(t − ∆t) = r(t) − v(t)∆t +f(t)
2m∆t2 −
∆t3
3!
...r +O(∆t4).
Summing these two equations, we obtain:
r(t + ∆t) + r(t − ∆t) = 2r(t) +f(t)
m∆t2 +O(∆t4)
or
r(t + ∆t) ≈ 2r(t) − r(t − ∆t) +f(t)
m∆t2. (1.5)
The estimate of the new position contains an error that is of order ∆t4,where ∆t is the time step in our Molecular Dynamics scheme. Note that the
2Unfortunately, many FORTRAN compilers yield very slow nint functions. It is often cheaperto write your own code to replace the nint library routine.

1.2 Molecular Dynamics: A Program 7
Algorithm 4 (Integrating the Equations of Motion)
subroutine integrate(f,en) integrate equations of motionsumv=0sumv2=0do i=1,npart MD loop
xx=2*x(i)-xm(i)+delt**2*f(i) Verlet algorithm (1.5)vi=(xx-xm(i))/(2*delt) velocity (1.6)sumv=sumv+vi velocity center of masssumv2=sumv2+vi**2 total kinetic energyxm(i)=x(i) update positions previous timex(i)=xx update positions current time
enddotemp=sumv2/(3*npart) instantaneous temperatureetot=(en+sumv2)/(2*npart) total energy per particlereturnend
Comments to this algorithm:
1. The total energy etot should remain approximately constant during the sim-ulation. A drift of this quantity may signal programming errors. It therefore isimportant to monitor this quantity. Similarly, the velocity of the center of masssumv should remain zero.
2. In this subroutine we use the Verlet algorithm (1.5) to integrate the equations ofmotion. The velocities are calculated using equation (1.6).
Verlet algorithm does not use the velocity to compute the new position. One,however, can derive the velocity from knowledge of the trajectory, using
r(t + ∆t) − r(t − ∆t) = 2v(t)∆t +O(∆t3)
or
v(t) =r(t + ∆t) − r(t − ∆t)
2∆t+O(∆t2). (1.6)
This expression for the velocity is only accurate to order ∆t2. However, it ispossible to obtain more accurate estimates of the velocity (and thereby of thekinetic energy) using a Verlet-like algorithm (i.e., an algorithm that yields tra-jectories identical to the one given by equation (1.5)). In our program, we usethe velocities only to compute the kinetic energy and, thereby the instanta-neous temperature.
Now that we have computed the new positions, we may discard the posi-tions at time t − ∆t. The current positions become the old positions and thenew positions become the current positions.
After each time step, we compute the current temperature (temp), the cur-rent potential energy (en) calculated in the force loop, and the total energy(etot). Note that the total energy should be conserved.
This completes the introduction to the Molecular Dynamics method. Thereader should now be able to write a basic Molecular Dynamics program forliquids or solids consisting of spherical particles. In what follows, we shall do
1.3 Equations of Motion 8
two things. First of all, we discuss, in a bit more detail, the methods avail-able to integrate the equations of motion. Next, we discuss measurements inMolecular Dynamics simulations.
1.3 Equations of Motion
It is obvious that a good Molecular Dynamics program requires a good algo-rithm to integrate Newton’s equations of motion. In this sense, the choice ofalgorithm is crucial. However, although it is easy to recognize a bad algorithm,it is not immediately obvious what criteria a good algorithm should satisfy. Letus look at the different points to consider.
Although, at first sight, speed seems important, it is usually not very rele-vant because the fraction of time spent on integrating the equations of motion(as opposed to computing the interactions) is small, at least for atomic andsimple molecular systems.
Accuracy for large time steps is more important, because the longer thetime step that we can use, the fewer evaluations of the forces are needed perunit of simulation time. Hence, this would suggest that it is advantageous touse a sophisticated algorithm that allows use of a long time step.
Algorithms that allow the use of a large time step, achieve this by storing in-formation on increasingly higher-order derivatives of the particle coordinates.As a consequence, they tend to require more memory storage. For a typicalsimulation, this usually is not a serious drawback because, unless one consid-ers very large systems, the amount of memory needed to store these derivativesis small compared to the total amount available even on a normal workstation.
Energy conservation is an important criterion, but actually we should dis-tinguish two kinds of energy conservation; namely, short time and long time.The sophisticated higher-order algorithms tend to have very good energy con-servation for short times (i.e., during a few time steps). However, they oftenhave the undesirable feature that the overall energy drifts for long times. Incontrast, Verlet-style algorithms tend to have only moderate short-term energyconservation but little long-term drift.
It would seem to be most important to have an algorithm that accuratelypredicts the trajectory of all particles for both short and long times. In fact,no such algorithm exists. For essentially all systems that we study by MDsimulations, we are in the regime where the trajectory of the system throughphase space (i.e., the 6N-dimensional space spanned by all particle coordinatesand momenta) depends sensitively on the initial conditions. This means thattwo trajectories that are initially very close will diverge exponentially as timeprogresses. We can consider the integration error caused by the algorithm asthe source for the initial small difference between the “true” trajectory of thesystem and the trajectory generated in our simulation. We should expect thatany integration error, no matter how small, will always cause our simulatedtrajectory to diverge exponentially from the true trajectory compatible with thesame initial conditions. This so-called Lyapunov instability (see section 1.3.1)would seem to be a devastating blow to the whole idea of Molecular Dynamicssimulations but we have good reasons to assume that even this problem neednot be serious.
Clearly, this statement requires some clarification. First of all, one shouldrealize that the aim of an MD simulation is not to predict precisely what willhappen to a system that has been prepared in a precisely known initial condi-tion: we are always interested in statistical predictions. We wish to predict theaverage behavior of a system that was prepared in an initial state about which

1.3 Equations of Motion 9
we know something (e.g., the total energy) but by no means everything. Inthis respect, MD simulations differ fundamentally from numerical schemes topredict the trajectory of satellites through space: in the latter case, we reallywish to predict the true trajectory. We cannot afford to launch an ensemble ofsatellites and make statistical predictions about their destination. However, inMD simulations, statistical predictions are good enough. Still, this would notjustify the use of inaccurate trajectories unless the trajectories obtained numer-ically, in some sense, are close to true trajectories.
This latter statement that is generally believed to be true although, to ourknowledge, it has not been proven for any class of systems that is of interestfor MD simulations. However, considerable numerical evidence (see, e.g., [6])suggest that there exist so-called shadow orbits. A shadow orbit is a true tra-jectory of a many-body system that closely follows the numerical trajectory fora time that is long compared to the time it takes the Lyapunov instability todevelop. Hence, the results of our simulation are representative of a true tra-jectory in phase space, even though we cannot tell a priori which. Surprisingly(and fortunately), it appears that shadow orbits are better behaved (i.e., trackthe numerical trajectories better) for systems in which small differences in theinitial conditions lead to an exponential divergence of trajectories than for the,seemingly, simpler systems that show no such divergence [6]. In spite of thisreassuring evidence, it should be emphasized that it is just evidence and notproof. Hence, our trust in Molecular Dynamics simulation as a tool to study thetime evolution of many-body systems is based largely on belief. To concludethis discussion, let us say that there is clearly still a corpse in the cupboard. Webelieve this corpse will not haunt us, and we quickly close the cupboard. Formore details, the reader is referred to [7, 8].
Newton’s equation of motion are time reversible, and so should be our algo-rithms. In fact, many algorithms (for instance the predictor-corrector schemes,see Appendix E of ref. [5], and many of the schemes used to deal with con-straints) are not time reversible. That is, future and past phase space coordi-nates do not play a symmetric role in such algorithms. As a consequence, ifone were to reverse the momenta of all particles at a given instant, the sys-tem would not trace back its trajectory in phase space, even if the simulationwould be carried out with infinite numerical precision. Only in the limit ofan infinitely short time step will such algorithms become reversible. How-ever, what is more important, many seemingly reasonable algorithms differin another crucial respect from Hamilton’s equation of motion: true Hamilto-nian dynamics leaves the magnitude of any volume element in phase spaceunchanged, but many numerical schemes, in particular those that are not timereversible, do not reproduce this area-preserving property. This may soundlike a very esoteric objection to an algorithm, but it is not. Again, without at-tempting to achieve a rigorous formulation of the problem, let us simply notethat all trajectories that correspond to a particular energy E are contained in a(hyper) volume Ω in phase space. If we let Hamilton’s equation of motion acton all points in this volume (i.e., we let the volume evolve in time), then weend up with exactly the same volume. However, a non-area-preserving algo-rithm will map the volume Ω on another (usually larger) volume Ω ′. Aftersufficiently long times, we expect that the non-area-preserving algorithm willhave greatly expanded the volume of our system in phase space. This is notcompatible with energy conservation. Hence, it is plausible that nonreversiblealgorithms will have serious long-term energy drift problems. Reversible, area-preserving algorithms will not change the magnitude of the volume in phasespace. This property is not sufficient to guarantee the absence of long-term en-

1.3 Equations of Motion 10
ergy drift, but it is at least compatible with it. It is possible to check whetheran algorithm is area preserving by computing the Jacobian associated with thetransformation of old to new phase space coordinates.
Finally, it should be noted that even when we integrate a time-reversiblealgorithm, we shall find that the numerical implementation is hardly ever trulytime reversible. This is so, because we work on a computer with finite machineprecision using floating-point arithmetic that results in rounding errors (on theorder of the machine precision).
In the remainder of this section, we shall discuss some of these points inmore detail. Before we do so, let us first consider how the Verlet algorithmscores on these points. First of all, the Verlet algorithm is fast. But we hadargued that this is relatively unimportant. Second, it is not particularly accu-rate for long time steps. Hence, we should expect to compute the forces on allparticles rather frequently. Third, it requires about as little memory as is at allpossible. This is useful when we simulate very large systems, but in general itis not a crucial advantage. Fourth, its short-term energy conservation is fair (inparticular in the versions that use a more accurate expression for the velocities)but, more important, it exhibits little long-term energy drift. This is related tothe fact that the Verlet algorithm is time reversible and area preserving. In fact,although the Verlet algorithm does not conserve the total energy of this systemexactly, strong evidence indicates that it does conserve a pseudo-Hamiltonianapproaching the true Hamiltonian in the limit of infinitely short time steps.The accuracy of the trajectories generated with the Verlet algorithm is not im-pressive. But then, it would hardly help to use a better algorithm. Such analgorithm may postpone the unavoidable exponential growth of the error inthe trajectory by a few hundred time steps (see section 1.3.1), but no algorithmis good enough that it will keep the trajectories close to the true trajectories fora time comparable to the duration of a typical Molecular Dynamics run.3
1.3.1 Lyapunov Instability
To end this discussion of algorithms, we wish to illustrate the extreme sensitiv-ity of the trajectories to small differences in initial conditions. Let us considerthe position (rN) of one of the N particles at time t. This position is a functionof the initial positions and momenta at t = 0:
r(t) = f[rN(0), pN(0); t
].
Let us now consider the position at time t that would result if we perturbedthe initial conditions (say, some of the momenta) by a small amount ε. In thatcase, we would obtain a different value for r at time t:
r ′(t) = f[rN(0), pN(0) + ε; t
].
We denote the difference between r(t) and r ′(t) by ∆r(t). For sufficiently shorttimes, ∆r(t) is linear in ε. However, the coefficient of the linear dependencediverges exponentially; that is
|∆r(t)| ∼ ε exp(λt). (1.7)
This so-called Lyapunov instability of the trajectories is responsible for our in-ability to accurately predict a trajectory for all but the shortest simulations. The
3Error free integration of the equations of motion is possible for certain discrete models, suchas lattice-gas cellular automata. But these models do not follow Newton’s equation of motion.

1.4 Computer Experiments 11
0 2 4 6t
10-20
10-16
10-12
10-8
10-4
100
Σ i(ri(t
)-r’ i(t
))2
Figure 1: Illustration of the Lyapunov instability in a simulation of a Lennard-Jones system. The figure shows the time dependence of the sum of squareddistances between two trajectories that were initially very close (see text). Thetotal length of the run in reduced units was 5, which corresponds to 1000 timesteps. Note that, within this relatively short time, the two trajectories becomeessentially uncorrelated.
exponent λ is called the Lyapunov exponent (more precisely, the largest Lya-punov exponent; there are more such exponents, 6N in fact, but the largestdominates the long-time exponential divergence of initially close trajectories).Suppose that we wish to maintain a certain bound ∆max on |∆r(t)|, in the in-terval 0 < t < tmax. How large an initial error (ε) can we afford? From equa-tion (1.7), we deduce
ε ∼ ∆max exp(−λtmax).
Hence, the acceptable error in our initial conditions decreases exponentiallywith tmax, the length of the run. To illustrate that this effect is real, we showthe result of two almost identical simulations: the second differs from the firstin that the x components of the velocities of 2 particles (out of 1000) have beenchanged by +10−10 and −10−10 (in reduced units). We monitor the sum of thesquares of the differences of the positions of all particles:
N∑
i=1
|ri(t) − r ′i(t)|2.
As can be seen in Figure 1, this measure of the distance does indeed growexponentially with time.
After 1000 time steps, the two systems that were initially very close have be-come very nearly uncorrelated. It should be stressed this run was performedusing perfectly normal parameters (density, temperature, time step). The onlyunrealistic thing about this simulation is that it is extremely short. Most Molec-ular Dynamics simulations require many tens, if not hundreds, or thousandsof time steps.
1.4 Computer Experiments
Now that we have a working Molecular Dynamics program, we wish to useit to “measure” interesting properties of many-body systems. What properties

1.4 Computer Experiments 12
are interesting? First of all, of course, those quantities that can be comparedwith real experiments. Simplest among these are the thermodynamic proper-ties of the system under consideration, such as, the temperature T , the pressureP, and the heat capacity CV . As mentioned earlier, the temperature is measuredby computing the average kinetic energy per degree of freedom. For a systemwith f degrees of freedom, the temperature T is given by
T =〈2K〉
f. (1.8)
There are several different (but equivalent) ways to measure the pressure of aclassical N-body system. The most common among these is based on the virialequation for the pressure. For pairwise additive interactions, we can write (see,e.g., [9])
P = ρkBT +1
dV
⟨∑
i<j
f(rij) · rij
⟩, (1.9)
where d is the dimensionality of the system, and f(rij) is the force betweenparticles i and j at a distance rij. Note that this expression for the pressure hasbeen derived for a system at constant N, V , and T , whereas our simulationsare performed at constant N, V , and E. In fact, the expression for the pres-sure in the microcanonical ensemble (constant N,V, E) is not identical to theexpression that applies to the canonical (constant N,V, T ) ensemble. Lebowitzet al. [10] have derived a general procedure to convert averages from one en-semble to another. A more recent (and more accessible) description of theseinter-ensemble transformations has been given by Allen in [4]. An exampleof a relation derived by such a transformation is the expression for the heatcapacity at constant volume, as obtained from the fluctuations in the kineticenergy in the microcanonical ensemble:
⟨K2⟩
NVE− 〈K〉2NVE =
3k2BT2
2N
(1 −
3kB
2CV
). (1.10)
However, one class of thermodynamic functions cannot be measured di-rectly in a simulation, in the sense that these properties cannot be expressedas a simple average of some function of the coordinates and momenta of allthe particles in the system. Examples of such properties are the entropy S, theHelmholtz free energy F, and the Gibbs free energy G. Separate techniques arerequired to evaluate such thermal quantities in a computer simulation.
A second class of observable properties are the functions that characterizethe local structure of a fluid. Most notable among these is the so-called radialdistribution function g(r). The radial distribution function is of interest for tworeasons: first of all, neutron and X-ray scattering experiments on simple fluids,and light-scattering experiments on colloidal suspensions, yield informationabout g(r). Second, g(r) plays a central role in theories of the liquid state. Nu-merical results for g(r) can be compared with theoretical predictions and thusserve as a criterion to test a particular theory. In a simulation, it is straight-forward to measure g(r): it is simply the ratio between the average numberdensity ρ(r) at a distance r from any given atom (for simplicity we assume thatall atoms are identical) and the density at a distance r from an atom in an idealgas at the same overall density. By construction, g(r) = 1 in an ideal gas. Anydeviation of g(r) from unity reflects correlations between the particles due tothe intermolecular interactions.

1.4 Computer Experiments 13
Both the thermodynamic properties and the structural properties mentionedpreviously do not depend on the time evolution of the system: they are staticequilibrium averages. Such averages can be obtained by Molecular Dynamicssimulations or equally well by Monte Carlo simulations. However, in addi-tion to the static equilibrium properties, we can also measure dynamic equi-librium properties in a Molecular Dynamics simulation (but not with a MonteCarlo simulation). At first sight, a dynamic equilibrium property appears to bea contradiction: in equilibrium all properties are independent of time, henceany time dependence in the macroscopic properties of a system seems to berelated to nonequilibrium behavior. This is true, but it turns out that the time-dependent behavior of a system that is only weakly perturbed is completelydescribed by the dynamic equilibrium properties of the system. Later, weshall provide a simple introduction to the quantities that play a central rolein the theory of time-dependent processes near equilibrium, in particular theso-called time-correlation functions. However, we shall not start with a generaldescription of nonequilibrium processes. Rather we start with a discussion ofa simple specific example that allows us to introduce most of the necessaryconcepts.
1.4.1 Diffusion
Diffusion is the process whereby an initially nonuniform concentration profile(e.g., an ink drop in water) is smoothed in the absence of flow (no stirring).Diffusion is caused by the molecular motion of the particles in the fluid. Themacroscopic law that describes diffusion is known as Fick’s law, which statesthat the flux j of the diffusing species is proportional to the negative gradientin the concentration of that species:
j = −D∇c, (1.11)
where D, the constant of proportionality, is referred to as the diffusion coefficient.In what follows, we shall be discussing a particularly simple form of diffusion,namely, the case that the molecules of the diffusing species are identical tothe other molecules but for a label that does not affect the interaction of thelabeled molecules with the others. For instance, this label could be a particularpolarization of the nuclear spin of the diffusing species or a modified isotopiccomposition. Diffusion of a labeled species among otherwise identical solventmolecules is called self-diffusion.
Let us now compute the concentration profile of the tagged species, underthe assumption that, at time t = 0, the tagged species was concentrated at theorigin of our coordinate frame. To compute the time evolution of the concen-tration profile, we must combine Fick’s law with an equation that expressesconservation of the total amount of labeled material:
∂c(r, t)
∂t+ ∇ · j(r, t) = 0. (1.12)
Combining equation (1.12) with equation (1.11), we obtain
∂2c(r, t)
∂t2− D∇2c(r, t) = 0. (1.13)
We can solve equation (1.13) with the boundary condition
c(r, 0) = δ(r)
1.4 Computer Experiments 14
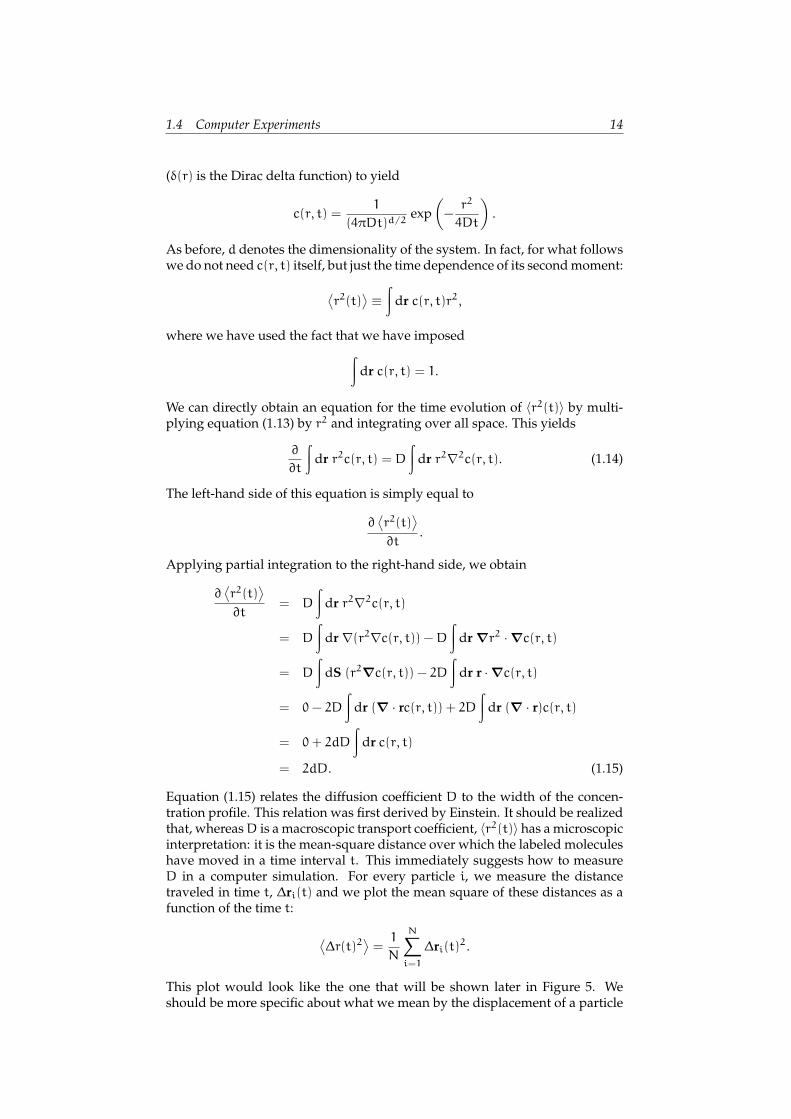
(δ(r) is the Dirac delta function) to yield
c(r, t) =1
(4πDt)d/2exp
(−
r2
4Dt
).
As before, d denotes the dimensionality of the system. In fact, for what followswe do not need c(r, t) itself, but just the time dependence of its second moment:
⟨r2(t)
⟩ ≡∫
dr c(r, t)r2,
where we have used the fact that we have imposed∫
dr c(r, t) = 1.
We can directly obtain an equation for the time evolution of 〈r2(t)〉 by multi-plying equation (1.13) by r2 and integrating over all space. This yields
∂
∂t
∫dr r2c(r, t) = D
∫dr r2∇2c(r, t). (1.14)
The left-hand side of this equation is simply equal to
∂⟨r2(t)
⟩
∂t.
Applying partial integration to the right-hand side, we obtain
∂⟨r2(t)
⟩
∂t= D
∫dr r2∇2c(r, t)
= D
∫dr ∇(r2∇c(r, t)) − D
∫dr ∇r2 ·∇c(r, t)
= D
∫dS (r2∇c(r, t)) − 2D
∫dr r ·∇c(r, t)
= 0 − 2D
∫dr (∇ · rc(r, t)) + 2D
∫dr (∇ · r)c(r, t)
= 0 + 2dD
∫dr c(r, t)
= 2dD. (1.15)
Equation (1.15) relates the diffusion coefficient D to the width of the concen-tration profile. This relation was first derived by Einstein. It should be realizedthat, whereas D is a macroscopic transport coefficient, 〈r2(t)〉 has a microscopicinterpretation: it is the mean-square distance over which the labeled moleculeshave moved in a time interval t. This immediately suggests how to measureD in a computer simulation. For every particle i, we measure the distancetraveled in time t, ∆ri(t) and we plot the mean square of these distances as afunction of the time t:
⟨∆r(t)2
⟩=
1
N
N∑
i=1
∆ri(t)2.
This plot would look like the one that will be shown later in Figure 5. Weshould be more specific about what we mean by the displacement of a particle

1.4 Computer Experiments 15
in a system with periodic boundary conditions. The displacement that we areinterested in is simply the time integral of the velocity of the tagged particle:
∆r(t) =
∫ t
0
dt ′ v(t ′).
In fact, there is a relation that expresses the diffusion coefficient directly interms of the particle velocities. We start with the relation
2D = limt→∞
∂⟨x2(t)
⟩
∂t(1.16)
where, for convenience, we consider only one Cartesian component of themean-square displacement. If we write x(t) as the time integral of the x com-ponent of the tagged-particle velocity, we get
⟨x2(t)
⟩=
⟨(∫t
0
dt ′ vx(t ′))2
⟩
=
∫t
0
∫t
0
dt ′dt ′′ 〈vx(t ′)vx(t ′′)〉
= 2
∫t
0
∫t ′
0
dt ′dt ′′ 〈vx(t ′)vx(t ′′)〉 . (1.17)
The quantity 〈vx(t ′)vx(t ′′)〉 is called the velocity autocorrelation function. Itmeasures the correlation between the velocity of a particle at times t ′ and t ′′.The velocity autocorrelation function (VACF) is an equilibrium property of thesystem, because it describes correlations between velocities at different timesalong an equilibrium trajectory. As equilibrium properties are invariant undera change of the time origin, the VACF depends only on the difference of t ′ andt ′′. Hence,
〈vx(t ′)vx(t ′′)〉 = 〈vx(t ′ − t ′′)vx(0)〉 .Inserting equation (1.17) in equation (1.16), we obtain
2D = limt→∞
2
∫ t
0
dt ′′ 〈vx(t − t ′′)vx(0)〉
D =
∫∞
0
dτ 〈vx(τ)vx(0)〉 . (1.18)
In the last line of equation (1.18) we introduced the coordinate τ ≡ t − t ′′.Hence, we see that we can relate the diffusion coefficient D to the integral ofthe velocity autocorrelation function. Such a relation between a transport co-efficient and an integral over a time-correlation function is called a Green-Kuborelation. Green-Kubo relations have been derived for many other transport co-efficients, such as the shear viscosity η,
η =1
VkBT
∫∞
0
dt 〈σxy(0)σxy(t)〉 (1.19)
with
σxy =
N∑
i=1
miv
xi v
yi +
1
2
∑
j 6=i
xijfy(rij)
; (1.20)

1.5 Some Applications 16
the thermal conductivity λT ,
λT =1
VkBT2
∫∞
0
dt 〈jez(0)jez(t)〉 (1.21)
with
jez =ddt
N∑
i=1
zi1
2
miv
2i +
∑
j 6=i
v(rij)
; (1.22)
and electrical conductivity σe
σe =1
VkBT
∫∞
0
dt⟨jelx (0)jel
x (t)⟩
(1.23)
with
jelx =
N∑
i=1
qivxi . (1.24)
For details, see, for example, [9]. Time correlation functions can easily be mea-sured in a Molecular Dynamics simulation. It should be emphasized that forclassical systems, the Green-Kubo relation for D and the Einstein relation arestrictly equivalent. There may be practical reasons to prefer one approach overthe other, but the distinction is never fundamental.
1.5 Some Applications
Let us illustrate the results of the previous sections with an example. Like inthe section on Monte Carlo simulations we choose the Lennard-Jones fluid asour model system. We use a truncated and shifted potential
utr−sh(r) =
ulj(r) − ulj(rc) r ≤ rc
0 r > rc,
where ulj(r) is the Lennard-Jones potential and for these simulations rc = 2.5σ
is used.
Case Study 1 (Static Properties of the Lennard-Jones Fluid)Let us start a simulation with 108 particles on a simple cubic lattice. We givethe system an initial temperature T = 0.728 and density ρ = 0.8442, which isclose to the triple (gas-liquid-solid) point of the Lennard-Jones fluid [11–13].
In Figure 2 the evolution of the total energy, kinetic energy, and potentialenergy is shown. It is important to note that the total energy remains constantand does not show a (slow) drift during the entire simulation. The kinetic andpotential energy do change initially (the equilibration period) but during the endof the simulation they oscillate around their equilibrium value. This figure showsthat, for the calculation of the average potential energy or kinetic energy, weneed ca. 1000 time steps to equilibrate the simulation. The figure also showssignificant fluctuations in the potential energy, some of which may take several(100) time steps before they disappear.
Appendix D of ref. [5] shows in detail how to calculate statistical error inthe data of a simulation. In this example, we use the method of Flyvbjerg andPetersen [14]. The following operations on the set of data points are performed:we start by calculating of the standard deviation of all the data points, then wegroup two consecutive data points and determine again the standard deviation

1.5 Some Applications 17
0 1000 2000Ntime
-5.0
-3.0
-1.0
1.0
3.0
U/N
totalpotential kinetic
Figure 2: Total, potential, and kinetic energy per particle U/N as a function ofthe number of time steps Ntime
of the new, blocked, data set This new data set contains half the number ofdata points of the original set. The procedure is repeated until there are notenough data points to compute a standard deviation, the number of times weperform this operation is called M. What do we learn from this?
First of all, let us assume that the time between two samples is so largethat the data points are uncorrelated. If the data are uncorrelated the standarddeviation (as calculated according to the formula in Appendix D of ref. [5], i.e.,correcting for the fact we have fewer data points) should be invariant to thisblocking operation and we should get a standard deviation that is independentof M. In a simulation, however, the time between two data points is usually tooshort to obtain a statistically independent sample, as a consequence consecu-tive data points would be (highly) correlated. If we would calculate a standarddeviation using these data, this standard deviation will be too optimistic. Theeffect of the block operation will be that after grouping two consecutive datapoints, the correlation between the two new data points will be less. This,however, will increase the standard deviation; the data will have more noisesince consecutive data points no longer resemble each other that closely. Thisdecrease of accuracy as a function of the number of blocking operations willcontinue until we have grouped so many data points that two consecutive pointare really uncorrelated. This is exactly the standard deviation we want to deter-mine. It is important to note that we have to ensure that the standard deviationswe are looking at are significant; therefore, we have to determine the standarddeviation of the error at the same time.
The results of this error calculation for the potential energy is shown in Fig-ure 3, as expected, for a low value of M, the error increases until a plateau isreached. For high values of M, we have only a few data points, which resultsin a large standard deviation in the error. The advantage of this method is thatwe have a means of finding out whether or not we have simulated enough; ifwe do not find such a plateau, the simulation must have been too short. Inaddition we find a reliable estimate of the standard deviation. The figure alsoshows the effect of increasing the total length of the simulation by a factor of 4;the statistical error in the potential energy has indeed decreased by a factor of2.
In this way we obtained the following results. For the potential energy

1.5 Some Applications 18
0 5 10 15M
0.000
0.002
0.004
σ
600000150000
Figure 3: The standard deviation σ in the potential energy as a function ofthe number of block operations M for a simulation of 150,000 and 600,000 timesteps.
U = −4.4190 ± 0.0012 and for the kinetic energy K = 2.2564 ± 0.0012, thelatter corresponds to an average temperature of T = 1.5043 ± 0.0008. For thepressure, we have obtained: 5.16± 0.02.
In Figure 4, the radial distribution function is shown. This distribution func-tion shows the characteristics of a dense liquid. We can use the radial distri-bution function to calculate the energy and pressure. The potential energy perparticle can be calculated from
U/N =1
2ρ
∫∞
0
dr u(r)g(r)
= 2πρ
∫∞
0
dr r2u(r)g(r) (1.25)
and for the pressure from
P = ρT −1
3
1
2ρ2
∫∞
0
drdu(r)
drrg(r)
= ρT −2
3πρ2
∫∞
0
drdu(r)
drr3g(r), (1.26)
where u(r) is the pair potential.Equations (1.25) and (1.26) can be used to check the consistency of the
energy and pressure calculations and the determination of the radial distribu-tion function. In our example, we obtained from the radial distribution functionfor the potential energy U/N = −4.419 and for the pressure P = 5.181, which isin good agreement with the direct calculation.
Case Study 2 (Dynamic Properties of the Lennard-Jones Fluid)As an example of a dynamic property we have determined the diffusion coeffi-cient. As shown in the previous section, the diffusion coefficient can be deter-mined from the mean square displacement or from the velocity autocorrelationfunction.
In Figure 5 the mean-square displacement is shown as a function of thesimulation time. From the mean-square displacement we can determine the

1.5 Some Applications 19
0.0 1.0 2.0 3.0r
0.0
1.0
2.0
3.0
g(r)
Figure 4: Radial distribution function of a Lennard-Jones fluid close to thetriple point: T = 1.5043± 0.0008 and ρ = 0.8442
0.0 0.5 1.0 1.5 2.0t
0.0
0.2
0.4
0.6
0.8
1.0
∆r(t
)2
0.0 0.5 1.0 1.5t
-1.0
0.0
1.0
2.0
3.0
4.0
5.0
<v(
0).v
(t)>
Figure 5: (left) Mean square displacement ∆r(t)2 as a function of the simula-tion time t. Note that for long times, ∆r(t)2 varies linearly with t. The slopeis then given by 2dD, where d is the dimensionality of the system and D theself-diffusion coefficient. (right) Velocity autocorrelation function 〈v(0) · v(t)〉as a function of the simulation time t.
diffusion using equation (1.16). This equation, however, is valid only in thelimit t → ∞. In practice this means that have to verify that we have simulatedenough that the mean square displacement is really proportional to t and notanother power of t.
The velocity autocorrelation function can be used as an independent routeto test the calculation of the diffusion coefficient. The diffusion coefficient fol-lows from equation (1.18). In this equation we have to integrate to t → ∞.Knowing whether or not we have simulated sufficiently to perform this integra-tion reliably is equivalent to the determination of the slope in the mean squaredisplacement. A simple trick is to determine the diffusion coefficient as a func-tion of the truncation of the integration; if a plateau has been reached over asufficient number of integration limits, the calculation is probably reliable.

2 Monte Carlo simulations 20
2 Monte Carlo simulations
Conceptually, the Molecular Dynamics method is straightforward: we sim-ply compute the time-averaged properties of a many-body system by solvingNewton’s equation of motion. To understand the Monte Carlo method, weneed to discuss some statistical mechanics. I try to limit this discussion to itsbare essentials.
2.1 Statistical-mechanical background
We start from the classical expression for the partition function Q:
Q = c
∫dpNdrN exp[−H(rN pN)/kBT ], (2.1)
where rN stands for the coordinates of all N particles, and pN for the corre-sponding momenta. The functionH(qN, pN) is the Hamiltonian of the system.It expresses the total energy of an isolated system as a function of the coordi-nates and momenta of the constituent particles: H = K + U , where K is the ki-netic energy of the system and U is the potential energy. Finally, c is a constantof proportionality, chosen such that the sum over quantum states approachesthe classical partition function in the limit h → 0. For instance, for a system ofN identical atoms, c = 1/(h3NN!). The classical equation is
〈A〉 =
∫dpNdrN A(pN, rN) exp[−βH(pN, rN)]∫
dpNdrN exp[−βH(pN, rN)], (2.2)
where β = 1/kBT . In this equation, the observable A has been expressed asa function of coordinates and momenta. As K is a quadratic function of themomenta the integration over momenta can be carried out analytically. Hence,averages of functions that depend on momenta only are usually easy to eval-uate. The difficult problem is the computation of averages of functions A(rN).Only in a few exceptional cases can the multidimensional integral over particlecoordinates be computed analytically, in all other cases numerical techniquesmust be used.
Having thus defined the nature of the numerical problem that we mustsolve, let us next look at possible solutions. It might appear that the moststraightforward approach would be to evaluate 〈A〉 in equation (2.2) by nu-merical quadrature, for instance using Simpson’s rule. It is easy to see, how-ever, that such a method is completely useless even if the number of indepen-dent coordinates DN (D is the dimensionality of the system) is still very smallO(100). Suppose that we plan to carry out the quadrature by evaluating theintegrand on a mesh of points in the DN-dimensional configuration space. Letus assume that we take m equidistant points along each coordinate axis. Thetotal number of points at which the integrand must be evaluated is then equalto mDN. For all but the smallest systems this number becomes astronomicallylarge, even for small values of m. For instance, if we take 100 particles in threedimensions, and m = 5, then we would have to evaluate the integrand at 10210
points! Computations of such magnitude cannot be performed in the knownuniverse. And this is fortunate, because the answer that would be obtainedwould have been subject to a large statistical error. After all, numerical quadra-tures work best on functions that are smooth over distances corresponding tothe mesh size. But for most intermolecular potentials, the Boltzmann factor inequation (2.2) is a rapidly varying function of the particle coordinates. Hence

2.1 Statistical-mechanical background 21
an accurate quadrature requires a small mesh spacing (i.e., a large value of m).Moreover, when evaluating the integrand for a dense liquid (say), we wouldfind that for the overwhelming majority of points this Boltzmann factor is van-ishingly small. For instance, for a fluid of 100 hard spheres at the freezing point,the Boltzmann factor would be nonzero for 1 out of every 10260 configurations!
The closing lines of the previous section suggest that it is in general notpossible to evaluate an integral, such as
∫drN exp[−βU(rN)], by direct Monte
Carlo sampling. However, in many cases, we are not interested in the configu-rational part of the partition function itself but in averages of the type
〈A〉 =
∫drN exp[−βU(rN)]A(rN)∫
drN exp[−βU(rN)]. (2.3)
Hence, we wish to know the ratio of two integrals. What Metropolis et al. [15]showed is that it is possible to devise an efficient Monte Carlo scheme to sam-ple such a ratio.4 To understand the Metropolis method, let us first look moreclosely at the structure of equation (2.3). In what follows we denote the config-urational part of the partition function by Z:
Z ≡∫
drN exp[−βU(rN)]. (2.4)
Note that the ratio exp(−βU)/Z in equation (2.3) is the probability density tofind the system in a configuration around rN. Let us denote this probabilitydensity by
N (rN) ≡ exp[−βU(rN)]
Z.
Clearly, N (rN) is nonnegative.Suppose now that we are somehow able to randomly generate points in
configuration space according to this probability distributionN (rN). This meansthat, on average, the number of points ni generated per unit volume arounda point rN is equal to LN (rN), where L is the total number of points that wehave generated. In other words;
〈A〉 ≈ 1
L
L∑
i=1
ni A(rNi ). (2.5)
By now the reader is almost certainly confused, let us therefore try to clar-ify this method with the help of a simple example (see Figure 6). In this fig-ure, we compare two ways to measure the depth of the river Nile, by conven-tional quadrature (left) and by Metropolis sampling; that is, the constructionof an importance-weighted random walk (right). In the conventional quadra-ture scheme, the value of the integrand is measured at a predetermined set ofpoints. As the choice of these points does not depend on the value of the inte-grand, many points may be located in regions where the integrand vanishes.In contrast, in the Metropolis scheme, a random walk is constructed throughthat region of space where the integrand is nonnegligible (i.e., through the Nileitself). In this random walk, a trial move is rejected if it takes you out of thewater and is accepted otherwise. After every trial move (accepted or not), thedepth of the water is measured. The (unweighted) average of all these mea-surements yields an estimate of the average depth of the Nile. This, then, is the
4An interesting account of the early history of the Metropolis method may be found in H.L. An-derson, J. Stat. Phys. 43:731, 1986; and Wood [16] p. 3.

2.1 Statistical-mechanical background 22
Figure 6: Measuring the depth of the Nile: a comparison of conventionalquadrature (left), with the Metropolis scheme (right).
essence of the Metropolis method. In principle, the conventional quadraturescheme would also give results for the total area of the Nile. In the importancesampling scheme, however, information on the total area cannot be obtaineddirectly, since this quantity is similar to Z.
Let us next consider how to generate points in configuration space witha relative probability proportional to the Boltzmann factor. The general ap-proach is first to prepare the system in a configuration rN, which we denoteby o (old), that has a nonvanishing Boltzmann factor exp[−βU(o)]. This con-figuration, for example, may correspond to a regular crystalline lattice with nohard-core overlaps. Next, we generate a new trial configuration r ′N, which wedenote by n (new), by adding a small random displacement ∆ to o. The Boltz-mann factor of this trial configuration is exp[−βU(n)]. We must now decidewhether we will accept or reject the trial configuration. Many rules for makingthis decision satisfy the constraint that on average the probability of findingthe system in a configuration n is proportional to N (n). Here we discuss onlythe Metropolis scheme, because it is simple and generally applicable.
Let us now “derive” the Metropolis scheme to determine the transitionprobability π(o → n) to go from configuration o to n. It is convenient to startwith a thought experiment (actually a thought simulation). We carry out a verylarge number (say M) Monte Carlo simulations in parallel, where M is muchlarger than the total number of accessible configurations. We denote the num-ber of points in any configuration o by m(o). We wish that, on average, m(o)is proportional to N (o). The matrix elements π(o → n) must satisfy one ob-vious condition: they do not destroy such an equilibrium distribution once itis reached. This means that, in equilibrium, the average number of acceptedtrial moves that result in the system leaving state o must be exactly equal tothe number of accepted trial moves from all other states n to state o. It is con-venient to impose a much stronger condition; namely, that in equilibrium theaverage number of accepted moves from o to any other state n is exactly can-celed by the number of reverse moves. This detailed balance condition implies

2.2 A Basic Monte Carlo Algorithm 23
the following:N (o)π(o → n) = N (n)π(n → o). (2.6)
Many possible forms of the transition matrix π(o → n) satisfy equation (2.6).Let us look how π(o → n) is constructed in practice. We recall that a MonteCarlo move consists of two stages. First, we perform a trial move from state o
to state n. We denote the transition matrix that determines the probability toperform a trial move from o to n by α(o → n); where α is usually referred to asthe underlying matrix of Markov chain [17]. The next stage is the decision toeither accept or reject this trial move. Let us denote the probability of acceptinga trial move from o to n by acc(o → n). Clearly,
π(o → n) = α(o → n)× acc(o → n). (2.7)
In the original Metropolis scheme, α is chosen to be a symmetric matrix (acc(o →n) = acc(n → o)). However, in later sections we shall see several exampleswhere α is not symmetric. If α is symmetric, we can rewrite equation (2.6) interms of the acc(o → n):
N (o)× acc(o → n) = N (n)× acc(n → o). (2.8)
From equation (2.8) follows
acc(o → n)
acc(n → o)=N (n)
N (o)= exp−β[U(n) − U(o)]. (2.9)
Again, many choices for acc(o → n) satisfy this condition (and the obviouscondition that the probability acc(o → n) cannot exceed 1). The choice ofMetropolis et al. is
acc(o → n) = N (n)/N (o) if N (n) < N (o)= 1 if N (n) ≥ N (o).
(2.10)
Other choices for acc(o → n) are possible (for a discussion, see for instance[1]), but the original choice of Metropolis et al. appears to result in a moreefficient sampling of configuration space than most other strategies that havebeen proposed.
2.2 A Basic Monte Carlo Algorithm
It is difficult to talk about Monte Carlo or Molecular Dynamics programs inabstract terms. The best way to explain how such programs work is to writethem down. This will be done in the present section.
Most Monte Carlo or Molecular Dynamics programs are only a few hun-dred to several thousand lines long. This is very short compared to, for in-stance, a typical quantum-chemistry code. For this reason, it is not uncommonthat a simulator will write many different programs that are tailor-made forspecific applications. The result is that there is no such thing as a standardMonte Carlo or Molecular Dynamics program. However, the cores of mostMD/MC programs are, if not identical, at least very similar. Next, we shallconstruct such a core. It will be very rudimentary, and efficiency has beentraded for clarity. But it should demonstrate how the Monte Carlo methodwork.

2.3 The Algorithm 24
2.3 The Algorithm
The prime purpose of the kind of Monte Carlo or Molecular Dynamics pro-gram that we shall be discussing is to compute equilibrium properties of clas-sical many-body systems. From now on, we shall refer to such programs sim-ply as MC or MD programs, although it should be remembered that there existmany other applications of the Monte Carlo method (and, to a lesser extent, ofthe Molecular Dynamics method). Let us now look at a simple Monte Carloprogram.
In the previous section, the Metropolis method was introduced as a Mar-kov process in which a random walk is constructed in such a way that theprobability of visiting a particular point rN is proportional to the Boltzmannfactor exp[−βU(rN)]. There are many ways to construct such a random walk.In the approach introduced by Metropolis et al. [15], the following scheme isproposed:
1. Select a particle at random, and calculate its energy U(rN).
2. Give the particle a random displacement; r ′ = r + ∆, and calculate itsnew energy U(r ′N).
3. Accept the move from rN to r ′N with probability
acc(o → n) = min(1, exp−β[U(r ′N) − U(rN)]
). (2.11)
An implementation of this basic Metropolis scheme is shown in Algorithms 5and 6.
2.4 Trial Moves
Now that we have specified the general structure of the Metropolis algorithm,we should consider its implementation. We shall not go into the problem ofselecting intermolecular potentials for the model system under study. Rather,we shall simply assume that we have an atomic or molecular model system ina suitable starting configuration and that we have specified all intermolecularinteractions. We must now set up the underlying Markov chain; that is, thematrix α. In more down to earth terms: we must decide how we are going togenerate trial moves. We should distinguish between trial moves that involveonly the molecular centers of mass and those that change the orientation orpossibly even the conformation of a molecule.
We start our discussion with trial moves of the molecular centers of mass.A perfectly acceptable method to create a trial displacement is to add randomnumbers between −∆/2 and +∆/2 to the x, y, and z coordinates of the molec-ular center of mass:
x ′i → xi + ∆ (Ranf − 0.5)
y ′i → yi + ∆ (Ranf − 0.5)
z ′i → zi + ∆ (Ranf − 0.5), (2.12)
where Ranf are random numbers uniformly distributed between 0 and 1. Clearly,the reverse trial move is equally probable (hence, α is symmetric).
We are now faced with two questions: how large should we choose ∆? andshould we attempt to move all particles simultaneously or one at a time? In

2.4 Trial Moves 25
Algorithm 5 (Basic Metropolis Algorithm)
PROGRAM mc basic Metropolis algorithm
do icycl=1,ncycl perform ncycl MC cyclescall mcmove displace a particleif (mod(icycl,nsamp).eq.0)
+ call sample sample averagesenddoend
Comments to this algorithm:
1. Subroutine mcmove attempts to displace a randomly selected particle(see Algorithm 6).
2. Subroutine sample samples quantities every nsampth cycle.
Algorithm 6 (Attempt to Displace a Particle)
SUBROUTINE mcmove attempts to displace a particle
o=int(ranf()*npart)+1 select a particle at randomcall ener(x(o),eno) energy old configurationxn=x(o)+(ranf()-0.5)*delx give particle random displacementcall ener(xn,enn) energy new configurationif (ranf().lt.exp(-beta acceptance rule (2.11)
+ *(enn-eno)) x(o)=xn accepted: replace x(o) by xnreturnend
Comments to this algorithm:
1. Subroutine ener calculates the energy of a particle at the given position.
2. Note that, if a configuration is rejected, the old configuration is retained.
3. The ranf() is a random number uniform in [0, 1].

2.4 Trial Moves 26
the latter case we should pick the molecule that is to be moved at random toensure that the underlying Markov chain remains symmetric. All other thingsbeing equal, we should choose the most efficient sampling procedure. But, tothis end, we must first define what we mean by efficient sampling. In very vagueterms, sampling is efficient if it gives you good value for money. Good valuein a simulation corresponds to high statistical accuracy, and “money” is sim-ply money: the money that buys your computer time and even your own time.For the sake of the argument, we assume the average scientific programmer ispoorly paid. In that case we have to worry only about your computer budget.5
Then we could use the following definition of an optimal sampling scheme: aMonte Carlo sampling scheme can be considered optimal if it yields the low-est statistical error in the quantity to be computed for a given expenditure ofcomputing budget. Usually, computing budget is equivalent to CPU time.
From this definition it is clear that, in principle, a sampling scheme maybe optimal for one quantity but not for another. Actually, the preceding def-inition is all but useless in practice (as are most definitions). For instance, itis just not worth the effort to measure the error estimate in the pressure for anumber of different Monte Carlo sampling schemes in a series of runs of fixedlength. However, it is reasonable to assume that the mean-square error in theobservables is inversely proportional to the number of uncorrelated configura-tions visited in a given amount of CPU time. And the number of independentconfigurations visited is a measure for the distance covered in configurationspace. This suggests a more manageable, albeit rather ad hoc, criterion to esti-mate the efficiency of a Monte Carlo sampling scheme: the sum of the squaresof all accepted trial displacements divided by computing time. This quantityshould be distinguished from the mean-square displacement per unit of com-puting time, because the latter quantity goes to zero in the absence of diffusion(e.g., in a solid or a glass), whereas the former does not.
Next, consider the choice of the parameter ∆ which determines the size ofthe trial move. How large should ∆ be? If it is very large, it is likely that theresulting configuration will have a high energy and the trial move will prob-ably be rejected. If it is very small, the change in potential energy is probablysmall and most moves will be accepted. In the literature, one often finds themysterious statement that an acceptance of approximately 50% should be op-timal. This statement is not necessarily true. The optimum acceptance ratio isthe one that leads to the most efficient sampling of configuration space. If weexpress efficiency as mean-square displacement per CPU time, it is easy to seethat different Monte Carlo codes will have different optimal acceptance ratios.The reason is that it makes a crucial difference if the amount of computing re-quired to test whether a trial move is accepted depends on the magnitude ofthe move (see Figure 7). In the conventional Metropolis scheme, all continuousinteractions have to be computed before a move can be accepted or rejected.Hence, for continuous potentials, the amount of computation does not dependon the size of a trial move. In contrast, for simulations of molecules with hardrepulsive cores, a move can be rejected as soon as overlap with any neighboris detected. In that case, a rejected move is cheaper than an accepted one, andhence the average computing time per trial move goes down as the step sizeis increased. As a result, the optimal acceptance ratio for hard-core systems isappreciably lower than for systems with continuous interactions. Exactly howmuch depends on the nature of the program, in particular on whether it is a
5Still, we should stress that it is not worthwhile to spend a lot of time developing a fancycomputational scheme that will be only marginally better than existing, simpler schemes, unlessyour program will run very often and speed is crucial.

2.5 Canonical Ensemble 27
∆
<∆r2>
continuoushard core
Cos
t
∆
Figure 7: (left) Typical dependence of the mean-square displacement of a par-ticle on the average size ∆ of the trial move. (right) Typical dependence of thecomputational cost of a trial move on the step-size ∆. For continuous poten-tials, the cost is constant, while for hard-core potentials it decreases rapidlywith the size of the trial move.
scalar or a vector code (in the latter case, hard-core systems are treated muchlike continuous systems), how the information about neighbor lists is stored,and even on the computational “cost” of random numbers and exponentiation.The consensus seems to be that for hard-core systems the optimum acceptanceratio is closer to 20 than to 50%, but this is just another rule of thumb thatshould be checked.
2.5 Canonical Ensemble
In a conventional Molecular Dynamics simulation, the total energy E and thetotal linear momentum P are constants of motion. Hence, Molecular Dynamicssimulations measure (time) averages in an ensemble that is very similar to themicrocanonical (see [18]); namely, the constant-NVE-P ensemble. In contrast, aconventional Monte Carlo simulation probes the canonical (i.e., constant-NVT )ensemble. The fact that these ensembles are different leads to observable differ-ences in the statistical averages computed in Molecular Dynamics and MonteCarlo simulations. Most of these differences disappear in the thermodynamiclimit and are already relatively small for systems of a few hundred particles.However, the choice of ensemble does make a difference when computing themean-square value of fluctuations in thermodynamic quantities. Fortunately,techniques exist to relate fluctuations in different ensembles [10]. Moreover,nowadays it is common practice to carry out Molecular Dynamics simulationsin ensembles other than the microcanonical. In particular, it is possible todo Molecular Dynamics at constant pressure, at constant stress, and at con-stant temperature. The choice of ensembles for Monte Carlo simulations iseven wider: isobaric-isothermal, constant-stress-isothermal, grand-canonical(i.e., constant-µVT ), and even microcanonical [19–24]. A more recent additionto this list is a Monte Carlo method that employs the Gibbs-ensemble tech-nique [25], which was developed to study phase coexistence in moderatelydense (multi component) fluids.

2.6 General Approach 28
N, V, T
Figure 8: Canonical ensemble. The number of particles, volume, and tem-perature are constant. Shown is a Monte Carlo move in which a particle isdisplaced.
2.6 General Approach
In the following sections, we will use the following procedure to demonstratethe validity of our Monte Carlo algorithms:
1. Decide which distribution we want to sample. This distribution, denotedN , will depend on the details of the ensemble.
2. Impose the condition of detailed balance,
K(o → n) = K(n → o), (2.13)
where K(o → n) is the flow of configuration o to n. This flow is given bythe product of the probability of being in configuration o, the probabilityof generating configuration n, and the probability of accepting this move,
K(o → n) = N (o)× α(o → n)× acc(o → n). (2.14)
3. Determine the probabilities of generating a particular configuration.
4. Derive the condition which needs to be fulfilled by the acceptance rules.
It is instructive to apply the preceding recipe to the ordinary Metropolisscheme. In the canonical ensemble, the number of particles, temperature, andvolume are constant (see Figure 8). The partition function is
Q(N,V, T) ≡ 1
Λ3NN!
∫drN exp[−βU(rN)], (2.15)
where Λ =√
h2/(2πmkBT) is the thermal de Broglie wavelength. From thepartition function it follows that the probability of finding configuration rN isgiven by distribution is
N (rN) ∝ exp[−βU(rN)]. (2.16)
Equations (2.15) and (2.16) are the basic equations for a simulation in the canon-ical ensemble.

2.7 Monte Carlo Simulations 29
2.7 Monte Carlo Simulations
In the canonical ensemble, we have to sample distribution (2.16). This can bedone using the following scheme:
1. Select a particle at random and calculate the energy of this configurationU(o).
2. Give this particle a random displacement (see Figure 8),
r(o) → r(o) + ∆(Ranf − 0.5),
where ∆/2 is the maximum displacement. The value of ∆ should be cho-sen such that the sampling scheme is optimal (see section 2.4). The newconfiguration is denoted n and its energy U(n).
3. The move is accepted with a probability (see equation (2.10))
acc(o → n) = min (1, exp−β[U(n) − U(o)]) . (2.17)
If rejected, the old configuration is kept.
An implementation of this basic Metropolis scheme is shown in Section 2.2(Algorithms 5 and 6).
2.8 Justification of the Algorithm
The probability of generating a particular configuration is constant and inde-pendent of the conformation of the system
α(o → n) = α(n → o) = α.
Substitution of this equation in the condition of detailed balance (2.13) and sub-stitution of the desired distribution (2.16) gives as condition for the acceptancerules
acc(o → n)
acc(n → o)= exp−β[U(n) − U(o)]. (2.18)
It is straightforward to demonstrate that acceptance rule (2.17) obeys this con-dition.
2.9 Sampling rejected states: a heresy?
The Markov Chain Monte Carlo method (MCMC) of Metropolis et al. wasdesigned to estimate the average properties of systems (many-body systemsare but one example) with a very large number of accessible states (“config-urations”). To achieve this, the algorithm generates a random walk throughconfiguration space such that any individual state is visited with a frequencyproportional to its (Boltzmann) weight. The desired estimate is then obtainedas an unweighted average over visited states.
In order to visit states with the correct frequency, the MCMC algorithmgenerates random trial moves from the current (“old”) state (o) to a new state(n). In the case of molecular systems, such a move might for instance be thedisplacement of a single particle. These trial moves may be either accepted orrejected. The acceptance criterion is chosen such that the probability to findthe system in state (i) is proportional to the Boltzmann weight (PB(i)). Thestandard “dogma” of MCMC simulations is that rejected states should not be

2.9 Sampling rejected states: a heresy? 30
included in the sampling. As a consequence, conventional MC algorithms arerather wasteful, because they tend to generate many trial states (often a major-ity) that are not used in the computation of averages. In this section, I arguethat we can do better: the properties of rejected states can be included in thesampling. In the case where many trial states are generated simultaneously, thenew approach may lead to a dramatic improvement in the statistical accuracyof Monte Carlo simulations [26].
MCMC algorithms traditionally construct a Markov-Chain using two steps:a. Starting from the current (old) state (o) a trial move is attempted to a newstate (n) according to a trial probability α. b. The trial state is then acceptedor rejected according to an acceptance rule that ensures detailed balance (or, atleast, the less strict balance [27]) between sampled microstates.
πij = αijPacc(ij) ∀ i 6= j, πii = 1 −∑
j
πij (2.19)
∑
j
πij = 1, ∀i (2.20)
Here, and in what follows, we use the term “balance” to describe algorithmsthat leave the equilibrium distribution invariant. That is: when we apply oneMonte Carlo step to an equilibrium distribution of initial states, the averageflux into any given state i is exactly balanced by the total flux out of that state.As a consequence, the probability density is not changed by such the MonteCarlo algorithm. The stronger “detailed balance” condition states that, for anypair of states i and j in an equilibrium ensemble, the average flux from i to j isequal and opposite to the flux from j to i. Clearly, the latter condition can onlybe satisfied if the algorithm satisfies microscopic reversibility: i.e. if j can bereached from i then there is a finite probability to carry out the reverse movefrom j to i.
In Eqn.(2.19) πij is the ijth element of the Markovian transition matrix. Fori 6= j, πij is given by the product of two terms: the probability of attempting atrial move from state i to state j, and the probability of accepting j as the newstate. The transition matrix is a stochastic matrix therefore its elements mustobey Eqn.(2.20).
In a Monte Carlo simulation, thermodynamic properties are evaluated asthe expectation values of the corresponding instantaneous properties. Whena trial move is not accepted, the instantaneous property of the old state has tobe recounted in the calculated average and no information about the rejectedstate is included in the computation of averages. Let us now consider MCalgorithms that satisfy detailed balance. The condition of detailed balance issatisfied whenever equation (2.21) holds for any pair of old states (o) and newstates (n).
ρoπon = ρoαonPacc(on) = ρnαnoPacc(no) = ρnπno (2.21)
Equations (2.19-2.21) do not uniquely define Pacc(on): there is therefore arelative freedom in the choice of the functional form. The most popular choiceis the Metropolis rule [15], but (infinitely many) other valid rules exist. Be-low we present a more general derivation that allows the evaluation of equi-librium properties by combining importance sampling and local sampling ofmicrostates using any combination of valid MCMC schemes. To make this ex-plicit, we consider two sets of transition probabilities (that may or may not be

2.9 Sampling rejected states: a heresy? 31
the same) : the first describes a conventional sampling of microstates whilethe second describes the local sampling of a group of microstates that are con-nected to the individual microstates of the first Markov chain. We use the term“Markovian web” to denote the set of microstates thus connected.
We assume that the Markov chain that connects the states of the Markovianweb satisfies detailed balance. Then equation (2.21) applies for any given pairof connected microstates o,n. From equations (2.20) and (2.21) the balancecondition may be derived:
∑m
ρmπwebmn =
∑m
ρnπwebnm = ρn
∑m
πwebnm = ρn (2.22)
Let us now consider the sampling of an equilibrium property A of the sys-tem:
〈A〉ρ =∑n
Anρn
/∑n
ρn (2.23)
We now substitute ρn from Eqn.(2.22). By changing the order of summation(integration in the continuum case) over all microstates we get:
∑n Anρn∑
n ρn=
∑n
∑m Anρmπweb
mn∑n
∑m ρmπweb
mn
=
∑m ρm
∑n Anπweb
mn∑m ρm
∑n πweb
mn
=
∑m ρm
∑n Anπweb
mn∑m ρm
⇔ 〈A〉ρ =
⟨∑n
πwebmn An
⟩
ρm
(2.24)
Where the last step required the use of equation (2.20). Equation (2.24) isexact and is in principle sufficient to describe how the expectation value of aproperty can be evaluated by combining importance sampling and integrationover the local states of a Markovian Web; i.e for every state m sampled viaimportance sampling an integration is performed over all n states for whichπweb
mn 6= 0. Equation (2.24) is quite general and it may be implemented in manyways. In the present paper, we focus on an application to Monte Carlo sam-pling of the equilibrium properties of a simple off-lattice system. The transitionmatrix of the Markov chain that is used to generate the Markovian Web can beseparated in two terms as in the case of MCMC discussed above (Eqn. (2.19)).The sum in equation (2.24) may be broken into two terms using Eqn. (2.19):
∑n
Anπwebmn =
∑
n 6=m
Anπwebmn + Am
1 −
∑
n 6=m
πwebmn
(2.25)
Substituting (2.25) into (2.24) and using the fact that∑
n 6=m αmn = 1, a newexpression for the average properties is derived:
〈A〉ρ =
⟨ ∑
n 6=m
αmn [AnPacc(mn) + Am (1 − Pacc(mn))]
⟩
ρm
(2.26)
The summation in equation (2.26) may be performed in many ways. Onepossible approach is to express the sum as a weighted average over the trialprobability αij.

REFERENCES 32
〈A〉ρ =⟨〈AnPacc(mn) + Am (1 − Pacc(mn))〉αmn
⟩ρm
(2.27)
Equation (2.27) implies that the sum required for equation (2.24) can be com-puted as a weighted average, where the weight is the trial probability αij. Inpractice, this means that we perform not only an importance sampling of thestates n with corresponding weights ρm, but we also generate a finite subset ofthe trial states n, with weights αmn.
We stress that equation (2.24) is general, whereas equation (2.27) representsone of the many possible implementations of the general case.
An important aspect of the proposed method is that the transition matrixof the Markovian Web is completely independent from the Markovian matrixthat is used to generate the importance sampling ( the importance samplingcould even have been generated by completely different method, e.g. constant-temperature Molecular Dynamics ). In other words: the two transition matricesmay differ in their trial probability or in their acceptance probability (e.g. useof Metropolis or the symmetric rule) or in both.
It is advantageous to consider situations where the number of trial states isvery large. Such a situation arises for instance when the system under consid-eration can be decomposed into non-interacting subsystems. An example is asystem consisting of particles with intermolecular interactions that can be trun-cated beyond a finite cut-off distance rc. If we divide the system into cells withdiameter d ≥ rc, then non-adjacent cells will not interact. This means that theprobability of acceptance of a trial move in one such cell does not depend on thepossible outcome of a trial move inside all other non-adjacent cells. This makesit possible to construct “parallel” trial moves that attempt to move particles ina set of N non-interacting cells. In normal MCMC, the result of such a parallelmove is that the system ends up in one specific final state (out of the 2N possi-ble states). With the present algorithm we can do much better. By generatingM trial states in each of the subsystem we can evaluate the term
∑Anπweb
mn bysumming all (M+ 1)N possible combinations of trial states for the subsystems.The number of trial microstates can be very large. Hence, special care shouldbe taken to compute averages over trial states efficiently. Since the subsystemsare independent one can calculate the probability of finding the total system ina specific macrostate (e.g. the collection of microstates with the same potentialenergy) as the convolution of the probabilities of the subsystems. It should benoted that the use of the convolution or even the independence between thesubsystems is not a necessary requirement but it is expected to be crucial in thecase of large number of possible trial states.
References
[1] M.P. Allen and D.J. Tildesley. Computer Simulation of Liquids. ClarendonPress, Oxford, 1987.
[2] G. Ciccotti and W.G. Hoover (editors). Proceedings of the 97th interna-tional school of Physics “Enrico Fermi” on Molecular-Dynamics Simulations ofStatistical-Mechanical Systems. North-Holland, Amsterdam, 1986.
[3] M. Meyer and V. Pontikis. Proceedings of the NATO ASI on Computer Simu-lation in Materials Science. Kluwer, Dordrecht, 1991.
[4] M.P. Allen and D.J. Tildesley. Proceedings of the NATO ASI on ComputerSimulation in Chemical Physics. Kluwer, Dordrecht, 1993.

REFERENCES 33
[5] D. Frenkel and B. Smit. Understanding Molecular Simulations: from Algo-rithms to Applications. Academic Press, San Diego, 1996.
[6] G.D. Quinlan and S. Tremaine. On the reliability of gravitational n-bodyintegrations. Mon. Not. R. Astron. Soc., 259:505–518, 1992.
[7] S. Toxvaerd. Hamiltonians for discrete dynamics. Phys. Rev. E, 50:2271–2274, 1994.
[8] F.J. Vesely. Computational Physics. An Introduction. Plenum, New York,1994.
[9] J.P. Hansen and I.R. McDonald. Theory of Simple Liquids. Academic Press,London, 2nd edition, 1986.
[10] J.L. Lebowitz, J.K. Percus, and L. Verlet. Ensemble dependence of fluctu-ations with application to machine computations. Phys. Rev., 153:250–254,1967.
[11] J.P. Hansen and L. Verlet. Phase transitions of the Lennard-Jones system.Phys. Rev., 184:151–161, 1969.
[12] A.J.C. Ladd and L.V. Woodcock. Triple-point coexistence properties of theLennard-Jones system. Chem. Phys. Lett., 51:155–159, 1977.
[13] A.J.C. Ladd and L.V. Woodcock. Interfacial and co-existence properties ofthe Lennard-Jones system at the triple point. Mol. Phys., 36:611–619, 1978.
[14] H. Flyvbjerg and H.G. Petersen. Error estimates on averages of correlateddata. J. Chem. Phys., 91:461–466, 1989.
[15] N. Metropolis, A.W. Rosenbluth, M.N. Rosenbluth, A.N. Teller, andE. Teller. Equation of state calculations by fast computing machines. J.Chem. Phys., 21:1087–1092, 1953.
[16] W.W. Wood. Early history of computer simulation in statistical mechanics.In G. Ciccotti and W.G. Hoover, editors, Molecular Dynamics Simulationsof Statistical Mechanics Systems, pages 2–14. Proceedings of the 97th Int.“Enrico Fermi” School of Physics, North Holland, Amsterdam, 1986.
[17] N.G. van Kampen. Stochastic Processes in Physics and Chemistry. North-Holland, Amsterdam, 1981.
[18] J.J. Erpenbeck and W.W. Wood. Molecular dynamics techniques for hard-core systems. In B.J. Berne, editor, Statistical Mechanics, Part B, pages 1–40.Plenum, New York, 1976.
[19] W.W. Wood. Monte Carlo calculations for hard disks in the isothermal-isobaric ensemble. J. Chem. Phys., 48:415–434, 1968.
[20] I.R. McDonald. NpT-ensemble Monte Carlo calculations for binary liquidmixtures. Mol. Phys., 23:41–58, 1972.
[21] R. Najafabadi and S. Yip. Observation of finite-temperature strain trans-formation (f.c.c. ↔ b.c.c.) in Monte Carlo simulation of iron. Scripta Metall.,17:1199–1204, 1983.
[22] G.E. Norman and V.S Filinov. Investigation of phase transitions by aMonte-Carlo method. High Temp. (USSR), 7:216–222, 1969.

REFERENCES 34
[23] D.J. Adams. Chemical potential of hard-sphere fluids by Monte Carlomethods. Mol. Phys., 28:1241–1252, 1974.
[24] M. Creutz. Microcanonical Monte Carlo simulation. Phys. Rev. Lett.,50:1411–1414, 1983.
[25] A.Z. Panagiotopoulos. Direct determination of phase coexistence proper-ties of fluids by Monte Carlo simulation in a new ensemble. Mol. Phys.,61:813–826, 1987.
[26] D. Frenkel. Speed-up of Monte Carlo simulations by sampling of rejectedstates. Proc. Nat. Acad. Sci. USA, 101:17571–17575, 2004.
[27] V.I. Manousiouthakis and M.W. Deem. Strict detailed balance is unneces-sary in Monte Carlo simulation. J. Chem. Phys., 110:2753–2756, 1999.