Monitoring The Human Condition Study: Annual Report of ... · Monitoring The Human Condition Study:...
144
Transcript of Monitoring The Human Condition Study: Annual Report of ... · Monitoring The Human Condition Study:...
Monitoring The Human Condition Study: Annual Report of Findings – 2009 Survey Research Findings and Latest U.S. Census Statistics (PRELIMINARY) The Human Condition Project Revision A April 3, 2009 Barnstable County Health and Human Services Advisory Council Barnstable County Department of Human Services

MTHC - 2009 – Rev. A. 4/3/09
MONITORING THE HUMAN CONDITION ON CAPE COD STUDY RESEARCH DESIGN, METHODOLOGY, and IMPLEMENTATION
Project Manager Elizabeth Albert Director, Barnstable County Dept. of Human Services
Principal Investigator Warren K. Smith Data Analyst, Barnstable County Dept. of Human Services
Consultants Statistical, Survey Research Consultant Dr. Sonia Sheffield Sheffield Research and Evaluation
Editor, SNAPSHOTS of The Human Condition on Cape Cod Barbara L. Clark MONITORING THE HUMAN CONDITION STUDY: ANNUAL REPORT OF FINDINGS – 2009 Principal Author: Warren K. Smith Data Analyst, Barnstable County Dept. of Human Services
Contributing Author:
Dr. Sonia Sheffield Sheffield Research and Evaluation PROJECT FUNDING Barnstable County
MONITORING THE HUMAN CONDITION STUDY PUBLICATIONS Barnstable County Department of Human Services, P.O.B. 427, Barnstable, MA 02630 E-Mail: [email protected] Tel. (508) 375-6628 FAX (508) 362-0290 View or download an ONLINE version of this Monitoring The Human Condition Study: Annual Report of Findings – 2009 at the following site: http://www.bchumanservices.net/page.php?99,,150337p,bar2573,0,0,Index,ck_.html MONITORING THE HUMAN CONDITION STUDY WEB SITE
http://www.bchumanservices.net/page.php?99,,150337p,bar2573,0,0,Index,ck_.html

MTHC - 2009 – Rev. A. 4/3/09
ACKNOWLEDGEMENTS
The annual Monitoring The Human Condition of Cape Cod Study is a mammoth undertaking requiring the work of scores of volunteers and residents as well as County staff. This task could not be successfully accomplished each year without the assistance of these many individuals. The Department wishes to acknowledge the considerable efforts of members of the Barnstable County Health and Human Services Advisory Council and their staffs. Representatives and alternate members of that Council are central each year in helping set the tone of the study questions and in proposing both the theme and substance of timely and useful Supplemental Questions for each year’s survey questionnaire. In addition, many Council members assist each Fall in the all-important in-the-field distribution of survey questionnaires We also thank the following residents and community volunteers who assisted this year in the in-field survey distribution; Jeanne Adams, Karen Cardeira, Rose DiGregorio, Pat Fecher, Ronnie Gullette, Joy Haagsma, Paul Hebert, Deb Battles, Terri Huff, Sue Johnson, Karen Marciante, Ann McDonald, Mary Ann Mills-Lassiter, Ingrid Muzy-Murray, Valerie Pereira-Brown, Darlene Perkins, Caronanne Procaccini, Connie Souza, and Liz Smith. Without a doubt, these individuals were responsible for the success of this year’s Cape Cod Community Survey. Last, and certainly not least, we thank our Department’s Administrative Assistant, Kathie Callahan for her excellent work throughout the Study. For starters, Kathie transcribed the more than 1,500 comments written-in by survey respondents. In addition, Kathie’s coordination of the in-field distribution of thousands of surveys is a tribute to her organizational skills and tenacity. Thanks again to all who assisted in this year’s Study. Beth Albert, Director Warren Smith, Data Analyst
MTHC-2009 – Rev. A 4/3/09 How To Use This Report
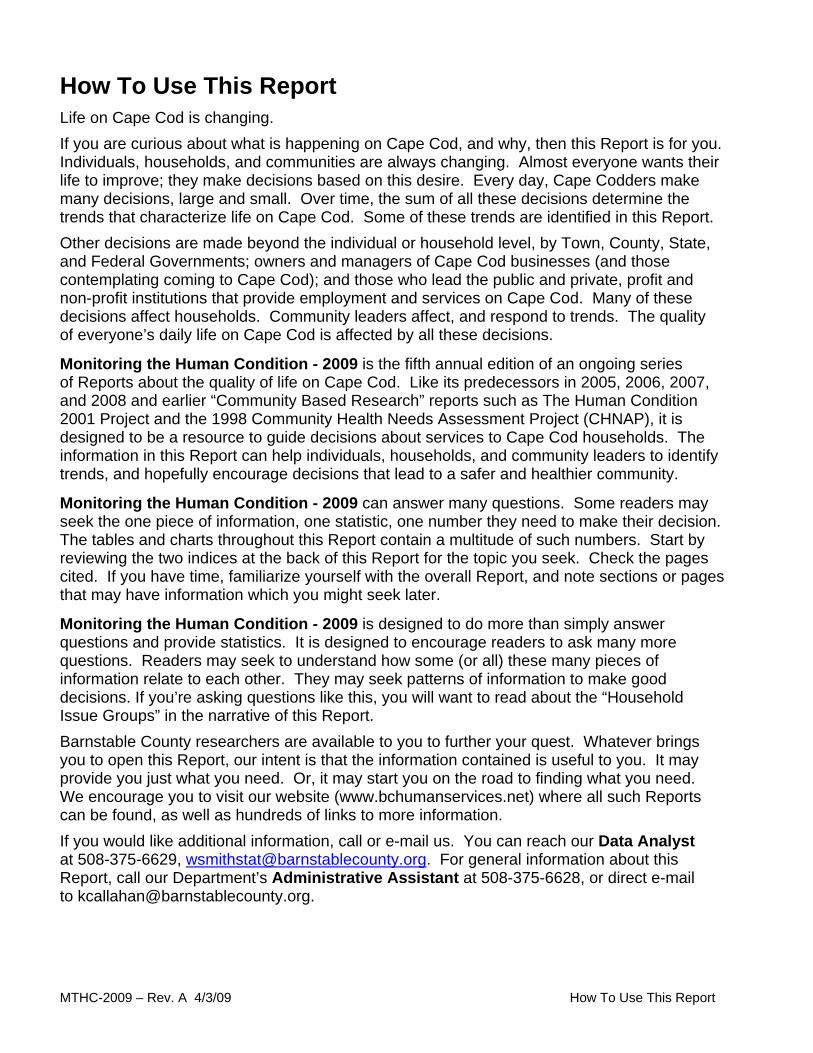
How To Use This Report
Life on Cape Cod is changing.
If you are curious about what is happening on Cape Cod, and why, then this Report is for you. Individuals, households, and communities are always changing. Almost everyone wants their life to improve; they make decisions based on this desire. Every day, Cape Codders make many decisions, large and small. Over time, the sum of all these decisions determine the trends that characterize life on Cape Cod. Some of these trends are identified in this Report.
Other decisions are made beyond the individual or household level, by Town, County, State, and Federal Governments; owners and managers of Cape Cod businesses (and those contemplating coming to Cape Cod); and those who lead the public and private, profit and non-profit institutions that provide employment and services on Cape Cod. Many of these decisions affect households. Community leaders affect, and respond to trends. The quality of everyone’s daily life on Cape Cod is affected by all these decisions.
Monitoring the Human Condition - 2009 is the fifth annual edition of an ongoing series of Reports about the quality of life on Cape Cod. Like its predecessors in 2005, 2006, 2007, and 2008 and earlier “Community Based Research” reports such as The Human Condition 2001 Project and the 1998 Community Health Needs Assessment Project (CHNAP), it is designed to be a resource to guide decisions about services to Cape Cod households. The information in this Report can help individuals, households, and community leaders to identify trends, and hopefully encourage decisions that lead to a safer and healthier community.
Monitoring the Human Condition - 2009 can answer many questions. Some readers may seek the one piece of information, one statistic, one number they need to make their decision. The tables and charts throughout this Report contain a multitude of such numbers. Start by reviewing the two indices at the back of this Report for the topic you seek. Check the pages cited. If you have time, familiarize yourself with the overall Report, and note sections or pages that may have information which you might seek later.
Monitoring the Human Condition - 2009 is designed to do more than simply answer questions and provide statistics. It is designed to encourage readers to ask many more questions. Readers may seek to understand how some (or all) these many pieces of information relate to each other. They may seek patterns of information to make good decisions. If you’re asking questions like this, you will want to read about the “Household Issue Groups” in the narrative of this Report.
Barnstable County researchers are available to you to further your quest. Whatever brings you to open this Report, our intent is that the information contained is useful to you. It may provide you just what you need. Or, it may start you on the road to finding what you need. We encourage you to visit our website (www.bchumanservices.net) where all such Reports can be found, as well as hundreds of links to more information.
If you would like additional information, call or e-mail us. You can reach our Data Analyst at 508-375-6629, [email protected]. For general information about this Report, call our Department’s Administrative Assistant at 508-375-6628, or direct e-mail to [email protected].


MTHC-2009 – Rev. A 4/3/09 Table of Contents
Table of Contents
SURVEY RESEARCH FINDINGS AND LATEST U.S. CENSUS STATISTICS Page Executive Summary
Table of Contents
Summary of Findings 1
Statistical Highlights – Community Discussion Points 7
Section 1. Project Overview: Monitoring The Human Condition 1-1
Section 2. The Human Environment on Cape Cod 2-1
1. “Human Environment” vs. “Human Condition”
Section 3. Introduction To The Human Condition Project Research 3-1
1. Human Services Needs Assessment: • Community-Based Research 3-1 • Community Involvement 3-2 • Primary Research 3-3
o Survey Research 3-3 o Community Forums 3-3
• Secondary Research 3-3 • Research Findings Report 3-3 • Research Implementation 3-4
o Data Analysis 3-4 o Research Timetable 3-4 o Research Staffing 3-4
Section 4. Research Questions 4-1
1. What Are The Human Needs? 4-1 2. How Serious Are The Needs? 4-1 3. Who Are The Needy? 4-1
Section 5. Research Findings 5-1
1. Socio-Demographic Profile of Barnstable County 5-1 • U.S. Census Bureau Statistics
2. Description of Human Needs of Cape Codders 5-17
3. Seriousness of Human Needs on Cape Cod 5-19
4. Description of The Needy On Cape Cod 5-29 • Needy Groups Compared 5-29 • Most Needy on Cape Cod 5-35
5. Basic Needs: 5-37
• Employment 5-37 • Health & Healthcare 5-41 • Housing 5-47 • Income Security 5-51 • Public Safety 5-55 • Transportation 5-59

MTHC-2009 – Rev. A 4/3/09 Table of Contents
Section 5. Research Findings (continued) Page
6. Children and Family 5-63
7. Quality of Life 5-69
8. Life Skills/Life-Long Learning 5-75 • Educational Attainment 5-75
9. Special Focus on Rental Housing 5-79
10. Special Focus on Owner Housing 5-91
11. Special Focus on Older Seniors and Elders 5-99
12. Special Focus on Cost of Living on Cape Cod 5-103
13. Special Focus on Service Assistance Results 5-113
APPENDIX 1. Survey Research: 1.A-1
A. Cape Cod Community Survey - 2008 - Cover Letters - Survey Questionnaire
B. Methodology C. Survey Sample: Detailed Description
2. Details of Need on Cape Cod: 2.A-1 A. Seriousness of Needs
- Definitions of MAJOR Need Areas B. Needs of Population Sub-Groups:
• Household Issue Groups • Special Focus Topic Groups;
o Renters o Homeowners
C. Basic Needs Responses D. Children/Family Responses E. Quality of Life Responses F. Life Skills/Life-Long Learning Responses G. Responses from Special Focus on Rental Housing H. Responses from Special Focus on Home Ownership I. Responses from Special Focus on Cost of Living J. Responses from Special Focus on Service Assistance Results
3. Monograph Report: Snapshots of The Human Condition on Cape Cod 3 -1
A. Cape Cod and Cape Codders, A Self-Evaluation: Responses to Cape Cod Community Survey – 2008 Open-Ended Questions, Revision A, April 2009 (SNAPSHOT Report 09-001)
4. Glossary of Terms 4 -1 U.S. Census 2000 Terminology
INDEX Topic Index Index - 1 General (Alphabetic) Index Index - 9

MTHC - 2009 – Rev. A. 4/3/09
MONITORING THE HUMAN CONDITION ON CAPE COD STUDY RESEARCH DESIGN, METHODOLOGY, and IMPLEMENTATION
Project Manager Elizabeth Albert Director, Barnstable County Dept. of Human Services
Principal Investigator Warren K. Smith Data Analyst, Barnstable County Dept. of Human Services
Consultants Statistical, Survey Research Consultant Dr. Sonia Sheffield Sheffield Research and Evaluation
Editor, SNAPSHOTS of The Human Condition on Cape Cod Barbara L. Clark MONITORING THE HUMAN CONDITION STUDY: ANNUAL REPORT OF FINDINGS – 2009 Principal Author: Warren K. Smith Data Analyst, Barnstable County Dept. of Human Services
Contributing Author:
Dr. Sonia Sheffield Sheffield Research and Evaluation PROJECT FUNDING Barnstable County
MONITORING THE HUMAN CONDITION STUDY PUBLICATIONS Barnstable County Department of Human Services, P.O.B. 427, Barnstable, MA 02630 E-Mail: [email protected] Tel. (508) 375-6628 FAX (508) 362-0290 View or download an ONLINE version of this Monitoring The Human Condition Study: Annual Report of Findings – 2009 at the following site: http://www.bchumanservices.net/page.php?99,,150337p,bar2573,0,0,Index,ck_.html MONITORING THE HUMAN CONDITION STUDY WEB SITE
http://www.bchumanservices.net/page.php?99,,150337p,bar2573,0,0,Index,ck_.html
MTHC - 2009 – Rev. A. 4/3/09
ACKNOWLEDGEMENTS
The annual Monitoring The Human Condition of Cape Cod Study is a mammoth undertaking requiring the work of scores of volunteers and residents as well as County staff. This task could not be successfully accomplished each year without the assistance of these many individuals. The Department wishes to acknowledge the considerable efforts of members of the Barnstable County Health and Human Services Advisory Council and their staffs. Representatives and alternate members of that Council are central each year in helping set the tone of the study questions and in proposing both the theme and substance of timely and useful Supplemental Questions for each year’s survey questionnaire. In addition, many Council members assist each Fall in the all-important in-the-field distribution of survey questionnaires We also thank the following residents and community volunteers who assisted this year in the in-field survey distribution; Jeanne Adams, Karen Cardeira, Rose DiGregorio, Pat Fecher, Ronnie Gullette, Joy Haagsma, Paul Hebert, Deb Battles, Terri Huff, Sue Johnson, Karen Marciante, Ann McDonald, Mary Ann Mills-Lassiter, Ingrid Muzy-Murray, Valerie Pereira-Brown, Darlene Perkins, Caronanne Procaccini, Connie Souza, and Liz Smith. Without a doubt, these individuals were responsible for the success of this year’s Cape Cod Community Survey. Last, and certainly not least, we thank our Department’s Administrative Assistant, Kathie Callahan for her excellent work throughout the Study. For starters, Kathie transcribed the more than 1,500 comments written-in by survey respondents. In addition, Kathie’s coordination of the in-field distribution of thousands of surveys is a tribute to her organizational skills and tenacity. Thanks again to all who assisted in this year’s Study. Beth Albert, Director Warren Smith, Data Analyst

MTHC-2009 – Rev. A 4/3/09 1-1
Section 1. Overview “The Human Condition. . . . . . . . . Improving The Human Environment on Cape Cod”
This simple phrase defines the overall concept of the Project: to understand our human needs and then to bring about the changes required to improve the human condition of all permanent, year-round residents of Cape Cod.
The Human Condition is a community-based project aimed at improving the quality of life of the year-round, permanent resident population of Cape Cod. The Project—an on- going community effort, implements a recurring cycle of--assessing--improving--monitoring--reassessing . . .
Building on the success of past community needs assessment work and responding to a demonstrated need for a annual update of prior research, the Barnstable County Health and Human Services Advisory Council and the Barnstable County Department of Human Services have conducted a “mini” version of previous Human Condition studies. This work accomplishes an annual update to The Human Condition study.
Barnstable County has seen exceptionally fast growth over the past two decades. While overall growth has slowed dramatically in recent years, growth of our senior/elder (age 55+) population continues to be among the fastest in Massachusetts. Rapid growth in our population has triggered considerable change in the diversity of our population--diversity in the areas of race, culture, national origin, age, income, working status (employment type and number of workers), chronic illness, and disabilities. Results of this rapid population growth coupled with changes in these racial, cultural, linguistic, income, and employment diversity characteristics of residents need to be understood and promptly addressed by Cape Codders--The Monitoring Human Condition Study - 2009 is an approach to accomplishing this important goal.
Community development is key to The Human Condition Project. The goal of expanded citizen involvement is to create a community environment in which concrete action steps can be taken in addressing critical social needs. Knowledge resulting from Project research continues to be crucial in determining unmet social needs. Development of a community ready and willing to take action to correct problems relating to unmet social needs is a key outcome from this Project. Without a willingness and ability of the impacted community to address demonstrated unmet needs, no amount of research will result in an appropriate community response. Community development is a key outcome of The Human Condition Project.
Prior The Human Condition studies (1995, 2001, 2005/6/7/8) have led to a set of detailed research conclusions. Conclusions regarding what health and human services are needed, which services are in critical need of development or improvement, what population segments are most in need, and which community responses require reallocation of funding, informs government officials as well as service provider agency executives and planners, funding sources, and residents. After study and consideration of the prior research findings by the community, recommendations evolve. These recommendations provide the motivation and justification for community action— "grassroots” initiatives, as well as governmental and private-sector actions. Public- private partnerships continue to emerge from such community-based initiatives.
MTHC-2009 – Rev. A 4/3/09 1-2
The Human Condition
Defining the "human condition" is difficult. We all have differing opinions about what comprises our "well being," our "quality of life," or the "human condition" in which we find ourselves. People may argue over the amount of income, the level of education attainment, the degree of personal safety, the time available for leisure and cultural activities, and so forth, that are needed to satisfy the "necessities of life." However, there is much less controversy over what elements of our lives make up well being, quality of life, the human condition, etc.
For the research purposes of The Human Condition Project, the primary elements of Cape Cod's human environment are understood to include:
- Education - Employment - Health - Housing - Income Security/Cost of Living - Leisure/Culture - Participation in Government - Public Assistance - Public Safety - Sustainability - Transportation - Volunteerism
It is these twelve elements of the Cape's human environment that we continually monitor. It is these annual updates to study data that we will help lead us to improve the human condition of all Cape Codders.
The research work of The Human Condition Project is unique in at least two ways; 1) it focuses on both the majority and the minority populations including the under- served and under-represented, and 2) it is community-based, thus, directly involving community members in the research--as participants rather than just research subjects.
The Human Condition Project has been implemented in several phases over its life- time. The initial research and community-based activities of the Project required more than three full years to accomplish. Monitoring of Project results and assessment of unmet social needs will continue into the foreseeable future.
The present research, Monitoring The Human Condition Study - 2009 has collected more than 338,000 pieces of primary data about the social conditions of the population of Cape Cod. Study focus topics have centered around four areas;
• Basic Needs such as; o employment, o health and healthcare, o housing, income security/cost of living, o public safety and violence, and o transportation
• Children and Families, • Life Skills/Life-Long Learning, and • Quality of Life.
MTHC-2009 – Rev. A 4/3/09 1-3
The publication of this Annual Report of Findings - 2009 represents a new milestone in a continuing annual research effort (data collection), an effort to measure the human environment, and thus understand the human condition of the population of Cape Cod. While marking the end of the annual “discovery” phase of The Human Condition Project, at the same time it marks the beginning of the all-important community discussion and community action phase of the Project. It is in this phase of the Project where actual change and improvement will come about.
Overall project management and financial administration of the Project is the respon- sibility of the Barnstable County Department of Human Services. The Project requires the efforts of Barnstable County employees, consultants, and community volunteers.

MTHC-2009 – Rev. A 4/3/09 1-4
MTHC-2009 – Rev. A 4/3/09 2-1
Section 2. The Human Environment of Cape Cod “Human Environment” vs. “Human Condition”
Each of us individually and collectively as a society—or more simply as a community, find ourselves impacted by three environments; the natural environment, the economic/-business environment, and the human environment. Ultimately, the long-term future of Cape Cod depends upon the maintenance of an appropriate balance between the forces acting in these three environments. The delicate balance of these three disparate forces is crucial to the long-term sustainability of our community and to our long-term quality of life.
Daily, Cape Codders wrestle with the question, “How many Cape Codders is too many? How much business development can the Cape support? Do we need to, or can we control the development of our natural resources--especially our water supply? What about overpopulation? Pollution? How can we maintain our present “way of life” without despoiling the Cape for future generations? Can Cape Cod be sustained over the long term?
All these questions are intimately intertwined with our “human environment.”
Our “human environment” can be thought of as consisting of twelve elements that directly effect all Cape Cod residents. These elements are:
• Education • Employment • Health • Housing • Income Security/Cost of Living • Leisure/Culture • Participation in Government • Public Assistance • Public Safety • Sustainability • Transportation • Volunteerism
Our “human condition” is simply the impact of our human environment on us individually, on our family, our friends, our neighbors, and all fellow human beings. The sum total of these twelve social elements dictates our “human condition.” The human condition is at once, an individual, a family, a neighbor-hood, a community, and a societal phenomenon. Our human condition is a significant measure of our quality of life.
We each experience our human condition in our own way. Each of us faces a unique set of social realties representing a unique human condition—a situation that can, and often does, differ greatly from person to person, household to household, neighborhood to neighborhood, and from community to community.

MTHC-2009 – Rev. A 4/3/09 2-2
How do we come to understand our human condition—our quality of life? How do we measure it? What are the indicators that tell us whether we are experiencing an improving or declining quality of life?
The people of Barnstable County, acting through our County Commissioners and the County’s Department of Human Services undertook this research—an effort to measure our human condition on an ongoing basis. We citizens acting together as a public/private partnership, have carried out on several occasions, and continue to carry out, this study of ourselves. We continually look at our human environment, and are consider the impact of the various aspects of our human environment on all of our people—all of the permanent, year-round residents of Cape Cod.
This annual Monitoring The Human Condition– 2009 Report of Findings provides the highlights of what we have most recently found—the results of our latest study of our human environment. It concerns itself with the realities of the “human condition” of all residents of this region that we call Cape Cod—the fifteen towns scattered along this fragile, sandy peninsula from Bourne to Provincetown.
Who are we? We are not tourists or visitors to Cape Cod. We are not seasonal home-owners living much of the year in some distant country, state, city, or suburb. We are not business people traveling through the region. We are the people who call Cape Cod our home. Some of us were born here, most of us moved here, but we are those who now live here, work here, raise our families here, and grow old together here. We are the permanent, year-round citizens of this unique peninsula.
Collectively, we “year-rounders” form the infrastructure that makes Cape Cod work year-round. Together, we face a human environment that is quite unique. The Cape is different in a number of respects from even neighboring regions of Massachusetts and certainly differs considerably from most of the rest of the United States. Our pleasant and unique natural environment coupled with a largely tourism-based economic/business environment and a fragile landscape, creates a rather unique human environment—an environment in which we all live and by which we all are impacted. These realities taken together create the collective human condition that we all share.
.
MTHC-2009 – Rev. A 4/3/09 3-1
Section 3. Introduction To The Human Condition Project Research Human Services Needs Assessment:
The Monitoring The Human Condition Study, a component of The Human Condition Project, probes the Cape’s healthcare and human services needs— studying three specific research questions in depth (see Section 4). This research implements a community-based methodology (sometimes called “participatory action research”), wherein residents, human service advocates, service providers, and local professionals are involved in every step of the work. A coordinated series of studies were conducted within the fifteen towns of Cape Cod during 2008.
This research effort has been guided by the Barnstable County Health and Human Services Advisory Council1 consisting of citizen volunteers, members of local charitable organizations, human services advocates and coalition leaders, town and county government officials, and human service providers. Contacted by research staff from the Barnstable County Department of Human Services, members of literally hundreds of Cape Cod households have participated in community forums and in a survey. Residents, both young and old have enthusiastically volunteered their time, expertise, and personal knowledge to build a considerable body of knowledge about the health- care and other human services needs of the permanent, year-round resident population of Cape Cod. The knowledge gained through the amassing of these 338,000 pieces of data about our community will be used throughout 2009-2010 to guide strategies to design, develop, fund, and implement programs and services to alleviate human need and suffering here on Cape Cod. See also Figure 3.1.
The research sample of the Monitoring The Human Condition Study was designed to include all segments of the population of Barnstable County. In addition to the overall population, specific emphasis was placed on sampling Cape Cod’s under-served and under-represented population groups such as the homeless, and linguistic, cultural, ethnic, and racial minorities. Low-income persons, and the “working poor,” a group traditionally difficult to reach through standard survey techniques, were deliberately over-sampled in order to obtain a fair and comprehensive representation. See also Appendix 1.C. Community-Based Research: Community-based research places, “the emphasis on the participation and influence of non-academic researchers in the process of creating knowledge.”2 Barbara Israel and others who have studied the participation of community members in researching unmet public health [and human services] needs and planning responses to meet those needs note that “community participation and influence in research efforts that are beneficial to the communities involved” includes, “the active engagement and influence of community members in all aspects of the research 1 County Ordinance: “A major and specific responsibility of the Barnstable County Health and Human Services Advisory Council, in conjunction with the Barnstable County Department of Human Services, is to assist in the development of a Barnstable County Health and Human Services Plan to prioritize issues for action by the County government.” In order to accomplish this, a current needs assessment, containing up-to-date data, and data that can be measured over time is required. Beginning in 2005, the Council has published an annual report concerning a variety of health and human services needs and issues, with the report coming to the Council in the Spring of each year, and upon which the Council can begin to base its work and recommendations. 2 Israel, B, Schulz, A, Parker, E, Becker, A, (1998). Review of community-based research: Assessing partnership approaches to improve public health, Annual Review Public Health,19, 173-202.

MTHC-2009 – Rev. A 4/3/09 3-2
process.” Further they find that the community-based research approach “is particularly aimed toward working with marginalized communities whose members experience limited access to resources and decision-making processes.”
Community Involvement: The community involvement portion of the Monitoring The Human Condition Study has, and will continue to consist of a community development professional (Community Coordinator) working with residents from all across Cape Cod to accomplish the following:
• Identify resident population groups to involve in the Study • Recruit key members of these population groups to act as spokes- persons and group leaders • Train group spokespersons and group leaders • Recruit survey Field Assistants • Coordinate survey administration • Recruit Community Forum Assistants and participants • Coordinate Community Forum Meetings
Figure 3.1 Overview: Monitoring The Human Condition Study
THE HUMAN CONDITION PROJECT
. . . . Improving The Human Environment on Cape Cod
Monitoring The Human Condition Study
Cape Cod
Community
Survey - 2008
U.S. Census Bureau: Census 2000 Statistics plus the latest American Community Survey – 2007 Updates
Publication: Annual Report of Findings – 2009
(April 2009)
MTHC-2009 – Rev. A 4/3/09 3-3
Primary Research:
The primary research component of the Monitoring The Human Condition Study includes two main elements: a survey of residents and a series of community forums. Survey Research: The Cape Cod Community Survey – 2008 was distributed to a random sample of Cape Cod households in the fall of 2008. Approximately one in every 40 households on Cape Cod was randomly invited to participate by filling out a survey questionnaire. The Cape Cod Community Survey – 2008 questionnaire was mailed to 1,349 indiv- iuals and almost 1,100 hard-to-reach households (homeless, “working poor,” racial/-cultural/ethnic/linguistic minorities) were invited to participate in the “in-the-field’ sample. Over eight hundred-forty questionnaires were completed and returned. All told, one in every 116 households on Cape Cod participated. The households surveyed contain nearly 2,300 individuals, including nearly four hundred young people age 17 or younger. Through the Cape Cod Community Survey – 2008, an excellent sample of the Cape’s year-round, resident population was “interviewed.” Scores of volunteers helped distribute survey questionnaires in the community, assuring that surveys reached even the most “hard-to-reach” individuals in our homeless shelters, food pantries, on-the-street, and in churches. This ten-page questionnaire (sample in Appendix 1.A) collected information about the make-up of each household (presence of children, seniors, extended family, income, disabilities, etc.) as well as details of needs for a range of human services in the areas of; housing, transportation, children’s’ services, public safety, employment, and education. Through this data collection effort, we have been able to build a con- temporary view of the needs of our resident population. Appendix 1.B and Appendix 1.C provide detail of Survey Methodology and the Survey Sample, respectively. Community Forums The community forum portion of the primary research consisted of a series of facilitated consumer group sessions held in geographically dispersed locations across Cape Cod. The community forum findings aided identification of current needs of residents and significant barriers to accessing human services on Cape Cod--providing qualitative details of needs and illuminating issues and concepts to be explored further through the survey research. Secondary Research: Secondary Data Collection: Socio-demographic information characterizing the human environment on Cape Cod has been collected and is presented in Section 5.1 of this Report. These facts and figures are based upon the newly-introduced U.S. Census Bureau American Community Survey – 2007 (ACS) sampling research. They serve to update Census 2000 statistics and include the latest Census Bureau estimates.
Research Findings Report:
This comprehensive Monitoring The Human Condition: Annual Report of Findings - 2009 (MTHC) publication presents significant findings from this current research. Similarly, findings will be presented to the citizenry through a series of public meetings, community feedback sessions, on CD-ROM, and via an Internet web site.
The MTHC-2009 Report consists of a topic-by-topic summary narrative divided into five sec-tions, along with an Appendix containing in-depth details of research findings. This Report is fully indexed alphabetically and by topic category and includes a detailed Glossary of Terms.
MTHC-2009 – Rev. A 4/3/09 3-4
Research Implementation:
Data Analysis: Analysis of the quantitative and qualitative responses from the comm.- unity forums and the Cape Cod Community Survey – 2008 has been accomplished by the Barnstable County Department of Human Services Data Analyst in conjunction with qualified statistical analysis and survey research consultants. Key findings from that analysis are included in this Annual Report of Findings. Research Timetable: The research and community-based activities of the Monitoring the Human Condition Study are on going. Current research began in September 2008 and will be completed with the publication of this Annual Report of Findings and the public presentation of key findings. Monitoring The Human Condition on Cape Cod studies will continue on an annual basis. Research Staffing: The research phase of the current Monitoring the Human Condition Study has required the efforts of Barnstable County employees, consultants, and scores of community volunteers.
Barnstable County Staff: The part-time efforts of two staff members of the Barnstable County Department of Human Services have been required, as follows:
• Project Manager (administration and funding) • Principal Investigator (research)
Consultants: In addition to the Barnstable County employees, Ph.D.-level professional consultants have been contracted to accomplish professional oversight of the research work, as follows:
• Statistical Consultant (quantitative research) • Survey Research Consultant (survey strategy, research and instrument design)
Community Volunteers: In addition to the Barnstable County employees and consultants, a considerable number of community volunteers have participated during the course of the research phase of the Study. Volunteers have been utilized to fill the following Study positions:
• Health and Human Services Advisory Council Members, • Community Forum Assistants to assist in conduct of community forums. • Field Assistants for survey administration among those population groups that could not be reached by the mail survey.
MTHC-2009 – Rev. A 4/3/09 4-1
Section 4.0 Research Questions The Monitoring Human Condition Study research addresses three fundamental questions:
1. What Are the Human Needs?
2. How Serious Are The Human Needs?
3. Who Are The Needy? What Are The Human Needs? Human services encompass an extremely broad range of categories, ranging from public services like education, healthcare, mass transit, public and affordable housing, public safety, and financial assistance (Medicaid, Food Stamps, TAFDC), just to name a few. Human services are not simple “welfare” and other forms of public assistance. Human services touch all citizens in one way or another and to a greater or lesser degree depending upon our lifestyle, personal resources, our age, our level of health or disability, and degree of need. Individual need for human services varies from person to person and changes as we go through life. Human services are a part of everyone’s life.
How Serious Are The Human Needs? We are fortunate in that most of our human needs are well taken care of here on Cape Cod. Cape Cod is home to some of the finest medical practitioners and healthcare facilities. Myriad services for senior and elder citizens through our Councils on Aging are legendary. Specialized help in the areas of mental health, alcoholism and drug abuse counseling are well established. But, as with any system of services, there is always room for improvement. Populations grow and diversify, age distributions change, children are born, families move on and off the Cape . . . . . .the bottom line, needs do change.
Who Are The Needy? We are all needy to some degree. Fortunately for most of us, our needs are mostly met through our own resources (education, work, income, personal and family strengths and resources). Unfortunately, some individuals’ personal strengths and resources are limited, and from time to time they are unable to completely provide for all of their individual and family needs. It is important on an on-going basis to identify those among us who are in serious need of our community resources and support services. The priority in services must be to provide for the most needy among us.
This Annual Report of Findings Report – 2009 presents the highlights from studies aimed at answering these three key questions.

MTHC-2009 – Rev. A 4/3/09 4-2

MTHC-2009 – Rev. A 4/3/09 5 - 1
Section 5.1 Socio-Demographic Profile of Barnstable County, MA
Latest Updates To Census 2000 Statistics:
Since the last official Census in early 2000, the Cape’s population has grown some, peaked, and then decreased some. How much, we don’t exactly know. However, the U.S. Census Bureau has ventured a few “official” estimates based upon their new American Community Survey - 2007 sample. Latest Barnstable County Total Population Estimate: (per U.S. Census Bureau)
2007 Barnstable County Total Population Estimate: 222,000 living in an estimated 98,000 households.
If true, this would mean more than a two percent decrease in total population from the 2004 Census Bureau “peak” estimate of 226,959. Although TOTAL population is estimated to have peaked in 2004, the size of the Cape’s senior/elder (age 55+) population continues to grow rapidly, and is now beginning to take off.
Note 1: These are just estimates based upon a partial (approx. 60%) sample by the US Census Bureau of Barnstable County’s permanent, year-round residents.
Latest Barnstable County Poverty Rate Estimates: (per U.S. Census Bureau)
2007 Barnstable County Poverty Rate Estimates:
Persons age 65+ in poverty 6% Related children ages 0-17 in poverty 6% Families in poverty 3% Female Head of Household Families 11%
Latest Barnstable County Median Household Income Estimate: (per U.S. Census Bureau)
2007 Barnstable County Median Household Income Estimate: $60,015
If true, this would represent a 5.3% increase in median household income ($) in the past ONE year. See Note 1 above.
Latest Barnstable County Total Housing Unit Estimate: (per U.S. Census Bureau)
2007 Barnstable County Total Housing Unit Estimate: 156,000
If true, this would mean about a 0.4 percent increase in the total (occupied and vacant/seasonal) number of housing units in the past one year. See Note 1 above.
Housing Unit (Building) Permits Issued in Barnstable County: In 2007, 679 residential building permits were issued in Barnstable County. Over eighty percent (83%) of these were for single-family dwellings. Multi- family units numbered just 139. Therefore, a total of 818 dwelling units were authorized. The average number of residential dwelling units permitted over the past ten years was 1,503/year. (Data Source: US Census Bureau)
Note: These building permit data are not comparable with such data shown in prior Monitoring The Human Condition on Cape Cod Study Reports.

MTHC-2009 – Rev. A 4/3/09 5 - 2
MTHC-2009 – Rev. A 4/3/09 5 - 3
Official Census 2000 - 2007 Statistics: Population and Housing Profile: Barnstable County, Massachusetts See U.S. Census Bureau notes at the end of this Section. POPULATION OF Barnstable County: Estimate for Year 2007 is 222,000 Persons
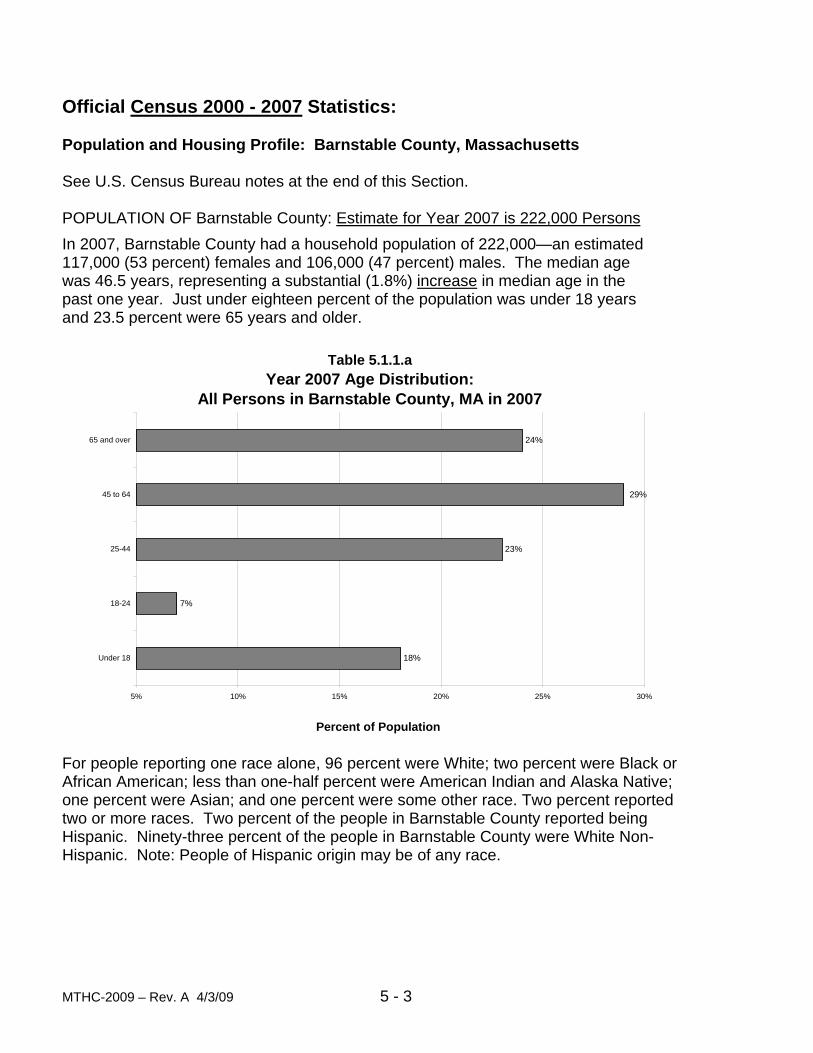
In 2007, Barnstable County had a household population of 222,000—an estimated 117,000 (53 percent) females and 106,000 (47 percent) males. The median age was 46.5 years, representing a substantial (1.8%) increase in median age in the past one year. Just under eighteen percent of the population was under 18 years and 23.5 percent were 65 years and older.
For people reporting one race alone, 96 percent were White; two percent were Black or African American; less than one-half percent were American Indian and Alaska Native; one percent were Asian; and one percent were some other race. Two percent reported two or more races. Two percent of the people in Barnstable County reported being Hispanic. Ninety-three percent of the people in Barnstable County were White Non- Hispanic. Note: People of Hispanic origin may be of any race.
Table 5.1.1.aYear 2007 Age Distribution:
All Persons in Barnstable County, MA in 2007
18%
7%
23%
24%
29%
5% 10% 15% 20% 25% 30%
Under 18
18-24
25-44
45 to 64
65 and over
Percent of Population
MTHC-2009 – Rev. A 4/3/09 5 - 4
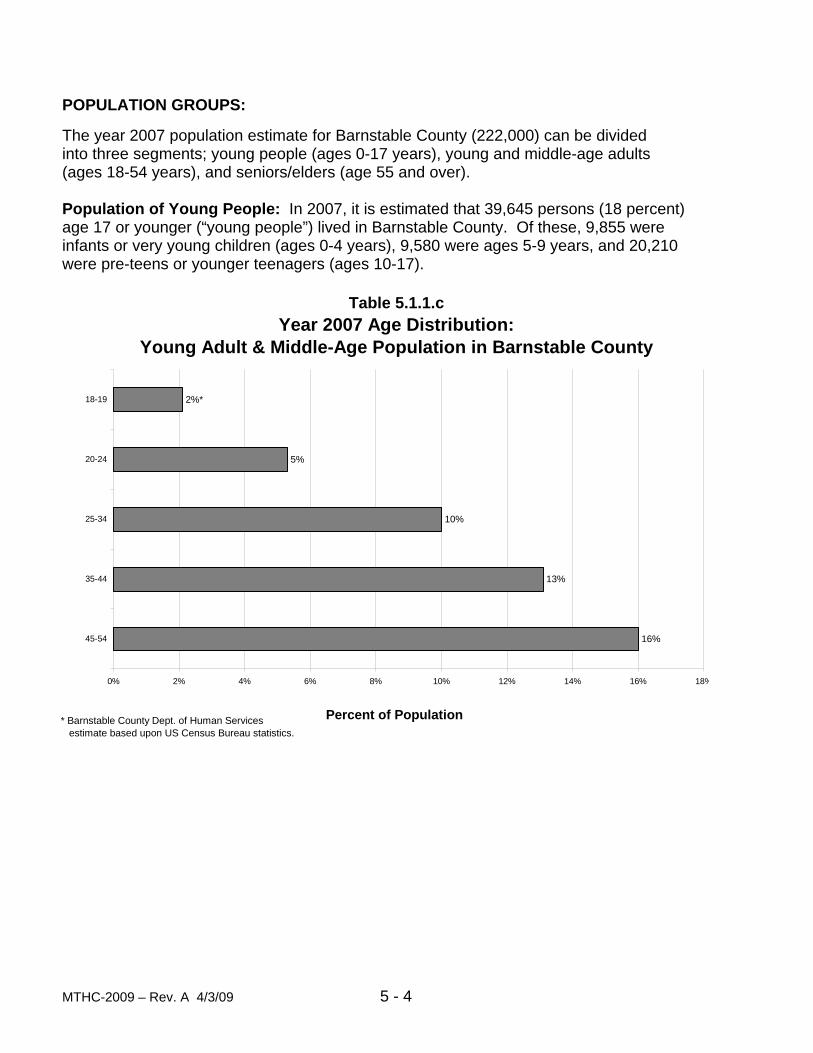
POPULATION GROUPS: The year 2007 population estimate for Barnstable County (222,000) can be divided into three segments; young people (ages 0-17 years), young and middle-age adults (ages 18-54 years), and seniors/elders (age 55 and over). Population of Young People: In 2007, it is estimated that 39,645 persons (18 percent) age 17 or younger (“young people”) lived in Barnstable County. Of these, 9,855 were infants or very young children (ages 0-4 years), 9,580 were ages 5-9 years, and 20,210 were pre-teens or younger teenagers (ages 10-17).
Table 5.1.1.cYear 2007 Age Distribution:
Young Adult & Middle-Age Population in Barnstable County
16%
13%
10%
5%
2%*
0% 2% 4% 6% 8% 10% 12% 14% 16% 18%
45-54
35-44
25-34
20-24
18-19
Percent of Population* Barnstable County Dept. of Human Services estimate based upon US Census Bureau statistics.
MTHC-2009 – Rev. A 4/3/09 5 - 5
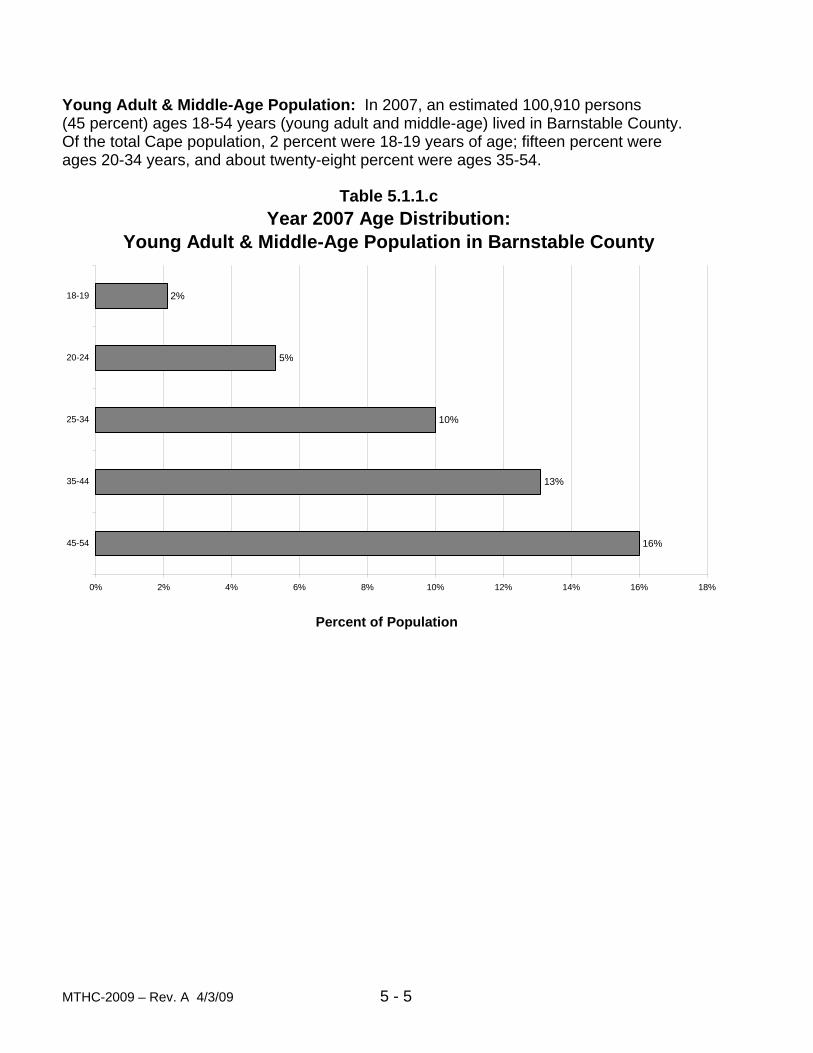
Young Adult & Middle-Age Population: In 2007, an estimated 100,910 persons (45 percent) ages 18-54 years (young adult and middle-age) lived in Barnstable County. Of the total Cape population, 2 percent were 18-19 years of age; fifteen percent were ages 20-34 years, and about twenty-eight percent were ages 35-54.
Table 5.1.1.cYear 2007 Age Distribution:
Young Adult & Middle-Age Population in Barnstable County
16%
13%
10%
5%
2%
0% 2% 4% 6% 8% 10% 12% 14% 16% 18%
45-54
35-44
25-34
20-24
18-19
Percent of Population
MTHC-2009 – Rev. A 4/3/09 5 - 6
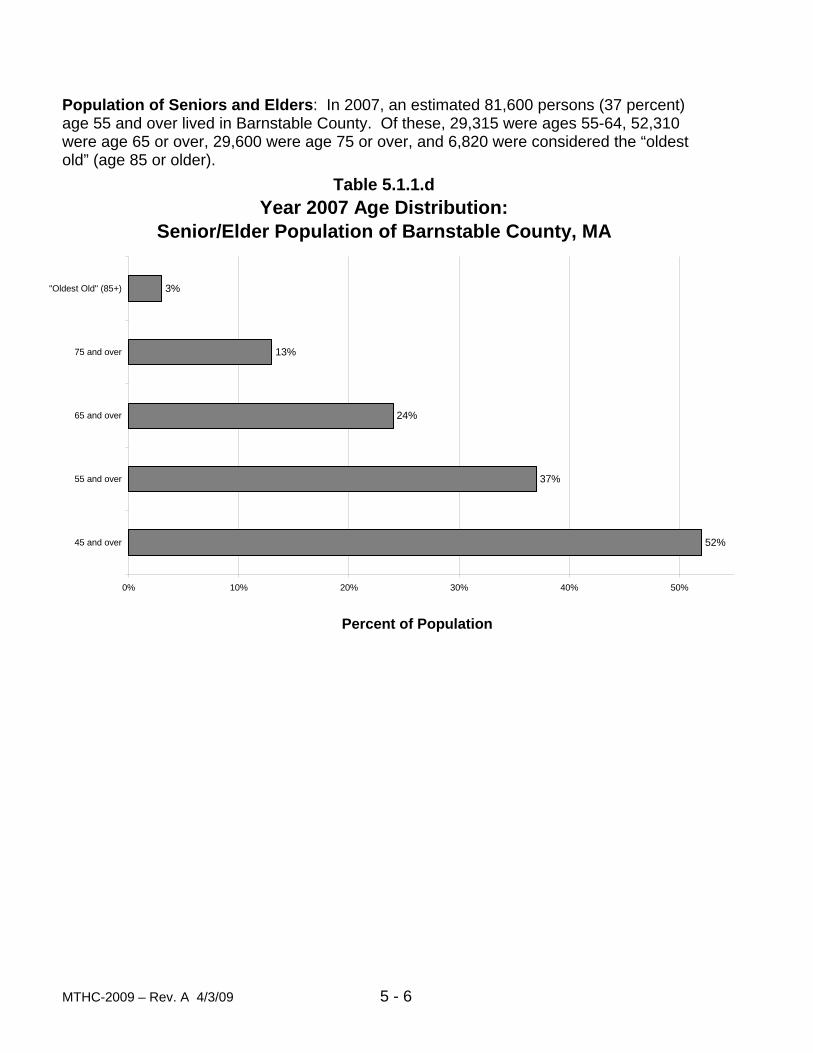
Population of Seniors and Elders: In 2007, an estimated 81,600 persons (37 percent) age 55 and over lived in Barnstable County. Of these, 29,315 were ages 55-64, 52,310 were age 65 or over, 29,600 were age 75 or over, and 6,820 were considered the “oldest old” (age 85 or older).
Table 5.1.1.dYear 2007 Age Distribution:
Senior/Elder Population of Barnstable County, MA
52%
37%
24%
13%
3%
0% 10% 20% 30% 40% 50%
45 and over
55 and over
65 and over
75 and over
"Oldest Old" (85+)
Percent of Population
MTHC-2009 – Rev. A 4/3/09 5 - 7
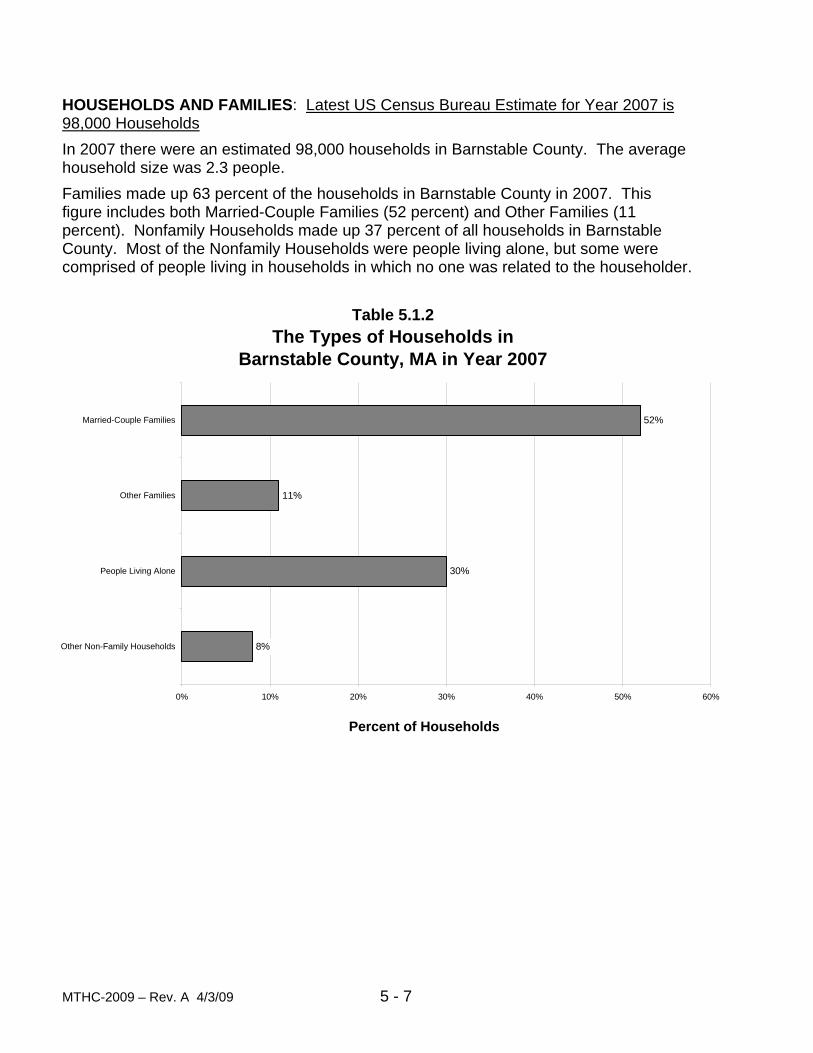
HOUSEHOLDS AND FAMILIES: Latest US Census Bureau Estimate for Year 2007 is 98,000 Households
In 2007 there were an estimated 98,000 households in Barnstable County. The average household size was 2.3 people.
Families made up 63 percent of the households in Barnstable County in 2007. This figure includes both Married-Couple Families (52 percent) and Other Families (11 percent). Nonfamily Households made up 37 percent of all households in Barnstable County. Most of the Nonfamily Households were people living alone, but some were comprised of people living in households in which no one was related to the householder.
Table 5.1.2The Types of Households in
Barnstable County, MA in Year 2007
8%
30%
11%
52%
0% 10% 20% 30% 40% 50% 60%
Other Non-Family Households
People Living Alone
Other Families
Married-Couple Families
Percent of Households
MTHC-2009 – Rev. A 4/3/09 5 - 8
NATIVITY AND LANGUAGE:
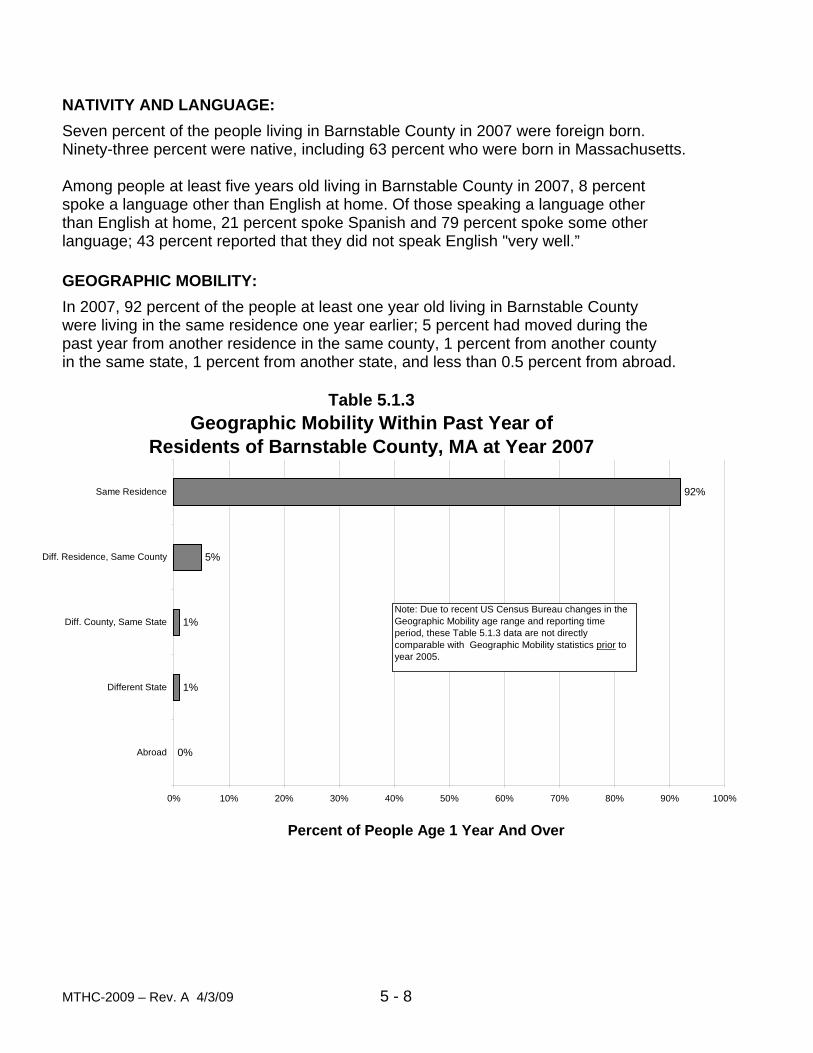
Seven percent of the people living in Barnstable County in 2007 were foreign born. Ninety-three percent were native, including 63 percent who were born in Massachusetts. Among people at least five years old living in Barnstable County in 2007, 8 percent spoke a language other than English at home. Of those speaking a language other than English at home, 21 percent spoke Spanish and 79 percent spoke some other language; 43 percent reported that they did not speak English "very well.” GEOGRAPHIC MOBILITY:
In 2007, 92 percent of the people at least one year old living in Barnstable County were living in the same residence one year earlier; 5 percent had moved during the past year from another residence in the same county, 1 percent from another county in the same state, 1 percent from another state, and less than 0.5 percent from abroad.
Table 5.1.3Geographic Mobility Within Past Year of
Residents of Barnstable County, MA at Year 2007
0%
1%
1%
5%
92%
0% 10% 20% 30% 40% 50% 60% 70% 80% 90% 100%
Abroad
Different State
Diff. County, Same State
Diff. Residence, Same County
Same Residence
Percent of People Age 1 Year And Over
Note: Due to recent US Census Bureau changes in the Geographic Mobility age range and reporting time period, these Table 5.1.3 data are not directly comparable with Geographic Mobility statistics prior to year 2005.
MTHC-2009 – Rev. A 4/3/09 5 - 9
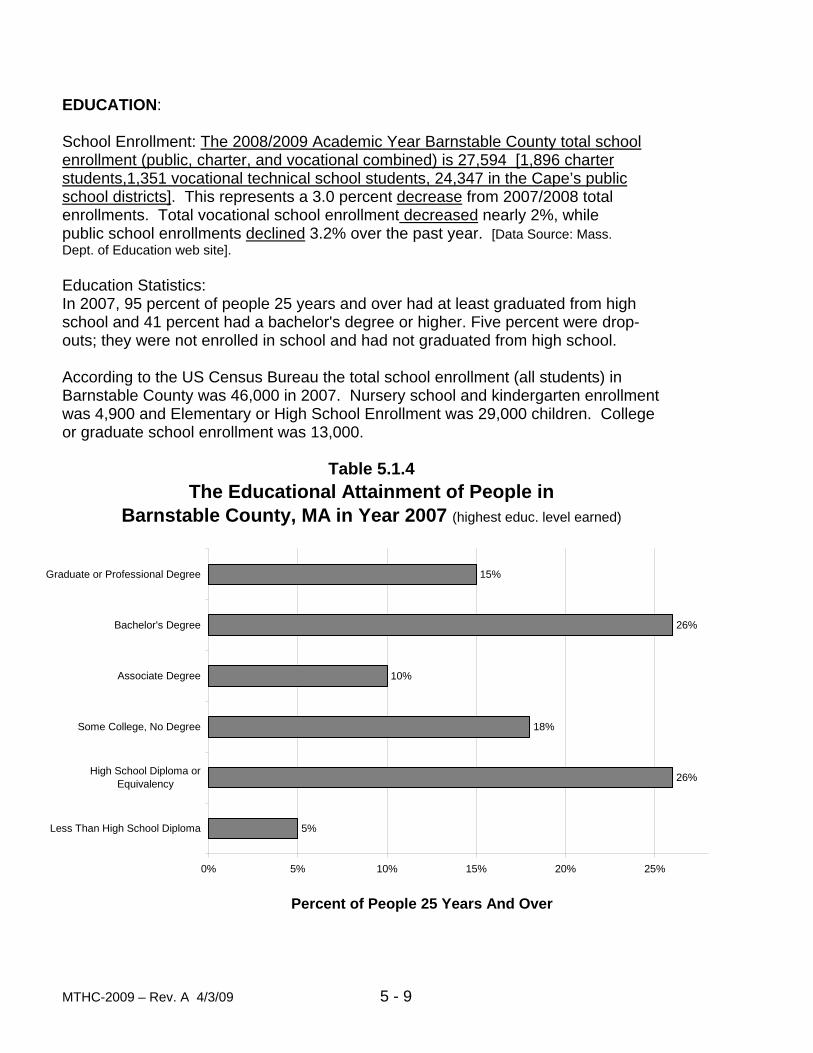
EDUCATION: School Enrollment: The 2008/2009 Academic Year Barnstable County total school enrollment (public, charter, and vocational combined) is 27,594 [1,896 charter students,1,351 vocational technical school students, 24,347 in the Cape’s public school districts]. This represents a 3.0 percent decrease from 2007/2008 total enrollments. Total vocational school enrollment decreased nearly 2%, while public school enrollments declined 3.2% over the past year. [Data Source: Mass. Dept. of Education web site]. Education Statistics:
In 2007, 95 percent of people 25 years and over had at least graduated from high school and 41 percent had a bachelor's degree or higher. Five percent were drop- outs; they were not enrolled in school and had not graduated from high school. According to the US Census Bureau the total school enrollment (all students) in Barnstable County was 46,000 in 2007. Nursery school and kindergarten enrollment was 4,900 and Elementary or High School Enrollment was 29,000 children. College or graduate school enrollment was 13,000.
Table 5.1.4The Educational Attainment of People in
Barnstable County, MA in Year 2007 (highest educ. level earned)
5%
26%
18%
10%
26%
15%
0% 5% 10% 15% 20% 25%
Less Than High School Diploma
High School Diploma orEquivalency
Some College, No Degree
Associate Degree
Bachelor's Degree
Graduate or Professional Degree
Percent of People 25 Years And Over
MTHC-2009 – Rev. A 4/3/09 5 - 10
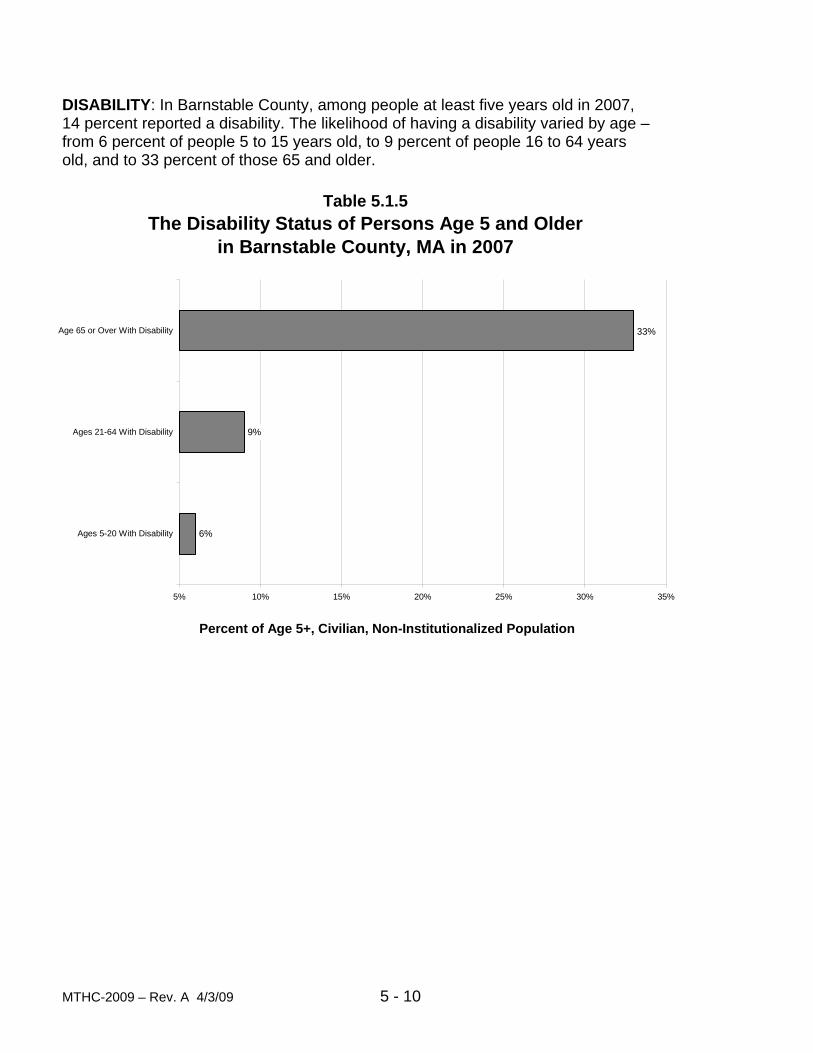
DISABILITY: In Barnstable County, among people at least five years old in 2007, 14 percent reported a disability. The likelihood of having a disability varied by age – from 6 percent of people 5 to 15 years old, to 9 percent of people 16 to 64 years old, and to 33 percent of those 65 and older.
Table 5.1.5The Disability Status of Persons Age 5 and Older
in Barnstable County, MA in 2007
6%
9%
33%
5% 10% 15% 20% 25% 30% 35%
Ages 5-20 With Disability
Ages 21-64 With Disability
Age 65 or Over With Disability
Percent of Age 5+, Civilian, Non-Institutionalized Population
MTHC-2009 – Rev. A 4/3/09 5 - 11
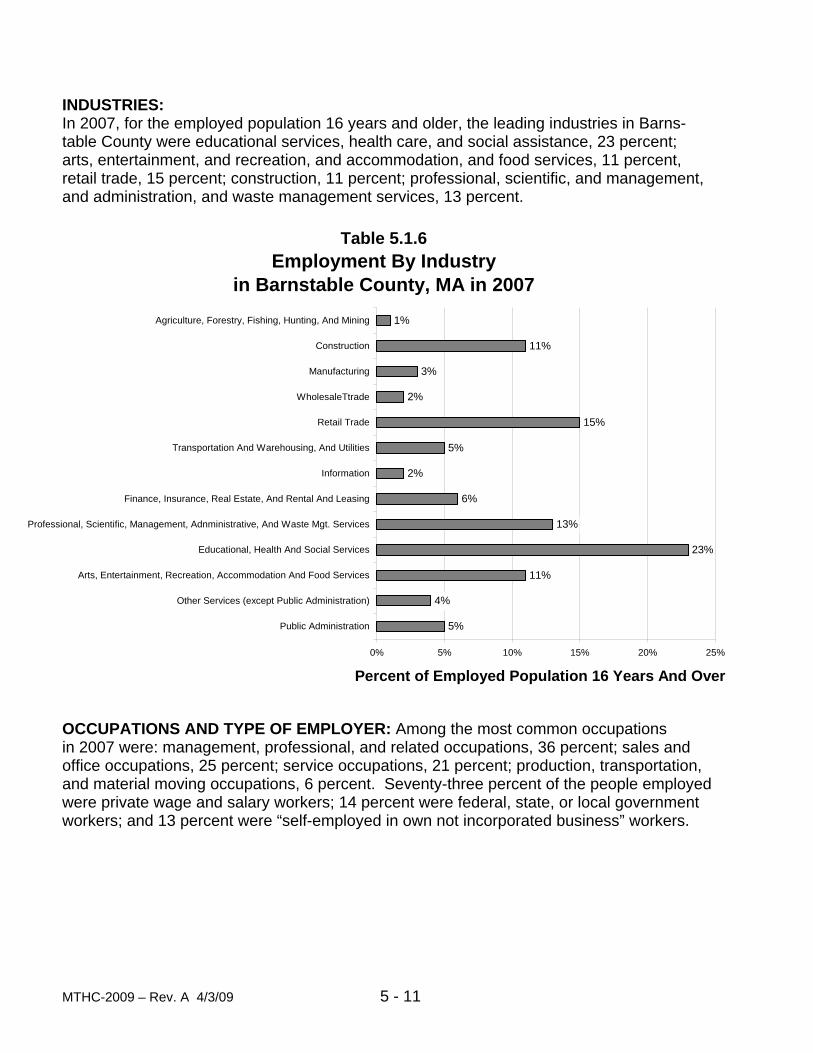
INDUSTRIES:
In 2007, for the employed population 16 years and older, the leading industries in Barns- table County were educational services, health care, and social assistance, 23 percent; arts, entertainment, and recreation, and accommodation, and food services, 11 percent, retail trade, 15 percent; construction, 11 percent; professional, scientific, and management, and administration, and waste management services, 13 percent. OCCUPATIONS AND TYPE OF EMPLOYER: Among the most common occupations in 2007 were: management, professional, and related occupations, 36 percent; sales and office occupations, 25 percent; service occupations, 21 percent; production, transportation, and material moving occupations, 6 percent. Seventy-three percent of the people employed were private wage and salary workers; 14 percent were federal, state, or local government workers; and 13 percent were “self-employed in own not incorporated business” workers.
Table 5.1.6 Employment By Industry
in Barnstable County, MA in 2007
5%
4%
11%
23%
13%
6%
2%
5%
15%
2%
3%
11%
1%
0% 5% 10% 15% 20% 25%
Public Administration
Other Services (except Public Administration)
Arts, Entertainment, Recreation, Accommodation And Food Services
Educational, Health And Social Services
Professional, Scientific, Management, Adnministrative, And Waste Mgt. Services
Finance, Insurance, Real Estate, And Rental And Leasing
Information
Transportation And Warehousing, And Utilities
Retail Trade
WholesaleTtrade
Manufacturing
Construction
Agriculture, Forestry, Fishing, Hunting, And Mining
Percent of Employed Population 16 Years And Over
MTHC-2009 – Rev. A 4/3/09 5 - 12
TRAVEL TO WORK:
Eighty-two percent of Barnstable County workers drove to work alone in 2007, 8 percent carpooled, 2 percent took public transportation, and 3 percent used other means. The remaining 5 percent worked at home. Among those who commuted to work, it took them on average 23.7 minutes to get to work. INCOME: Latest Median Household Income Estimate For Year 2007 is $60,015.
In 2007, the median income of households in Barnstable County was estimated to be $60,015. Seventy-two percent of the households received earnings and 27 percent received retirement income other than Social Security. Forty percent of the house- holds received Social Security. The average Social Security income was $16,732. These income sources are not mutually exclusive; that is, some households received income from more than one source. POVERTY AND PARTICIPATION IN GOVERNMENT PROGRAMS:
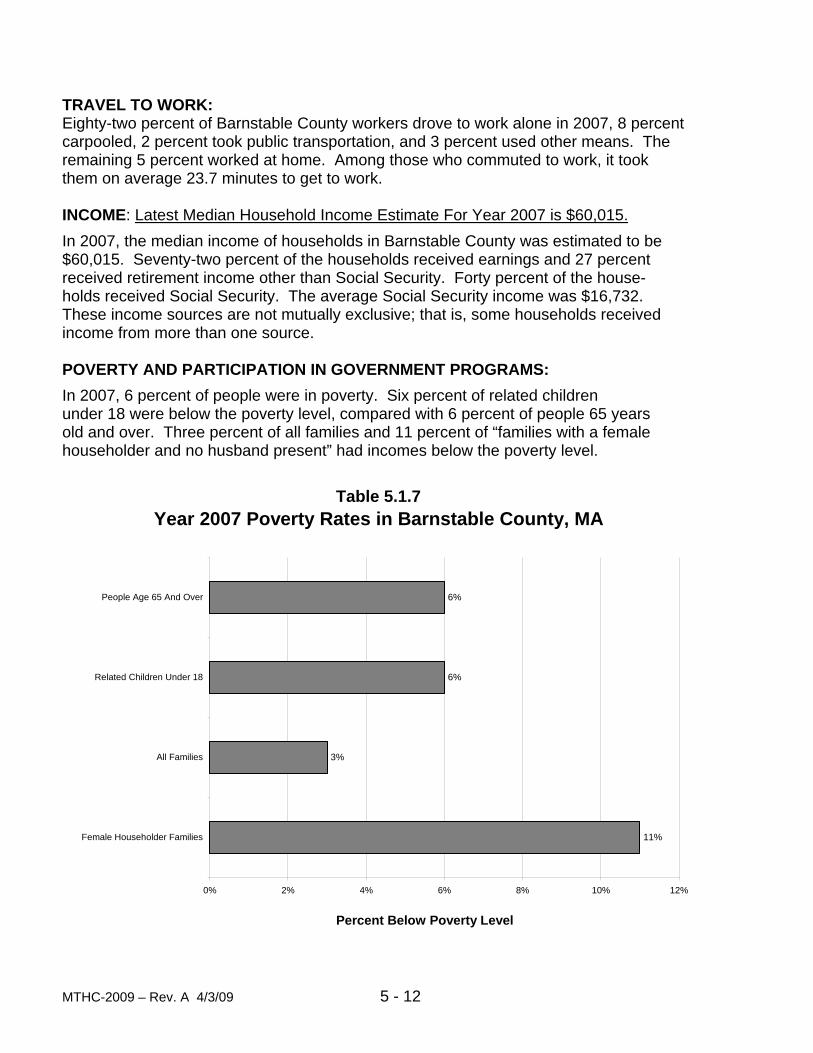
In 2007, 6 percent of people were in poverty. Six percent of related children under 18 were below the poverty level, compared with 6 percent of people 65 years old and over. Three percent of all families and 11 percent of “families with a female householder and no husband present” had incomes below the poverty level.
Table 5.1.7Year 2007 Poverty Rates in Barnstable County, MA
11%
3%
6%
6%
0% 2% 4% 6% 8% 10% 12%
Female Householder Families
All Families
Related Children Under 18
People Age 65 And Over
Percent Below Poverty Level
MTHC-2009 – Rev. A 4/3/09 5 - 13
HOUSING CHARACTERISTICS:
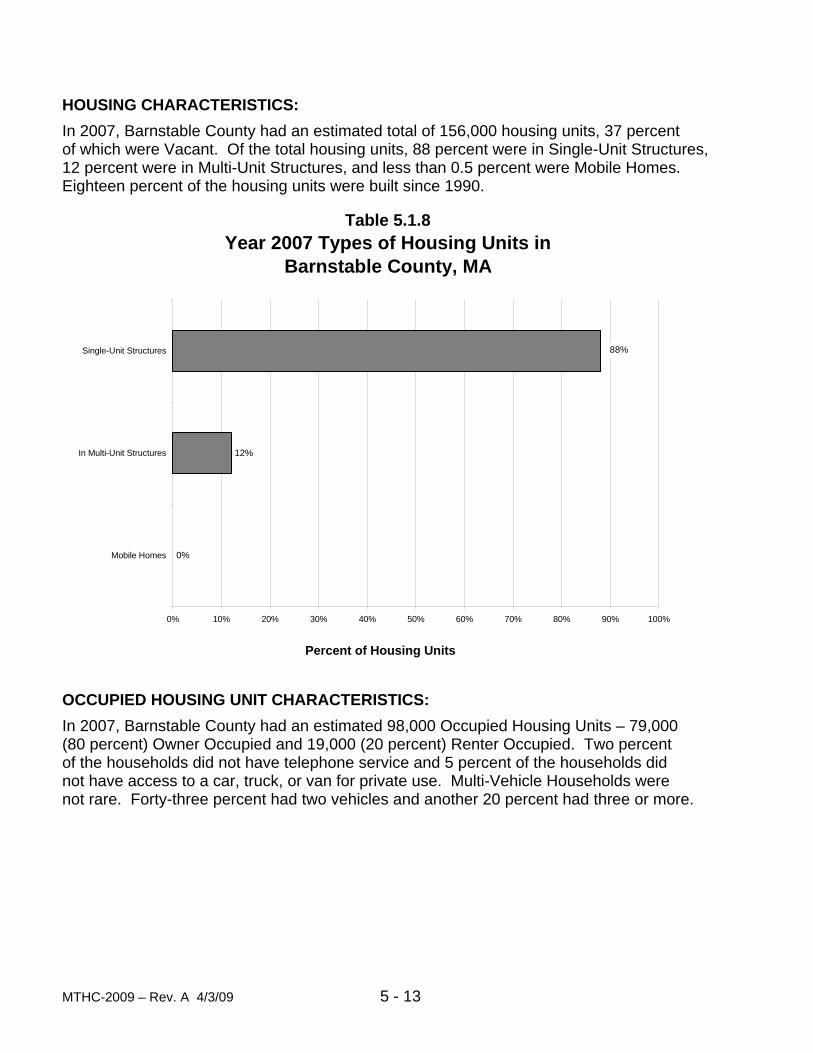
In 2007, Barnstable County had an estimated total of 156,000 housing units, 37 percent of which were Vacant. Of the total housing units, 88 percent were in Single-Unit Structures, 12 percent were in Multi-Unit Structures, and less than 0.5 percent were Mobile Homes. Eighteen percent of the housing units were built since 1990. OCCUPIED HOUSING UNIT CHARACTERISTICS:
In 2007, Barnstable County had an estimated 98,000 Occupied Housing Units – 79,000 (80 percent) Owner Occupied and 19,000 (20 percent) Renter Occupied. Two percent of the households did not have telephone service and 5 percent of the households did not have access to a car, truck, or van for private use. Multi-Vehicle Households were not rare. Forty-three percent had two vehicles and another 20 percent had three or more.
Table 5.1.8Year 2007 Types of Housing Units in
Barnstable County, MA
0%
12%
88%
0% 10% 20% 30% 40% 50% 60% 70% 80% 90% 100%
Mobile Homes
In Multi-Unit Structures
Single-Unit Structures
Percent of Housing Units
MTHC-2009 – Rev. A 4/3/09 5 - 14
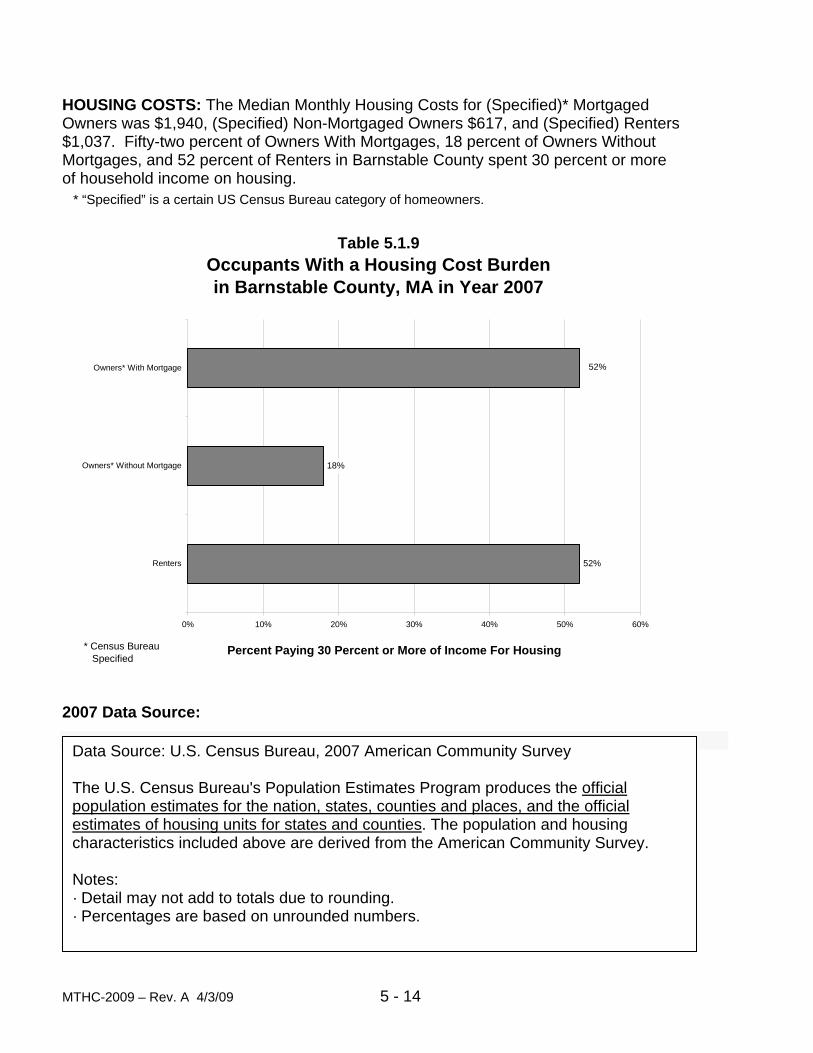
HOUSING COSTS: The Median Monthly Housing Costs for (Specified)* Mortgaged Owners was $1,940, (Specified) Non-Mortgaged Owners $617, and (Specified) Renters $1,037. Fifty-two percent of Owners With Mortgages, 18 percent of Owners Without Mortgages, and 52 percent of Renters in Barnstable County spent 30 percent or more of household income on housing.
* “Specified” is a certain US Census Bureau category of homeowners. 2007 Data Source:
Data Source: U.S. Census Bureau, 2007 American Community Survey The U.S. Census Bureau's Population Estimates Program produces the official population estimates for the nation, states, counties and places, and the official estimates of housing units for states and counties. The population and housing characteristics included above are derived from the American Community Survey. Notes: · Detail may not add to totals due to rounding. · Percentages are based on unrounded numbers.
Table 5.1.9Occupants With a Housing Cost Burdenin Barnstable County, MA in Year 2007
52%
18%
52%
0% 10% 20% 30% 40% 50% 60%
Renters
Owners* Without Mortgage
Owners* With Mortgage
Percent Paying 30 Percent or More of Income For Housing* Census Bureau Specified

MTHC-2009 – Rev. A 4/3/09 5 - 15
U. S. CENSUS BUREAU, CENSUS 2000 NOTES:
The population estimates in this profile are limited to the household population and exclude the population living in institutions, college dormitories, and other group quarters.
The U.S. Census Bureau notes that in a narrative profile such as this, if one sample estimate is larger than another, it does not necessarily mean that the same holds for their true values for the entire population. These estimates are derived from a sample of housing units and measure the true values with a degree of uncertainty. In the tabular profiles this uncertainty is represented by the 90 percent confidence interval given for each estimate. For further information on confidence intervals see the U.S. Census Bureau Accuracy of the Data document.
Further, the Bureau urges caution when comparing data by race for years before 1999 with those for 2000 and beyond due to the Census Bureau's implementation of the October 1997 revised standards for data on race and ethnicity. These data allow respondents to report one or more races and there are seven (American Indian and Alaska Native, Asian, Black or African American, Native Hawaiian and Other Pacific Islander, White, Some other race, and Two or more races) instead of five racial tabulation categories. The Two or more races category includes all respondents who reported more than one race. See the [U.S. Census Bureau] methodology section for more details regarding these changes.
Finally, the U.S. Census Bureau notes that caution should be used when com- paring population numbers by age, race, and sex for 2000 with all earlier years. The numbers for 2000 have been weighted to be generally consistent with Census 2000 counts.
Detail may not add to totals due to rounding. Percentages are based on unrounded numbers
For information on confidentiality protection, sampling error, nonsampling error, and definitions relating to Census 2000 statistics and other U.S. Census Bureau data, go to the American Community Survey web site www.census.gov/acs/www/ and click on Advanced Methodology.
Sources: U.S. Census Bureau, Census 2000 and American Community Survey - 2006
Formatted by Barnstable County, MA
Department of Human Services Information Services Section
Data Analyst
Note: A glossary of Census 2000 Terminology is provided in Appendix 4 of this Report.

MTHC-2009 – Rev. A 4/3/09 5 - 16
MTHC-2009 – Rev. A 4/3/9 5-17
Section 5. Research Findings
2. Description of Human Needs of Cape Codders
Household Issues
As a part of the Cape Cod Community Survey – 2008, conducted in Nov.-Dec. 2008, res- pondents were asked to detail the types of issues that may have recently been a problem in their own household. Respondents chose topics from a list of twenty-six potential problems that they or members of their household might have encountered during the previous twelve months. Further, they were asked to estimate, on a 3-point scale, how serious each of those issues was in their household. This way, potential issues affecting Cape households have been determined and ranked as to degree of seriousness. From these overall rankings, a “picture” of the most serious, and least serious issues was revealed, at the household level, at the town level, and at the County level. Knowing which issues are the most serious, where they exist, and for whom they have been a problem, will aid human service planners, program funders, legislative leaders, and other policy advocates to develop, adapt, and lobby for human services to best satisfy the unmet needs of Cape Codders.
Many respondents from surveyed households reported having had such problems. The most serious issues are indicated in Figures 5.3.1 and 5.3.3. For a complete ranked list of Household Issues responses see Appendix 2.A. A sample copy of the survey question- naire showing potential household-level issues is provided in Appendix 1.A
List of Potential Household Issues (see complete survey questionnaire in Appendix 1.A)
Type of Problem
• Adult substance abuse (alcohol, drugs, etc.) • A lot of depression in the household • Children or teenagers experiencing behavioral or emotional problems • Discrimination (due to HIV, AIDS, TB, etc.) • Discrimination (due to race, age, language, sexual identity/orientation, etc.) • Experiencing an alcohol and/or drug problem • Experiencing physical conflict in the household • Having a lot of anxiety or stress in household • Immigration status or visa dispute • Inadequate opportunities to learn new skills or for advancement at work • Not able to afford nutritious food • Not able to find appropriate senior (65+) housing • Not always having enough money for food • Not being able to afford legal help • Not being able to afford recreational activities • Not being able to find or afford after-school child care • Not being able to find or afford child day care • Not enough room in your house for all of the people who live there • Not having enough money to pay for housing • Not having enough money to pay doctor, the dentist, or to buy prescription medications • Paying for a mental health counselor • Paying for or getting dental care • Seriously overweight person(s) in household • Underage drinking, smoking or other tobacco use

MTHC-2009 – Rev. A 4/3/9 5-18
Barriers to Assess To Human Services
Cape Cod Community Survey - 2008 respondents were also asked to detail the types of barriers that they or members of their household may have encountered in attempting to access human services here on Cape Cod during the previous twelve months. Further, they were asked to estimate, on a 3-point scale, how serious each of those barriers had been in their household. This way, potential access barriers affecting Cape households have been determined and ranked as to degree of seriousness. From these overall rank- ings the most serious and least serious access barriers have been revealed, at the house- hold level, at the town level, and at the County level. Knowing which access barriers are the most serious, where they exist, and for whom they have caused difficulty, will aid in the development of human services that best satisfy the unmet needs of Cape Codders.
Respondents from surveyed households reported encountering barriers to accessing needed human services. The most serious barriers to human service access are indicated in Figures 5.3.2 and 5.3.4. For a complete ranked list of Service Barrier responses see Appendix 2.A. A copy of the survey questionnaire showing potential services access barriers is provided in Appendix 1.A List of Potential Service Barriers (see complete survey questionnaire in Appendix 1.A)
Type of Difficulty
• Cost of taking time away from work • Could not afford fees or costs for services • Feelings of discrimination • Hours of services were not convenient • Insurance not accepted for services • Lacked handicap access • Lacked information on available services • Lack of information on where to go for services • Lack of transportation • Paying insurance deductible/co-payment • Services located too far away • Services not accepting new patients/clients • Services not in appropriate place or part of town • Unable to take time away from work to go to services
MTHC-2009 – Rev. A 4/3/09 5-19
Section 5. Research Findings
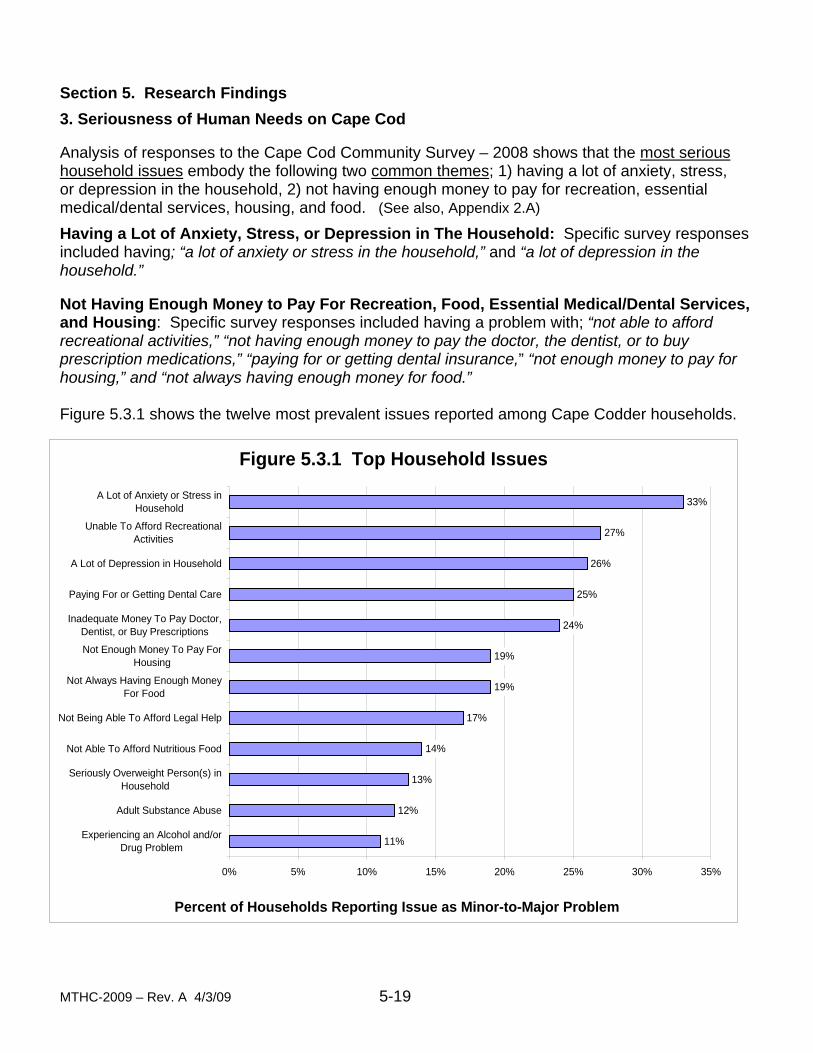
3. Seriousness of Human Needs on Cape Cod Analysis of responses to the Cape Cod Community Survey – 2008 shows that the most serious household issues embody the following two common themes; 1) having a lot of anxiety, stress, or depression in the household, 2) not having enough money to pay for recreation, essential medical/dental services, housing, and food. (See also, Appendix 2.A)
Having a Lot of Anxiety, Stress, or Depression in The Household: Specific survey responses included having; “a lot of anxiety or stress in the household,” and “a lot of depression in the household.”
Not Having Enough Money to Pay For Recreation, Food, Essential Medical/Dental Services, and Housing: Specific survey responses included having a problem with; “not able to afford recreational activities,” “not having enough money to pay the doctor, the dentist, or to buy prescription medications,” “paying for or getting dental insurance,” “not enough money to pay for housing,” and “not always having enough money for food.” Figure 5.3.1 shows the twelve most prevalent issues reported among Cape Codder households. Figure 5.3.1 Top Household Issues
11%
12%
13%
14%
17%
19%
19%
24%
25%
26%
27%
33%
0% 5% 10% 15% 20% 25% 30% 35%
Experiencing an Alcohol and/orDrug Problem
Adult Substance Abuse
Seriously Overweight Person(s) inHousehold
Not Able To Afford Nutritious Food
Not Being Able To Afford Legal Help
Not Always Having Enough MoneyFor Food
Not Enough Money To Pay ForHousing
Inadequate Money To Pay Doctor,Dentist, or Buy Prescriptions
Paying For or Getting Dental Care
A Lot of Depression in Household
Unable To Afford RecreationalActivities
A Lot of Anxiety or Stress inHousehold
Percent of Households Reporting Issue as Minor-to-Major Problem
MTHC-2009 – Rev. A 4/3/09 5-20
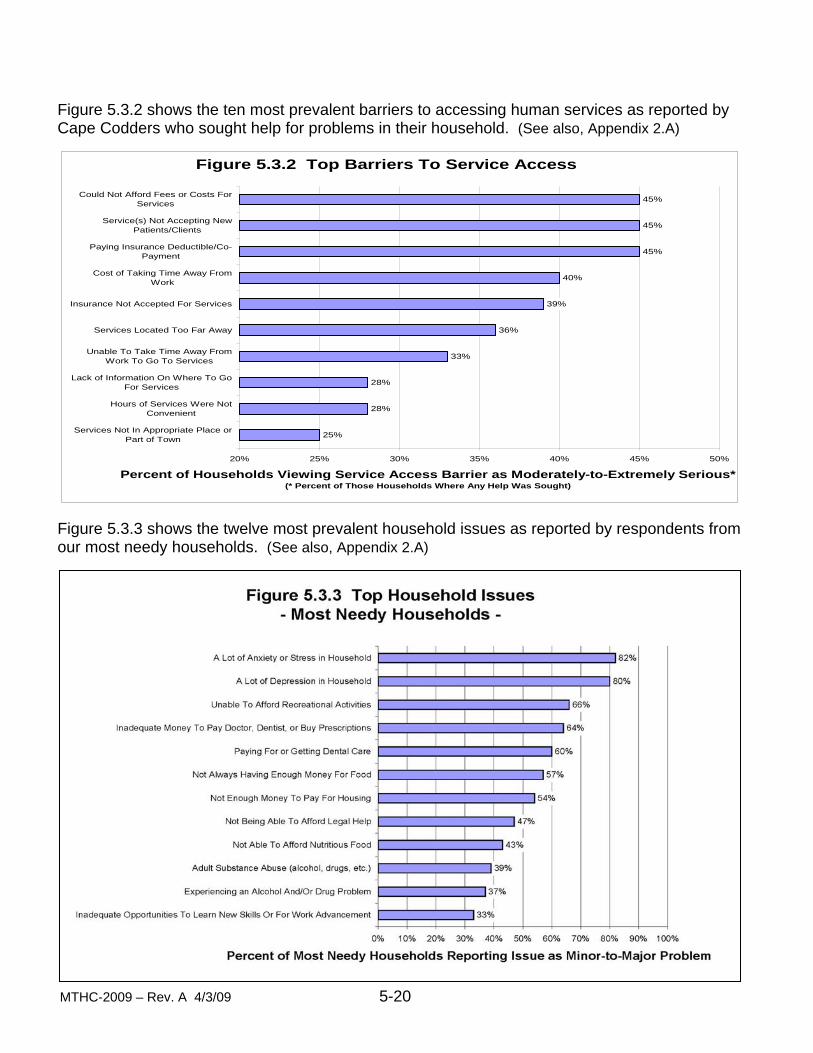
Figure 5.3.2 shows the ten most prevalent barriers to accessing human services as reported by Cape Codders who sought help for problems in their household. (See also, Appendix 2.A)
Figure 5.3.3 shows the twelve most prevalent household issues as reported by respondents from our most needy households. (See also, Appendix 2.A)
Figure 5.3.2 Top Barriers To Service Access
25%
28%
28%
33%
36%
39%
40%
45%
45%
45%
20% 25% 30% 35% 40% 45% 50%
Services Not In Appropriate Place orPart of Town
Hours of Services Were NotConvenient
Lack of Information On Where To GoFor Services
Unable To Take Time Away FromWork To Go To Services
Services Located Too Far Away
Insurance Not Accepted For Services
Cost of Taking Time Away FromWork
Paying Insurance Deductible/Co-Payment
Service(s) Not Accepting NewPatients/Clients
Could Not Afford Fees or Costs ForServices
Percent of Households Viewing Service Access Barrier as Moderately-to-Extremely Serious*(* Percent of Those Households Where Any Help Was Sought)

MTHC-2009 – Rev. A 4/3/09 5-21
Figure 5.3.4 shows the ten most prevalent barriers to as reported by respondents from our most needy households where help was sought for problems in their household. (See also, Appendix 2.A)
Figure 5.3.4 Top Barriers To Service Access - Most Needy Households -
37%
37%
39%
44%
45%
46%
50%
53%
58%
60%
20% 30% 40% 50% 60% 70% 80%
Lacked Information on AvailableServices
Hours of Services Were Not Convenient
Lack of Information On Where To GoFor Services
Unable To Take Time Away From WorkTo Go To Services
Insurance Not Accepted For Services
Services Located Too Far Away
Service(s) Not Accepting NewPatients/Clients
Cost of Taking Time Away From Work
Paying Insurance Deductible/Co-Payment
Could Not Afford Fees or Costs ForServices
Percent of Most Needy Households Viewing Service Access Barrier asModerately-to-Extremely Serious*
(* Percent of Those Most Needy Households Where Any Help Was Sought)

MTHC-2009 – Rev. A 4/3/09 5-22
Responses to Open-Ended Questions on the Cape Cod Community Survey - 2008: Hand-Written Comments By Respondents - Concerning Their Feelings About Cape Cod, About Cape Codders, and Their Ideas and Suggestions For Making Cape Cod a Better Place In Which to Live
Cape Cod Community Survey - 2008 respondents were invited to write in their likes and dislikes about Cape Cod, about Cape Codders, and their ideas and suggestions for making Cape Cod a better place to live. Four questions were posed as follows:
“A. What do you especially like about Cape Cod?”
“B. What do you especially like about the PEOPLE of Cape Cod?”
“C. What do you dislike most about Cape Cod?”
“D. Please write in your ideas or suggestions for making Cape Cod a better place to live.”
Note: Appendix 3 contains details of hand-written comments for each of the four questions and transcripts of comments relating to the most common topic areas. More than one-half (55%) of all respondents took the time to write in a response to one or more of these questions. While the topics of these responses of course varied considerably, a number of common themes were voiced in response to each of the four questions. Those commenting wrote-in an average of 3.2 comments each, yielding a total of almost 1,500 separate comments.
Almost six-in-ten (59%) respondents from our most needy households took the time to write in one or more comment. On average, these respondents wrote-in 3.2 comments each, yielding a total of over 400 comments. Responses to Question A
The top responses relating to what all survey respondents, “especially like about Cape Cod” are summarized in Table 5.3.5. (See also, Appendix 3)
Table 5.3.5 Ranked List of Topics From ALL Responses to Question A
Rank
Topic
Category
Number of Responses
With This Topic
Percentage of All Responses To Question A*
(N=764) 1 Proximity to Ocean/Seashore 178* 23% 2 Natural Beauty/Scenic Landscape 110* 14% 3 Moderate Climate/Seasons 66* 9%
4(tie) Open Space/Natural Environment 52 7% 4(tie) Availability of Activities/Things To Do 50 7% 5(tie) Character of the People/Diversity 48 6% 5(tie) Child/Family-Friendly Environment 47 6% 6(tie) Quaint/Small-Town Character 41 5% 6(tie) Availability of Services/Infrastructure 40 5% 6(tie) Peacefulness 36 5%
7 Lifestyle/Ambience 33 4% 8 The Opportunities Available 20 3% 9 Sense of Community 17 2%
10(tie) Safety/Low Crime 11 1% 10(tie) History/Traditions/Architecture 11 1%
11 Proximity to “Big City” Amenities 4 0.5%
* Appendix 3 contains a SNAPSHOT Report containing transcripts of key hand-written responses. (tie) = tied at same rank.

MTHC-2009 – Rev. A 4/3/09 5-23
Most Needy Households
The top responses from our most needy households relating to what these respondents, “especially like about Cape Cod” are summarized in Table 5.3.6. (See also, Appendix 3)
Table 5.3.6 Ranked List of Topics From Most Needy Household Responses to Question A
Rank
Topic Category
Number of Most Needy Responses
With This Topic
Percentage of Most Needy Responses
To Question A* (N=188)
1 Proximity to Ocean/Seashore 40* 21% 2 Natural Beauty/Scenic Landscape 26* 14%
3(tie) Moderate Climate/Seasons 13* 7% 3(tie) Child/Family-Friendly Environment 14 7% 3(tie) Availability of Services/Infrastructure 13 7% 4(tie) Open Space/Natural Environment 12 6% 4(tie) Availability of Activities/Things To Do 12 6% 4(tie) Quaint/Small-Town Character 11 6% 5(tie) Peacefulness 10 5% 5(tie) Character of the People/Diversity 10 5%
6 Safety/Low Crime 7 4% 7(tie) Sense of Community 5 3% 7(tie) Lifestyle/Ambience 5 3% 8(tie) History/Traditions/Architecture 4 2% 8(tie) The Opportunities Available 4 2%
9 Proximity to a “Big City” 2 1% - Local Taxes 0 0%
* Appendix 3 contains a SNAPSHOT Report containing transcripts of key hand-written responses. (tie) = tied at same rank.

MTHC-2009 – Rev. A 4/3/09 5-24
Responses to Question B
The top responses relating to what all survey respondents, “especially like about the people of Cape Cod” are summarized in Table 5.3.7. (See also, Appendix 3) Table 5.3.7 Ranked List of Topics From ALL Responses to Question B
Rank
Topic
Category
Number of Responses
With This Topic
Percentage of All Responses To Question B*
(N=470) 1 Friendliness 171* 36% 2 Character/Values 118* 25% 3 Helpfulness 67 14% 4 Niceness 38 8% 5 Diversity 30 6%
6(tie) Courtesy 16 3% 6(tie) Sense of Community 13 3% 7(tie) Relaxed Lifestyle 10 2% 7(tie) Caring 7 2%
* Appendix 3 contains a SNAPSHOT Report containing transcripts of key hand-written responses. (tie) = tied at same rank. Most Needy Households The top responses from our most needy households relating to what this group of respondents, “especially like about the people of Cape Cod” are summarized in Table 5.3.8. (See also, Appendix 3) Table 5.3.8 Ranked List of Topics From Most Needy Household Responses to Question B
Rank
Topic
Category
Number of Most Needy Responses
With This Topic
Percentage of Most Needy Responses
To Question B* (N=116)
1 Friendliness 39* 34% 2 Character/Values 31* 27% 3 Helpfulness 18 16% 4 Niceness 14 12% 5 Diversity 6 5% 6 Sense of Community 4 3% 7 Courtesy 2 2%
8(tie) Caring 1 0.1% 8(tie) Relaxed Lifestyle 1 0.1%
* Appendix 3 contains a SNAPSHOT Report containing transcripts of key hand-written responses. (tie) = tied at same rank.

MTHC-2009 – Rev. A 4/3/09 5-25
Responses to Question C
The top ten responses relating to what respondents, “dislike most about Cape Cod” are summarized in Table 5.3.9. (See also, Appendix 3)
Table 5.3.9 Ranked List of Topics From ALL Responses to Question C
Rank
Topic
Category
Number of Responses
With This Topic
Percentage of All Responses To Question C*
(N=680) 1 High Prices & Lack of Affordability 122* 18% 2 Traffic & The Public Transportation System 108* 16% 3 Weather Conditions & Seasonality 71* 11% 4 Local Government 56* 8%
5(tie) Attitudes of The People 43 6% 5(tie) Employment & Wages Situation 40 6% 5(tie) Isolation & Lack of Activities/Resources 38 6%
6 Housing Situation 32 5% 7(tie) Growth & Development 26 4% 7(tie) Businesses, “Big Box” Stores, & Malls 25 4% 8(tie) Crime Situation 21 3% 8(tie) Tourists/Tourism 21 3% 8(tie) Healthcare Resources & Readiness 20 3% 9(tie) Discrimination & Attitudes Toward Minorities 15 2% 9(tie) Pressures on Young People & Families 14 2% 9(tie) Public Utilities 10 2% 10(tie) Run-Down Property/Shabby Neighborhoods 2 0.3% 10(tie) Lack of Disaster Preparedness 2 0.3%
* Appendix 3 contains a SNAPSHOT Report containing transcripts of key hand-written responses. (tie) = tied at same rank. Most Needy Households The top responses from our most needy households relating to what these respondents, “dislike most about Cape Cod” are summarized in Table 5.3.10. (See also, Appendix 3)
Table 5.3.10 Ranked List of Topics From Most Needy Household Responses to Question C
Rank
Topic
Category
Number of Most Needy Responses
With This Topic
Percentage of Most Needy Responses
To Question C* (N=214) 1 High Prices & Lack of Affordability 45* 21% 2 Traffic & The Public Transportation System 24* 11% 3 Local Government 19 9%
4(tie) Attitudes of The People 18 8% 4(tie) Employment & Wages Situation 17 8%
5 Weather Conditions & Seasonality 15* 7% 6(tie) Isolation & Lack of Activities/Resources 13 6% 6(tie) Housing Situation 12 6%
7 Healthcare Resources & Readiness 10 5% 8(tie) Pressures on Young People & Families 7 3% 8(tie) Discrimination & Attitudes Toward Minorities 6 3% 8(tie) Tourists & Tourism 6 3% 8(tie) Businesses, “Big Box” Stores, & Malls 6 3%
MTHC-2009 – Rev. A 4/3/09 5-26
9(tie) Crime Situation 5 2% 9(tie) Growth & Development 5 2% 10(tie) Public Utilities 3 1% 10(tie) Increasing Pollution & Trash 3 1%
- Run-Down Property/Shabby Neighborhoods 0 0% - Lack of Disaster Preparedness 0 0%
* Appendix 3 contains a SNAPSHOT Report containing transcripts of key hand-written responses. (tie) = tied at same rank. Responses to Question D
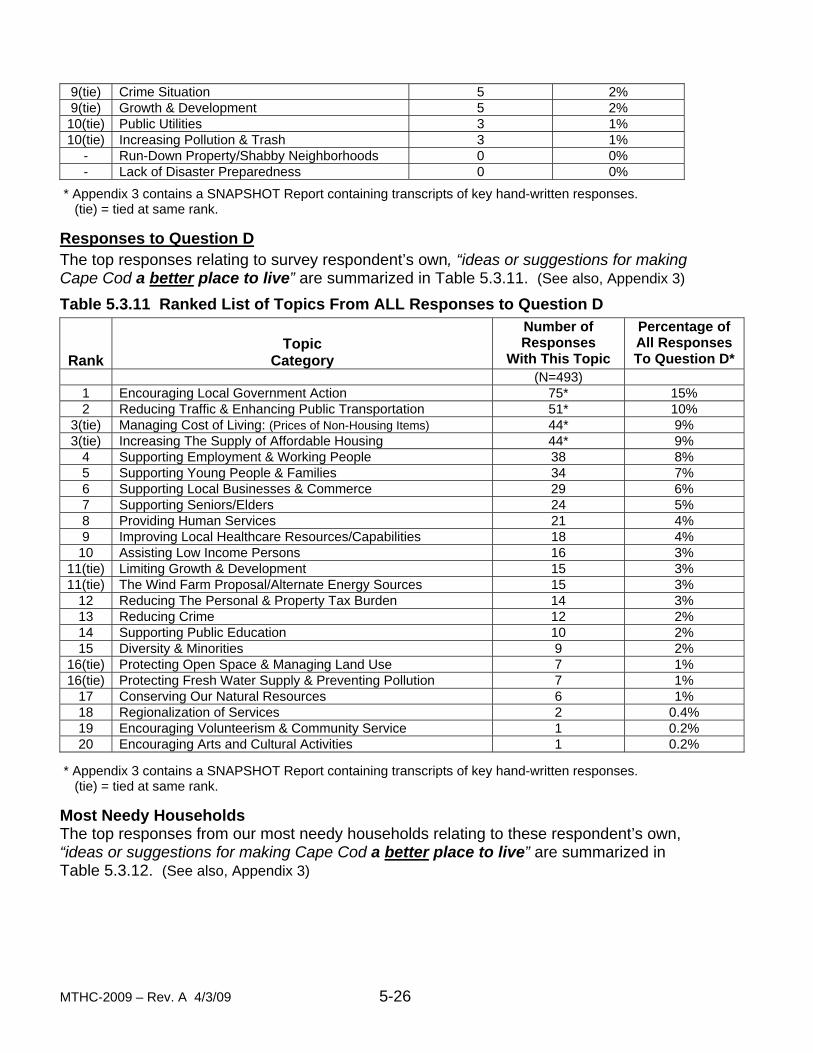
The top responses relating to survey respondent’s own, “ideas or suggestions for making Cape Cod a better place to live” are summarized in Table 5.3.11. (See also, Appendix 3)
Table 5.3.11 Ranked List of Topics From ALL Responses to Question D
Rank
Topic
Category
Number of Responses
With This Topic
Percentage of All Responses To Question D*
(N=493) 1 Encouraging Local Government Action 75* 15% 2 Reducing Traffic & Enhancing Public Transportation 51* 10%
3(tie) Managing Cost of Living: (Prices of Non-Housing Items) 44* 9% 3(tie) Increasing The Supply of Affordable Housing 44* 9%
4 Supporting Employment & Working People 38 8% 5 Supporting Young People & Families 34 7% 6 Supporting Local Businesses & Commerce 29 6% 7 Supporting Seniors/Elders 24 5% 8 Providing Human Services 21 4% 9 Improving Local Healthcare Resources/Capabilities 18 4%
10 Assisting Low Income Persons 16 3% 11(tie) Limiting Growth & Development 15 3% 11(tie) The Wind Farm Proposal/Alternate Energy Sources 15 3%
12 Reducing The Personal & Property Tax Burden 14 3% 13 Reducing Crime 12 2% 14 Supporting Public Education 10 2% 15 Diversity & Minorities 9 2%
16(tie) Protecting Open Space & Managing Land Use 7 1% 16(tie) Protecting Fresh Water Supply & Preventing Pollution 7 1%
17 Conserving Our Natural Resources 6 1% 18 Regionalization of Services 2 0.4% 19 Encouraging Volunteerism & Community Service 1 0.2% 20 Encouraging Arts and Cultural Activities 1 0.2%
* Appendix 3 contains a SNAPSHOT Report containing transcripts of key hand-written responses. (tie) = tied at same rank.
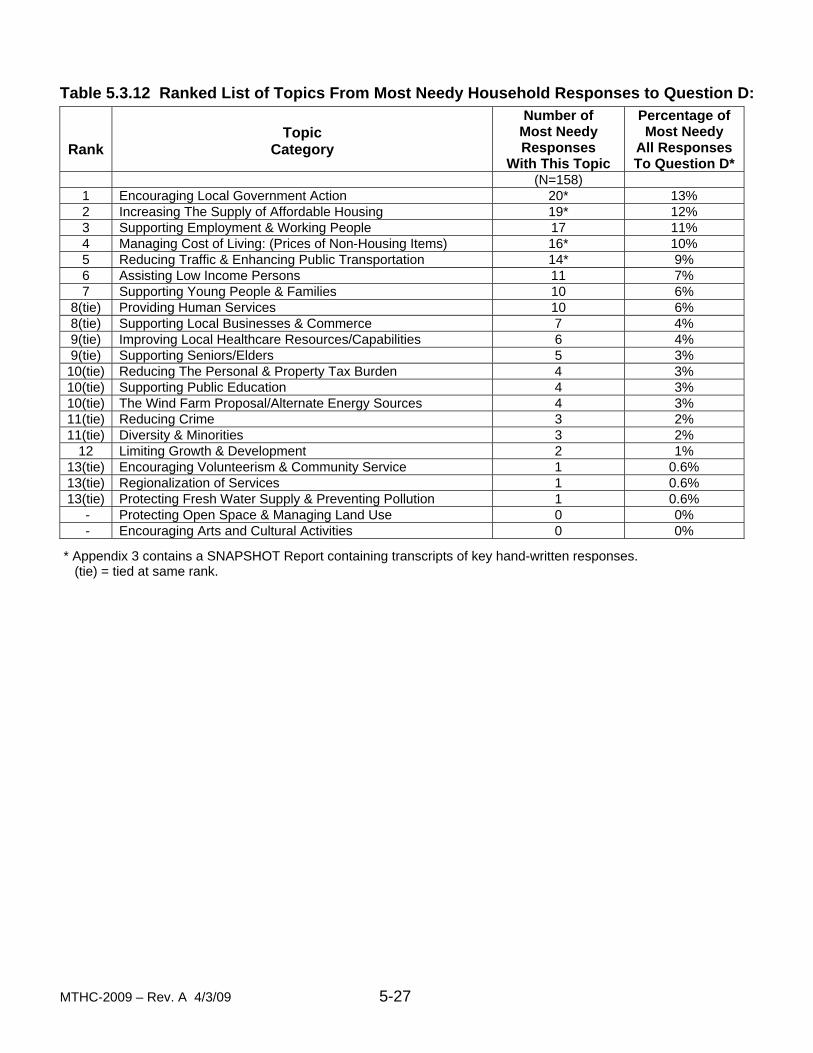
Most Needy Households The top responses from our most needy households relating to these respondent’s own, “ideas or suggestions for making Cape Cod a better place to live” are summarized in Table 5.3.12. (See also, Appendix 3)
MTHC-2009 – Rev. A 4/3/09 5-27
Table 5.3.12 Ranked List of Topics From Most Needy Household Responses to Question D:
Rank
Topic
Category
Number of Most Needy Responses
With This Topic
Percentage of Most Needy
All Responses To Question D*
(N=158) 1 Encouraging Local Government Action 20* 13% 2 Increasing The Supply of Affordable Housing 19* 12% 3 Supporting Employment & Working People 17 11% 4 Managing Cost of Living: (Prices of Non-Housing Items) 16* 10% 5 Reducing Traffic & Enhancing Public Transportation 14* 9% 6 Assisting Low Income Persons 11 7% 7 Supporting Young People & Families 10 6%
8(tie) Providing Human Services 10 6% 8(tie) Supporting Local Businesses & Commerce 7 4% 9(tie) Improving Local Healthcare Resources/Capabilities 6 4% 9(tie) Supporting Seniors/Elders 5 3% 10(tie) Reducing The Personal & Property Tax Burden 4 3% 10(tie) Supporting Public Education 4 3% 10(tie) The Wind Farm Proposal/Alternate Energy Sources 4 3% 11(tie) Reducing Crime 3 2% 11(tie) Diversity & Minorities 3 2%
12 Limiting Growth & Development 2 1% 13(tie) Encouraging Volunteerism & Community Service 1 0.6% 13(tie) Regionalization of Services 1 0.6% 13(tie) Protecting Fresh Water Supply & Preventing Pollution 1 0.6%
- Protecting Open Space & Managing Land Use 0 0% - Encouraging Arts and Cultural Activities 0 0%
* Appendix 3 contains a SNAPSHOT Report containing transcripts of key hand-written responses. (tie) = tied at same rank.

MTHC-2009 – Rev. A 4/3/09 5-28
MTHC-2009 – Rev. A 4/3/09 5-29
Section 5. Research Findings 4. Description of The Needy on Cape Cod Cape Cod Households Grouped By Shared Issues and Challenges
As noted in the previous section, Cape Cod Community Survey – 2008 respondents reported in detail about the types of issues that have recently been a problem in their own household. The most problematical issues across Barnstable County were identified and discussed. However, the Cape Cod population is not monolithic—considerable variation exists from household to household across the County. These variations stem from many things, including differences in age ranges, household income, the presence of children in the home, homeownership vs. renting, the make-up of the family group, geographic region, and racial, ethnic, linguistic, and cultural diversity. All of these differences impact which issues are most serious in any given household.
As we go about our daily lives each individual Cape Codder and each Cape Cod house- hold faces a myriad of challenges. Challenges to our “human condition” appear in all shapes and sizes. For some individuals, low income challenges their ability to purchase even the basic necessities of life—food, housing, clothing, medical and dental care. For others, being adequately prepared for employment is a severe challenge. For still others, a physical or mental disability or the infirmity of a chronic illness limits opportunities for employment, limits their ability to thrive, and to enjoy a satisfactory quality of their life. These issues and more create challenges for each of us.
Through the “lens” of the Cape Cod Community Survey - 2008 research we have been able to look closely at literally hundreds of Cape Cod households and to better understand the unique challenges that daily face members of these households. These 846 households were selected to represent a cross-section of the nearly 100,000 Cape Cod households— as such, they speak for the whole Cape. Scientific analysis methods have enabled County researchers to “sift” through the over 338,000 pieces of information collected from Cape Codders, to analyze this information, and thus, more fully understand the challenges faced by our year-round, permanent resident population. Groups of Cape Codders With Shared Issues--Challenges to Their “Human Condition”:
The results of “sifting” responses to the questions posed to Cape Codders through the Cape Cod Community Survey—the questionnaire distributed to nearly 2,500 Cape Cod households—shows that the population of Cape Cod can be segmented into five distinct groups depending upon the types of household issues reported to exist in the household. Households in these groups share a similar set of issues--challenges to their “human condition.” There are great similarities between the “human environment” perceived by individuals within each of these five population groups, and considerable differences between groups. This section of the Report provides insight into these five distinct groups, into their shared issues—challenges, and the differences that appear to exist between groups. Reference Appendix 2.B for more detailed descriptions of each of the five Household Issue Groups as well as for the Cape’s “Most Needy” households.

MTHC-2009 – Rev. A 4/3/09 5-30
Group “Labels”
For discussion purposes, these five population groups are referred to simply as Household Issue Groups, #1, #2, #3, #4, and #5. Researchers have made no attempt to “label” the set of issues--challenges faced by individuals included in these groups of households. Instead, they let the survey data speak for themselves. The following section provides a detailed explanation of the human environment encountered by members of each of these five population groups. Having studied these, the reader may feel qualified to or wish to assign his/her own mnemonic “label” to each group. All Cape Cod households are thought to be included in ONE (but only one) of these five groups. Household Issue Groups: Thumbnail Sketches
Briefly, the Household Issues groups can be generally characterized as follows:
Group #1 Households: (represents about 13,600 Cape Cod residents in about 3,400 households) (See also Appendix 2.B)
Thumbnail: Low-income, mostly: “working poor,” young family households generally with one or two children, who rent their home. Includes only a few retirees. Many Group #1 households include: a single parent, receive some financial assistance including Medicaid (MassHealth) or Commonwealth Care, include those with chronic illness or disabilities, are cultural/ethnic, linguistic, or racial minorities, geographically dispersed--residing in the Mid-Cape—particularly Barnstable/Hyannis, Dennis, or in Harwich, or in the smaller Upper-Cape towns.
Perceived challenges include; child day care, a lack of money to purchase basic needs and high levels of stress and anxiety.
Top Five Household Issues: [average (mean) response score on a scale of 0 - 2] “Not able to find or afford child day care” [mean=1.31]
“Not having enough money to pay for housing” [1.26] “Not able to find or afford after-school child care” [1.25]
“Not being able to afford recreational activities” [1.19] “Having a lot of anxiety or stress in the household” [1.09]
Perceived barriers to obtaining needed human services include; services too costly, work-related impediments, insufficient services capacity, and healthcare affordability. Nine-in-ten (91%) of Group #1 households reported one or more serious barrier to obtaining needed services.
Top Five Service Barriers: [average (mean) response score on a scale of 0 - 3] “Could not afford fees/costs for services” [mean=1.32] “Cost of time away from work” [1.19] “Unable to take time away from work to go to services” [.96] “Services not accepting new patients/clients” [.93]
“Paying insurance deductible/co-payment” [.86]
Statistical analysis shows that Group #1 is distinguished from the other four groups on the basis of single-parenthood, or in being among the “working poor” of Cape Cod.

MTHC-2009 – Rev. A 4/3/09 5-31
Group #2 Households: (represents about 8,600 Cape Cod residents in about 2,100 households) (See also Appendix 2.B)
Thumbnail: Low-income, mostly: “working poor,” larger, young-to-middle-age adult households with at most one children, who rent their home, are homeless, or live in a group setting. Includes only a few retirees. Many Group #2 households: are cultural/- ethnic or racial minorities, receive some financial assistance including Medicaid (MassHealth) or Commonwealth Care, include those with chronic illness or disabilities, and reside in Barnstable—particularly Hyannis, or on the Outer-Cape— in Truro and Provincetown, or in Mashpee. Considerably fewer live in the Lower- Cape towns.
Perceived challenges include; emotional problems, including high levels of stress and anxiety, and a very serious lack of money to pay for healthcare and legal assistance.
Top Five Household Issues: [average (mean) response score on a scale of 0 - 2] “A lot of depression in the household” [mean=1.88]
“Having a lot of anxiety or stress in the household” [1.84] “Paying for or getting dental insurance” [1.68]
“Not being able to afford recreational activities” [1.68] “Not being able to afford legal help” [1.60]
Perceived barriers to obtaining needed human services include; services too costly, work-related impediments, insufficient transportation, and health insurance coverage issues. Ninety-three percent (93%) of Group #2 households reported one or more serious barrier to obtaining needed services.
Top Five Service Barriers: [average (mean) response score on a scale of 0 - 3] “Could not afford fees/costs for services” [mean=1.62] “Cost of time away from work” [1.43] “Unable to take time away from work to go to services” [1.32] “Lack of transportation” [1.24] “Insurance not accepted for services” [1.17]
Statistical analysis shows that Group #2 is distinguished from the other four groups on the basis of having some household member being disabled or chronically ill, and by having no one who is retired.

MTHC-2009 – Rev. A 4/3/09 5-32
Group #3 Households: (represents about 54,500 Cape Cod residents in about 15,700 households) (See also Appendix 2.B)
Thumbnail: Mixed-income (some very low, some moderate), mostly: employed “working poor,” young-to-middle age adult households with at most one child, who rent their home, are homeless, or live in a group setting. Includes only a few retirees. Many Group #3 households: include a single parent, are cultural/ethnic or racial minorities, receive some financial assistance including Medicaid (MassHealth) or Common- wealth Care, include those with chronic illness or disabilities), and reside in Hyannis, Provincetown, or Sandwich. Considerably fewer live on the Mid-Cape (outside of Hyannis) or in the Lower/Outer-Cape towns.
Perceived challenges include; emotional problems, including high levels of stress, anxiety, and depression, and a serious lack of money to pay for medical and dental care.
Top Five Household Issues: [average (mean) response score on a scale of 0 - 2] “Having a lot of anxiety or stress in the household” [mean=1.05]
“A lot of depression in the household” [.99] “Not being able to afford recreational activities” [.81]
“Paying for or getting dental insurance” [.78] “Not having enough money to pay the doctor, the dentist, or to buy prescription medications” [.76]
Perceived barriers to obtaining needed human services include; unaffordablity of health insurance coverage, services too costly, insufficient services capacity, and work-related impediments. Seventy-seven percent (77%) of Group #3 households reported one or more serious barrier to obtaining needed services.
Top Five Service Barriers: [average (mean) response score on a scale of 0 - 3] “Paying insurance deductible/co-payment” [mean=.76] “Could not afford fees/costs for services” [.71] “Services not accepting new patients/clients” [.64] “Cost of time away from work” [.60]
“Services located too far away” [.56]
Statistical analysis shows that Group #3 is distinguished from the other four groups by not being a homeowner, by having some household member(s) in fair-to-poor health, and by having some household member(s) receiving public financial assistance.
MTHC-2009 – Rev. A 4/3/09 5-33
Group #4 Households: [defined as NOT All Adults are “Retired”] (represents about 110,000 (See also Appendix 2.B) Cape Cod residents in
about 40,000 households) Thumbnail: Higher-income, employed, smaller, 2-adult young-to-middle age family households generally with no more than one child. Most own their home, but some are renters. Includes some retirees (but no household where all adults are retired), are cultural or ethnic minorities. Group #4 households reside in the Upper-Cape towns or in the Mid-Cape (outside of Hyannis). By definition, not all adults in Group #4 house- holds are retired.
Perceived challenges include; a lack of money to pay for dental care, emotional problems, including anxiety and stress, and an inability to afford basic medical and dental services, prescription medicines, and to pay for housing. While these challenges are somewhat similar to those of Group #5, they are generally more serious). Top Five Households Issues: [average (mean) response score on a scale of 0 - 2] “Paying for or getting dental care” [mean=.20] “Having a lot of anxiety or stress in household” [.19] “Not being able to afford recreational activities” [.18] “Not having enough money to pay the doctor, the dentist, or to buy prescription medications” [.17] “Not having enough money for housing” [.11]
Perceived barriers to obtaining needed human services include; insufficient service capacity, work-related impediments, services too costly, and the unaffordablity of healthcare insurance coverage. (Note: Perceived barriers to service are reported to be very low as compared to barriers reported by Groups #1, #2, and #3.) Thirty percent (30%) of Group #4 households reported one or more serious barrier to obtaining needed services.
Top Five Service Barriers: [average (mean) response score on a scale of 0 - 3] “Services not accepting new patients/clients” [mean =.58]
“Cost of time away from work” [.45] “Paying insurance deductible/co-payment” [.44] “Insurance not accepted for services” [.42] “Could not afford fees or costs for services” [.40]
Statistical analysis shows that Group #4 households are distinguished from the other four groups by not having a household member in fair-to-poor health, by being a homeowner, and by having a combined annual income above the County median.
MTHC-2009 – Rev. A 4/3/09 5-34
Group #5 Households: [defined as ALL Adults are “Retired”] (represents about 36,800 Cape (See also Appendix 2.B) Cod residents in about 22,000 households)
Thumbnail: ALL “retired”, mixed-income (some very low, some moderate-to-high), small, childless, older-adult (age 65+) households, who own their home, household members are primarily white and covered by Medicare. Many are one adult households. Group #5 households reside mainly in the Lower/Outer Cape towns. Considerably fewer reside in the Mid-Cape (particularly Barnstable/- Hyannis) or in Upper-Cape towns. By definition, all adults in Group #5 house- holds are retired.
Perceived challenges include; emotional problems including stress, anxiety, and depression, lack of money to pay for dental care, and seriously overweight house- hold members. (Note: Perceived challenges are somewhat similar to those of Group #4 except generally less serious).
Top Five Household Issues: [average (mean) response score on a scale of 0 - 2] “A lot of depression in the household” [mean=.12] “Having a lot of anxiety or stress in household” [.11] “Paying for or getting dental care” [.11]
“Seriously overweight person(s) in household” [.10] “Not being able to afford recreational activities” [.08]
Perceived barriers to obtaining needed human services include; insufficient service capacity, unaffordablity of health insurance coverage, services not known about, services not being conveniently located, and services too costly. Only nineteen percent (19%) of Group #5 households reported any serious barriers to obtaining needed services. (Note: Perceived barriers to service are reported to be extremely- low as compared to barriers reported by Groups #1, #2, and #3 and even quite low relative to those reported by Group #4 households.)
Top Five Service Barriers: [average (mean) response score on a scale of 0 - 3] “Services not accepting new patients/clients” [mean =.57]
“Insurance not accepted for services” [.39] “Lack of information on where to go for services” [.33] “Could not afford fees or costs for services” [.31] “Services located too far away” [.30]
Statistical analysis shows that Group #5 households are distinguished from the other four groups by not having any children, by being a homeowner, by having one adult living alone, and by living in the Lower-Cape Cod region (the towns of Brewster, Chatham, Harwich, and Orleans).
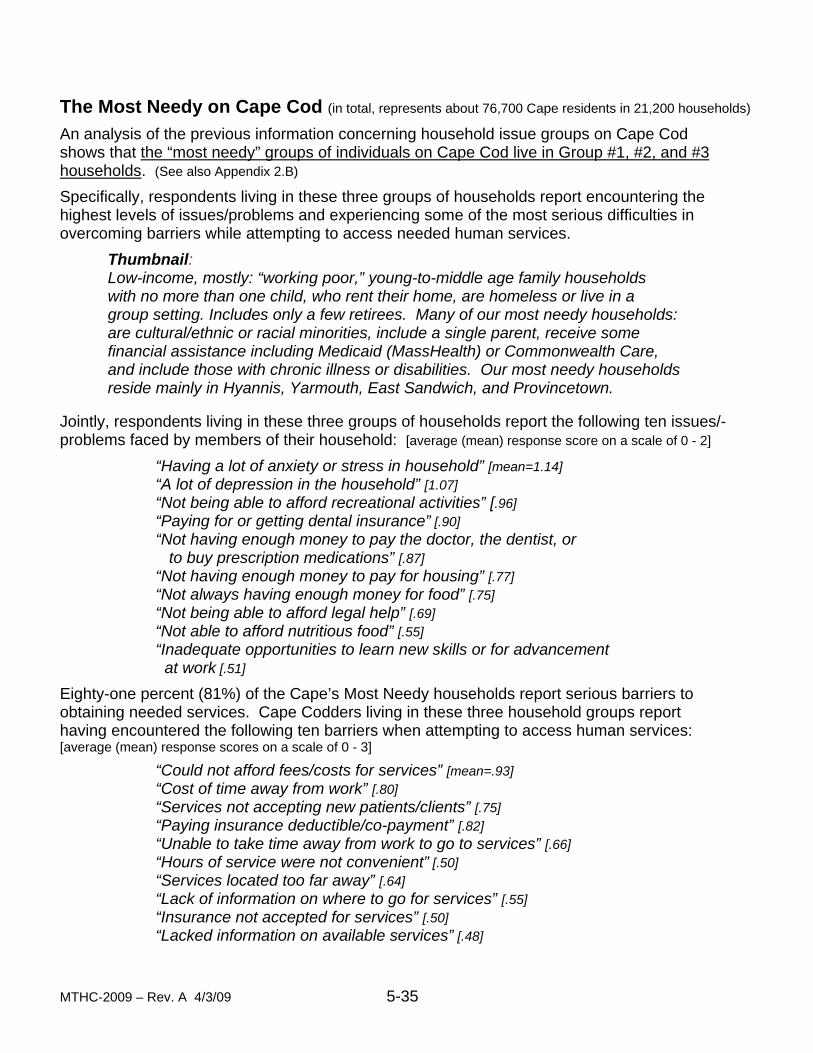
MTHC-2009 – Rev. A 4/3/09 5-35
The Most Needy on Cape Cod (in total, represents about 76,700 Cape residents in 21,200 households)
An analysis of the previous information concerning household issue groups on Cape Cod shows that the “most needy” groups of individuals on Cape Cod live in Group #1, #2, and #3 households. (See also Appendix 2.B)
Specifically, respondents living in these three groups of households report encountering the highest levels of issues/problems and experiencing some of the most serious difficulties in overcoming barriers while attempting to access needed human services.
Thumbnail: Low-income, mostly: “working poor,” young-to-middle age family households with no more than one child, who rent their home, are homeless or live in a group setting. Includes only a few retirees. Many of our most needy households: are cultural/ethnic or racial minorities, include a single parent, receive some financial assistance including Medicaid (MassHealth) or Commonwealth Care, and include those with chronic illness or disabilities. Our most needy households reside mainly in Hyannis, Yarmouth, East Sandwich, and Provincetown.
Jointly, respondents living in these three groups of households report the following ten issues/- problems faced by members of their household: [average (mean) response score on a scale of 0 - 2]
“Having a lot of anxiety or stress in household” [mean=1.14] “A lot of depression in the household” [1.07]
“Not being able to afford recreational activities” [.96] “Paying for or getting dental insurance” [.90]
“Not having enough money to pay the doctor, the dentist, or to buy prescription medications” [.87] “Not having enough money to pay for housing” [.77] “Not always having enough money for food” [.75] “Not being able to afford legal help” [.69] “Not able to afford nutritious food” [.55] “Inadequate opportunities to learn new skills or for advancement at work [.51]
Eighty-one percent (81%) of the Cape’s Most Needy households report serious barriers to obtaining needed services. Cape Codders living in these three household groups report having encountered the following ten barriers when attempting to access human services: [average (mean) response scores on a scale of 0 - 3]
“Could not afford fees/costs for services” [mean=.93] “Cost of time away from work” [.80] “Services not accepting new patients/clients” [.75] “Paying insurance deductible/co-payment” [.82]
“Unable to take time away from work to go to services” [.66] “Hours of service were not convenient” [.50] “Services located too far away” [.64] “Lack of information on where to go for services” [.55] “Insurance not accepted for services” [.50] “Lacked information on available services” [.48]
MTHC-2009 – Rev. A 4/3/09 5-36
Individuals living in these three groups are among the most needy on Cape Cod. These households often share one or more of the following socio-demographic characteristics:
• Household can be considered “homeless” • Household has ALL adults ages 18-44 years • Household has ALL adults ages 45-54 years • Combined household income is below the County median • Combined household income is below $50,000 • Combined annual household income is below 200% of poverty (200% of poverty in 2008 = $20,800 for one person alone, $28,000 for a family of two, and $42,800 for a family of four)
Statistical analysis shows that our Most Needy households (Groups #1, #2, and #3 combined) are distinguished from households in the other two groups by the following factors: 1) some household member receives public financial assistance; 2) one or more household members is considered to be in fair-to-poor health; 3) a lack of home ownership; and 4) having one or more child in the household (ages 0-17 years).
MTHC-2009 – Rev. A 4/3/09 5-37
Section 5. Research Findings
5. Basic Needs Basic needs for Cape Codders are defined to include; employment, healthcare, housing, income security, public safety, transportation, quality of life, and life skills (education). This Section provides highlights of Cape Cod Community Survey – 2008 research into these topics. Reference Appendix 2.C for additional details of Basic Needs responses.
1. Employment
The Cape Cod Community Survey - 2008 responses provide insight into the following employment-related topics:
• Cost of taking time away from work to access human services (including healthcare) • Combined household annual income from all sources (including employment) • Health insurance obtained through employment • Inability to take time away from work to go to [human] services • Number of “all retired” households • Number of employed adults • Number of “retired” adults • Types of employment:
o Full-time o Gainfully self-employment o Working for a very small firm o Year-round
• Status of non-working adults: o Retired o Disabled, etc o In school/job training, etc. o Looking for work, etc.
• Work-related childcare requirements • Work-related transportation situation
Household Issues and Service Barriers:
Cape Cod Community Survey - 2008 respondents were asked to identify major emp- loyment-related issues and problems that came up in their household during the previous year. Further, if they tried to obtain help in overcoming these problems, what kind of barriers to services did they encounter and how serious were these barriers. The follow- ing employment-related issue was reported:
• Inadequate opportunities to learn new skills or for advancement at work • Vehicle availability when needed for on-Cape travel to work or job training
Highlights from Employment-Related Survey Findings
Nearly three-in-ten (29%) of Cape Cod households report being completely “retired” (self defined), that is, all adults living there are retired. Four-in-ten households (43%) include at least one retiree. There is of course considerable variation in retirement status across the age groups of residents.

MTHC-2009 – Rev. A 4/3/09 5-38
Almost two-thirds (64%) of surveyed households have at least one employed adult. More than one-half (53%) of surveyed households have at least one adult working full-time, year-round. One-fifth (20%) include an adult who is reportedly gainfully self-employed. One-fifth (21%) of all households report an adult who works for a firm with fewer than 10 employees.
Many Cape Cod households have non-working adults. Adults who are not working are most likely retired (33%), unable to work due to a disability or are on medical leave, etc. (9%), in school, or college (9%), or in job training (1%). Slightly more than one- in-ten (12%) Cape households report at least one unemployed adult. One-in-eight Cape households can be considered to be “working poor,” that is having employed adults, but with a combined annual income of less than 200% of the year 2008 federal poverty level. On average, over one-in-eight (11%-14%) of Cape Cod households seldom or never have the use of a suitable vehicle when needed for on-Cape travel to work, school, or job training. Table 5.5.1 shows key employment-related findings for Cape Cod households. (See also, Appendix 2.C)
Table 5.5.1a: Employment Situation in Cape Cod Households
Employment Situation
Percent of Cape Cod
Households Household with all adults “retired” 29% Household with one or more retiree 43%
Household with a non-working adult(s):* - Of those not working: retired 33% Of those not working: disability or medical leave, etc 9% Of those not working: in school or college 8% Of those not working: looking for work 9% Of those not working: NOT looking for work 3% Of those not working: in job training 0.9%
At least one adult is working full-time, year-round 53% Household with gainfully self-employed adult(s) 20% Household with adult(s) working in small firm (1-9 employees) 21% Adult(s) need(s) child day care in order to be employed 10% “ Working Poor” Households (employed adults, but with annual income less than 200% of 2008 poverty level)
13%
* Non-working: Cape Cod household with one or more adult who was not working at the time of survey (Nov. – Dec. 2008). Table 5.5.1b shows key employment–related issues reported by Cape Cod households.
Table 5.5.1b: Employment-Related Issues in Cape Cod Households [a minor-to-major problem]
Employment-Related Household Issue
Percent of Cape Cod
Households Issue: Inadequate opportunities to learn new skills or for advancement at work 11% Issue: “Seldom” or “Never” have the use of a working vehicle when needed for on-Cape travel to work
11%
Issue: “Seldom” or “Never” have the use of a working vehicle when needed for on-Cape travel to school or job training
14%

MTHC-2009 – Rev. A 4/3/09 5-39
Most Needy Households: (See definition of “Most Needy” households in Section 5.4)
Among the most needy households on Cape, one-in-ten (10%) are all “retired,” only 25% include any retirees at all, and households that include any, typically only have one retiree. Traditionally, members of our most needy households have been a much younger and heavily employed group of individuals than the overall population. However, as our population ages and more residents retire, that dynamic is changing. In these 2008 data we continue to see the ”leading edge” of a move toward a most needy profile which includes older and less employed persons.
Three-quarters (74%) of our most needy households have at least one employed adult. Nearly two-thirds of these households have at least one adult working full-time, year-round. One-fifth (20%) of most needy households include an adult who is reportedly gainfully self-employed. One-quarter (25%) of these households include an adult who works for a firm with fewer than 10 employees.
Employment is very high among our most needy households, but a considerable pro- portion of households do report one or more non-working adults. One-quarter (25%) of most needy households report at least one unemployed adult. Reasons for adult household members not working center about disability/medical leave and unemployment (but looking for work). Three-in-ten of the Cape’s most needy households can be considered to be “working poor.” On average, about one-sixth (14%-19%) of our most needy households seldom or never have the use of a suitable vehicle when needed for on-Cape travel to work, school, or job training.
Table 5.5.2 shows key employment–related findings for our most needy households. (See also, Appendix 2.C)
Table 5.5.2a: Employment Situation in Our Most Needy Households
Employment Situation
Percent of
Most Needy Households
Household with all adults “retired” 10% Household with one or more retiree 25%
Household with a non-working adult:* - Of those not working: retired 17% Of those not working: disability or medical leave, etc 20% Of those not working: in school or college 12% Of those not working: looking for work 21% Of those not working: NOT looking for work 6% Of those not working: in job training 3%
At least one adult is working full-time, year-round 63% Household with gainfully self-employed adult(s) 20% Household with adult(s) working in small firm (1-9 employees) 25% Adult(s) need(s) child day care in order to be employed 21% “ Working Poor” Households (employed adults, but with annual income less than 200% of 2006 poverty level)
27%
* Non-Working: Most Needy households with one or more adult who was not working at the time of survey (Nov. – Dec. 2008).
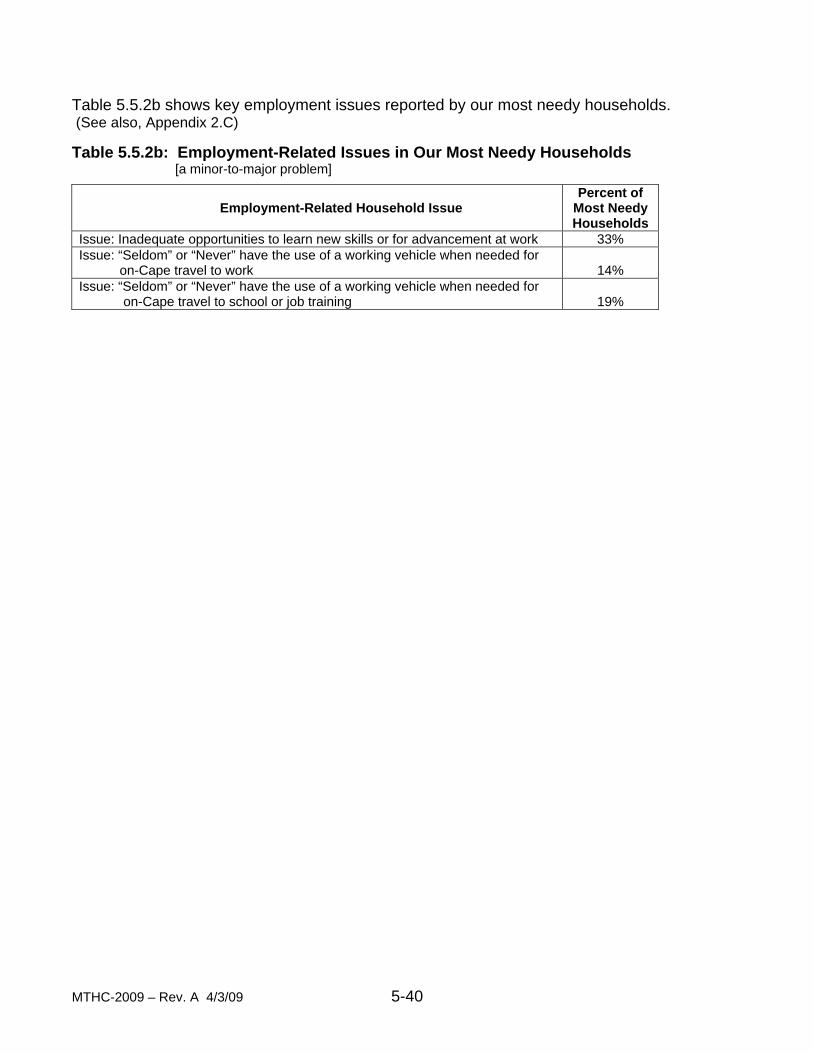
MTHC-2009 – Rev. A 4/3/09 5-40
Table 5.5.2b shows key employment issues reported by our most needy households. (See also, Appendix 2.C) Table 5.5.2b: Employment-Related Issues in Our Most Needy Households [a minor-to-major problem]
Employment-Related Household Issue
Percent of Most Needy Households
Issue: Inadequate opportunities to learn new skills or for advancement at work 33% Issue: “Seldom” or “Never” have the use of a working vehicle when needed for on-Cape travel to work
14%
Issue: “Seldom” or “Never” have the use of a working vehicle when needed for on-Cape travel to school or job training
19%

MTHC-2009 – Rev. A 4/3/09 5-41
Section 5.5 Research Findings – Basic Needs
2. Health & Healthcare
The Cape Cod Community Survey - 2008 responses provide insight into the following health and healthcare-related topics:
• Care giving activities of household members • Fair-to-Poor health condition of household members • Hospital emergency room usage • Households obtaining health insurance through various sources, including;
o Purchased directly from an insurance company o State or federal program (including Medicare A, B, D, Medicaid, VA, etc.) o Through an current or former employer’s (retirement) insurance plan
• Households where health coverage includes prescription drugs. • Households where health insurance coverage includes dental care. • Households with disabled or chronically ill person(s) • Households with members not currently having “health insurance,” including;
o Households with uninsured adults o Households with uninsured children (age 17 or younger)
• Healthcare-related transportation situation
Household Issues and Service Barriers:
Cape Cod Community Survey – 2008 respondents were asked to identify major health and healthcare issues and problems that came up in their household during the previous year. Further, if they tried to obtain help in overcoming any of these problems, what kind of barriers to services did they encounter and how serious were those barriers. The following physical and mental health and healthcare-related issues were reported:
• Adult substance abuse (alcohol, drugs, etc.) • A lot of depression in the household • Children or teenagers experiencing behavioral or emotional problems • Discrimination toward mentally ill person(s) • Experiencing an alcohol and/or drug problem • Experiencing physical conflict in the household • Having a lot of anxiety or stress in the household • Not able to afford nutritious food • Not always having enough money for food • Not being able to afford recreational activities • Not having enough money to pay for the doctor, the dentist, or to buy prescription medications • Paying for a mental health counselor • Paying for or getting dental care • Seriously overweight person(s) in household • Underage smoking/tobacco use • Underage drinking
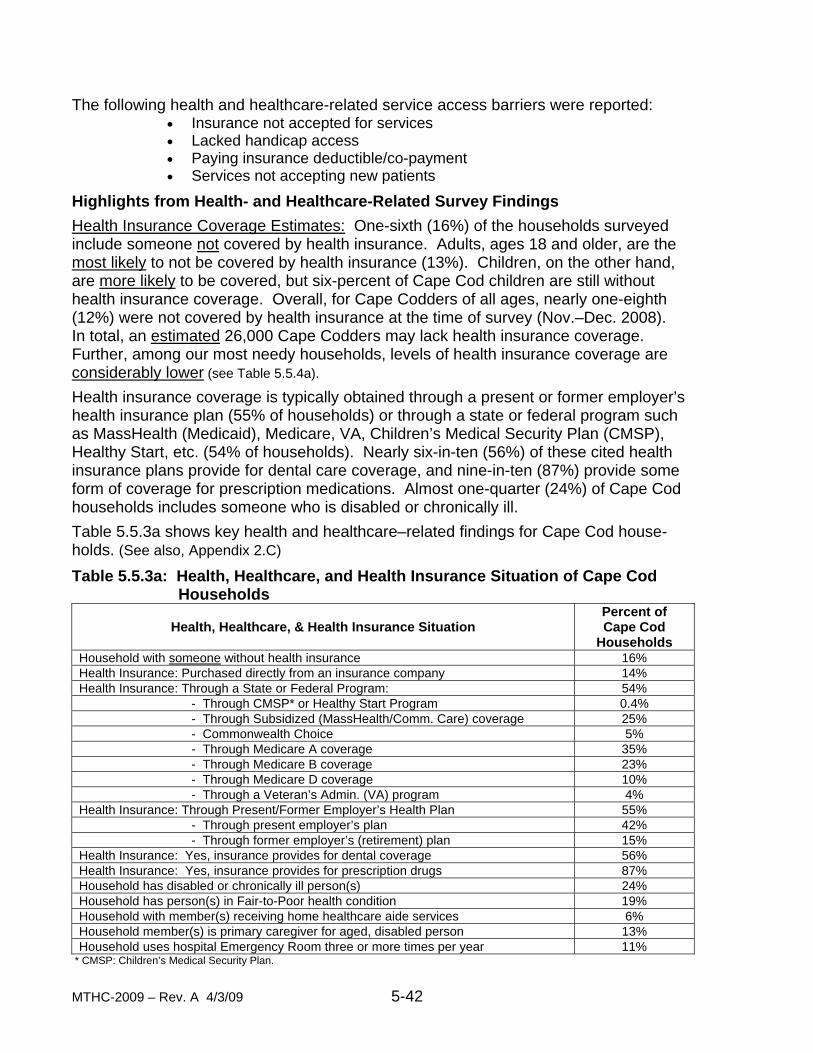
MTHC-2009 – Rev. A 4/3/09 5-42
The following health and healthcare-related service access barriers were reported: • Insurance not accepted for services • Lacked handicap access • Paying insurance deductible/co-payment • Services not accepting new patients
Highlights from Health- and Healthcare-Related Survey Findings
Health Insurance Coverage Estimates: One-sixth (16%) of the households surveyed include someone not covered by health insurance. Adults, ages 18 and older, are the most likely to not be covered by health insurance (13%). Children, on the other hand, are more likely to be covered, but six-percent of Cape Cod children are still without health insurance coverage. Overall, for Cape Codders of all ages, nearly one-eighth (12%) were not covered by health insurance at the time of survey (Nov.–Dec. 2008). In total, an estimated 26,000 Cape Codders may lack health insurance coverage. Further, among our most needy households, levels of health insurance coverage are considerably lower (see Table 5.5.4a).
Health insurance coverage is typically obtained through a present or former employer’s health insurance plan (55% of households) or through a state or federal program such as MassHealth (Medicaid), Medicare, VA, Children’s Medical Security Plan (CMSP), Healthy Start, etc. (54% of households). Nearly six-in-ten (56%) of these cited health insurance plans provide for dental care coverage, and nine-in-ten (87%) provide some form of coverage for prescription medications. Almost one-quarter (24%) of Cape Cod households includes someone who is disabled or chronically ill.
Table 5.5.3a shows key health and healthcare–related findings for Cape Cod house- holds. (See also, Appendix 2.C)
Table 5.5.3a: Health, Healthcare, and Health Insurance Situation of Cape Cod Households
Health, Healthcare, & Health Insurance Situation
Percent of Cape Cod
Households Household with someone without health insurance 16% Health Insurance: Purchased directly from an insurance company 14% Health Insurance: Through a State or Federal Program: 54% - Through CMSP* or Healthy Start Program 0.4% - Through Subsidized (MassHealth/Comm. Care) coverage 25% - Commonwealth Choice 5% - Through Medicare A coverage 35% - Through Medicare B coverage 23% - Through Medicare D coverage 10% - Through a Veteran’s Admin. (VA) program 4% Health Insurance: Through Present/Former Employer’s Health Plan 55% - Through present employer’s plan 42% - Through former employer’s (retirement) plan 15% Health Insurance: Yes, insurance provides for dental coverage 56% Health Insurance: Yes, insurance provides for prescription drugs 87% Household has disabled or chronically ill person(s) 24% Household has person(s) in Fair-to-Poor health condition 19% Household with member(s) receiving home healthcare aide services 6% Household member(s) is primary caregiver for aged, disabled person 13% Household uses hospital Emergency Room three or more times per year 11%
* CMSP: Children’s Medical Security Plan.

MTHC-2009 – Rev. A 4/3/09 5-43
Persons Without Health Insurance Coverage
Estimated Number of ALL Cape Codders**
(English & Non-Eng.) % of Cape Codders without health insurance coverage: (all ages) 11.7% % of Adult(s) without health insurance 12.8% % of Child(ren) without health insurance (age 17 or younger) 5.7%
Cape Codders without health insurance coverage: (all ages) Est. 26,000 Adult(s) without health insurance (age 18 or older) Est. 23,500 Child(ren) without health insurance (age 17 or younger) Est. 2,500
** Coverage is estimated from Cape Cod Community Survey - 2008 responses collected from Cape Cod residents during Nov. - Dec. 2008. Note: MANDATORY health insurance coverage for all Massachusetts residents, became effective on January 1, 2008—eleven months BEFORE the Cape Cod Community Survey - 2008 survey was conducted. Just over one-tenth (12%) of Cape Cod households seldom or never have the use of a suitable vehicle when needed for on-Cape travel to healthcare or social services. Table 5.5.3b shows key health and healthcare–related findings for Cape Cod households. (See also, Appendix 2.C)
Table 5.5.3b: Health and Healthcare-Related Issues and Service Barriers in Cape Cod Households [Issue: minor-to-major, Barrier: moderately serious- to-so serious did not get help]
* Percent of those households where any service barrier was reported.
Health and Healthcare-Related
Issues and Service Barriers
Percent of Cape Cod
Households Issue: Having a lot of anxiety or stress in the household 33% Issue: Paying for or getting dental care 25% Issue: A lot of depression in the household 26% Issue: Not having enough money to pay for the doctor, the dentist, or to buy prescription medications
24%
Issue: Not being able to afford recreational activities 27% Issue: Not always having enough money for food 19% Issue: Adult substance abuse (alcohol, drugs, etc.) 12% Issue: Experiencing an alcohol and/or drug problem 11% Issue: Seriously overweight person(s) in household 13% Issue: Not able to afford nutritious food 14% Issue: Paying for a mental health counselor 9% Issue: Children or teenagers experiencing behavioral or emotional problems
6%
Issue: “Seldom” or “Never” have the use of a working vehicle when needed for on-Cape travel to healthcare/social services
12%
Issue: Experiencing physical conflict in the household 4% Issue: Discrimination toward mentally ill person(s) 3% Issue: Underage drinking 2% Issue: Underage smoking or other tobacco use 2% Issue: Discrimination (due to HIV, AIDS, TB, etc.) 2%
Barrier: Paying insurance deductible/co-payment 45%* Barrier: Service(s) not accepting new patients/clients 45%* Barrier: Insurance not accepted for services 39%* Barrier: Lacked handicap access 9%* Barrier: Feelings of discrimination 19%*
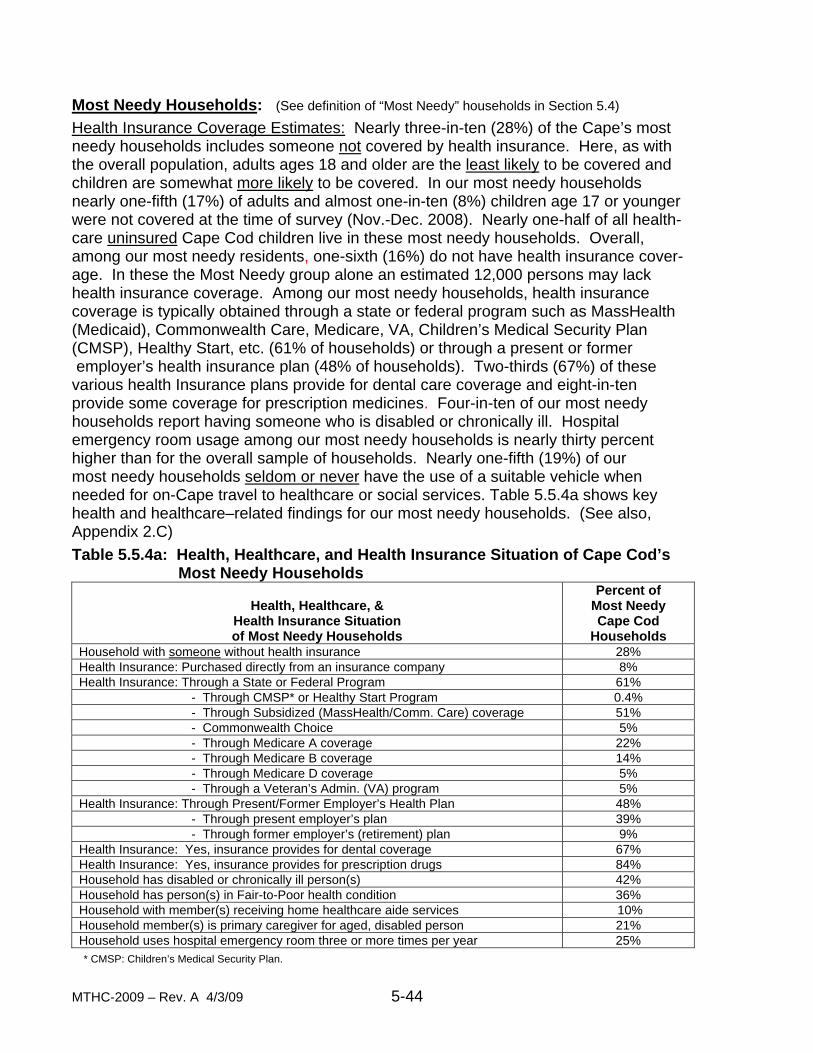
MTHC-2009 – Rev. A 4/3/09 5-44
Most Needy Households: (See definition of “Most Needy” households in Section 5.4)
Health Insurance Coverage Estimates: Nearly three-in-ten (28%) of the Cape’s most needy households includes someone not covered by health insurance. Here, as with the overall population, adults ages 18 and older are the least likely to be covered and children are somewhat more likely to be covered. In our most needy households nearly one-fifth (17%) of adults and almost one-in-ten (8%) children age 17 or younger were not covered at the time of survey (Nov.-Dec. 2008). Nearly one-half of all health- care uninsured Cape Cod children live in these most needy households. Overall, among our most needy residents, one-sixth (16%) do not have health insurance cover- age. In these the Most Needy group alone an estimated 12,000 persons may lack health insurance coverage. Among our most needy households, health insurance coverage is typically obtained through a state or federal program such as MassHealth (Medicaid), Commonwealth Care, Medicare, VA, Children’s Medical Security Plan (CMSP), Healthy Start, etc. (61% of households) or through a present or former employer’s health insurance plan (48% of households). Two-thirds (67%) of these various health Insurance plans provide for dental care coverage and eight-in-ten provide some coverage for prescription medicines. Four-in-ten of our most needy households report having someone who is disabled or chronically ill. Hospital emergency room usage among our most needy households is nearly thirty percent higher than for the overall sample of households. Nearly one-fifth (19%) of our most needy households seldom or never have the use of a suitable vehicle when needed for on-Cape travel to healthcare or social services. Table 5.5.4a shows key health and healthcare–related findings for our most needy households. (See also, Appendix 2.C)
Table 5.5.4a: Health, Healthcare, and Health Insurance Situation of Cape Cod’s Most Needy Households
Health, Healthcare, &
Health Insurance Situation of Most Needy Households
Percent of Most Needy Cape Cod
Households Household with someone without health insurance 28% Health Insurance: Purchased directly from an insurance company 8% Health Insurance: Through a State or Federal Program 61% - Through CMSP* or Healthy Start Program 0.4% - Through Subsidized (MassHealth/Comm. Care) coverage 51% - Commonwealth Choice 5% - Through Medicare A coverage 22% - Through Medicare B coverage 14% - Through Medicare D coverage 5% - Through a Veteran’s Admin. (VA) program 5% Health Insurance: Through Present/Former Employer’s Health Plan 48% - Through present employer’s plan 39% - Through former employer’s (retirement) plan 9% Health Insurance: Yes, insurance provides for dental coverage 67% Health Insurance: Yes, insurance provides for prescription drugs 84% Household has disabled or chronically ill person(s) 42% Household has person(s) in Fair-to-Poor health condition 36% Household with member(s) receiving home healthcare aide services 10% Household member(s) is primary caregiver for aged, disabled person 21% Household uses hospital emergency room three or more times per year 25%
* CMSP: Children’s Medical Security Plan.
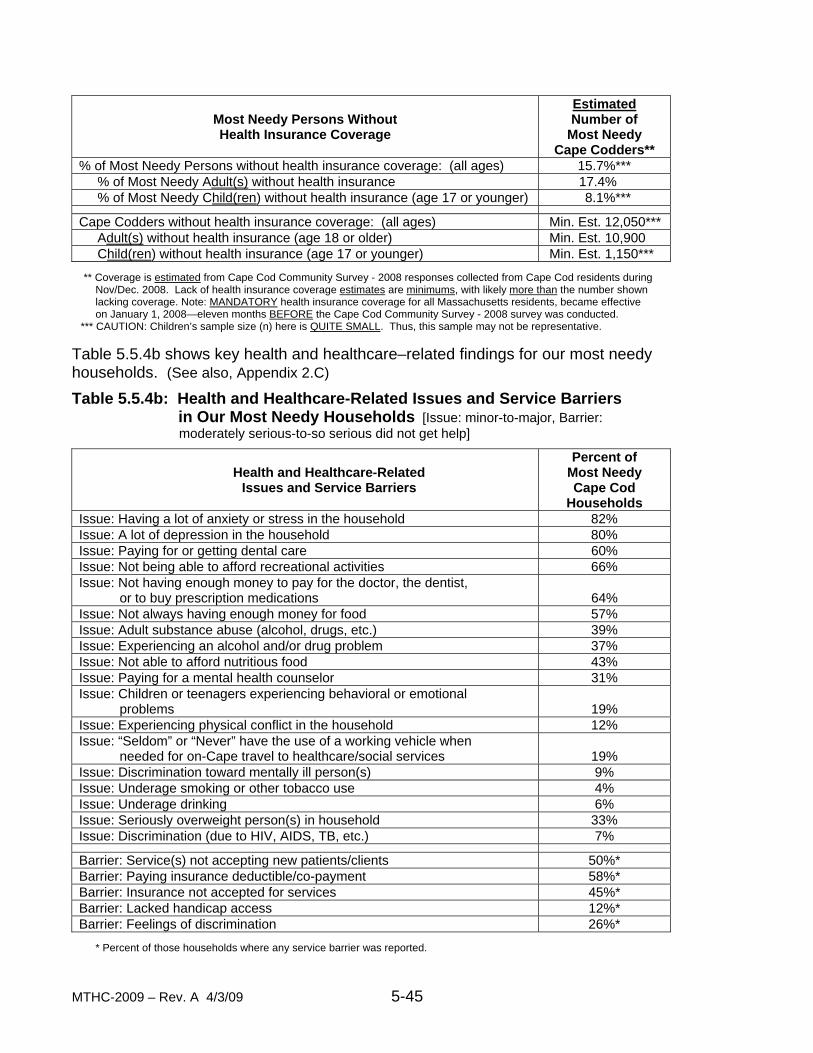
MTHC-2009 – Rev. A 4/3/09 5-45
Most Needy Persons Without Health Insurance Coverage
Estimated Number of
Most Needy Cape Codders**
% of Most Needy Persons without health insurance coverage: (all ages) 15.7%*** % of Most Needy Adult(s) without health insurance 17.4% % of Most Needy Child(ren) without health insurance (age 17 or younger) 8.1%***
Cape Codders without health insurance coverage: (all ages) Min. Est. 12,050*** Adult(s) without health insurance (age 18 or older) Min. Est. 10,900 Child(ren) without health insurance (age 17 or younger) Min. Est. 1,150***
** Coverage is estimated from Cape Cod Community Survey - 2008 responses collected from Cape Cod residents during Nov/Dec. 2008. Lack of health insurance coverage estimates are minimums, with likely more than the number shown lacking coverage. Note: MANDATORY health insurance coverage for all Massachusetts residents, became effective on January 1, 2008—eleven months BEFORE the Cape Cod Community Survey - 2008 survey was conducted. *** CAUTION: Children’s sample size (n) here is QUITE SMALL. Thus, this sample may not be representative. Table 5.5.4b shows key health and healthcare–related findings for our most needy households. (See also, Appendix 2.C)
Table 5.5.4b: Health and Healthcare-Related Issues and Service Barriers in Our Most Needy Households [Issue: minor-to-major, Barrier: moderately serious-to-so serious did not get help]
Health and Healthcare-Related
Issues and Service Barriers
Percent of Most Needy Cape Cod
Households Issue: Having a lot of anxiety or stress in the household 82% Issue: A lot of depression in the household 80% Issue: Paying for or getting dental care 60% Issue: Not being able to afford recreational activities 66% Issue: Not having enough money to pay for the doctor, the dentist, or to buy prescription medications
64%
Issue: Not always having enough money for food 57% Issue: Adult substance abuse (alcohol, drugs, etc.) 39% Issue: Experiencing an alcohol and/or drug problem 37% Issue: Not able to afford nutritious food 43% Issue: Paying for a mental health counselor 31% Issue: Children or teenagers experiencing behavioral or emotional problems
19%
Issue: Experiencing physical conflict in the household 12% Issue: “Seldom” or “Never” have the use of a working vehicle when needed for on-Cape travel to healthcare/social services
19%
Issue: Discrimination toward mentally ill person(s) 9% Issue: Underage smoking or other tobacco use 4% Issue: Underage drinking 6% Issue: Seriously overweight person(s) in household 33% Issue: Discrimination (due to HIV, AIDS, TB, etc.) 7%
Barrier: Service(s) not accepting new patients/clients 50%* Barrier: Paying insurance deductible/co-payment 58%* Barrier: Insurance not accepted for services 45%* Barrier: Lacked handicap access 12%* Barrier: Feelings of discrimination 26%*
* Percent of those households where any service barrier was reported.

MTHC-2009 – Rev. A 4/3/09 5-46
MTHC-2009 – Rev. A 4/3/09 5-47
Section 5.5 Research Findings – Basic Needs
3. Housing
The Cape Cod Community Survey - 2008 responses shed light on the following housing-related topics:
• Amount of housing stock in need of repairs to be truly “habitable” • Amount paid out each month for “housing” • Not having enough money to pay for housing • Number of “homelessness” households • Number of households receiving PRIVATE charity $ for housing costs • Number of owner and renter households • Number of rentals that include electricity, heat, or both • Percent of gross income going to pay for housing (rent or mortgage payment) • Subsidization of rental units • Type of housing, including;
o Assisted living unit o Group house or homeless shelter o House or condo o Hotel/motel/inn/rooming house o On the street o Senior housing o Temporarily with friends or family
• Plus, a broad range of detailed rental housing affordability issues (See Section 5.9 Special Focus on Rental Housing and 5.10 Special Focus on Homeownership)
Household Issues and Service Barriers:
Cape Cod Community Survey - 2008 respondents were asked to identify major housing-related issues and problems that came up in their household during the previous year. Further, if they tried to obtain help in overcoming these problems, what kind of barriers to services did they encounter and how serious were these barriers. The following housing-related issues were reported:
• Discrimination • Inability to afford housing • Overcrowding in their household
Highlights from Housing-Related Survey Findings
Seven-in-ten (70%) of households on Cape Cod own their home. One-fifth (20%) rent their housing. “Homelessness” (self-defined) affects individuals in about six percent of Cape Cod households. The average household pays out between $800 and $999 per month for their housing (either rent or mortgage). Residents report that about one-in- every twenty (4%) homes is in need of major repair in order to make it truly habitable. PRIVATE charity-provided financial assistance for housing-related issues (rent pay- ments, help with utility bills, etc.) was received by just a few (3%) Cape households. Further, of the sample of households reporting having received any PRIVATE assistance/cash in the prior year, nearly three-quarters (73%) said the money received was spent on housing, heating, or utilities.

MTHC-2009 – Rev. A 4/3/09 5-48
Table 5.5.5 shows key housing–related findings for Cape Cod households. (See also, Appendix 2.C)
Table 5.5.5a: Housing Situation of Cape Cod Households
Housing Situation
Percent of Cape Cod Households
Home Owner Households 70% Renter Households: 20% Of renter households, percent where rent includes electricity 49% Of renter households, percent where rent includes heat 52% Living temporarily with friends or relatives 1% “Homeless” Households 6% Unrelated Group Households (group home, shelters, jail, etc.) 4% Living in Senior Housing or Assisted Living Unit 1% Median Monthly Housing Payment [median means 1/2 below - 1/2 above] $800-$999 Total Housing Payments as % of Gross Income 20% Household’s housing unit needs major repair to make it truly habitable 4% Any household member been “homeless” for more than 1-2 days? Yes 7% Households having received a PRIVATE charity emergency money grant for housing in past 12 months
3%
Table 5.5.5b shows key housing–related findings for Cape Cod households. (See also, Appendix 2.C)
Table 5.5.5b: Housing-Related Issues and Service Barriers in Cape Cod Households [Issue: minor-to-major, Barrier: moderately serious-to-so serious did not get help]
Housing-Related Issues and Service Barriers
Percent of Cape Cod Households
Issue: Not enough room in your house for all the people who live there 7% Issue: Not able to find appropriate senior (65+) housing 3% Issue: Reported some sort of discrimination problem: 10%
Issue: Discrimination (due to race, age, language, sexual identity/- orientation, etc.)
7%
Issue: Discrimination toward mentally ill person(s) 3% Issue: Discrimination (due to HIV, AIDS, TB etc.) 2%
Barrier: Feelings of discrimination 19%*
* Percent of those households where any service barrier was reported. Most Needy Households: (See definition of “Most Needy” households in Section 5.4)
Four-in-ten (44%) of the most needy households on Cape Cod own their home. One-third (33%) rent their housing. “Homelessness” (self-defined) affects individuals in sixteen percent of these households. The average most needy household pays out between $1,000 and $1,249 per month for their housing (either rent or mortgage). These residents report that about one-in-every ten of their homes is in need of major repair in order to make it truly habitable. PRIVATE charity-based financial assistance for housing-related issues (rent payments, help with utility bills, etc.) was received by one-in-ten (9%) of our most needy households. Further, of the sample of most needy households reporting having received any PRIVATE assistance/cash grants in the prior year, three-quarters (74%) said the money received was spent on housing, heating, or utilities.
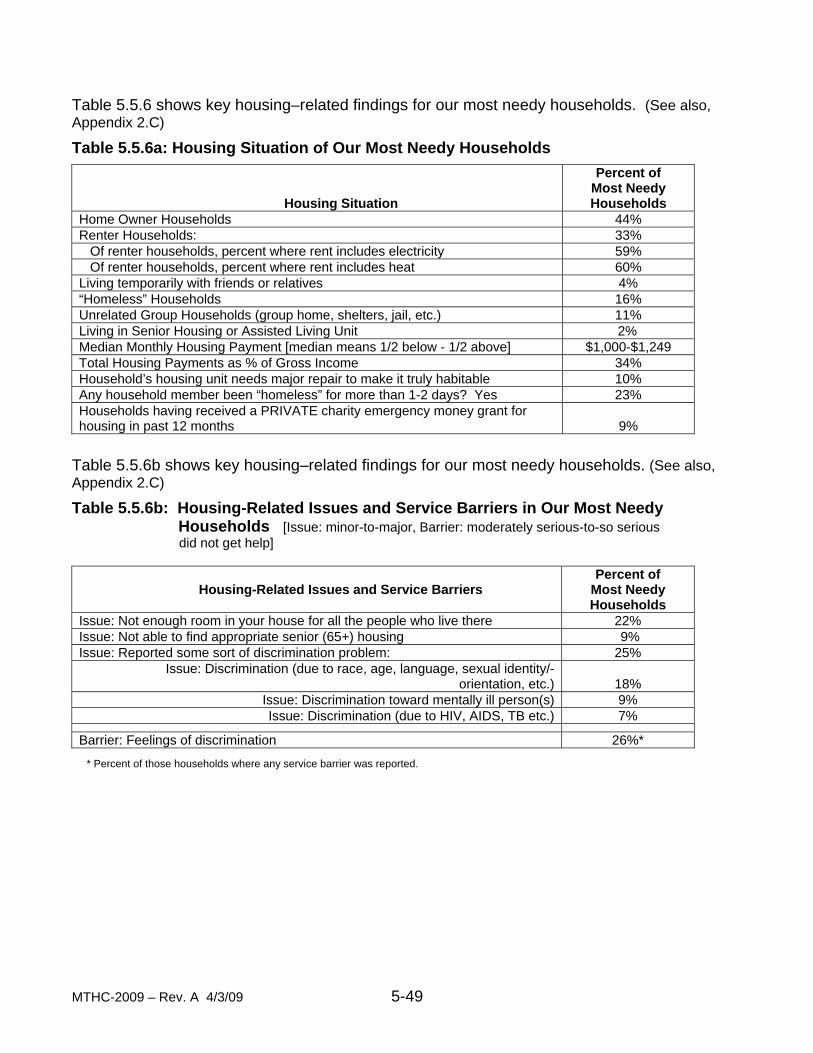
MTHC-2009 – Rev. A 4/3/09 5-49
Table 5.5.6 shows key housing–related findings for our most needy households. (See also, Appendix 2.C)
Table 5.5.6a: Housing Situation of Our Most Needy Households
Housing Situation
Percent of Most Needy Households
Home Owner Households 44% Renter Households: 33% Of renter households, percent where rent includes electricity 59% Of renter households, percent where rent includes heat 60% Living temporarily with friends or relatives 4% “Homeless” Households 16% Unrelated Group Households (group home, shelters, jail, etc.) 11% Living in Senior Housing or Assisted Living Unit 2% Median Monthly Housing Payment [median means 1/2 below - 1/2 above] $1,000-$1,249 Total Housing Payments as % of Gross Income 34% Household’s housing unit needs major repair to make it truly habitable 10% Any household member been “homeless” for more than 1-2 days? Yes 23% Households having received a PRIVATE charity emergency money grant for housing in past 12 months
9%
Table 5.5.6b shows key housing–related findings for our most needy households. (See also, Appendix 2.C)
Table 5.5.6b: Housing-Related Issues and Service Barriers in Our Most Needy Households [Issue: minor-to-major, Barrier: moderately serious-to-so serious did not get help]
Housing-Related Issues and Service Barriers
Percent of Most Needy Households
Issue: Not enough room in your house for all the people who live there 22% Issue: Not able to find appropriate senior (65+) housing 9% Issue: Reported some sort of discrimination problem: 25%
Issue: Discrimination (due to race, age, language, sexual identity/- orientation, etc.)
18%
Issue: Discrimination toward mentally ill person(s) 9% Issue: Discrimination (due to HIV, AIDS, TB etc.) 7%
Barrier: Feelings of discrimination 26%*
* Percent of those households where any service barrier was reported.

MTHC-2009 – Rev. A 4/3/09 5-50
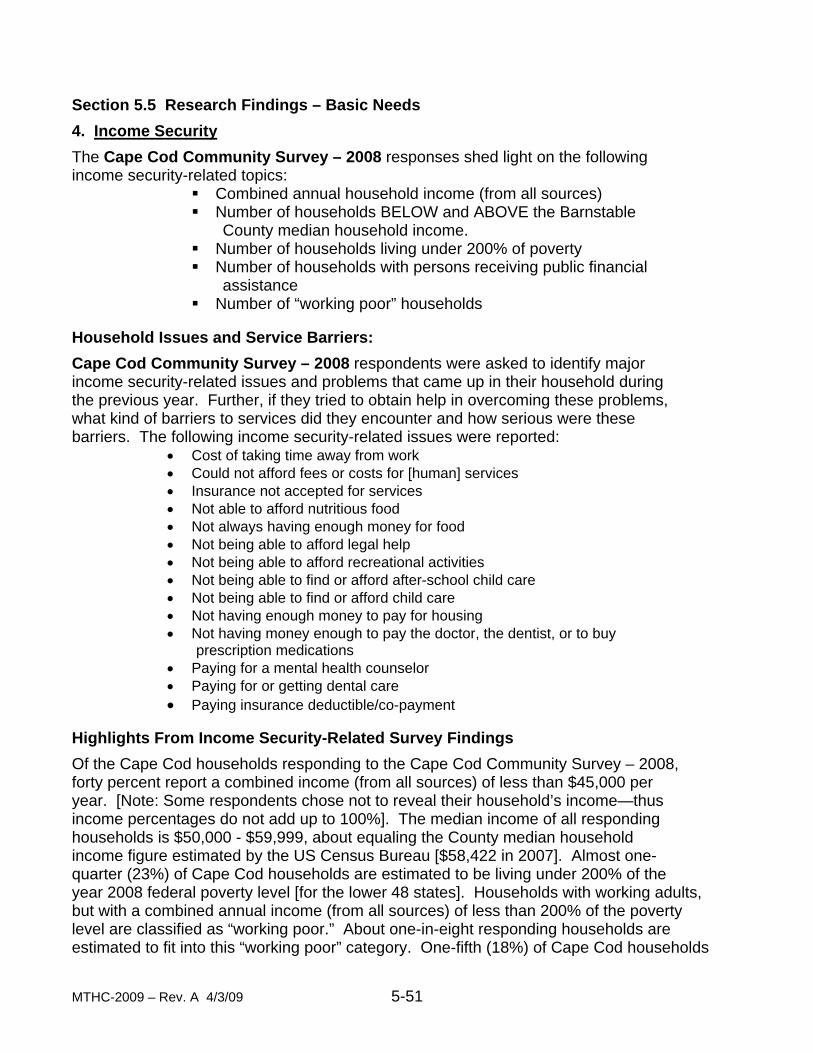
MTHC-2009 – Rev. A 4/3/09 5-51
Section 5.5 Research Findings – Basic Needs
4. Income Security
The Cape Cod Community Survey – 2008 responses shed light on the following income security-related topics:
Combined annual household income (from all sources) Number of households BELOW and ABOVE the Barnstable
County median household income. Number of households living under 200% of poverty Number of households with persons receiving public financial
assistance Number of “working poor” households
Household Issues and Service Barriers:
Cape Cod Community Survey – 2008 respondents were asked to identify major income security-related issues and problems that came up in their household during the previous year. Further, if they tried to obtain help in overcoming these problems, what kind of barriers to services did they encounter and how serious were these barriers. The following income security-related issues were reported:
• Cost of taking time away from work • Could not afford fees or costs for [human] services • Insurance not accepted for services • Not able to afford nutritious food • Not always having enough money for food • Not being able to afford legal help • Not being able to afford recreational activities • Not being able to find or afford after-school child care • Not being able to find or afford child care • Not having enough money to pay for housing • Not having money enough to pay the doctor, the dentist, or to buy prescription medications • Paying for a mental health counselor • Paying for or getting dental care • Paying insurance deductible/co-payment
Highlights From Income Security-Related Survey Findings
Of the Cape Cod households responding to the Cape Cod Community Survey – 2008, forty percent report a combined income (from all sources) of less than $45,000 per year. [Note: Some respondents chose not to reveal their household’s income—thus income percentages do not add up to 100%]. The median income of all responding households is $50,000 - $59,999, about equaling the County median household income figure estimated by the US Census Bureau [$58,422 in 2007]. Almost one- quarter (23%) of Cape Cod households are estimated to be living under 200% of the year 2008 federal poverty level [for the lower 48 states]. Households with working adults, but with a combined annual income (from all sources) of less than 200% of the poverty level are classified as “working poor.” About one-in-eight responding households are estimated to fit into this “working poor” category. One-fifth (18%) of Cape Cod households
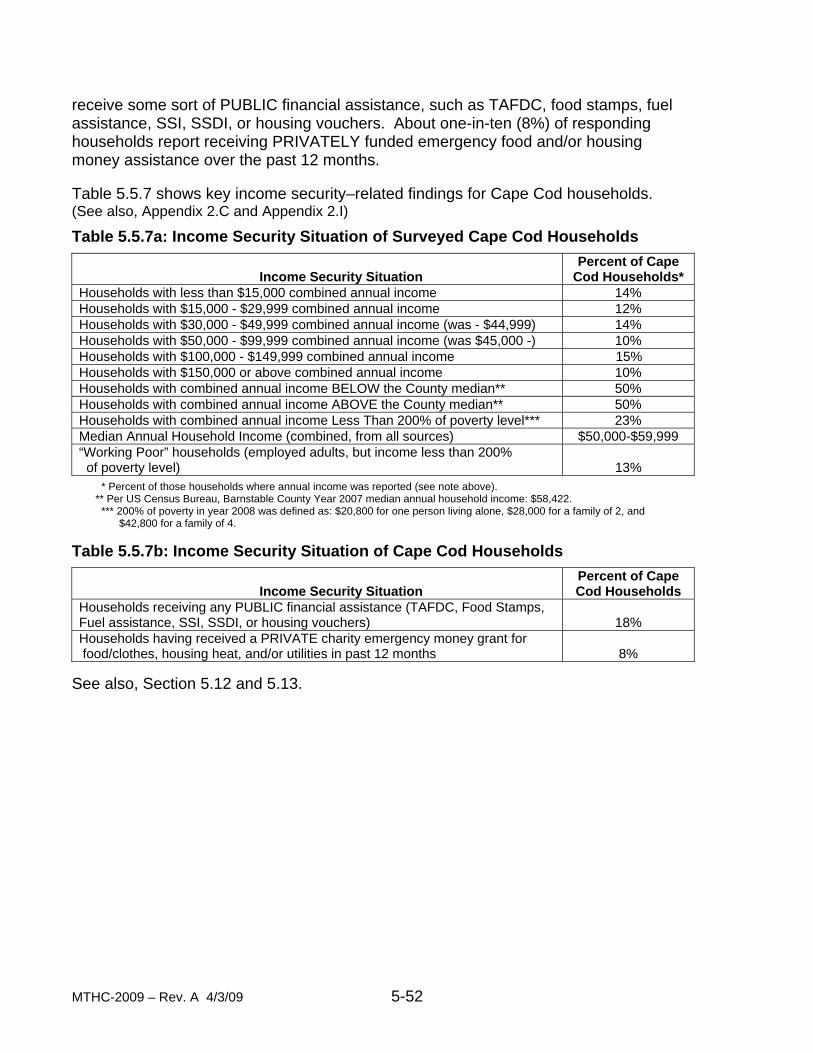
MTHC-2009 – Rev. A 4/3/09 5-52
receive some sort of PUBLIC financial assistance, such as TAFDC, food stamps, fuel assistance, SSI, SSDI, or housing vouchers. About one-in-ten (8%) of responding households report receiving PRIVATELY funded emergency food and/or housing money assistance over the past 12 months.
Table 5.5.7 shows key income security–related findings for Cape Cod households. (See also, Appendix 2.C and Appendix 2.I)
Table 5.5.7a: Income Security Situation of Surveyed Cape Cod Households
Income Security Situation
Percent of Cape Cod Households*
Households with less than $15,000 combined annual income 14% Households with $15,000 - $29,999 combined annual income 12% Households with $30,000 - $49,999 combined annual income (was - $44,999) 14% Households with $50,000 - $99,999 combined annual income (was $45,000 -) 10% Households with $100,000 - $149,999 combined annual income 15% Households with $150,000 or above combined annual income 10% Households with combined annual income BELOW the County median** 50% Households with combined annual income ABOVE the County median** 50% Households with combined annual income Less Than 200% of poverty level*** 23% Median Annual Household Income (combined, from all sources) $50,000-$59,999 “Working Poor” households (employed adults, but income less than 200% of poverty level)
13%
* Percent of those households where annual income was reported (see note above). ** Per US Census Bureau, Barnstable County Year 2007 median annual household income: $58,422. *** 200% of poverty in year 2008 was defined as: $20,800 for one person living alone, $28,000 for a family of 2, and $42,800 for a family of 4.
Table 5.5.7b: Income Security Situation of Cape Cod Households
Income Security Situation
Percent of Cape Cod Households
Households receiving any PUBLIC financial assistance (TAFDC, Food Stamps, Fuel assistance, SSI, SSDI, or housing vouchers)
18%
Households having received a PRIVATE charity emergency money grant for food/clothes, housing heat, and/or utilities in past 12 months
8%
See also, Section 5.12 and 5.13.
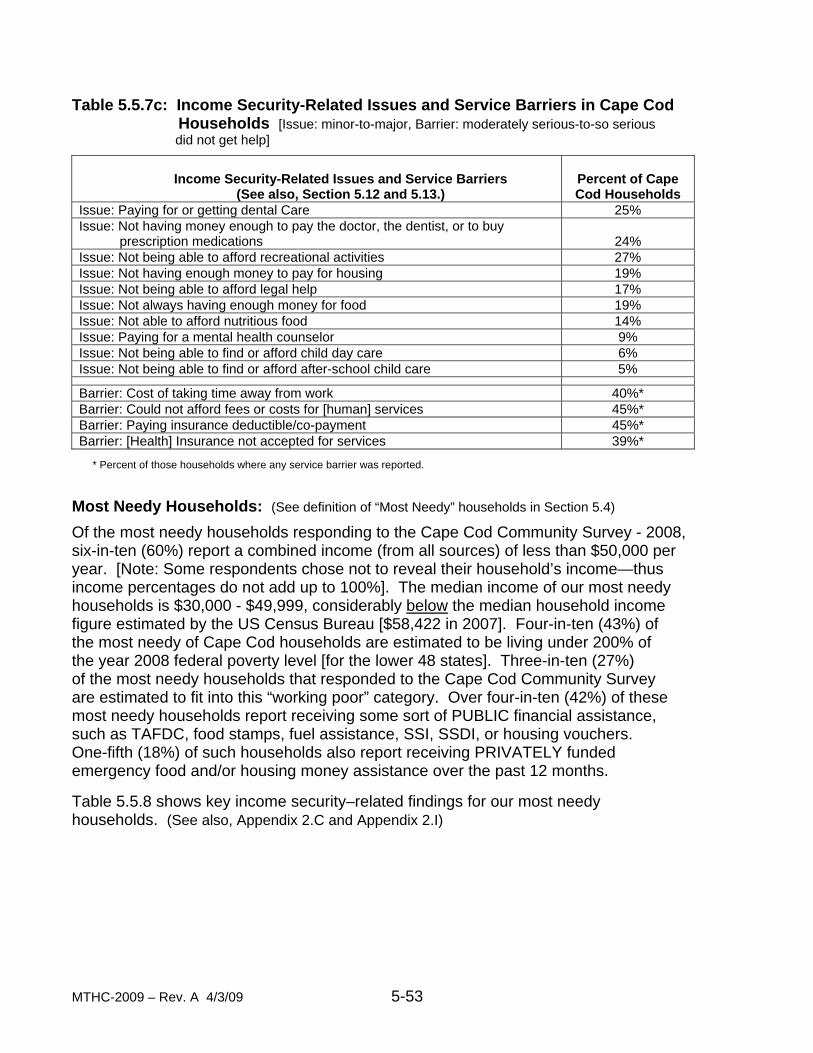
MTHC-2009 – Rev. A 4/3/09 5-53
Table 5.5.7c: Income Security-Related Issues and Service Barriers in Cape Cod Households [Issue: minor-to-major, Barrier: moderately serious-to-so serious did not get help]
Income Security-Related Issues and Service Barriers
(See also, Section 5.12 and 5.13.)
Percent of Cape Cod Households
Issue: Paying for or getting dental Care 25% Issue: Not having money enough to pay the doctor, the dentist, or to buy prescription medications
24%
Issue: Not being able to afford recreational activities 27% Issue: Not having enough money to pay for housing 19% Issue: Not being able to afford legal help 17% Issue: Not always having enough money for food 19% Issue: Not able to afford nutritious food 14% Issue: Paying for a mental health counselor 9% Issue: Not being able to find or afford child day care 6% Issue: Not being able to find or afford after-school child care 5%
Barrier: Cost of taking time away from work 40%* Barrier: Could not afford fees or costs for [human] services 45%* Barrier: Paying insurance deductible/co-payment 45%* Barrier: [Health] Insurance not accepted for services 39%*
* Percent of those households where any service barrier was reported.
Most Needy Households: (See definition of “Most Needy” households in Section 5.4)
Of the most needy households responding to the Cape Cod Community Survey - 2008, six-in-ten (60%) report a combined income (from all sources) of less than $50,000 per year. [Note: Some respondents chose not to reveal their household’s income—thus income percentages do not add up to 100%]. The median income of our most needy households is $30,000 - $49,999, considerably below the median household income figure estimated by the US Census Bureau [$58,422 in 2007]. Four-in-ten (43%) of the most needy of Cape Cod households are estimated to be living under 200% of the year 2008 federal poverty level [for the lower 48 states]. Three-in-ten (27%) of the most needy households that responded to the Cape Cod Community Survey are estimated to fit into this “working poor” category. Over four-in-ten (42%) of these most needy households report receiving some sort of PUBLIC financial assistance, such as TAFDC, food stamps, fuel assistance, SSI, SSDI, or housing vouchers. One-fifth (18%) of such households also report receiving PRIVATELY funded emergency food and/or housing money assistance over the past 12 months. Table 5.5.8 shows key income security–related findings for our most needy households. (See also, Appendix 2.C and Appendix 2.I)

MTHC-2009 – Rev. A 4/3/09 5-54
Table 5.5.8a: Income Security Situation of Surveyed Most Needy Households
Income Security Situation
Percent of Most Needy Households*
Households with less than $15,000 combined annual income 30% Households with $15,000 - $29,999 combined annual income 15% Households with $30,000 - $49,999 combined annual income (was “- $44,999”) 15% Households with $50,000 - $99,999 combined annual income (was “$45,000 –“) 8% Households with $100,000 - $149,999 combined annual income 7% Households with $150,000 or above combined annual income 4% Households with combined annual income BELOW the County median** 68% Households with combined annual income ABOVE the County median** 32% Households with combined annual income Less Than 200% of poverty level*** 43% Median Annual Household Income (combined, from all sources) $30,000-$49,999 “Working Poor” households (employed adults, but income less than 200% of poverty level)
27%
* Percent of those households where annual income was reported. ** Per US Census Bureau, Barnstable County Year 2007 median annual household income: $58,422. *** 200% of poverty in year 2008 was defined as: $20,800 for one person living alone, $28,000 for a family of 2, and $42,800 for a family of 4. Table 5.5.8b: Income Security Situation of Surveyed Most Needy Households
Income Security Situation
Percent of Most Needy Households
Households receiving any PUBLIC financial assistance (TAFDC, Food Stamps, Fuel assistance, SSI, SSDI, or housing vouchers)
42%
Households having received a PRIVATE charity emergency money grant for food/clothes, housing heat, and/or utilities in past 12 months
18%
Table 5.5.8c: Income Security-Related Issues and Service Barriers in Our Most Needy Households [Issue: minor-to-major, Barrier: moderately serious-to-so serious did not get help]
Income Security-Related Issues and Service Barriers (See also, Section 5.12 and 5.13.)
Percent of Most Needy Cape Cod
Households Issue: Not being able to afford recreational activities 66% Issue: Not having money enough to pay the doctor, the dentist, or to buy prescription medications
64%
Issue: Not having enough money to pay for housing 54% Issue: Paying for or getting dental care 60% Issue: Not being able to afford legal help 47% Issue: Not always having enough money for food 57% Issue: Not able to afford nutritious food 43% Issue: Paying for a mental health counselor 31% Issue: Not being able to find or afford child day care 17% Issue: Not being able to find or afford after-school child care 15%
Barrier: Cost of taking time away from work 53%* Barrier: Could not afford fees or costs for [human] services 60%* Barrier: Paying insurance deductible/co-payment 58%* Barrier: [Health] Insurance not accepted for services 45%*
* Percent of those households where any service barrier was reported.
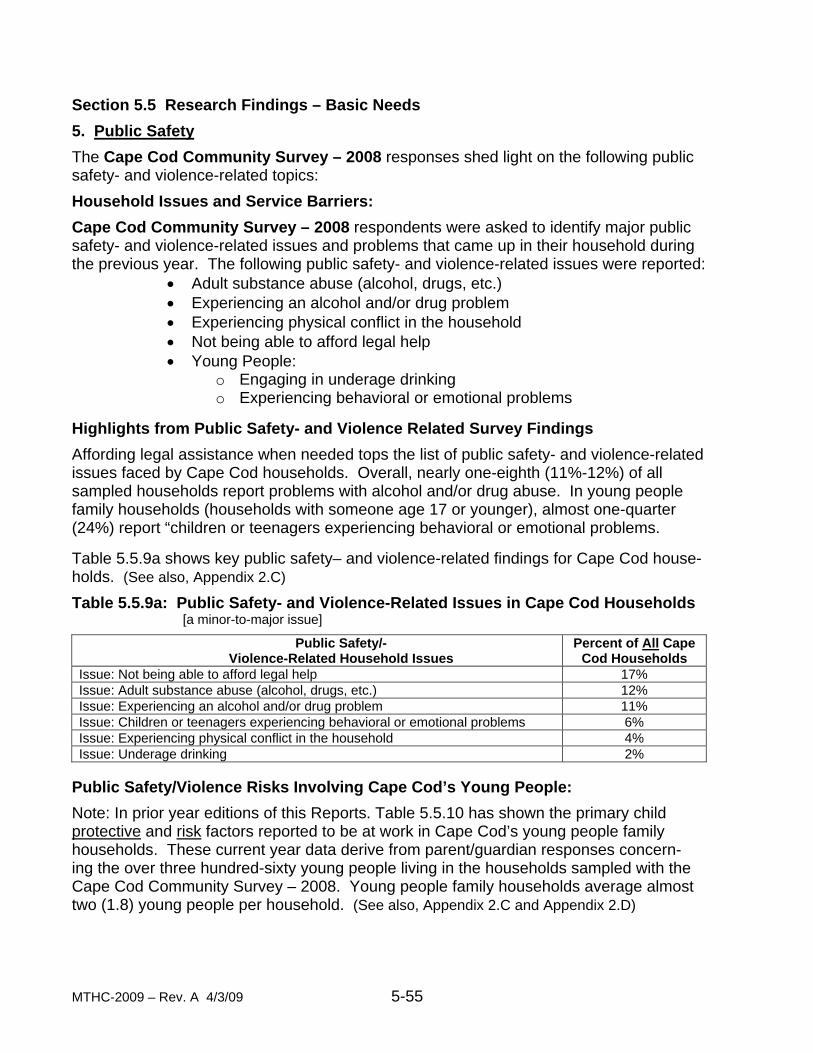
MTHC-2009 – Rev. A 4/3/09 5-55
Section 5.5 Research Findings – Basic Needs
5. Public Safety
The Cape Cod Community Survey – 2008 responses shed light on the following public safety- and violence-related topics:
Household Issues and Service Barriers:
Cape Cod Community Survey – 2008 respondents were asked to identify major public safety- and violence-related issues and problems that came up in their household during the previous year. The following public safety- and violence-related issues were reported:
• Adult substance abuse (alcohol, drugs, etc.) • Experiencing an alcohol and/or drug problem • Experiencing physical conflict in the household • Not being able to afford legal help • Young People:
o Engaging in underage drinking o Experiencing behavioral or emotional problems
Highlights from Public Safety- and Violence Related Survey Findings
Affording legal assistance when needed tops the list of public safety- and violence-related issues faced by Cape Cod households. Overall, nearly one-eighth (11%-12%) of all sampled households report problems with alcohol and/or drug abuse. In young people family households (households with someone age 17 or younger), almost one-quarter (24%) report “children or teenagers experiencing behavioral or emotional problems. Table 5.5.9a shows key public safety– and violence-related findings for Cape Cod house- holds. (See also, Appendix 2.C)
Table 5.5.9a: Public Safety- and Violence-Related Issues in Cape Cod Households [a minor-to-major issue]
Public Safety/- Violence-Related Household Issues
Percent of All Cape Cod Households
Issue: Not being able to afford legal help 17% Issue: Adult substance abuse (alcohol, drugs, etc.) 12% Issue: Experiencing an alcohol and/or drug problem 11% Issue: Children or teenagers experiencing behavioral or emotional problems 6% Issue: Experiencing physical conflict in the household 4% Issue: Underage drinking 2%
Public Safety/Violence Risks Involving Cape Cod’s Young People:
Note: In prior year editions of this Reports. Table 5.5.10 has shown the primary child protective and risk factors reported to be at work in Cape Cod’s young people family households. These current year data derive from parent/guardian responses concern- ing the over three hundred-sixty young people living in the households sampled with the Cape Cod Community Survey – 2008. Young people family households average almost two (1.8) young people per household. (See also, Appendix 2.C and Appendix 2.D)
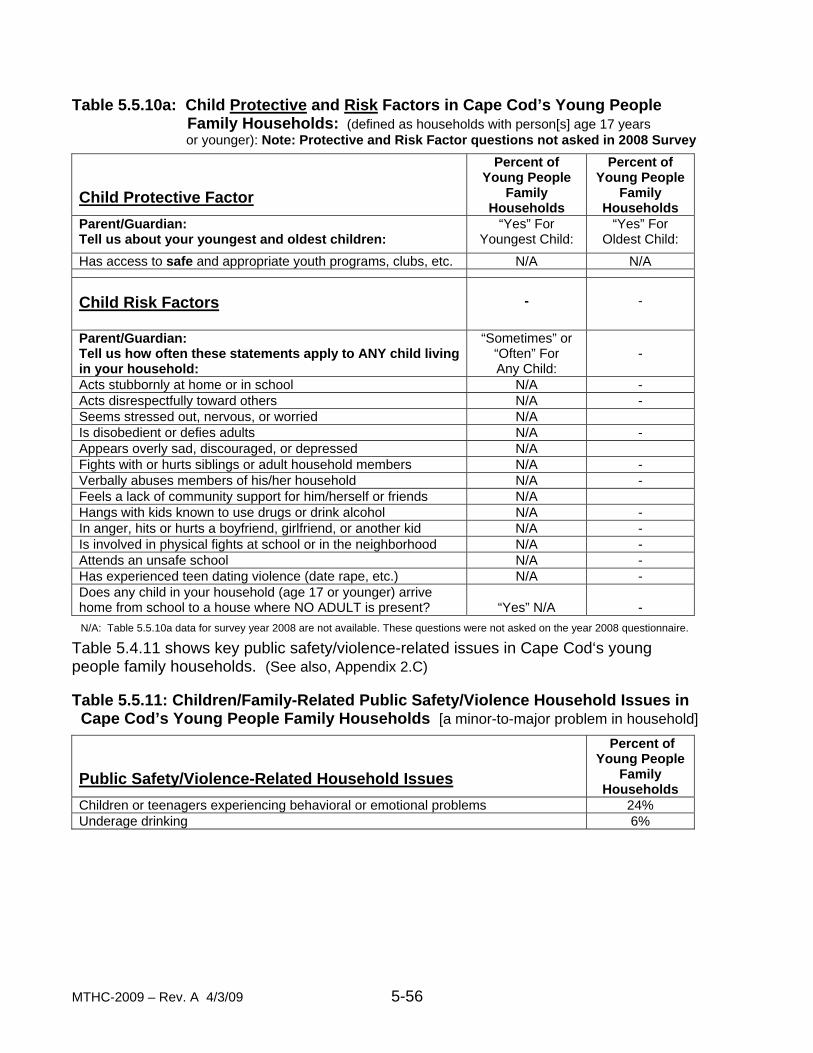
MTHC-2009 – Rev. A 4/3/09 5-56
Table 5.5.10a: Child Protective and Risk Factors in Cape Cod’s Young People Family Households: (defined as households with person[s] age 17 years
or younger): Note: Protective and Risk Factor questions not asked in 2008 Survey
Child Protective Factor
Percent of Young People
Family Households
Percent of Young People
Family Households
Parent/Guardian: Tell us about your youngest and oldest children:
“Yes” For Youngest Child:
“Yes” For Oldest Child:
Has access to safe and appropriate youth programs, clubs, etc. N/A N/A
Child Risk Factors
-
-
Parent/Guardian: Tell us how often these statements apply to ANY child living in your household:
“Sometimes” or “Often” For Any Child:
-
Acts stubbornly at home or in school N/A - Acts disrespectfully toward others N/A - Seems stressed out, nervous, or worried N/A Is disobedient or defies adults N/A - Appears overly sad, discouraged, or depressed N/A Fights with or hurts siblings or adult household members N/A - Verbally abuses members of his/her household N/A - Feels a lack of community support for him/herself or friends N/A Hangs with kids known to use drugs or drink alcohol N/A - In anger, hits or hurts a boyfriend, girlfriend, or another kid N/A - Is involved in physical fights at school or in the neighborhood N/A - Attends an unsafe school N/A - Has experienced teen dating violence (date rape, etc.) N/A - Does any child in your household (age 17 or younger) arrive home from school to a house where NO ADULT is present?
“Yes” N/A
-
N/A: Table 5.5.10a data for survey year 2008 are not available. These questions were not asked on the year 2008 questionnaire.
Table 5.4.11 shows key public safety/violence-related issues in Cape Cod‘s young people family households. (See also, Appendix 2.C)
Table 5.5.11: Children/Family-Related Public Safety/Violence Household Issues in Cape Cod’s Young People Family Households [a minor-to-major problem in household]
Public Safety/Violence-Related Household Issues
Percent of Young People
Family Households
Children or teenagers experiencing behavioral or emotional problems 24% Underage drinking 6%

MTHC-2009 – Rev. A 4/3/09 5-57
Most Needy Households: (See definition of “Most Needy” households in Section 5.4)
Not being able to afford legal assistance when needed is reported by about one-half (47%) of our most needy households. Overall, four-in-ten (37%-39%) of most needy households report problems with alcohol and/or drug abuse. In the most needy young people family households, almost one-half (46%) report “children/teenagers experiencing behavioral or emotional problems.” Table 5.5.12 shows key public safety- and violence-related findings for Cape Cod’s most needy young people family households. (See also, Appendix 2.C) Table 5.5.12: Public Safety- and Violence-Related Issues in Cape Cod’s Most Needy Households [a minor-to-major issue]
Public Safety/-
Violence-Related Household Issues
Percent of ALL Most Needy
Households Issue: Not being able to afford legal help 47% Issue: Adult substance abuse (alcohol, drugs, etc.) 39% Issue: Experiencing an alcohol and/or drug problem 37% Issue: Children or teenagers experiencing behavioral or emotional problems 19% Issue: Experiencing physical conflict in the household 12% Issue: Underage drinking 6%
Public Safety/Violence Risks Involving Young People Living in Cape Cod’s Most Needy Family Households:
Respondents from eighty-six of the most needy young people family households on Cape Cod were sampled with the Cape Cod Community Survey – 2008.
Note: In prior year Reports. Table 5.5.13 has shown the primary child protective and risk factors at work in our most needy young people family households. These present year data derive from responses by parents/guardians of the nearly one hundred-fifty persons age 17 or younger living in these households. These households also average nearly two (1.7) young people per household. (See also, Appendix 2.C and Appendix 2.C) Table 5.5.13: Child Protective and Risk Factors in Cape Cod’s Most Needy Young People Family Households Note: Protective and Risk Factor questions not asked in 2008 Survey
Child Protective Factor
Percent of Most Needy
Young People Family
Households
Percent of Most Needy
Young People Family
Households Parent/Guardian: Tell us about your youngest and oldest children:
“Yes” For Youngest Child:
“Yes” For Oldest Child:
Has access to safe and appropriate youth programs, clubs, etc. N/A N/A Child Risk Factors
Percent of Most Needy
Young People Family
Households
Percent of Most Needy
Young People Family
Households Parent/Guardian: Tell us how often these statements apply to ANY child living in your household:
“Sometimes” or “Often” For Any Child:
-
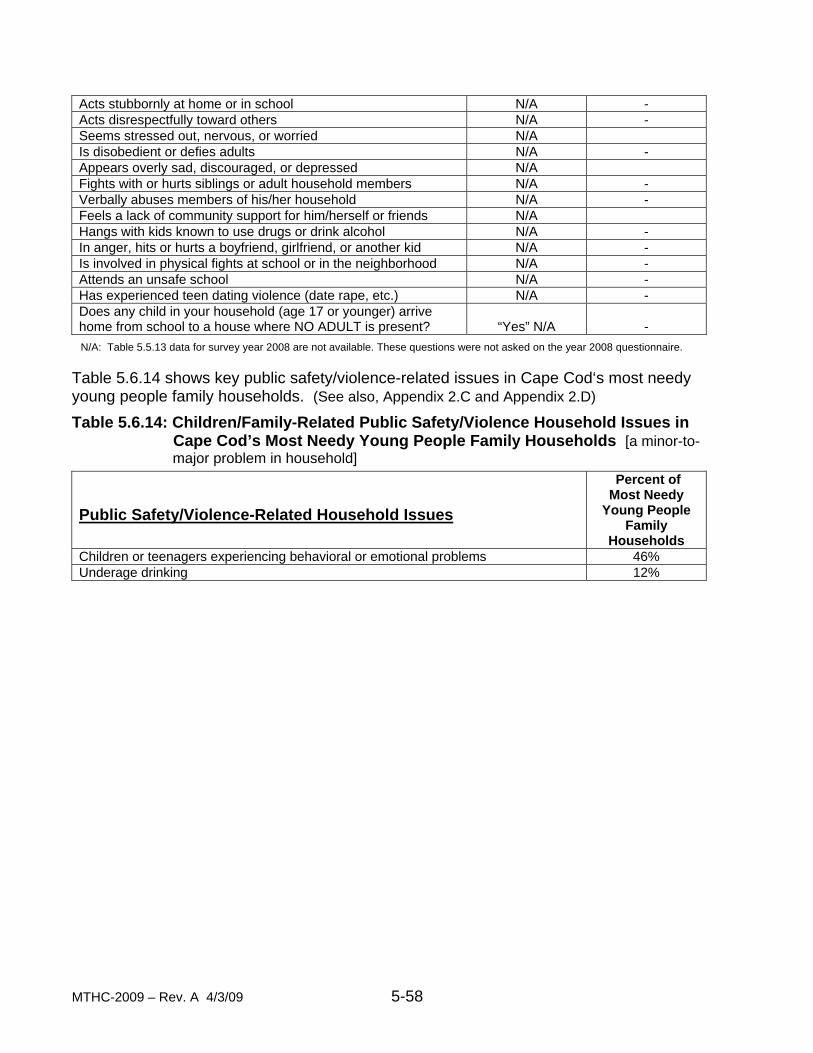
MTHC-2009 – Rev. A 4/3/09 5-58
Acts stubbornly at home or in school N/A - Acts disrespectfully toward others N/A - Seems stressed out, nervous, or worried N/A Is disobedient or defies adults N/A - Appears overly sad, discouraged, or depressed N/A Fights with or hurts siblings or adult household members N/A - Verbally abuses members of his/her household N/A - Feels a lack of community support for him/herself or friends N/A Hangs with kids known to use drugs or drink alcohol N/A - In anger, hits or hurts a boyfriend, girlfriend, or another kid N/A - Is involved in physical fights at school or in the neighborhood N/A - Attends an unsafe school N/A - Has experienced teen dating violence (date rape, etc.) N/A - Does any child in your household (age 17 or younger) arrive home from school to a house where NO ADULT is present?
“Yes” N/A
-
N/A: Table 5.5.13 data for survey year 2008 are not available. These questions were not asked on the year 2008 questionnaire. Table 5.6.14 shows key public safety/violence-related issues in Cape Cod‘s most needy young people family households. (See also, Appendix 2.C and Appendix 2.D)
Table 5.6.14: Children/Family-Related Public Safety/Violence Household Issues in Cape Cod’s Most Needy Young People Family Households [a minor-to- major problem in household]
Public Safety/Violence-Related Household Issues
Percent of Most Needy
Young People Family
Households Children or teenagers experiencing behavioral or emotional problems 46% Underage drinking 12%
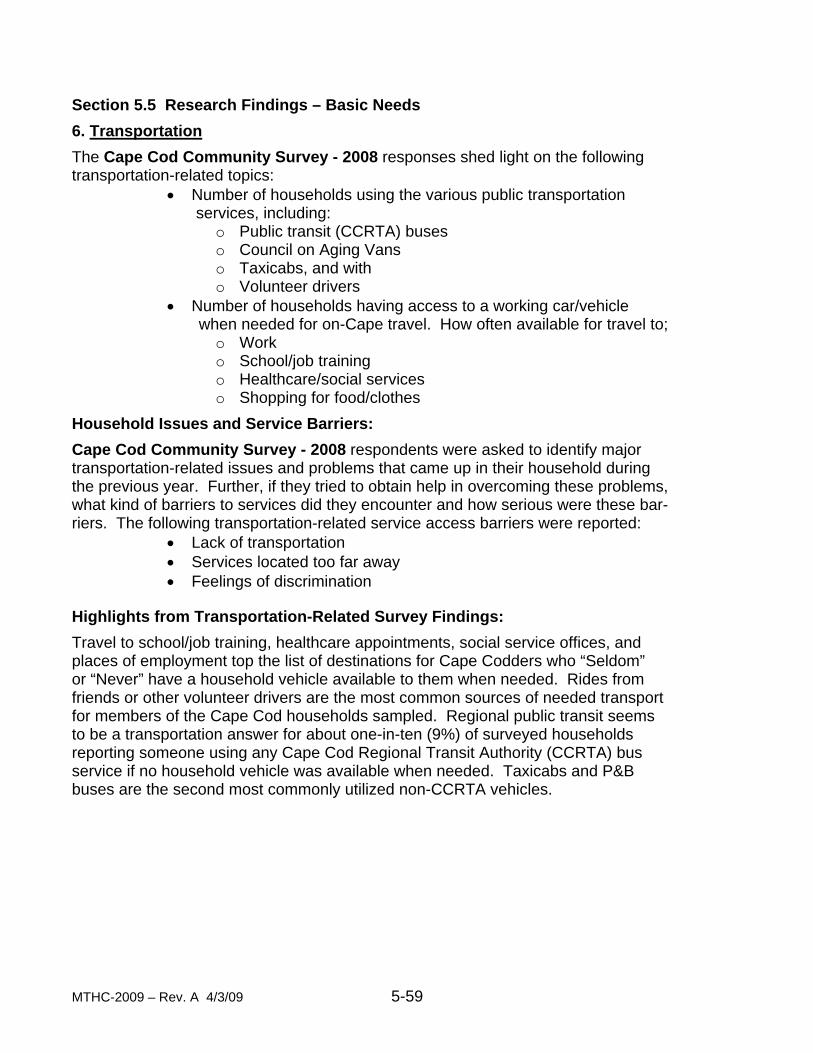
MTHC-2009 – Rev. A 4/3/09 5-59
Section 5.5 Research Findings – Basic Needs
6. Transportation
The Cape Cod Community Survey - 2008 responses shed light on the following transportation-related topics:
• Number of households using the various public transportation services, including:
o Public transit (CCRTA) buses o Council on Aging Vans o Taxicabs, and with o Volunteer drivers
• Number of households having access to a working car/vehicle when needed for on-Cape travel. How often available for travel to;
o Work o School/job training o Healthcare/social services o Shopping for food/clothes
Household Issues and Service Barriers:
Cape Cod Community Survey - 2008 respondents were asked to identify major transportation-related issues and problems that came up in their household during the previous year. Further, if they tried to obtain help in overcoming these problems, what kind of barriers to services did they encounter and how serious were these bar- riers. The following transportation-related service access barriers were reported:
• Lack of transportation • Services located too far away • Feelings of discrimination
Highlights from Transportation-Related Survey Findings:
Travel to school/job training, healthcare appointments, social service offices, and places of employment top the list of destinations for Cape Codders who “Seldom” or “Never” have a household vehicle available to them when needed. Rides from friends or other volunteer drivers are the most common sources of needed transport for members of the Cape Cod households sampled. Regional public transit seems to be a transportation answer for about one-in-ten (9%) of surveyed households reporting someone using any Cape Cod Regional Transit Authority (CCRTA) bus service if no household vehicle was available when needed. Taxicabs and P&B buses are the second most commonly utilized non-CCRTA vehicles.
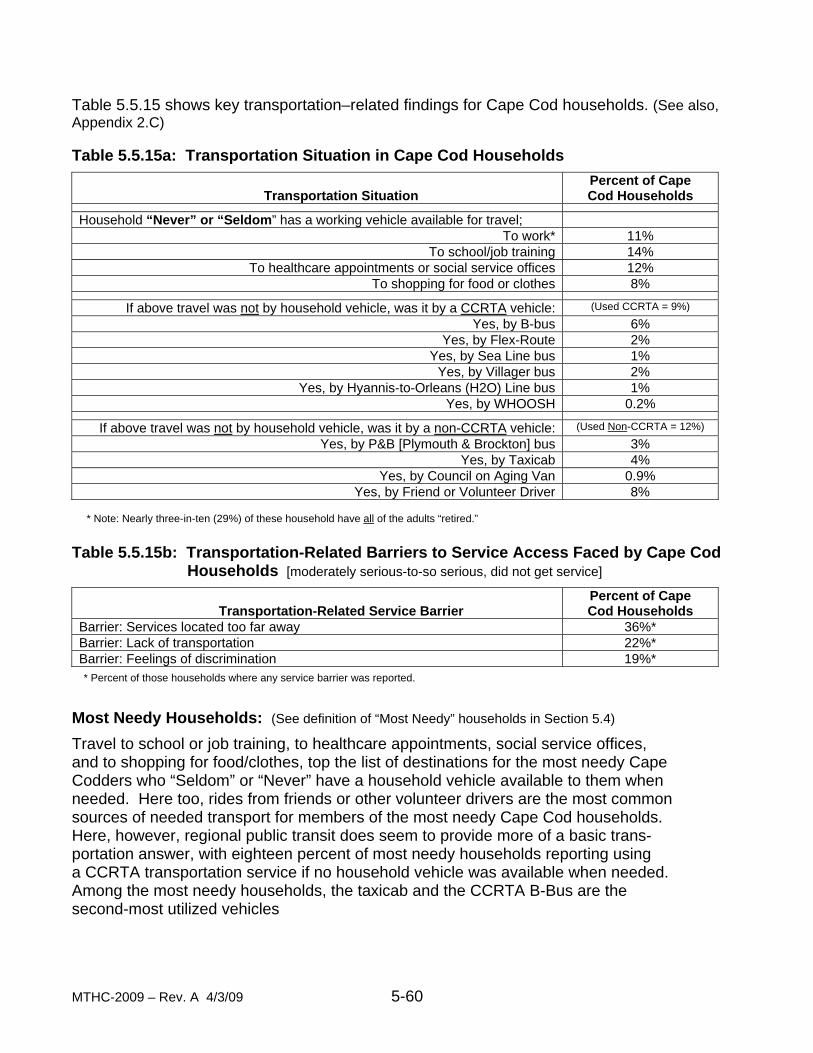
MTHC-2009 – Rev. A 4/3/09 5-60
Table 5.5.15 shows key transportation–related findings for Cape Cod households. (See also, Appendix 2.C) Table 5.5.15a: Transportation Situation in Cape Cod Households
Transportation Situation
Percent of Cape Cod Households
Household “Never” or “Seldom” has a working vehicle available for travel; To work* 11%
To school/job training 14% To healthcare appointments or social service offices 12%
To shopping for food or clothes 8%
If above travel was not by household vehicle, was it by a CCRTA vehicle: (Used CCRTA = 9%)
Yes, by B-bus 6% Yes, by Flex-Route 2%
Yes, by Sea Line bus 1% Yes, by Villager bus 2%
Yes, by Hyannis-to-Orleans (H2O) Line bus 1% Yes, by WHOOSH 0.2%
If above travel was not by household vehicle, was it by a non-CCRTA vehicle: (Used Non-CCRTA = 12%)
Yes, by P&B [Plymouth & Brockton] bus 3% Yes, by Taxicab 4%
Yes, by Council on Aging Van 0.9% Yes, by Friend or Volunteer Driver 8%
* Note: Nearly three-in-ten (29%) of these household have all of the adults “retired.” Table 5.5.15b: Transportation-Related Barriers to Service Access Faced by Cape Cod Households [moderately serious-to-so serious, did not get service]
Transportation-Related Service Barrier
Percent of Cape Cod Households
Barrier: Services located too far away 36%* Barrier: Lack of transportation 22%* Barrier: Feelings of discrimination 19%*
* Percent of those households where any service barrier was reported. Most Needy Households: (See definition of “Most Needy” households in Section 5.4)
Travel to school or job training, to healthcare appointments, social service offices, and to shopping for food/clothes, top the list of destinations for the most needy Cape Codders who “Seldom” or “Never” have a household vehicle available to them when needed. Here too, rides from friends or other volunteer drivers are the most common sources of needed transport for members of the most needy Cape Cod households. Here, however, regional public transit does seem to provide more of a basic trans- portation answer, with eighteen percent of most needy households reporting using a CCRTA transportation service if no household vehicle was available when needed. Among the most needy households, the taxicab and the CCRTA B-Bus are the second-most utilized vehicles
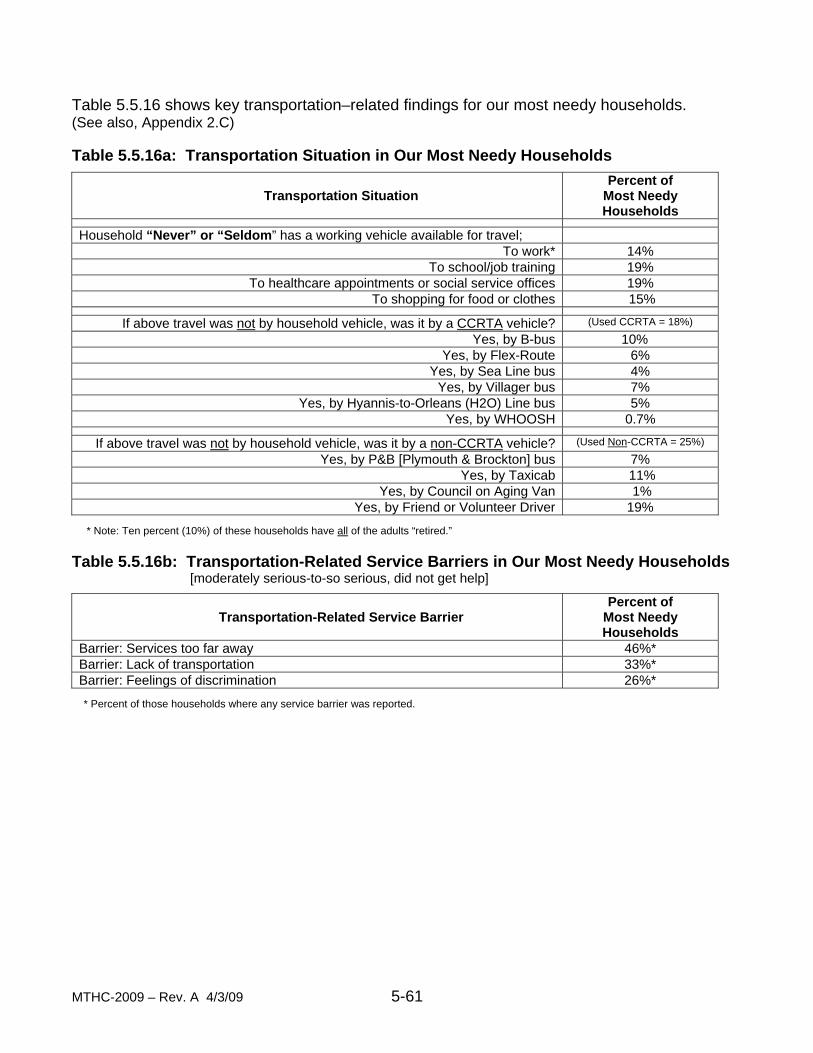
MTHC-2009 – Rev. A 4/3/09 5-61
Table 5.5.16 shows key transportation–related findings for our most needy households. (See also, Appendix 2.C) Table 5.5.16a: Transportation Situation in Our Most Needy Households
Transportation Situation
Percent of Most Needy Households
Household “Never” or “Seldom” has a working vehicle available for travel; To work* 14%
To school/job training 19% To healthcare appointments or social service offices 19%
To shopping for food or clothes 15%
If above travel was not by household vehicle, was it by a CCRTA vehicle? (Used CCRTA = 18%)
Yes, by B-bus 10% Yes, by Flex-Route 6%
Yes, by Sea Line bus 4% Yes, by Villager bus 7%
Yes, by Hyannis-to-Orleans (H2O) Line bus 5% Yes, by WHOOSH 0.7%
If above travel was not by household vehicle, was it by a non-CCRTA vehicle? (Used Non-CCRTA = 25%)
Yes, by P&B [Plymouth & Brockton] bus 7% Yes, by Taxicab 11%
Yes, by Council on Aging Van 1% Yes, by Friend or Volunteer Driver 19%
* Note: Ten percent (10%) of these households have all of the adults “retired.”
Table 5.5.16b: Transportation-Related Service Barriers in Our Most Needy Households [moderately serious-to-so serious, did not get help]
Transportation-Related Service Barrier
Percent of Most Needy Households
Barrier: Services too far away 46%* Barrier: Lack of transportation 33%* Barrier: Feelings of discrimination 26%*
* Percent of those households where any service barrier was reported.

MTHC-2009 – Rev. A 4/3/09 5-62
MTHC-2009 – Rev. A 4/3/09 5-63
Section 5. Research Findings
6. Children and Family
The Children and Family-related questions of the Cape Cod Community Survey – 2008 probed the actions and attitudes of the parents/guardians of our young people—thus providing a view of the human environment encountered by the Cape’s young people. Responses from Cape Cod parents/guardians regarding the young people in their own household were gathered through the Cape Cod Community Survey – 2008 questionnaire. Note: The Child Protective and Risk Factor questions which have been included in the four prior-year editions of the Cape Cod Community Survey were not asked in the 2008 survey questionnaire, thus Section 5.6 has been abbreviated in this year’s edition of the Report.
** The Remainder of This Page Intentionally Left Blank **
MTHC-2009 – Rev. A 4/3/09 5-64
Household Issues:
Cape Cod Community Survey - 2008 respondents were asked to identify major children- and family-related issues and problems that came up in their household during the previous year. The following children- and family- related issues were reported by Cape Cod parents/guardians:
• Children or teenagers experiencing behavioral or emotional problems
• Not being able to find or afford after-school child care • Not being able to find or afford childcare • Underage smoking or other tobacco use • Underage drinking
Highlights from Children and Family-Related Research Findings
Over two hundred Cape Cod households which included one or more child (ages 0-17 years) answered the Cape Cod Community Survey - 2008. These “young people family households” are home to overt three hundred-sixty (366) persons age 17 or younger, with an average of 1.8 young people per household. One-in- six (15%) of these households report having three or more children.
** The Remainder of This Page Intentionally Left Blank **
MTHC-2009 – Rev. A 4/3/09 5-65
Table 5.6.3 shows key children/family-related issues in Cape Cod’s young people family households. (See also, Appendix 2.D)
** The Remainder of This Page Intentionally Left Blank **
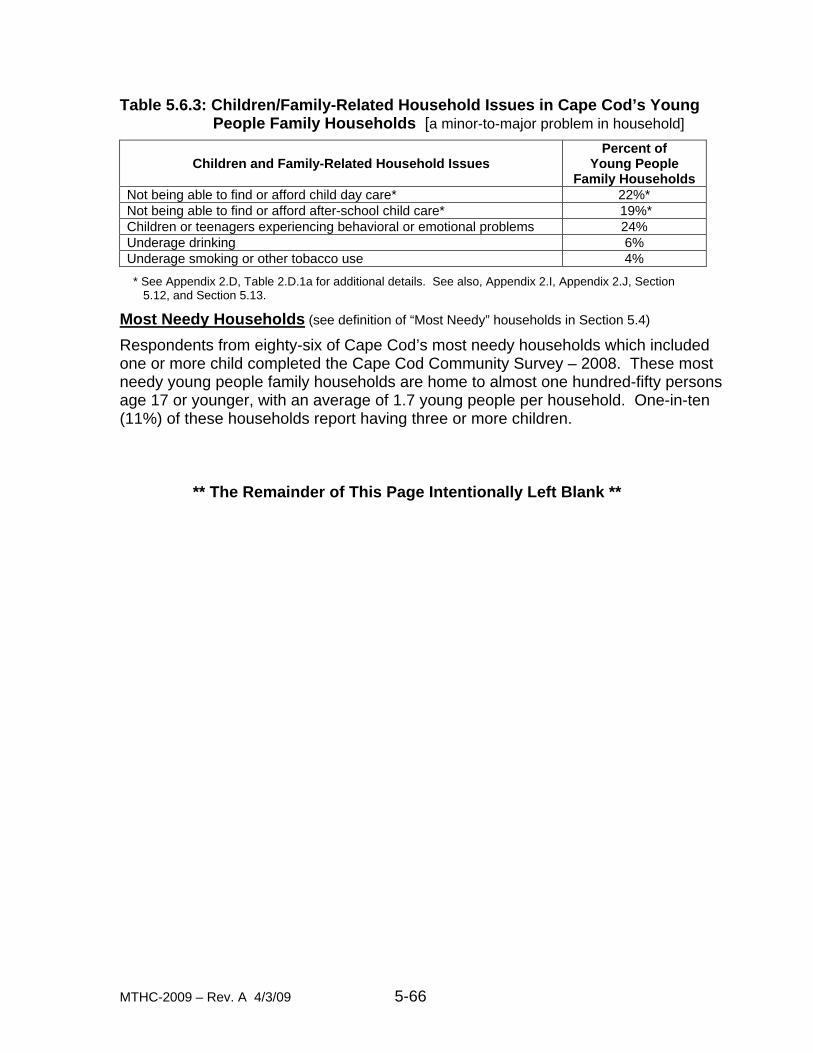
MTHC-2009 – Rev. A 4/3/09 5-66
Table 5.6.3: Children/Family-Related Household Issues in Cape Cod’s Young People Family Households [a minor-to-major problem in household]
Children and Family-Related Household Issues
Percent of Young People
Family Households Not being able to find or afford child day care* 22%* Not being able to find or afford after-school child care* 19%* Children or teenagers experiencing behavioral or emotional problems 24% Underage drinking 6% Underage smoking or other tobacco use 4%
* See Appendix 2.D, Table 2.D.1a for additional details. See also, Appendix 2.I, Appendix 2.J, Section 5.12, and Section 5.13.
Most Needy Households (see definition of “Most Needy” households in Section 5.4)
Respondents from eighty-six of Cape Cod’s most needy households which included one or more child completed the Cape Cod Community Survey – 2008. These most needy young people family households are home to almost one hundred-fifty persons age 17 or younger, with an average of 1.7 young people per household. One-in-ten (11%) of these households report having three or more children.
** The Remainder of This Page Intentionally Left Blank **

MTHC-2009 – Rev. A 4/3/09 5-67
** This Page Intentionally Left Blank **
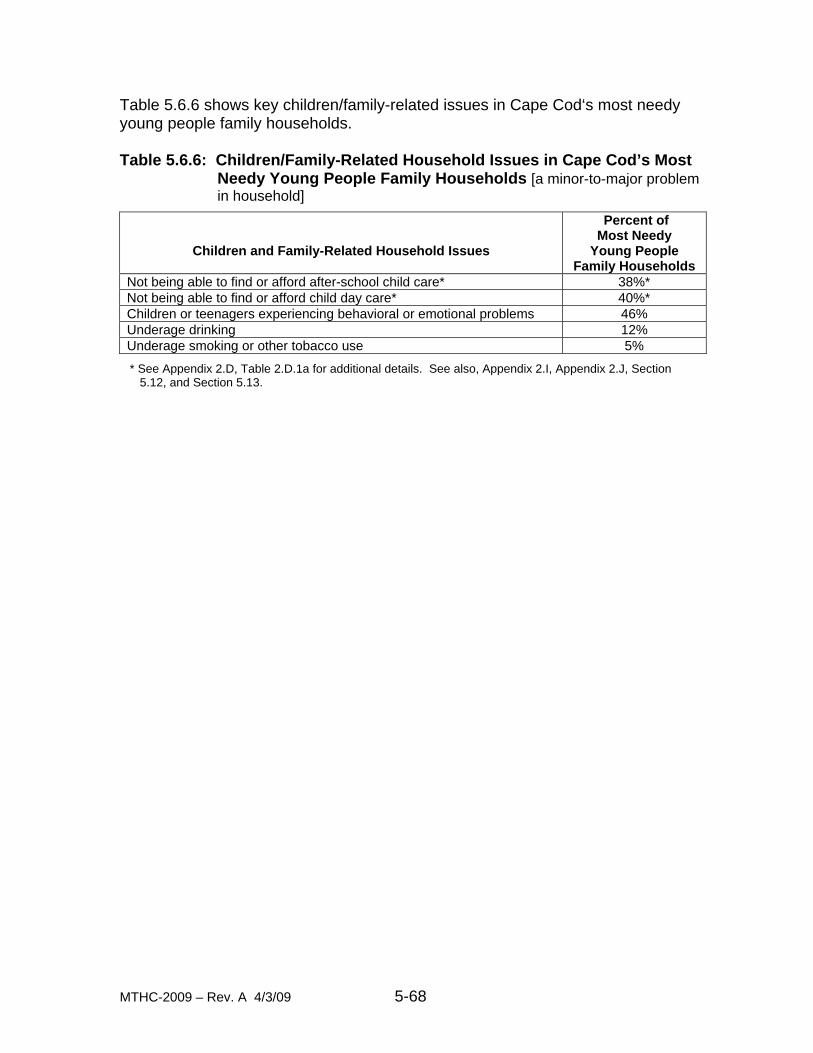
MTHC-2009 – Rev. A 4/3/09 5-68
Table 5.6.6 shows key children/family-related issues in Cape Cod‘s most needy young people family households. Table 5.6.6: Children/Family-Related Household Issues in Cape Cod’s Most Needy Young People Family Households [a minor-to-major problem in household]
Children and Family-Related Household Issues
Percent of Most Needy
Young People Family Households
Not being able to find or afford after-school child care* 38%* Not being able to find or afford child day care* 40%* Children or teenagers experiencing behavioral or emotional problems 46% Underage drinking 12% Underage smoking or other tobacco use 5%
* See Appendix 2.D, Table 2.D.1a for additional details. See also, Appendix 2.I, Appendix 2.J, Section 5.12, and Section 5.13.
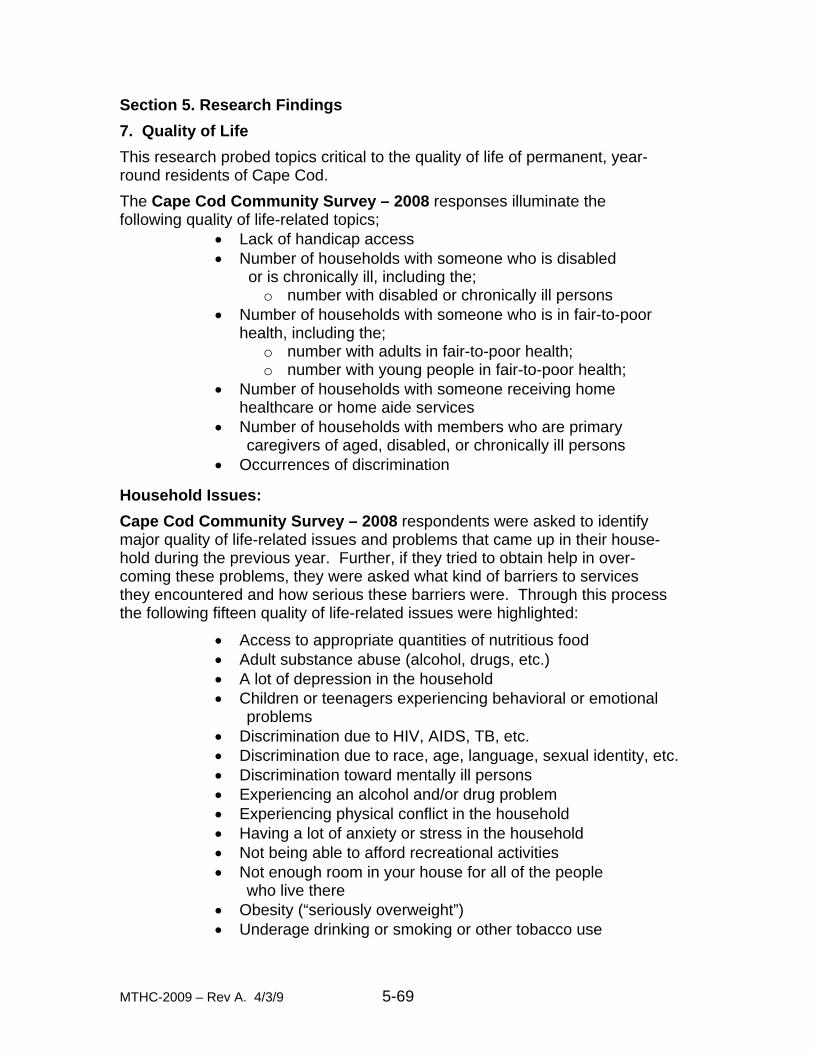
MTHC-2009 – Rev A. 4/3/9 5-69
Section 5. Research Findings
7. Quality of Life
This research probed topics critical to the quality of life of permanent, year- round residents of Cape Cod.
The Cape Cod Community Survey – 2008 responses illuminate the following quality of life-related topics;
• Lack of handicap access • Number of households with someone who is disabled
or is chronically ill, including the; o number with disabled or chronically ill persons
• Number of households with someone who is in fair-to-poor health, including the;
o number with adults in fair-to-poor health; o number with young people in fair-to-poor health;
• Number of households with someone receiving home healthcare or home aide services
• Number of households with members who are primary caregivers of aged, disabled, or chronically ill persons • Occurrences of discrimination
Household Issues:
Cape Cod Community Survey – 2008 respondents were asked to identify major quality of life-related issues and problems that came up in their house- hold during the previous year. Further, if they tried to obtain help in over- coming these problems, they were asked what kind of barriers to services they encountered and how serious these barriers were. Through this process the following fifteen quality of life-related issues were highlighted:
• Access to appropriate quantities of nutritious food • Adult substance abuse (alcohol, drugs, etc.) • A lot of depression in the household • Children or teenagers experiencing behavioral or emotional problems • Discrimination due to HIV, AIDS, TB, etc. • Discrimination due to race, age, language, sexual identity, etc. • Discrimination toward mentally ill persons • Experiencing an alcohol and/or drug problem • Experiencing physical conflict in the household • Having a lot of anxiety or stress in the household • Not being able to afford recreational activities • Not enough room in your house for all of the people who live there • Obesity (“seriously overweight”) • Underage drinking or smoking or other tobacco use
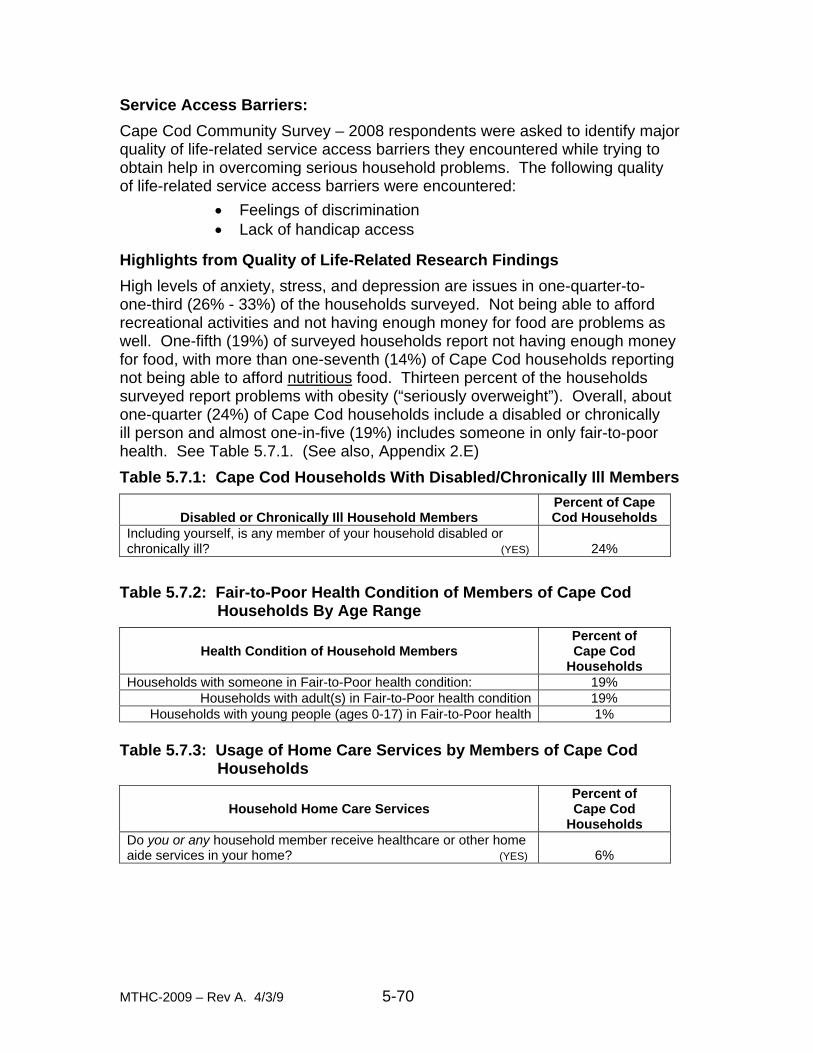
MTHC-2009 – Rev A. 4/3/9 5-70
Service Access Barriers:
Cape Cod Community Survey – 2008 respondents were asked to identify major quality of life-related service access barriers they encountered while trying to obtain help in overcoming serious household problems. The following quality of life-related service access barriers were encountered:
• Feelings of discrimination • Lack of handicap access
Highlights from Quality of Life-Related Research Findings
High levels of anxiety, stress, and depression are issues in one-quarter-to- one-third (26% - 33%) of the households surveyed. Not being able to afford recreational activities and not having enough money for food are problems as well. One-fifth (19%) of surveyed households report not having enough money for food, with more than one-seventh (14%) of Cape Cod households reporting not being able to afford nutritious food. Thirteen percent of the households surveyed report problems with obesity (“seriously overweight”). Overall, about one-quarter (24%) of Cape Cod households include a disabled or chronically ill person and almost one-in-five (19%) includes someone in only fair-to-poor health. See Table 5.7.1. (See also, Appendix 2.E)
Table 5.7.1: Cape Cod Households With Disabled/Chronically Ill Members
Disabled or Chronically Ill Household Members
Percent of Cape Cod Households
Including yourself, is any member of your household disabled or chronically ill? (YES)
24%
Table 5.7.2: Fair-to-Poor Health Condition of Members of Cape Cod Households By Age Range
Health Condition of Household Members
Percent of Cape Cod
Households Households with someone in Fair-to-Poor health condition: 19%
Households with adult(s) in Fair-to-Poor health condition 19% Households with young people (ages 0-17) in Fair-to-Poor health 1%
Table 5.7.3: Usage of Home Care Services by Members of Cape Cod Households
Household Home Care Services
Percent of Cape Cod
Households Do you or any household member receive healthcare or other home aide services in your home? (YES)
6%
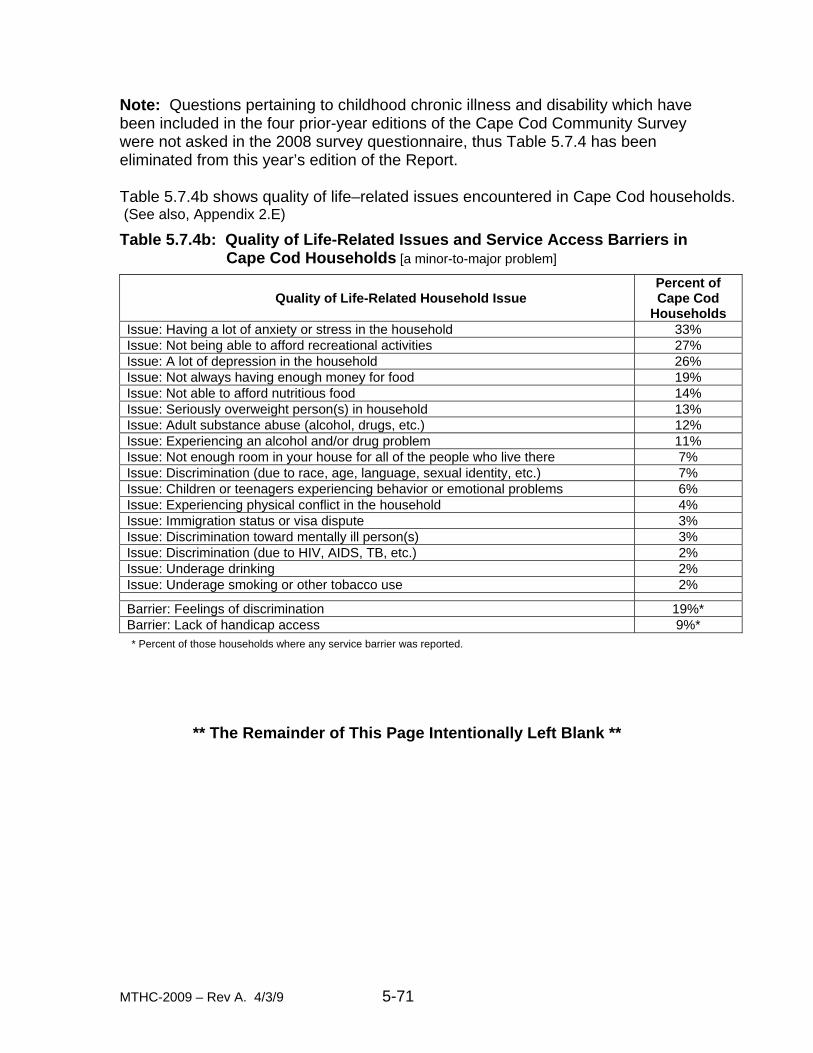
MTHC-2009 – Rev A. 4/3/9 5-71
Note: Questions pertaining to childhood chronic illness and disability which have been included in the four prior-year editions of the Cape Cod Community Survey were not asked in the 2008 survey questionnaire, thus Table 5.7.4 has been eliminated from this year’s edition of the Report. Table 5.7.4b shows quality of life–related issues encountered in Cape Cod households. (See also, Appendix 2.E)
Table 5.7.4b: Quality of Life-Related Issues and Service Access Barriers in Cape Cod Households [a minor-to-major problem]
Quality of Life-Related Household Issue
Percent of Cape Cod
Households Issue: Having a lot of anxiety or stress in the household 33% Issue: Not being able to afford recreational activities 27% Issue: A lot of depression in the household 26% Issue: Not always having enough money for food 19% Issue: Not able to afford nutritious food 14% Issue: Seriously overweight person(s) in household 13% Issue: Adult substance abuse (alcohol, drugs, etc.) 12% Issue: Experiencing an alcohol and/or drug problem 11% Issue: Not enough room in your house for all of the people who live there 7% Issue: Discrimination (due to race, age, language, sexual identity, etc.) 7% Issue: Children or teenagers experiencing behavior or emotional problems 6% Issue: Experiencing physical conflict in the household 4% Issue: Immigration status or visa dispute 3% Issue: Discrimination toward mentally ill person(s) 3% Issue: Discrimination (due to HIV, AIDS, TB, etc.) 2% Issue: Underage drinking 2% Issue: Underage smoking or other tobacco use 2%
Barrier: Feelings of discrimination 19%* Barrier: Lack of handicap access 9%*
* Percent of those households where any service barrier was reported.
** The Remainder of This Page Intentionally Left Blank **

MTHC-2009 – Rev A. 4/3/9 5-72
Caring For Others
Table 5.7.5 shows findings related to members of Cape Cod households being the primary caregiver for a disabled or chronically ill person. (See also, Appendix 2.E) Table 5.7.5: Care Giving by Members of Cape Cod Households
Caregiver Situation
Percent of Cape Cod
Households Are you or any household member the PRIMARY caregiver for an aged, disabled, or chronically ill person? (YES)
13%
Most Needy Households (see definition of “Most Needy” households in Section 5.4)
High levels of stress and anxiety and not being able to afford recreational activities are extremely serious problems in our Most Needy households. An extremely high level of depression is an issue in eight-in-ten (80%) of the most needy households surveyed. More than one-half (57%) of Cape Cod’s most needy households report not having enough money for food, with nearly one-half (43%) of our most needy household reporting not being able to afford nutritious food. Very serious substance abuse issues are also reported. Overall, more than forty percent (42%) of our most needy households include a disabled or chronically ill person and more than a third include someone in only fair-to-poor health. See Tables 5.7.6. (See also, Appendix 2.E) Table 5.7.6: Disabled/Chronically Ill Members of Cape Cod’s Most Needy Households
Disabled or Chronically Ill Household Members
Percent of Most Needy Households
Including yourself, is any member of your household disabled or chronically ill? (YES)
42%
Table 5.7.7: Fair-to-Poor Health Condition of Members of Cape Cod’s Most Needy Households By Age Range
Health Condition of Household Members
Percent of Most Needy Households
Households with someone in Fair-to-Poor health condition: 36% Households with adult(s) in Fair-to-Poor health condition 36%
Households with young people (ages 0-17) in Fair-to-Poor health 4% Table 5.7.8: Usage of Home Care Services by Members of Cape Cod’s Most Needy Households
Household Home Care Services
Percent of Most Needy Households
Do you or any household member receive healthcare or other home aide services in your home? (YES)
10%

MTHC-2009 – Rev A. 4/3/9 5-73
Note: Questions pertaining to childhood chronic illness and disability which have been included in the four prior-year editions of the Cape Cod Community Survey were not asked in the 2008 survey questionnaire, thus Table 5.7.4a has been eliminated from this year’s edition of the Report. Table 5.7.9b shows quality of life–related issues encountered in our most needy house- holds. (See also, Appendix 2.E)
Table 5.7.9b: Quality of Life-Related Issues and Service Access Barriers in Cape Cod’s Most Needy Households [a minor-to-major problem]
Quality of Life-Related Household Issue
Percent of Most Needy Households
Issue: Having a lot of anxiety or stress in the household 82% Issue: A lot of depression in the household 80% Issue: Not being able to afford recreational activities 66% Issue: Not always having enough money for food 57% Issue: Not able to afford nutritious food 43% Issue: Adult substance abuse (alcohol, drugs, etc.) 39% Issue: Experiencing an alcohol and/or drug problem 37% Issue: Seriously overweight person(s) in household 33% Issue: Not enough room in your house for all of the people who live there 22% Issue: Children or teenagers experiencing behavior or emotional problems 19% Issue: Discrimination (due to race, age, language, sexual identity, etc.) 18% Issue: Experiencing physical conflict in the household 12% Issue: Discrimination toward mentally ill person(s) 9% Issue: Discrimination (due to HIV, AIDS, TB, etc.) 7% Issue: Underage drinking 6% Issue: Immigration status or visa dispute 6% Issue: Underage smoking or other tobacco use 4%
Barrier: Feelings of discrimination 26%* Barrier: Lack of handicap access 12%*
* Percent of those households where any service barrier was reported.
** The Remainder of This Page Intentionally Left Blank **
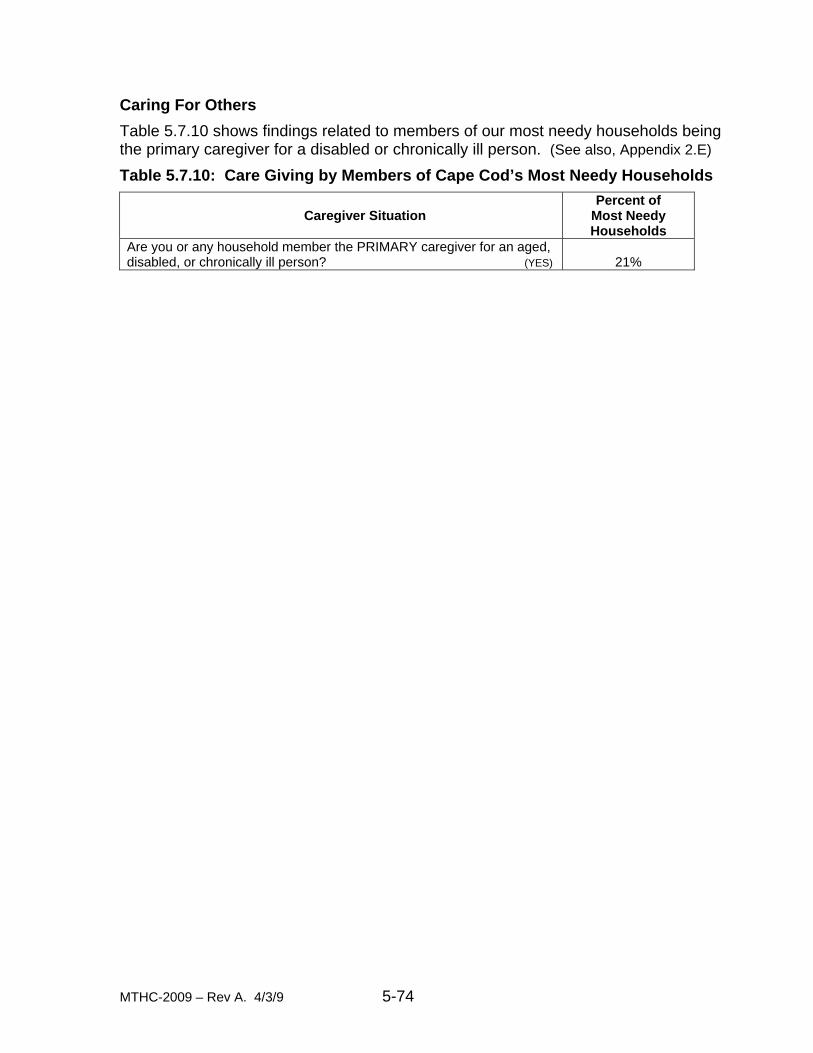
MTHC-2009 – Rev A. 4/3/9 5-74
Caring For Others
Table 5.7.10 shows findings related to members of our most needy households being the primary caregiver for a disabled or chronically ill person. (See also, Appendix 2.E)
Table 5.7.10: Care Giving by Members of Cape Cod’s Most Needy Households
Caregiver Situation
Percent of Most Needy Households
Are you or any household member the PRIMARY caregiver for an aged, disabled, or chronically ill person? (YES)
21%
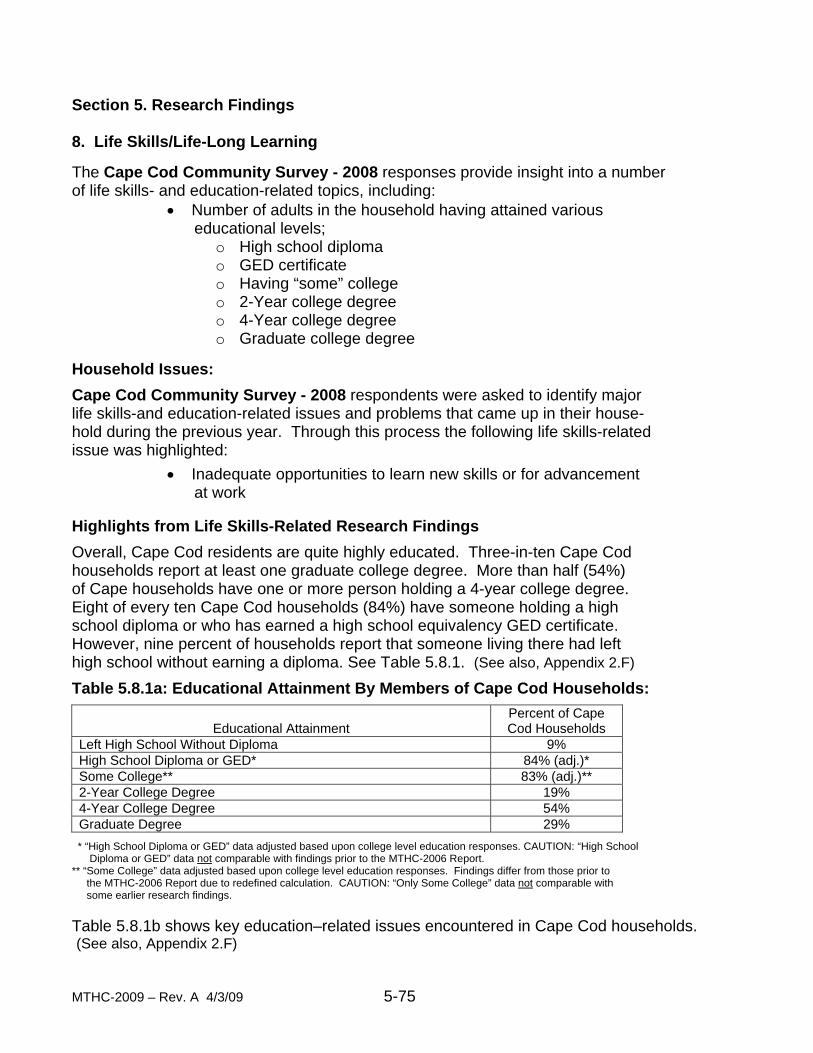
MTHC-2009 – Rev. A 4/3/09 5-75
Section 5. Research Findings 8. Life Skills/Life-Long Learning The Cape Cod Community Survey - 2008 responses provide insight into a number of life skills- and education-related topics, including:
• Number of adults in the household having attained various educational levels;
o High school diploma o GED certificate o Having “some” college o 2-Year college degree o 4-Year college degree o Graduate college degree
Household Issues:
Cape Cod Community Survey - 2008 respondents were asked to identify major life skills-and education-related issues and problems that came up in their house- hold during the previous year. Through this process the following life skills-related issue was highlighted:
• Inadequate opportunities to learn new skills or for advancement at work
Highlights from Life Skills-Related Research Findings
Overall, Cape Cod residents are quite highly educated. Three-in-ten Cape Cod households report at least one graduate college degree. More than half (54%) of Cape households have one or more person holding a 4-year college degree. Eight of every ten Cape Cod households (84%) have someone holding a high school diploma or who has earned a high school equivalency GED certificate. However, nine percent of households report that someone living there had left high school without earning a diploma. See Table 5.8.1. (See also, Appendix 2.F)
Table 5.8.1a: Educational Attainment By Members of Cape Cod Households:
Educational Attainment
Percent of Cape Cod Households
Left High School Without Diploma 9% High School Diploma or GED* 84% (adj.)* Some College** 83% (adj.)** 2-Year College Degree 19% 4-Year College Degree 54% Graduate Degree 29%
* “High School Diploma or GED” data adjusted based upon college level education responses. CAUTION: “High School Diploma or GED” data not comparable with findings prior to the MTHC-2006 Report. ** “Some College” data adjusted based upon college level education responses. Findings differ from those prior to the MTHC-2006 Report due to redefined calculation. CAUTION: “Only Some College” data not comparable with some earlier research findings.
Table 5.8.1b shows key education–related issues encountered in Cape Cod households. (See also, Appendix 2.F)
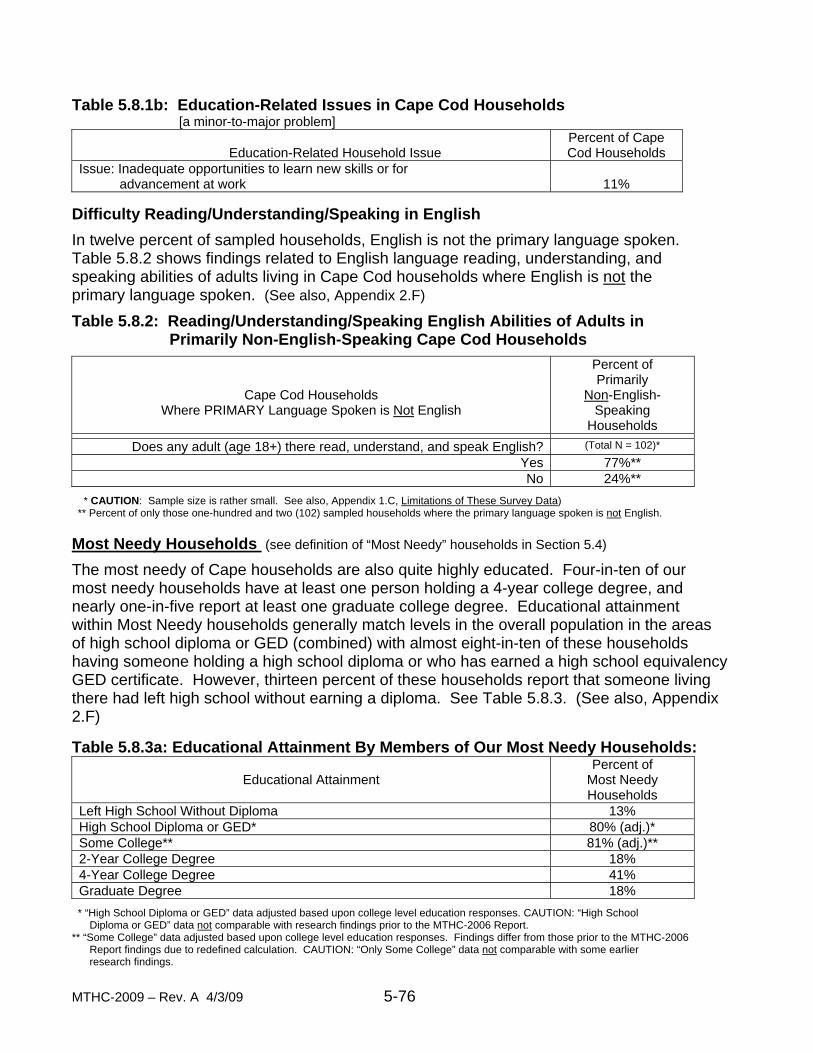
MTHC-2009 – Rev. A 4/3/09 5-76
Table 5.8.1b: Education-Related Issues in Cape Cod Households [a minor-to-major problem]
Education-Related Household Issue
Percent of Cape Cod Households
Issue: Inadequate opportunities to learn new skills or for advancement at work
11%
Difficulty Reading/Understanding/Speaking in English
In twelve percent of sampled households, English is not the primary language spoken. Table 5.8.2 shows findings related to English language reading, understanding, and speaking abilities of adults living in Cape Cod households where English is not the primary language spoken. (See also, Appendix 2.F)
Table 5.8.2: Reading/Understanding/Speaking English Abilities of Adults in Primarily Non-English-Speaking Cape Cod Households
Cape Cod Households Where PRIMARY Language Spoken is Not English
Percent of Primarily
Non-English-Speaking
Households
Does any adult (age 18+) there read, understand, and speak English? (Total N = 102)*
Yes 77%** No 24%**
* CAUTION: Sample size is rather small. See also, Appendix 1.C, Limitations of These Survey Data) ** Percent of only those one-hundred and two (102) sampled households where the primary language spoken is not English. Most Needy Households (see definition of “Most Needy” households in Section 5.4)
The most needy of Cape households are also quite highly educated. Four-in-ten of our most needy households have at least one person holding a 4-year college degree, and nearly one-in-five report at least one graduate college degree. Educational attainment within Most Needy households generally match levels in the overall population in the areas of high school diploma or GED (combined) with almost eight-in-ten of these households having someone holding a high school diploma or who has earned a high school equivalency GED certificate. However, thirteen percent of these households report that someone living there had left high school without earning a diploma. See Table 5.8.3. (See also, Appendix 2.F) Table 5.8.3a: Educational Attainment By Members of Our Most Needy Households:
Educational Attainment
Percent of Most Needy Households
Left High School Without Diploma 13% High School Diploma or GED* 80% (adj.)* Some College** 81% (adj.)** 2-Year College Degree 18% 4-Year College Degree 41% Graduate Degree 18%
* “High School Diploma or GED” data adjusted based upon college level education responses. CAUTION: “High School Diploma or GED” data not comparable with research findings prior to the MTHC-2006 Report. ** “Some College” data adjusted based upon college level education responses. Findings differ from those prior to the MTHC-2006 Report findings due to redefined calculation. CAUTION: “Only Some College” data not comparable with some earlier research findings.
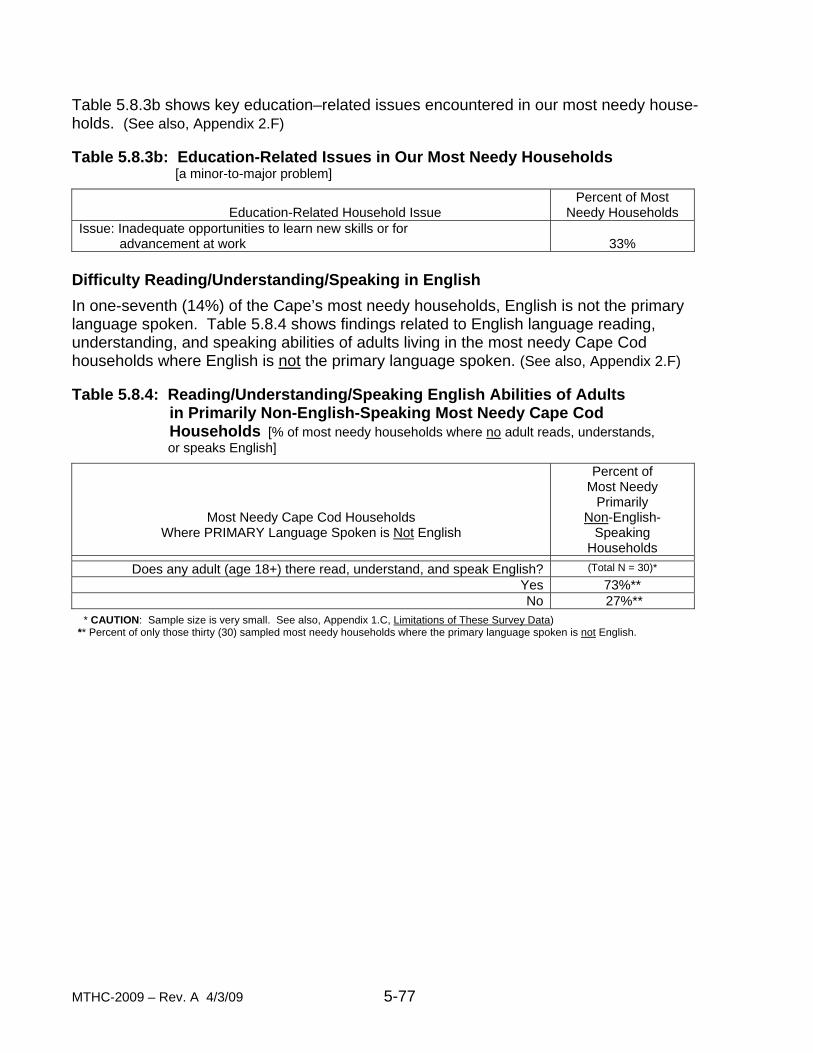
MTHC-2009 – Rev. A 4/3/09 5-77
Table 5.8.3b shows key education–related issues encountered in our most needy house- holds. (See also, Appendix 2.F) Table 5.8.3b: Education-Related Issues in Our Most Needy Households [a minor-to-major problem]
Education-Related Household Issue
Percent of Most Needy Households
Issue: Inadequate opportunities to learn new skills or for advancement at work
33%
Difficulty Reading/Understanding/Speaking in English
In one-seventh (14%) of the Cape’s most needy households, English is not the primary language spoken. Table 5.8.4 shows findings related to English language reading, understanding, and speaking abilities of adults living in the most needy Cape Cod households where English is not the primary language spoken. (See also, Appendix 2.F) Table 5.8.4: Reading/Understanding/Speaking English Abilities of Adults in Primarily Non-English-Speaking Most Needy Cape Cod Households [% of most needy households where no adult reads, understands, or speaks English]
Most Needy Cape Cod Households Where PRIMARY Language Spoken is Not English
Percent of Most Needy
Primarily Non-English-
Speaking Households
Does any adult (age 18+) there read, understand, and speak English? (Total N = 30)*
Yes 73%** No 27%**
* CAUTION: Sample size is very small. See also, Appendix 1.C, Limitations of These Survey Data) ** Percent of only those thirty (30) sampled most needy households where the primary language spoken is not English.

MTHC-2009 – Rev. A 4/3/09 5-78

MTHC-2009 – Rev. A 4/3/09 5-79
Section 5. Research Findings 9.a Special Focus on Rental Housing The Cape Cod Community Survey – 2008 responses provide in-depth insight into the following rental housing-related topics:
Amount of rental housing stock in need of repairs to be truly “habitable,” Amount ($) paid out each month for rental “housing,” “Homelessness” in renter households, Number of rental households receiving PRIVATE charity ($) for housing costs, Number of rentals that include electricity, heat, Percentage of gross income going to pay the monthly rent.
Household Issues and Service Barriers:
Cape Cod Community Survey – 2008 respondents who rent were asked to identify major housing-related issues and problems that came up in their household during the previous year. Further, if they tried to obtain help in overcoming these problems, they were asked to identify the kinds of barriers to services that they encountered and the seriousness of those barriers. The following rental housing-related issues were reported:
• Not able to find appropriate senior (65+) housing, • Not enough room in the house for all of the people who live there (overcrowding), • Not having enough money to pay for housing, • Being forced to move due to seasonal rent increases, • Other issues closely linked to rental housing availability and affordability, including;
o Discrimination (due to HIV, AIDS, TB, etc.), o Discrimination (due to race, age, language, sexual identity/orientation, etc.), o Discrimination toward mentally ill person(s) o Not being able to afford nutritious food, o Not always having enough money for food, o Not having money enough to pay the doctor, the dentist, or to buy
prescription medications, o Not enough money to pay for a mental health counselor, o Not enough money to pay for dental care, o Not enough money to pay health insurance deductible/co-payment
Cape Cod Renter Households
Of the 845 Cape Cod households responding to the Cape Cod Community Survey - 2008, one-fifth (20%) report RENTING their housing, whereas, 80% either OWN their home or live in one of several group housing situations. The median income range of all responding renter households is $15,000 - $29,999, averaging much less than one-half of the median household income estimated by the US Census Bureau for Cape Cod [$58,422 in 2007]. One-half of all Cape Cod renter households are estimated to be living under 200% of the Year 2008 federal poverty level [for the lower 48 states]. Any household with working adults, but with a combined annual income (from all sources) of less than 200% of the poverty level is classified as “working poor.” Three-in-ten (30%) responding renter households are estimated to fit into this “working poor” category. Also, more than one-third (36%) of renter Cape Cod households receive some sort of PUBLIC financial assistance,

MTHC-2009 – Rev. A 4/3/09 5-80
such as TAFDC, food stamps, fuel assistance, SSI, SSDI, or housing vouchers. One- in-five (20%) of responding renter households report receiving PRIVATELY funded emergency food, clothing, and/or housing/utilities money assistance over the past 12 months. Additional details on rental housing responses can be found in Appendix 2, Table 2.B.5 and in Appendix 2.G.
Table 5.9.1 shows key housing–related findings for renter Cape Cod households. (See also, Appendix 2.G)
Table 5.9.1a: Financial Situation in Renter Cape Cod Households
Renter Household Financial Situation
Percent of Renter
Cape Cod Households
Households with less than $15,000 combined annual income 36% Households with $15,000 - $29,999 combined annual income 22% Households with $30,000 - $49,999 combined annual income (was “- $44,999”) 20% Households with $50,000 - $99,999 combined annual income (was “$45,000 –“) 20% Households with $100,000 - $149,999 combined annual income 1% Households with $150,000 or above combined annual income 2% Households with combined annual income BELOW the County median* 81% Households with combined annual income ABOVE the County median* 19% Households with combined annual income Less Than 200% of poverty level** 48% Median Annual Household Income (combined, from all sources) $15,000-$29,999 “Working Poor” households (employed adults, but income less than 200% of poverty level)
30%
Median Monthly Housing Payment [median indicates: 1/2 below - 1/2 above] $800-$999 Total Housing Payments as % of Gross Income [ = $900*12 divided by $22,500] 48%
* The Barnstable County (MA) median household income was estimated by the US Census Bureau to be $58,422 in the year 2007 (latest year for which an official estimate is available). ** 200% of poverty in Year 2008 was defined as: $20,800 for one person living alone, $28,000 for a family of two, and $42,800 for a family of four.
Table 5.9.1b: Housing Situation in Renter Cape Cod Households
Renter Household Housing Situation
Percent of Renter
Cape Cod Households
Renter Households: Of renter households, percent where rent includes electricity 30% Of renter households, percent where rent includes heat 33% Living in Senior Housing or Assisted Living Unit 0% Household’s rental unit needs major repair to make it truly habitable 7% Any household member been “homeless” for more than 1-2 days? (Yes) 14%

MTHC-2009 – Rev. A 4/3/09 5-81
Table 5.9.1c: Public & Private Assistance Received in Renter Cape Cod Households:
Rental Housing Assistance
Percent of Renter
Cape Cod Households
Renter households receiving any PUBLIC financial assistance (TAFDC, Food Stamps, Fuel assistance, SSI, SSDI, or housing vouchers) (YES)
36%
Renter households having received a PRIVATE charity emergency money grant in past 12 months for:
- food/clothes 11% - housing 10% - heating 9% - utilities 4%
Table 5.9.2: Issues and Service Barriers in Renter Cape Cod Households
[Issue: minor-to-major, Barrier: moderately serious-to-so serious did not get help] (See also, Appendix 2.G)
Renter Household Issues and Service Barriers (See also, Sections 5.12 and 5.13)
Percent of Renter
Cape Cod Households
Issue: Not being able to afford recreational activities 47% Issue: Not having money enough to pay the doctor, the dentist, or to buy prescription medications
43%
Issue: Not having enough money to pay for housing 39% Issue: Not always having enough money for food 38% Issue: Paying for or getting dental care 38% Issue: Not being able to afford legal help 29% Issue: Not able to afford nutritious food 29% Issue: Paying for a mental health counselor 16% Issue: Not enough room in your house for all of the people who live there 17% Issue: Not being able to find or afford after-school child care 7% Issue: Not being able to find or afford child day care 9% Issue: Discrimination (due to race, age, language, sexual identity/orientation, etc.) 14% Issue: Discrimination toward mentally ill person(s) 5% Issue: Not able to find appropriate senior (65+) housing 5% Issue: Discrimination (due to HIV, AIDS, TB etc.) 7%
Barrier: Could not afford fees or costs for [human] services 54%* Barrier: Cost of taking time away from work 47%* Barrier: Paying [health] insurance deductible/co-payment 48%* Barrier: Unable to take time away from work to go to services 36%* Barrier: [Health] Insurance not accepted for services 39%*
* Percent of those only the 96 renter Cape Cod households where any service barrier was reported.
Highlights from Rental Housing-Related Survey Findings
Overall, seven-in-ten (70%) of households on Cape Cod own their home. One-in-five (20%) rent their housing. The average renter household pays out between $800 and $999 per month for their housing. Seven percent of these residents report that their rented home is in need of major repair in order to make it truly habitable. PRIVATE charity-provided financial assistance was received in one-in-five (20%) of renter Cape
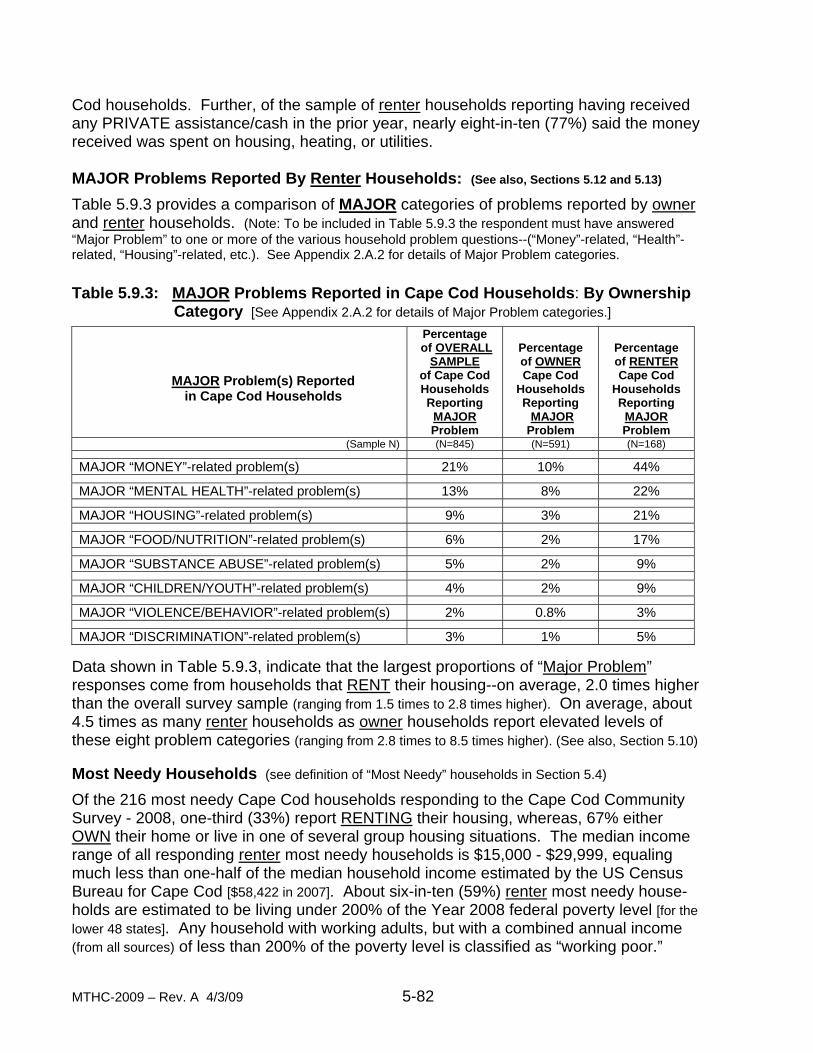
MTHC-2009 – Rev. A 4/3/09 5-82
Cod households. Further, of the sample of renter households reporting having received any PRIVATE assistance/cash in the prior year, nearly eight-in-ten (77%) said the money received was spent on housing, heating, or utilities. MAJOR Problems Reported By Renter Households: (See also, Sections 5.12 and 5.13)
Table 5.9.3 provides a comparison of MAJOR categories of problems reported by owner and renter households. (Note: To be included in Table 5.9.3 the respondent must have answered “Major Problem” to one or more of the various household problem questions--(“Money”-related, “Health”- related, “Housing”-related, etc.). See Appendix 2.A.2 for details of Major Problem categories. Table 5.9.3: MAJOR Problems Reported in Cape Cod Households: By Ownership Category [See Appendix 2.A.2 for details of Major Problem categories.]
MAJOR Problem(s) Reported in Cape Cod Households
Percentage of OVERALL
SAMPLE of Cape Cod Households Reporting
MAJOR Problem
Percentage of OWNER Cape Cod
Households Reporting MAJOR Problem
Percentage of RENTER Cape Cod
Households Reporting
MAJOR Problem
(Sample N) (N=845) (N=591) (N=168)
MAJOR “MONEY”-related problem(s) 21% 10% 44%
MAJOR “MENTAL HEALTH”-related problem(s) 13% 8% 22%
MAJOR “HOUSING”-related problem(s) 9% 3% 21%
MAJOR “FOOD/NUTRITION”-related problem(s) 6% 2% 17%
MAJOR “SUBSTANCE ABUSE”-related problem(s) 5% 2% 9%
MAJOR “CHILDREN/YOUTH”-related problem(s) 4% 2% 9%
MAJOR “VIOLENCE/BEHAVIOR”-related problem(s) 2% 0.8% 3%
MAJOR “DISCRIMINATION”-related problem(s) 3% 1% 5% Data shown in Table 5.9.3, indicate that the largest proportions of “Major Problem” responses come from households that RENT their housing--on average, 2.0 times higher than the overall survey sample (ranging from 1.5 times to 2.8 times higher). On average, about 4.5 times as many renter households as owner households report elevated levels of these eight problem categories (ranging from 2.8 times to 8.5 times higher). (See also, Section 5.10) Most Needy Households (see definition of “Most Needy” households in Section 5.4)
Of the 216 most needy Cape Cod households responding to the Cape Cod Community Survey - 2008, one-third (33%) report RENTING their housing, whereas, 67% either OWN their home or live in one of several group housing situations. The median income range of all responding renter most needy households is $15,000 - $29,999, equaling much less than one-half of the median household income estimated by the US Census Bureau for Cape Cod [$58,422 in 2007]. About six-in-ten (59%) renter most needy house- holds are estimated to be living under 200% of the Year 2008 federal poverty level [for the lower 48 states]. Any household with working adults, but with a combined annual income (from all sources) of less than 200% of the poverty level is classified as “working poor.”
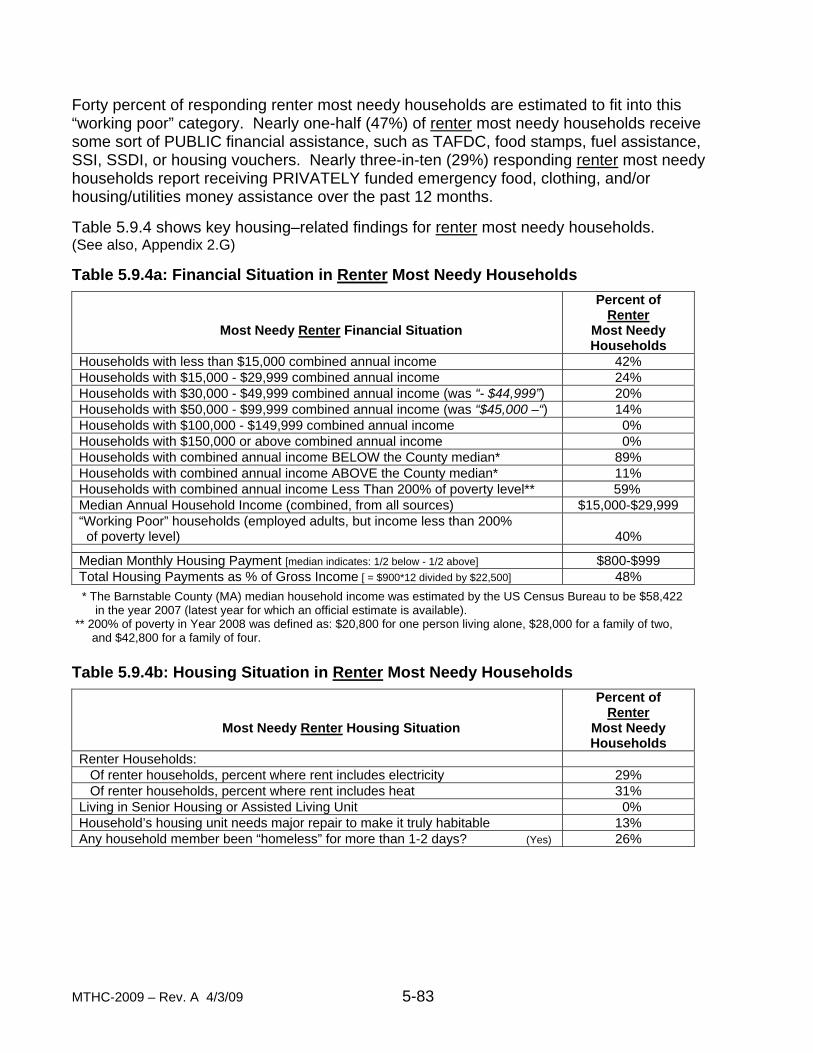
MTHC-2009 – Rev. A 4/3/09 5-83
Forty percent of responding renter most needy households are estimated to fit into this “working poor” category. Nearly one-half (47%) of renter most needy households receive some sort of PUBLIC financial assistance, such as TAFDC, food stamps, fuel assistance, SSI, SSDI, or housing vouchers. Nearly three-in-ten (29%) responding renter most needy households report receiving PRIVATELY funded emergency food, clothing, and/or housing/utilities money assistance over the past 12 months. Table 5.9.4 shows key housing–related findings for renter most needy households. (See also, Appendix 2.G) Table 5.9.4a: Financial Situation in Renter Most Needy Households
Most Needy Renter Financial Situation
Percent of Renter
Most Needy Households
Households with less than $15,000 combined annual income 42% Households with $15,000 - $29,999 combined annual income 24% Households with $30,000 - $49,999 combined annual income (was “- $44,999”) 20% Households with $50,000 - $99,999 combined annual income (was “$45,000 –“) 14% Households with $100,000 - $149,999 combined annual income 0% Households with $150,000 or above combined annual income 0% Households with combined annual income BELOW the County median* 89% Households with combined annual income ABOVE the County median* 11% Households with combined annual income Less Than 200% of poverty level** 59% Median Annual Household Income (combined, from all sources) $15,000-$29,999 “Working Poor” households (employed adults, but income less than 200% of poverty level)
40%
Median Monthly Housing Payment [median indicates: 1/2 below - 1/2 above] $800-$999 Total Housing Payments as % of Gross Income [ = $900*12 divided by $22,500] 48%
* The Barnstable County (MA) median household income was estimated by the US Census Bureau to be $58,422 in the year 2007 (latest year for which an official estimate is available). ** 200% of poverty in Year 2008 was defined as: $20,800 for one person living alone, $28,000 for a family of two, and $42,800 for a family of four. Table 5.9.4b: Housing Situation in Renter Most Needy Households
Most Needy Renter Housing Situation
Percent of Renter
Most Needy Households
Renter Households: Of renter households, percent where rent includes electricity 29% Of renter households, percent where rent includes heat 31% Living in Senior Housing or Assisted Living Unit 0% Household’s housing unit needs major repair to make it truly habitable 13% Any household member been “homeless” for more than 1-2 days? (Yes) 26%
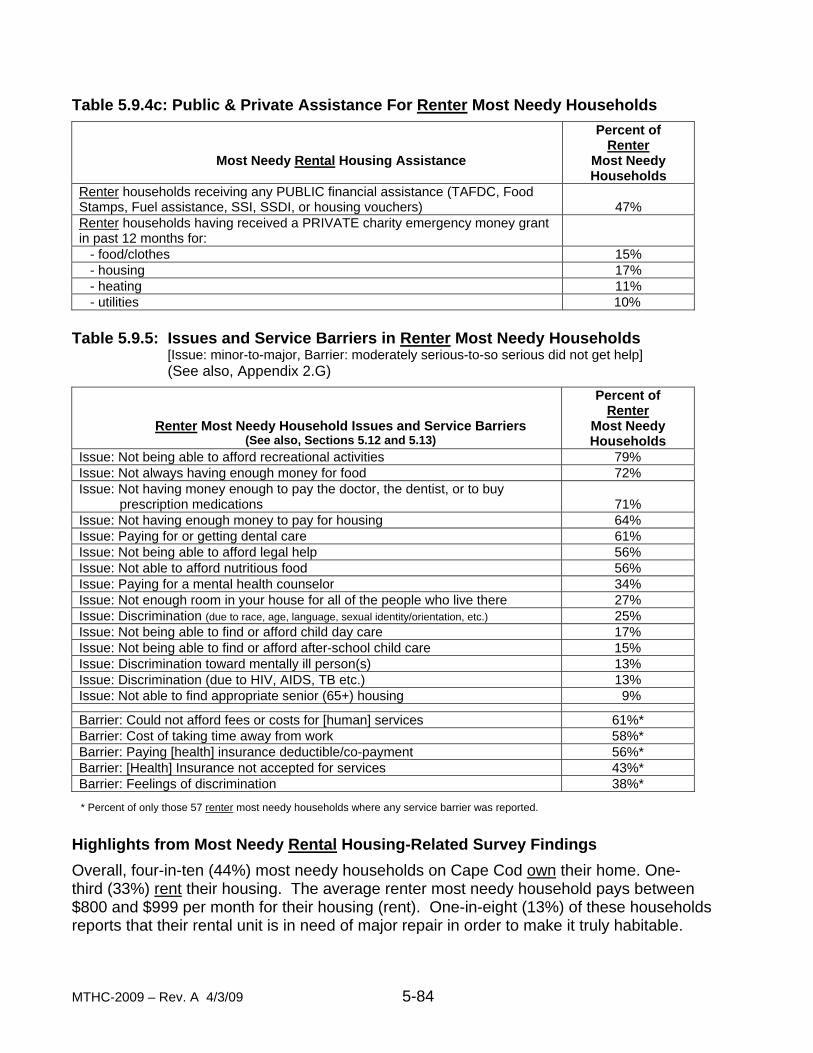
MTHC-2009 – Rev. A 4/3/09 5-84
Table 5.9.4c: Public & Private Assistance For Renter Most Needy Households
Most Needy Rental Housing Assistance
Percent of Renter
Most Needy Households
Renter households receiving any PUBLIC financial assistance (TAFDC, Food Stamps, Fuel assistance, SSI, SSDI, or housing vouchers)
47%
Renter households having received a PRIVATE charity emergency money grant in past 12 months for:
- food/clothes 15% - housing 17% - heating 11% - utilities 10%
Table 5.9.5: Issues and Service Barriers in Renter Most Needy Households
[Issue: minor-to-major, Barrier: moderately serious-to-so serious did not get help] (See also, Appendix 2.G)
Renter Most Needy Household Issues and Service Barriers (See also, Sections 5.12 and 5.13)
Percent of Renter
Most Needy Households
Issue: Not being able to afford recreational activities 79% Issue: Not always having enough money for food 72% Issue: Not having money enough to pay the doctor, the dentist, or to buy prescription medications
71%
Issue: Not having enough money to pay for housing 64% Issue: Paying for or getting dental care 61% Issue: Not being able to afford legal help 56% Issue: Not able to afford nutritious food 56% Issue: Paying for a mental health counselor 34% Issue: Not enough room in your house for all of the people who live there 27% Issue: Discrimination (due to race, age, language, sexual identity/orientation, etc.) 25% Issue: Not being able to find or afford child day care 17% Issue: Not being able to find or afford after-school child care 15% Issue: Discrimination toward mentally ill person(s) 13% Issue: Discrimination (due to HIV, AIDS, TB etc.) 13% Issue: Not able to find appropriate senior (65+) housing 9%
Barrier: Could not afford fees or costs for [human] services 61%* Barrier: Cost of taking time away from work 58%* Barrier: Paying [health] insurance deductible/co-payment 56%* Barrier: [Health] Insurance not accepted for services 43%* Barrier: Feelings of discrimination 38%*
* Percent of only those 57 renter most needy households where any service barrier was reported.
Highlights from Most Needy Rental Housing-Related Survey Findings
Overall, four-in-ten (44%) most needy households on Cape Cod own their home. One- third (33%) rent their housing. The average renter most needy household pays between $800 and $999 per month for their housing (rent). One-in-eight (13%) of these households reports that their rental unit is in need of major repair in order to make it truly habitable.
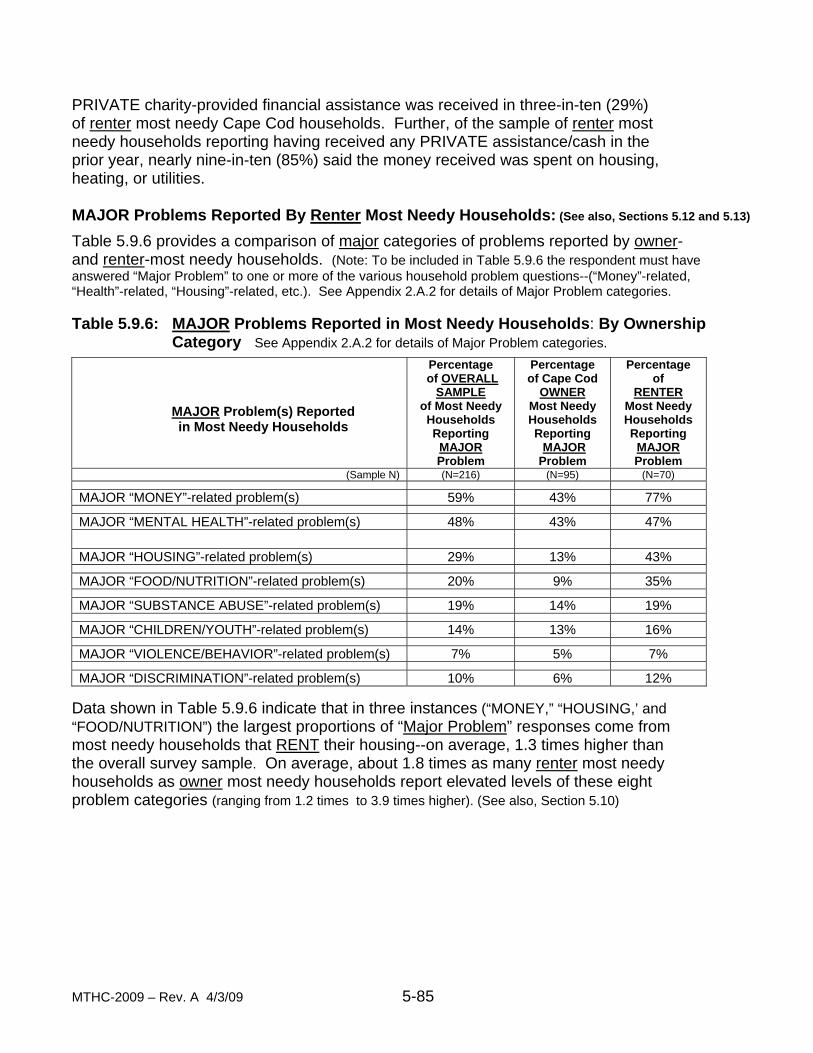
MTHC-2009 – Rev. A 4/3/09 5-85
PRIVATE charity-provided financial assistance was received in three-in-ten (29%) of renter most needy Cape Cod households. Further, of the sample of renter most needy households reporting having received any PRIVATE assistance/cash in the prior year, nearly nine-in-ten (85%) said the money received was spent on housing, heating, or utilities. MAJOR Problems Reported By Renter Most Needy Households: (See also, Sections 5.12 and 5.13)
Table 5.9.6 provides a comparison of major categories of problems reported by owner- and renter-most needy households. (Note: To be included in Table 5.9.6 the respondent must have answered “Major Problem” to one or more of the various household problem questions--(“Money”-related, “Health”-related, “Housing”-related, etc.). See Appendix 2.A.2 for details of Major Problem categories. Table 5.9.6: MAJOR Problems Reported in Most Needy Households: By Ownership
Category See Appendix 2.A.2 for details of Major Problem categories.
Data shown in Table 5.9.6 indicate that in three instances (“MONEY,” “HOUSING,’ and “FOOD/NUTRITION”) the largest proportions of “Major Problem” responses come from most needy households that RENT their housing--on average, 1.3 times higher than the overall survey sample. On average, about 1.8 times as many renter most needy households as owner most needy households report elevated levels of these eight problem categories (ranging from 1.2 times to 3.9 times higher). (See also, Section 5.10)
MAJOR Problem(s) Reported in Most Needy Households
Percentage of OVERALL
SAMPLE of Most Needy Households Reporting
MAJOR Problem
Percentage of Cape Cod
OWNER Most Needy Households Reporting MAJOR Problem
Percentage of
RENTER Most Needy Households Reporting
MAJOR Problem
(Sample N) (N=216) (N=95) (N=70)
MAJOR “MONEY”-related problem(s) 59% 43% 77%
MAJOR “MENTAL HEALTH”-related problem(s) 48% 43% 47%
MAJOR “HOUSING”-related problem(s) 29% 13% 43%
MAJOR “FOOD/NUTRITION”-related problem(s) 20% 9% 35%
MAJOR “SUBSTANCE ABUSE”-related problem(s) 19% 14% 19%
MAJOR “CHILDREN/YOUTH”-related problem(s) 14% 13% 16%
MAJOR “VIOLENCE/BEHAVIOR”-related problem(s) 7% 5% 7%
MAJOR “DISCRIMINATION”-related problem(s) 10% 6% 12%

MTHC-2009 – Rev. A 4/3/09 5-86
9.b SUPPLEMENTAL QUESTIONS on Rental Housing
NOTE: These Questions Were NOT Asked in the 2008 edition of the Cape Cod Community Survey.
** The Remainder of This Page Intentionally Left Blank **

MTHC-2009 – Rev. A 4/3/09 5-87
** This Page Intentionally Left Blank **

MTHC-2009 – Rev. A 4/3/09 5-88
** This Page Intentionally Left Blank **

MTHC-2009 – Rev. A 4/3/09 5-89
** This Page Intentionally Left Blank **

MTHC-2009 – Rev. A 4/3/09 5-90

MTHC-2009 – Rev. A 4/3/09 5-91
Section 5. Research Findings 10. Special Focus on Home Ownership The Cape Cod Community Survey – 2008 responses shed light on the following home ownership-related topics:
Amount of owned housing stock in need of repairs to be truly “habitable,” Amount ($) paid out each month for owned “housing,” “Homelessness” in homeowner households, Number of owner households receiving PRIVATE charity ($) for housing
costs, Percentage of gross income going to pay the monthly housing costs. Housing situation in homeowner households. Financial assistance received in homeowner households.
Household Issues and Service Barriers:
Cape Cod Community Survey – 2008 respondents who own their home were asked to identify major housing-related issues and problems that came up in their household during the previous year. Further, if they tried to obtain help in overcoming these problems, they were asked to identify the kinds of barriers to services that they encountered and the seriousness of those barriers. The following related issues were reported:
• Not able to find appropriate senior (65+) housing, • Not enough room in the house for all of the people who live there (overcrowding), • Not having enough money to pay for housing, • Other issues closely linked to housing availability and affordability, including;
o Discrimination (due to HIV, AIDS, TB, etc.), o Discrimination (due to race, age, language, sexual identity/orientation, etc.), o Discrimination toward mentally ill person(s) o Not being able to afford nutritious food, o Not always having enough money for food, o Not having money enough to pay the doctor, the dentist, or to buy
prescription medications, o Not enough money to pay for a mental health counselor, o Not enough money to pay for dental care, o Not enough money to pay health insurance deductible/co-payment, o Not being able to afford legal help, and o Not being able to find or afford child day care or after-school care.
Cape Cod Owner Households
Of the 845 Cape Cod households responding to the Cape Cod Community Survey - 2008, Seven-in-ten (70%) report OWNING their housing, whereas, 30% either RENT their home or live in one of several group housing situations. The median income range of all responding owner households is $60,000 - $99,999, above the median household income figure estimated by the US Census Bureau for Cape Cod [$58,422 in 2007]*. One-in-nine (11%) of Cape Cod owner households are estimated to be living under 200% of the Year 2008 federal poverty level [for the lower 48 states]. Any household with working adults, but with a combined annual income (from all sources) of less than 200% of the poverty level is classified as “working poor.” Six percent of responding owner households are
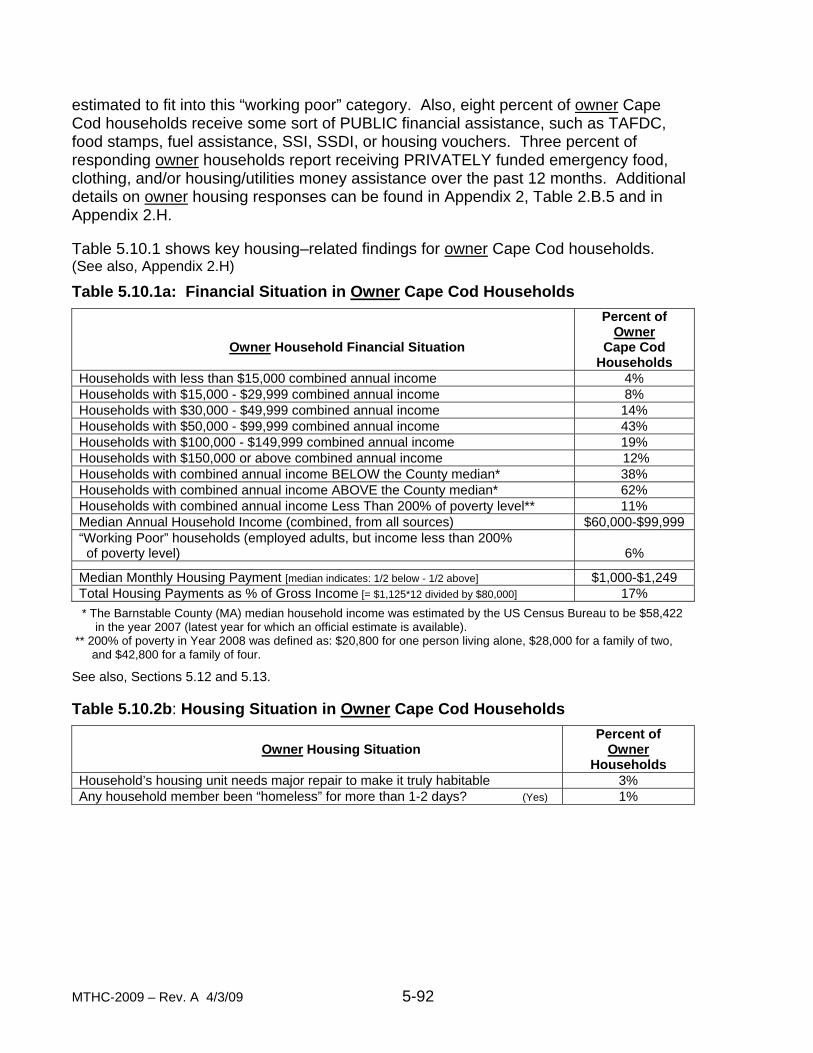
MTHC-2009 – Rev. A 4/3/09 5-92
estimated to fit into this “working poor” category. Also, eight percent of owner Cape Cod households receive some sort of PUBLIC financial assistance, such as TAFDC, food stamps, fuel assistance, SSI, SSDI, or housing vouchers. Three percent of responding owner households report receiving PRIVATELY funded emergency food, clothing, and/or housing/utilities money assistance over the past 12 months. Additional details on owner housing responses can be found in Appendix 2, Table 2.B.5 and in Appendix 2.H.
Table 5.10.1 shows key housing–related findings for owner Cape Cod households. (See also, Appendix 2.H)
Table 5.10.1a: Financial Situation in Owner Cape Cod Households
Owner Household Financial Situation
Percent of Owner
Cape Cod Households
Households with less than $15,000 combined annual income 4% Households with $15,000 - $29,999 combined annual income 8% Households with $30,000 - $49,999 combined annual income 14% Households with $50,000 - $99,999 combined annual income 43% Households with $100,000 - $149,999 combined annual income 19% Households with $150,000 or above combined annual income 12% Households with combined annual income BELOW the County median* 38% Households with combined annual income ABOVE the County median* 62% Households with combined annual income Less Than 200% of poverty level** 11% Median Annual Household Income (combined, from all sources) $60,000-$99,999 “Working Poor” households (employed adults, but income less than 200% of poverty level)
6%
Median Monthly Housing Payment [median indicates: 1/2 below - 1/2 above] $1,000-$1,249 Total Housing Payments as % of Gross Income [= $1,125*12 divided by $80,000] 17%
* The Barnstable County (MA) median household income was estimated by the US Census Bureau to be $58,422 in the year 2007 (latest year for which an official estimate is available). ** 200% of poverty in Year 2008 was defined as: $20,800 for one person living alone, $28,000 for a family of two, and $42,800 for a family of four.
See also, Sections 5.12 and 5.13. Table 5.10.2b: Housing Situation in Owner Cape Cod Households
Owner Housing Situation
Percent of Owner
Households Household’s housing unit needs major repair to make it truly habitable 3% Any household member been “homeless” for more than 1-2 days? (Yes) 1%
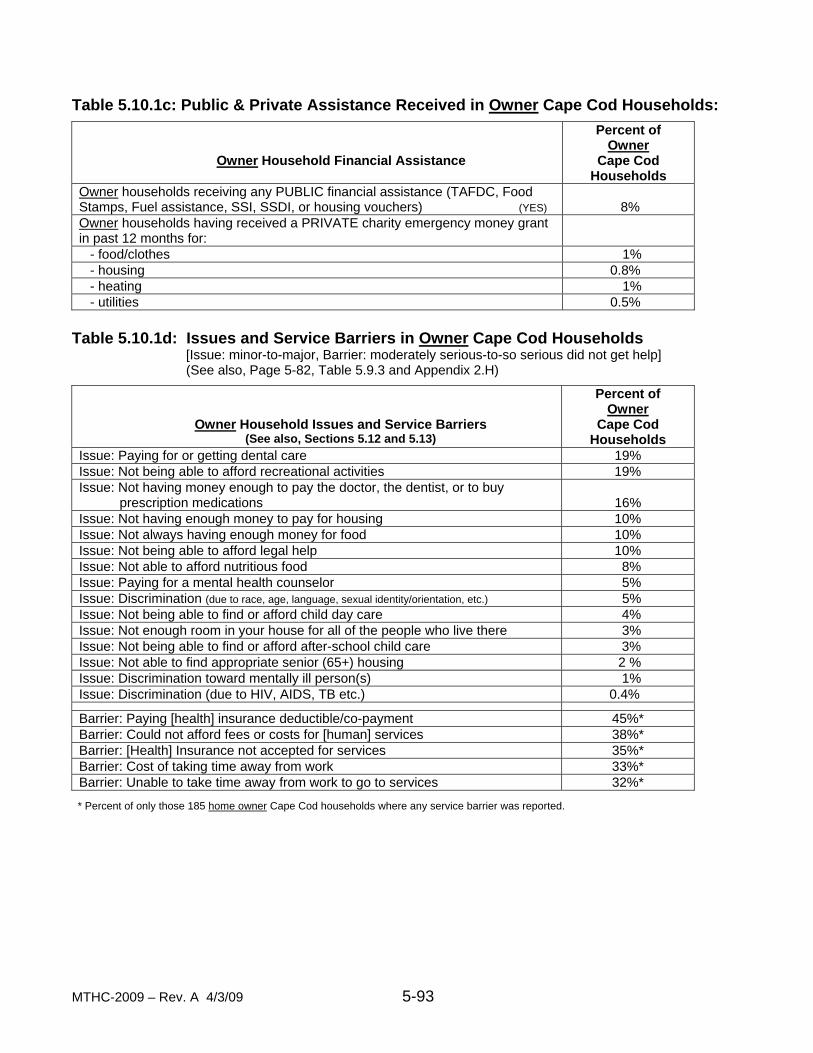
MTHC-2009 – Rev. A 4/3/09 5-93
Table 5.10.1c: Public & Private Assistance Received in Owner Cape Cod Households:
Owner Household Financial Assistance
Percent of Owner
Cape Cod Households
Owner households receiving any PUBLIC financial assistance (TAFDC, Food Stamps, Fuel assistance, SSI, SSDI, or housing vouchers) (YES)
8%
Owner households having received a PRIVATE charity emergency money grant in past 12 months for:
- food/clothes 1% - housing 0.8% - heating 1% - utilities 0.5%
Table 5.10.1d: Issues and Service Barriers in Owner Cape Cod Households
[Issue: minor-to-major, Barrier: moderately serious-to-so serious did not get help] (See also, Page 5-82, Table 5.9.3 and Appendix 2.H)
Owner Household Issues and Service Barriers (See also, Sections 5.12 and 5.13)
Percent of Owner
Cape Cod Households
Issue: Paying for or getting dental care 19% Issue: Not being able to afford recreational activities 19% Issue: Not having money enough to pay the doctor, the dentist, or to buy prescription medications
16%
Issue: Not having enough money to pay for housing 10% Issue: Not always having enough money for food 10% Issue: Not being able to afford legal help 10% Issue: Not able to afford nutritious food 8% Issue: Paying for a mental health counselor 5% Issue: Discrimination (due to race, age, language, sexual identity/orientation, etc.) 5% Issue: Not being able to find or afford child day care 4% Issue: Not enough room in your house for all of the people who live there 3% Issue: Not being able to find or afford after-school child care 3% Issue: Not able to find appropriate senior (65+) housing 2 % Issue: Discrimination toward mentally ill person(s) 1% Issue: Discrimination (due to HIV, AIDS, TB etc.) 0.4%
Barrier: Paying [health] insurance deductible/co-payment 45%* Barrier: Could not afford fees or costs for [human] services 38%* Barrier: [Health] Insurance not accepted for services 35%* Barrier: Cost of taking time away from work 33%* Barrier: Unable to take time away from work to go to services 32%*
* Percent of only those 185 home owner Cape Cod households where any service barrier was reported.
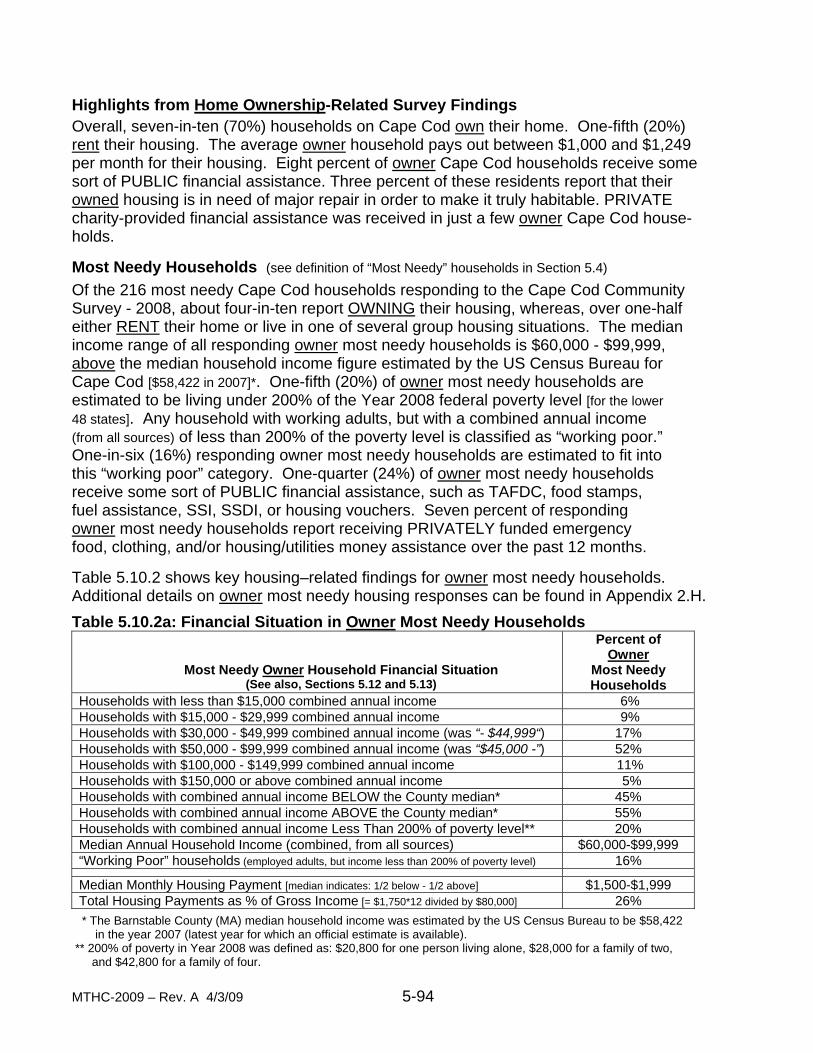
MTHC-2009 – Rev. A 4/3/09 5-94
Highlights from Home Ownership-Related Survey Findings
Overall, seven-in-ten (70%) households on Cape Cod own their home. One-fifth (20%) rent their housing. The average owner household pays out between $1,000 and $1,249 per month for their housing. Eight percent of owner Cape Cod households receive some sort of PUBLIC financial assistance. Three percent of these residents report that their owned housing is in need of major repair in order to make it truly habitable. PRIVATE charity-provided financial assistance was received in just a few owner Cape Cod house- holds. Most Needy Households (see definition of “Most Needy” households in Section 5.4)
Of the 216 most needy Cape Cod households responding to the Cape Cod Community Survey - 2008, about four-in-ten report OWNING their housing, whereas, over one-half either RENT their home or live in one of several group housing situations. The median income range of all responding owner most needy households is $60,000 - $99,999, above the median household income figure estimated by the US Census Bureau for Cape Cod [$58,422 in 2007]*. One-fifth (20%) of owner most needy households are estimated to be living under 200% of the Year 2008 federal poverty level [for the lower 48 states]. Any household with working adults, but with a combined annual income (from all sources) of less than 200% of the poverty level is classified as “working poor.” One-in-six (16%) responding owner most needy households are estimated to fit into this “working poor” category. One-quarter (24%) of owner most needy households receive some sort of PUBLIC financial assistance, such as TAFDC, food stamps, fuel assistance, SSI, SSDI, or housing vouchers. Seven percent of responding owner most needy households report receiving PRIVATELY funded emergency food, clothing, and/or housing/utilities money assistance over the past 12 months. Table 5.10.2 shows key housing–related findings for owner most needy households. Additional details on owner most needy housing responses can be found in Appendix 2.H.
Table 5.10.2a: Financial Situation in Owner Most Needy Households
Most Needy Owner Household Financial Situation (See also, Sections 5.12 and 5.13)
Percent of Owner
Most Needy Households
Households with less than $15,000 combined annual income 6% Households with $15,000 - $29,999 combined annual income 9% Households with $30,000 - $49,999 combined annual income (was “- $44,999“) 17% Households with $50,000 - $99,999 combined annual income (was “$45,000 -”) 52% Households with $100,000 - $149,999 combined annual income 11% Households with $150,000 or above combined annual income 5% Households with combined annual income BELOW the County median* 45% Households with combined annual income ABOVE the County median* 55% Households with combined annual income Less Than 200% of poverty level** 20% Median Annual Household Income (combined, from all sources) $60,000-$99,999 “Working Poor” households (employed adults, but income less than 200% of poverty level) 16%
Median Monthly Housing Payment [median indicates: 1/2 below - 1/2 above] $1,500-$1,999 Total Housing Payments as % of Gross Income [= $1,750*12 divided by $80,000] 26%
* The Barnstable County (MA) median household income was estimated by the US Census Bureau to be $58,422 in the year 2007 (latest year for which an official estimate is available). ** 200% of poverty in Year 2008 was defined as: $20,800 for one person living alone, $28,000 for a family of two, and $42,800 for a family of four.
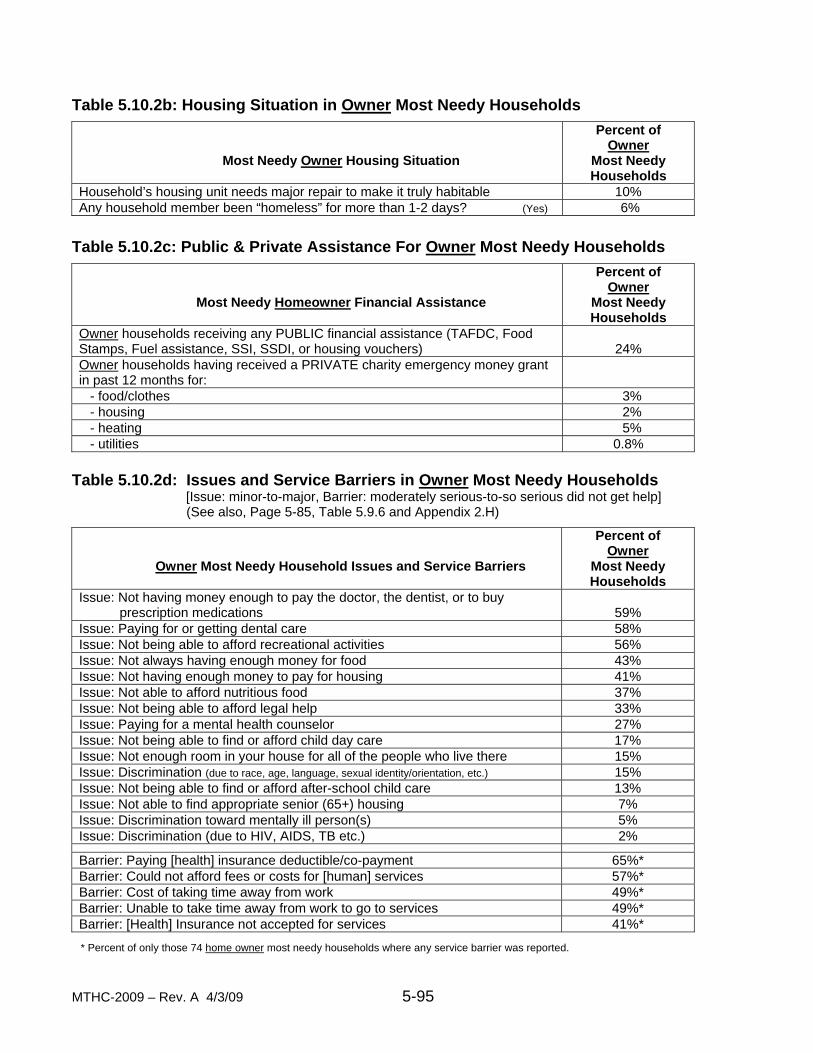
MTHC-2009 – Rev. A 4/3/09 5-95
Table 5.10.2b: Housing Situation in Owner Most Needy Households
Most Needy Owner Housing Situation
Percent of Owner
Most Needy Households
Household’s housing unit needs major repair to make it truly habitable 10% Any household member been “homeless” for more than 1-2 days? (Yes) 6%
Table 5.10.2c: Public & Private Assistance For Owner Most Needy Households
Most Needy Homeowner Financial Assistance
Percent of Owner
Most Needy Households
Owner households receiving any PUBLIC financial assistance (TAFDC, Food Stamps, Fuel assistance, SSI, SSDI, or housing vouchers)
24%
Owner households having received a PRIVATE charity emergency money grant in past 12 months for:
- food/clothes 3% - housing 2% - heating 5% - utilities 0.8%
Table 5.10.2d: Issues and Service Barriers in Owner Most Needy Households
[Issue: minor-to-major, Barrier: moderately serious-to-so serious did not get help] (See also, Page 5-85, Table 5.9.6 and Appendix 2.H)
Owner Most Needy Household Issues and Service Barriers
Percent of Owner
Most Needy Households
Issue: Not having money enough to pay the doctor, the dentist, or to buy prescription medications
59%
Issue: Paying for or getting dental care 58% Issue: Not being able to afford recreational activities 56% Issue: Not always having enough money for food 43% Issue: Not having enough money to pay for housing 41% Issue: Not able to afford nutritious food 37% Issue: Not being able to afford legal help 33% Issue: Paying for a mental health counselor 27% Issue: Not being able to find or afford child day care 17% Issue: Not enough room in your house for all of the people who live there 15% Issue: Discrimination (due to race, age, language, sexual identity/orientation, etc.) 15% Issue: Not being able to find or afford after-school child care 13% Issue: Not able to find appropriate senior (65+) housing 7% Issue: Discrimination toward mentally ill person(s) 5% Issue: Discrimination (due to HIV, AIDS, TB etc.) 2%
Barrier: Paying [health] insurance deductible/co-payment 65%* Barrier: Could not afford fees or costs for [human] services 57%* Barrier: Cost of taking time away from work 49%* Barrier: Unable to take time away from work to go to services 49%* Barrier: [Health] Insurance not accepted for services 41%*
* Percent of only those 74 home owner most needy households where any service barrier was reported.
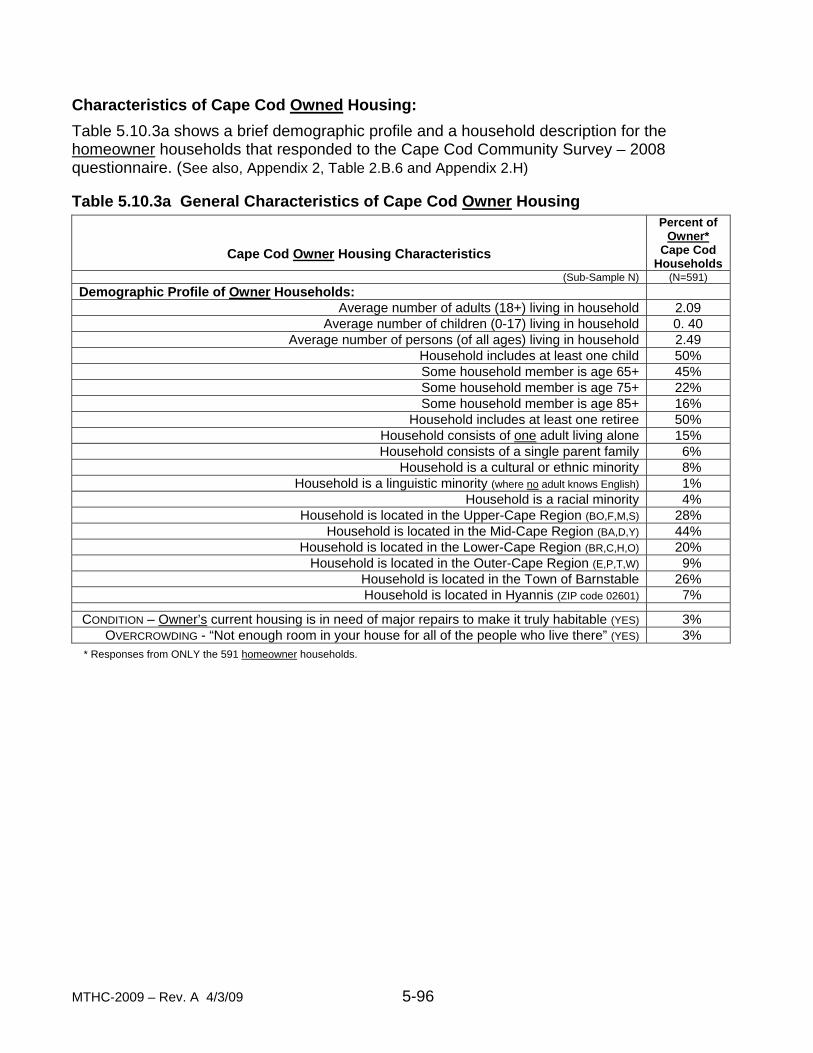
MTHC-2009 – Rev. A 4/3/09 5-96
Characteristics of Cape Cod Owned Housing:
Table 5.10.3a shows a brief demographic profile and a household description for the homeowner households that responded to the Cape Cod Community Survey – 2008 questionnaire. (See also, Appendix 2, Table 2.B.6 and Appendix 2.H) Table 5.10.3a General Characteristics of Cape Cod Owner Housing
Cape Cod Owner Housing Characteristics
Percent of Owner*
Cape Cod Households
(Sub-Sample N) (N=591) Demographic Profile of Owner Households:
Average number of adults (18+) living in household 2.09 Average number of children (0-17) living in household 0. 40
Average number of persons (of all ages) living in household 2.49 Household includes at least one child 50% Some household member is age 65+ 45% Some household member is age 75+ 22% Some household member is age 85+ 16%
Household includes at least one retiree 50% Household consists of one adult living alone 15% Household consists of a single parent family 6%
Household is a cultural or ethnic minority 8% Household is a linguistic minority (where no adult knows English) 1%
Household is a racial minority 4% Household is located in the Upper-Cape Region (BO,F,M,S) 28%
Household is located in the Mid-Cape Region (BA,D,Y) 44% Household is located in the Lower-Cape Region (BR,C,H,O) 20%
Household is located in the Outer-Cape Region (E,P,T,W) 9% Household is located in the Town of Barnstable 26% Household is located in Hyannis (ZIP code 02601) 7%
CONDITION – Owner’s current housing is in need of major repairs to make it truly habitable (YES) 3% OVERCROWDING - “Not enough room in your house for all of the people who live there” (YES) 3%
* Responses from ONLY the 591 homeowner households.
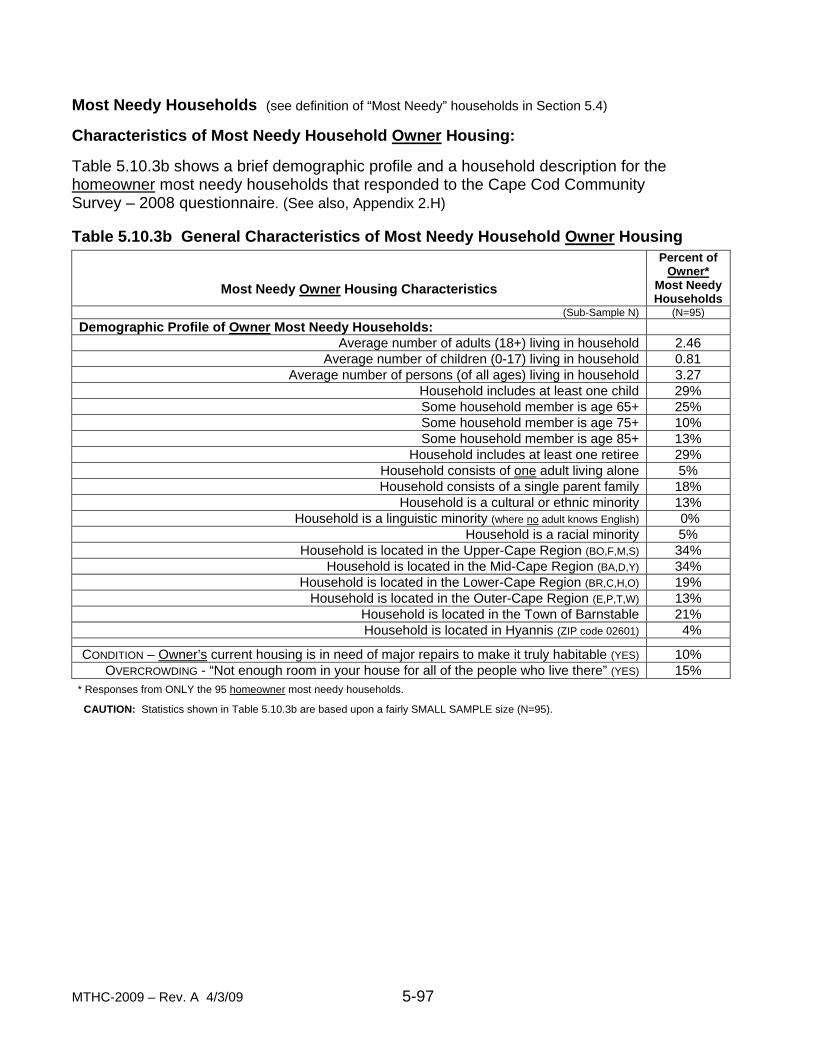
MTHC-2009 – Rev. A 4/3/09 5-97
Most Needy Households (see definition of “Most Needy” households in Section 5.4) Characteristics of Most Needy Household Owner Housing: Table 5.10.3b shows a brief demographic profile and a household description for the homeowner most needy households that responded to the Cape Cod Community Survey – 2008 questionnaire. (See also, Appendix 2.H) Table 5.10.3b General Characteristics of Most Needy Household Owner Housing
Most Needy Owner Housing Characteristics
Percent of Owner*
Most Needy Households
(Sub-Sample N) (N=95) Demographic Profile of Owner Most Needy Households:
Average number of adults (18+) living in household 2.46 Average number of children (0-17) living in household 0.81
Average number of persons (of all ages) living in household 3.27 Household includes at least one child 29% Some household member is age 65+ 25% Some household member is age 75+ 10% Some household member is age 85+ 13%
Household includes at least one retiree 29% Household consists of one adult living alone 5% Household consists of a single parent family 18%
Household is a cultural or ethnic minority 13% Household is a linguistic minority (where no adult knows English) 0%
Household is a racial minority 5% Household is located in the Upper-Cape Region (BO,F,M,S) 34%
Household is located in the Mid-Cape Region (BA,D,Y) 34% Household is located in the Lower-Cape Region (BR,C,H,O) 19%
Household is located in the Outer-Cape Region (E,P,T,W) 13% Household is located in the Town of Barnstable 21% Household is located in Hyannis (ZIP code 02601) 4%
CONDITION – Owner’s current housing is in need of major repairs to make it truly habitable (YES) 10% OVERCROWDING - “Not enough room in your house for all of the people who live there” (YES) 15%
* Responses from ONLY the 95 homeowner most needy households. CAUTION: Statistics shown in Table 5.10.3b are based upon a fairly SMALL SAMPLE size (N=95).

MTHC-2009 – Rev. A 4/3/09 5-98

MTHC-2009 – Rev. A 4/3/09 5-99
Section 5. Research Findings 11. Special Focus on Older Seniors and Elders (Age 75 and Older)
Note: Detailed questions concerning individuals age 75+ were not asked in the Cape Cod Community Survey – 2008 survey. Thus, some tables normally shown in this Section have been eliminated The Cape Cod Community Survey – 2008 responses provide insight into topics relating to households with older seniors and elders, including:
Age ranges Health status Presence of disability and/or chronic illness Driving status and transportation usage
Getting Up, Out, and About on Cape Cod:
Individuals age 75 or older living in Cape Cod Community Survey – 2008 respondent households were asked to identify and describe their personal mobility situation, including:
• Their automobile driving situation, including; (Note: 2007 data) o Driving with and without limitations o Amount of driving o Not driving
• Their riding in cars, vans, and on buses, including; o Public transit, o Private vehicles, o Council on Aging vans
Care Giving in Senior/Elder Homes:
Individuals age 75 or older living in Cape Cod Community Survey – 2008 respondent households were asked to identify and describe care that they both give and receive, including:
• Receipt of in-home healthcare or other home aide services • Care giving by household member(s)—for aged, disabled, or chronically ill person(s)
Cape Cod Households With Older Seniors/Elders
Of the 845 Cape Cod households responding to the Cape Cod Community Survey – 2008, about one-fifth (18%) report including one or more person age 75 or older. The US Census Bureau estimates that there are at least 29,600 persons ages 75+ presently living on Cape Cod, distributed as follows: 22,800 ages 75-84, and 6,800 age 85 and over. The age 75+ group is an extremely fast growing segment of the Cape’s population. Predictions are that within the next decade, our age 75+ population will increase by 25% reaching 36,000 by the year 2020, and will more than DOUBLE over the next twenty years. [Reference: http://www.fcii.us/SMICCppZ-BACty.pdf]. More than one-half of these households include someone age 85 or older. This Special Focus section provides some additional details of the “human condition” of this rapidly expanding group of Cape residents.

MTHC-2009 – Rev. A 4/3/09 5-100
Table 5.11.1a shows age distributions for Cape Cod older senior and elder households sampled by the Cape Cod Community Survey – 2008 survey.
Table 5.11.1a: Selected Age Characteristics of Age 75+ Households
Households With Person(s) Age 75+: Age Distributions
Percent of Households* With Age 75+
Person(s)* Includes someone age 85 or older 54% Includes someone ages 75-84 years 23% Includes someone ages 55-64 years 8% Includes someone ages 45-54 years 12% Includes someone ages 18-44 years 6%
* The percentages of households with someone age 75+ do not sum to 100% due to missing responses. Sampled households that include older seniors/elders tend to be located in the Lower- Cape region, especially Harwich and Orleans, and in Falmouth. Such households are less numerous in the larger towns of the Mid-Cape (Barnstable/Hyannis) and in Sandwich However, in the Mid-Cape, Yarmouth is the exception, showing a fairly high proportion of “75+” households. One adult living alone is very common (26% of the 75+ sample), with the average number of adults per household being about two (2.05). Older senior/- elder households are predominately White (94%), with a disproportionately smaller percentage being a cultural or racial minority or Hispanic.
As would be expected, persons age 75 or older report levels of fair-to-poor health consider- ably above those of the general population. More than one-quarter (26%) of “age 75” households reports someone in fair-to-poor health. Twenty-four percent of households with an age 75+ member report including a “frail” elder. Older Senior/Elder Driving: (NOTE: These data are from the year-end 2007 survey)
One-in-six persons age 75 or older do not drive. However, more than one-half (56%) report being able to drive an automobile without any limitations. Others have “self-limited” their driving to daytime periods, only in fair weather or only when there is little or no traffic congestion. As a group, drivers age 75 or older drive their car, on average, more than five days per week. When not driving, about one-in-twenty (3%-5%) ride on public transit buses, whereas seven-in-ten find private transport alternatives or walk to their destinations. Table 5.11.3 shows key mobility-related and senior/elder driving findings for age 75+ individuals living in households sampled by the Cape Cod Community Survey – 2007 survey.
** The Remainder of This Page Intentionally Left Blank **
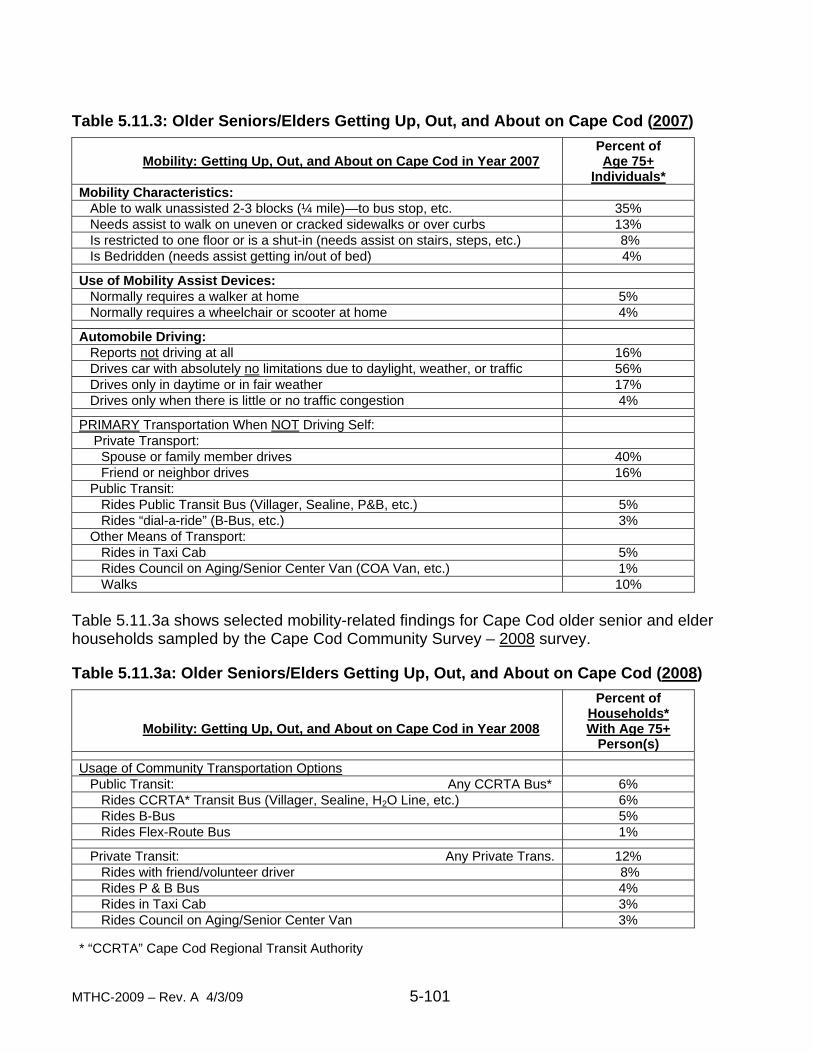
MTHC-2009 – Rev. A 4/3/09 5-101
Table 5.11.3: Older Seniors/Elders Getting Up, Out, and About on Cape Cod (2007)
Mobility: Getting Up, Out, and About on Cape Cod in Year 2007
Percent of Age 75+
Individuals* Mobility Characteristics: Able to walk unassisted 2-3 blocks (¼ mile)—to bus stop, etc. 35% Needs assist to walk on uneven or cracked sidewalks or over curbs 13% Is restricted to one floor or is a shut-in (needs assist on stairs, steps, etc.) 8% Is Bedridden (needs assist getting in/out of bed) 4%
Use of Mobility Assist Devices: Normally requires a walker at home 5% Normally requires a wheelchair or scooter at home 4%
Automobile Driving: Reports not driving at all 16% Drives car with absolutely no limitations due to daylight, weather, or traffic 56% Drives only in daytime or in fair weather 17% Drives only when there is little or no traffic congestion 4%
PRIMARY Transportation When NOT Driving Self: Private Transport: Spouse or family member drives 40% Friend or neighbor drives 16% Public Transit: Rides Public Transit Bus (Villager, Sealine, P&B, etc.) 5% Rides “dial-a-ride” (B-Bus, etc.) 3% Other Means of Transport: Rides in Taxi Cab 5% Rides Council on Aging/Senior Center Van (COA Van, etc.) 1% Walks 10%
Table 5.11.3a shows selected mobility-related findings for Cape Cod older senior and elder households sampled by the Cape Cod Community Survey – 2008 survey.
Table 5.11.3a: Older Seniors/Elders Getting Up, Out, and About on Cape Cod (2008)
Mobility: Getting Up, Out, and About on Cape Cod in Year 2008
Percent of Households* With Age 75+
Person(s)
Usage of Community Transportation Options Public Transit: Any CCRTA Bus* 6% Rides CCRTA* Transit Bus (Villager, Sealine, H2O Line, etc.) 6% Rides B-Bus 5% Rides Flex-Route Bus 1%
Private Transit: Any Private Trans. 12% Rides with friend/volunteer driver 8% Rides P & B Bus 4% Rides in Taxi Cab 3% Rides Council on Aging/Senior Center Van 3%
* “CCRTA” Cape Cod Regional Transit Authority
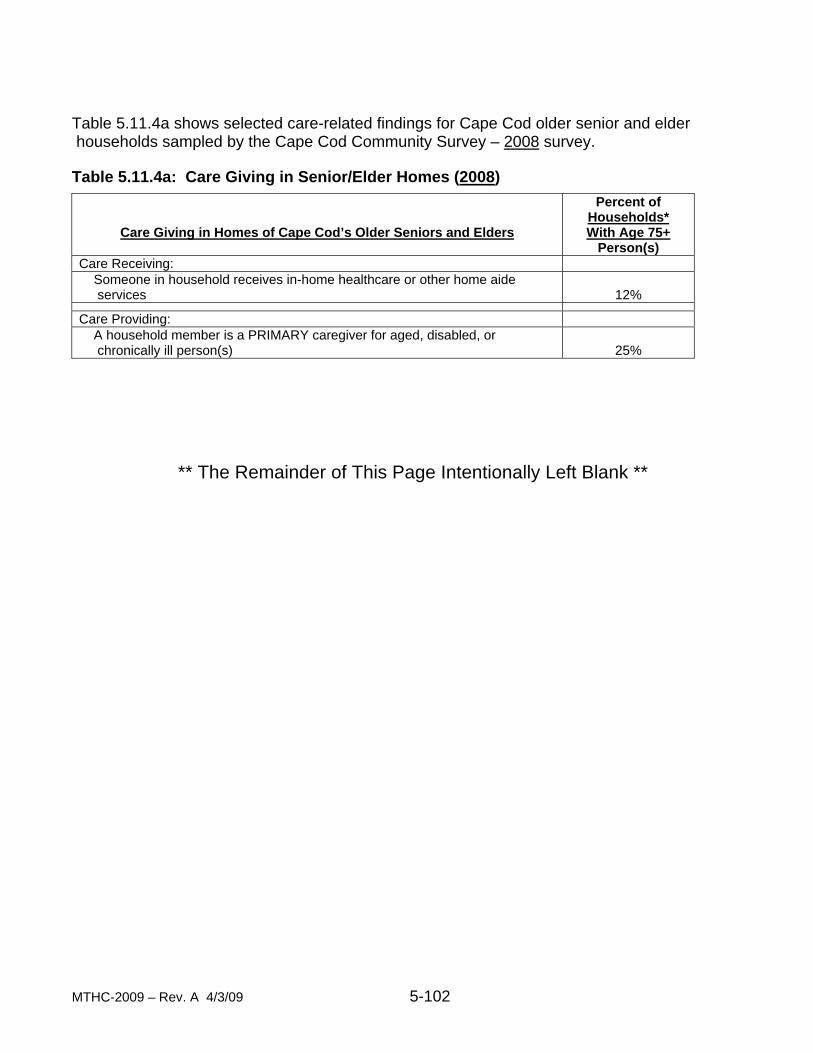
MTHC-2009 – Rev. A 4/3/09 5-102
Table 5.11.4a shows selected care-related findings for Cape Cod older senior and elder households sampled by the Cape Cod Community Survey – 2008 survey. Table 5.11.4a: Care Giving in Senior/Elder Homes (2008)
Care Giving in Homes of Cape Cod’s Older Seniors and Elders
Percent of Households* With Age 75+
Person(s) Care Receiving: Someone in household receives in-home healthcare or other home aide services
12%
Care Providing: A household member is a PRIMARY caregiver for aged, disabled, or chronically ill person(s)
25%
** The Remainder of This Page Intentionally Left Blank **
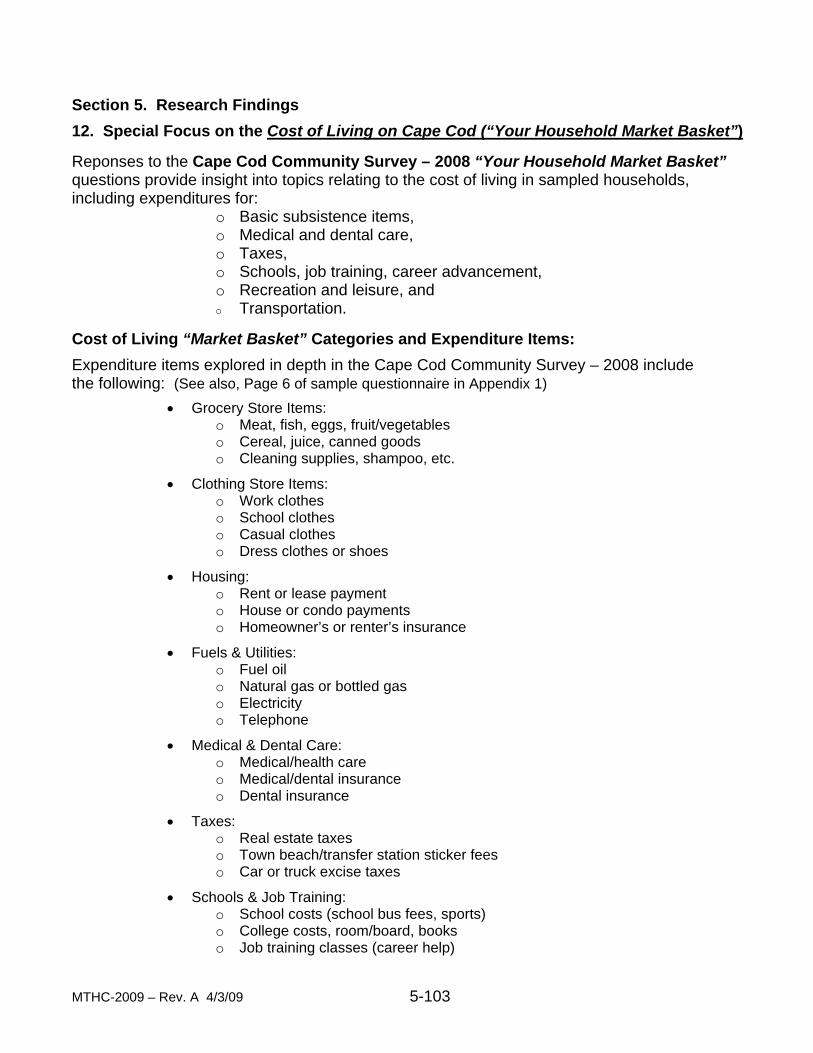
MTHC-2009 – Rev. A 4/3/09 5-103
Section 5. Research Findings
12. Special Focus on the Cost of Living on Cape Cod (“Your Household Market Basket”) Reponses to the Cape Cod Community Survey – 2008 “Your Household Market Basket” questions provide insight into topics relating to the cost of living in sampled households, including expenditures for:
o Basic subsistence items, o Medical and dental care, o Taxes, o Schools, job training, career advancement, o Recreation and leisure, and o Transportation.
Cost of Living “Market Basket” Categories and Expenditure Items:
Expenditure items explored in depth in the Cape Cod Community Survey – 2008 include the following: (See also, Page 6 of sample questionnaire in Appendix 1)
• Grocery Store Items: o Meat, fish, eggs, fruit/vegetables o Cereal, juice, canned goods o Cleaning supplies, shampoo, etc.
• Clothing Store Items: o Work clothes o School clothes o Casual clothes o Dress clothes or shoes
• Housing: o Rent or lease payment o House or condo payments o Homeowner’s or renter’s insurance
• Fuels & Utilities: o Fuel oil o Natural gas or bottled gas o Electricity o Telephone
• Medical & Dental Care: o Medical/health care o Medical/dental insurance o Dental insurance
• Taxes: o Real estate taxes o Town beach/transfer station sticker fees o Car or truck excise taxes
• Schools & Job Training: o School costs (school bus fees, sports) o College costs, room/board, books o Job training classes (career help)
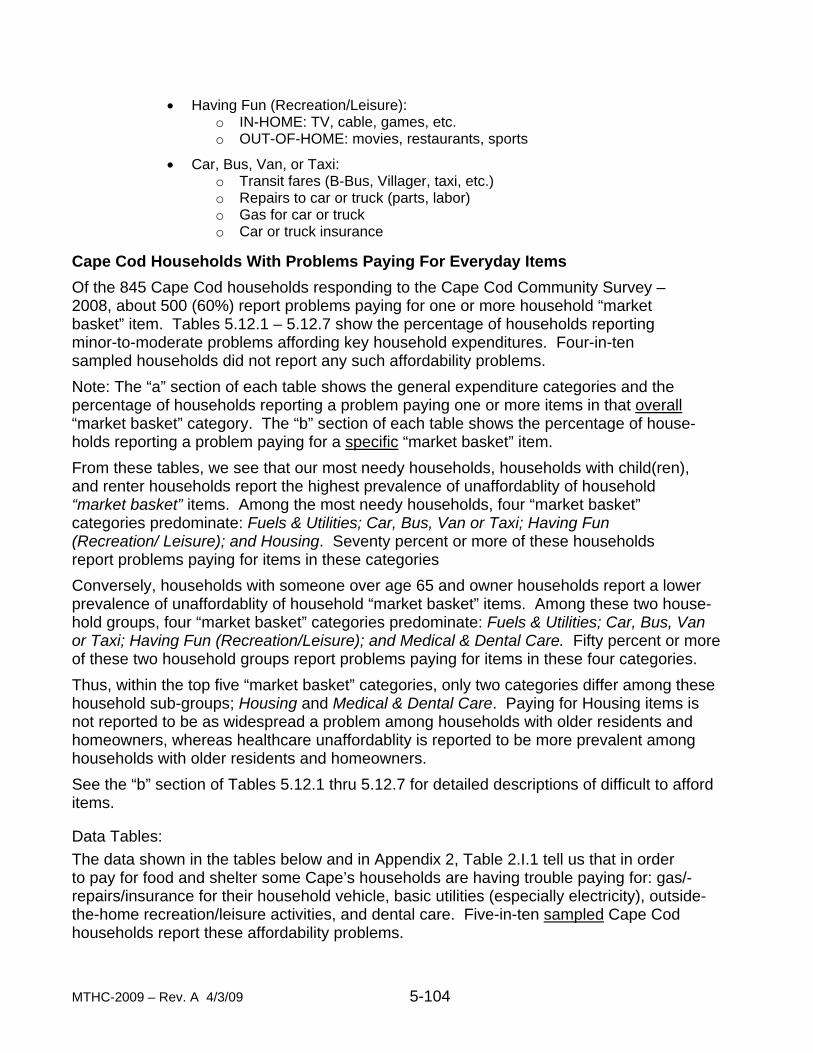
MTHC-2009 – Rev. A 4/3/09 5-104
• Having Fun (Recreation/Leisure): o IN-HOME: TV, cable, games, etc. o OUT-OF-HOME: movies, restaurants, sports
• Car, Bus, Van, or Taxi: o Transit fares (B-Bus, Villager, taxi, etc.) o Repairs to car or truck (parts, labor) o Gas for car or truck o Car or truck insurance
Cape Cod Households With Problems Paying For Everyday Items
Of the 845 Cape Cod households responding to the Cape Cod Community Survey – 2008, about 500 (60%) report problems paying for one or more household “market basket” item. Tables 5.12.1 – 5.12.7 show the percentage of households reporting minor-to-moderate problems affording key household expenditures. Four-in-ten sampled households did not report any such affordability problems.
Note: The “a” section of each table shows the general expenditure categories and the percentage of households reporting a problem paying one or more items in that overall “market basket” category. The “b” section of each table shows the percentage of house- holds reporting a problem paying for a specific “market basket” item.
From these tables, we see that our most needy households, households with child(ren), and renter households report the highest prevalence of unaffordablity of household “market basket” items. Among the most needy households, four “market basket” categories predominate: Fuels & Utilities; Car, Bus, Van or Taxi; Having Fun (Recreation/ Leisure); and Housing. Seventy percent or more of these households report problems paying for items in these categories
Conversely, households with someone over age 65 and owner households report a lower prevalence of unaffordablity of household “market basket” items. Among these two house- hold groups, four “market basket” categories predominate: Fuels & Utilities; Car, Bus, Van or Taxi; Having Fun (Recreation/Leisure); and Medical & Dental Care. Fifty percent or more of these two household groups report problems paying for items in these four categories.
Thus, within the top five “market basket” categories, only two categories differ among these household sub-groups; Housing and Medical & Dental Care. Paying for Housing items is not reported to be as widespread a problem among households with older residents and homeowners, whereas healthcare unaffordablity is reported to be more prevalent among households with older residents and homeowners.
See the “b” section of Tables 5.12.1 thru 5.12.7 for detailed descriptions of difficult to afford items. Data Tables:
The data shown in the tables below and in Appendix 2, Table 2.I.1 tell us that in order to pay for food and shelter some Cape’s households are having trouble paying for: gas/- repairs/insurance for their household vehicle, basic utilities (especially electricity), outside- the-home recreation/leisure activities, and dental care. Five-in-ten sampled Cape Cod households report these affordability problems.
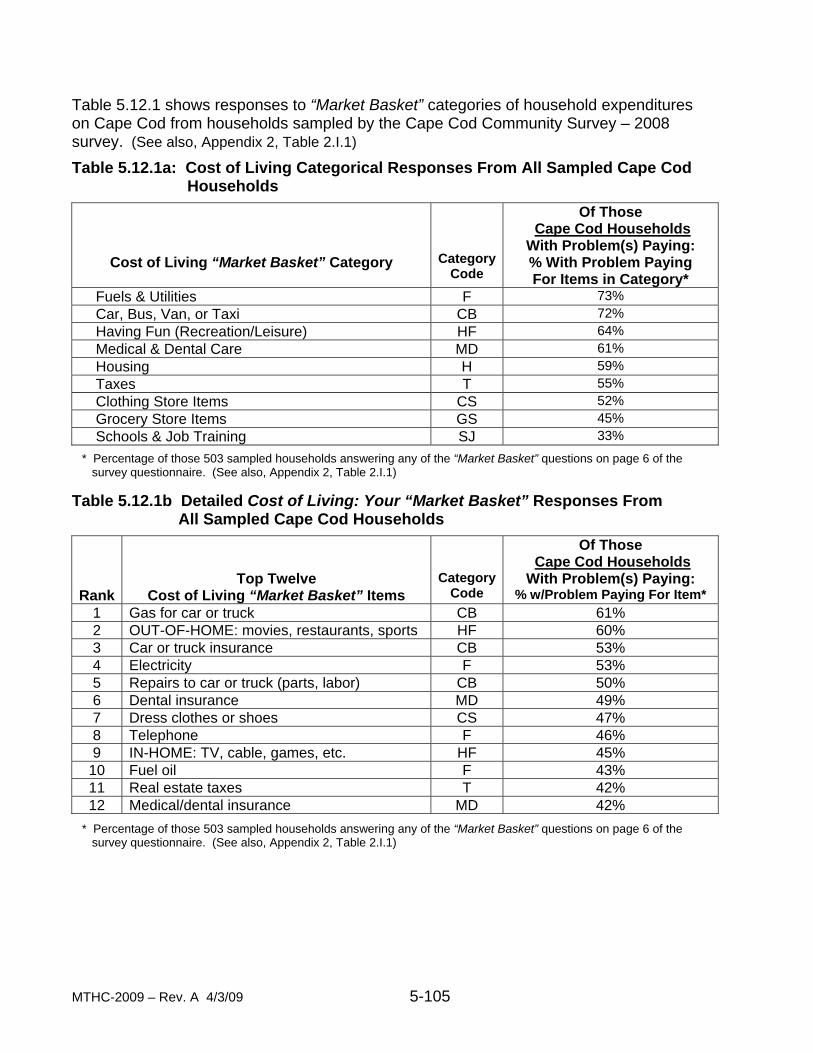
MTHC-2009 – Rev. A 4/3/09 5-105
Table 5.12.1 shows responses to “Market Basket” categories of household expenditures on Cape Cod from households sampled by the Cape Cod Community Survey – 2008 survey. (See also, Appendix 2, Table 2.I.1)
Table 5.12.1a: Cost of Living Categorical Responses From All Sampled Cape Cod Households
Cost of Living “Market Basket” Category
Category Code
Of Those Cape Cod Households
With Problem(s) Paying: % With Problem Paying For Items in Category*
Fuels & Utilities F 73%
Car, Bus, Van, or Taxi CB 72% Having Fun (Recreation/Leisure) HF 64% Medical & Dental Care MD 61% Housing H 59% Taxes T 55% Clothing Store Items CS 52% Grocery Store Items GS 45% Schools & Job Training SJ 33%
* Percentage of those 503 sampled households answering any of the “Market Basket” questions on page 6 of the survey questionnaire. (See also, Appendix 2, Table 2.I.1) Table 5.12.1b Detailed Cost of Living: Your “Market Basket” Responses From
All Sampled Cape Cod Households
Rank
Top Twelve Cost of Living “Market Basket” Items
Category Code
Of Those Cape Cod Households
With Problem(s) Paying: % w/Problem Paying For Item*
1 Gas for car or truck CB 61% 2 OUT-OF-HOME: movies, restaurants, sports HF 60% 3 Car or truck insurance CB 53% 4 Electricity F 53% 5 Repairs to car or truck (parts, labor) CB 50% 6 Dental insurance MD 49% 7 Dress clothes or shoes CS 47% 8 Telephone F 46% 9 IN-HOME: TV, cable, games, etc. HF 45%
10 Fuel oil F 43% 11 Real estate taxes T 42% 12 Medical/dental insurance MD 42%
* Percentage of those 503 sampled households answering any of the “Market Basket” questions on page 6 of the survey questionnaire. (See also, Appendix 2, Table 2.I.1)
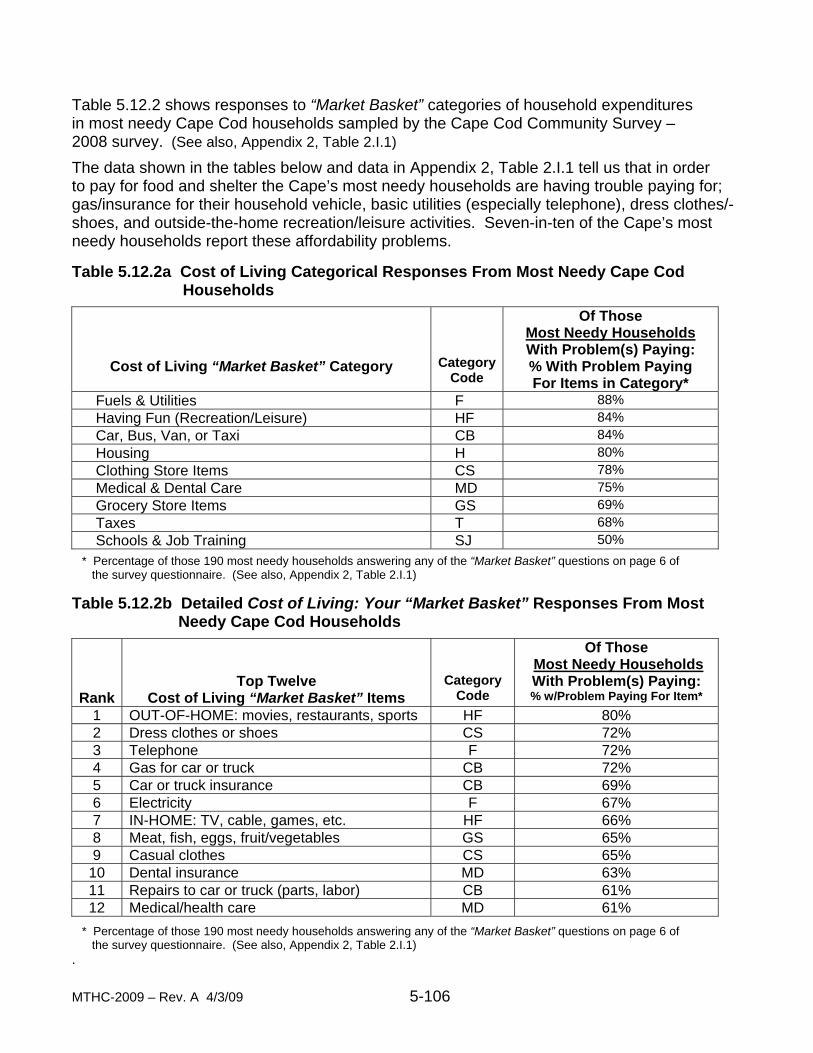
MTHC-2009 – Rev. A 4/3/09 5-106
Table 5.12.2 shows responses to “Market Basket” categories of household expenditures in most needy Cape Cod households sampled by the Cape Cod Community Survey – 2008 survey. (See also, Appendix 2, Table 2.I.1)
The data shown in the tables below and data in Appendix 2, Table 2.I.1 tell us that in order to pay for food and shelter the Cape’s most needy households are having trouble paying for; gas/insurance for their household vehicle, basic utilities (especially telephone), dress clothes/- shoes, and outside-the-home recreation/leisure activities. Seven-in-ten of the Cape’s most needy households report these affordability problems. Table 5.12.2a Cost of Living Categorical Responses From Most Needy Cape Cod Households
Cost of Living “Market Basket” Category
Category
Code
Of Those Most Needy Households With Problem(s) Paying: % With Problem Paying For Items in Category*
Fuels & Utilities F 88%
Having Fun (Recreation/Leisure) HF 84% Car, Bus, Van, or Taxi CB 84% Housing H 80% Clothing Store Items CS 78% Medical & Dental Care MD 75% Grocery Store Items GS 69% Taxes T 68% Schools & Job Training SJ 50%
* Percentage of those 190 most needy households answering any of the “Market Basket” questions on page 6 of the survey questionnaire. (See also, Appendix 2, Table 2.I.1) Table 5.12.2b Detailed Cost of Living: Your “Market Basket” Responses From Most Needy Cape Cod Households
Rank
Top Twelve Cost of Living “Market Basket” Items
Category
Code
Of Those Most Needy Households With Problem(s) Paying: % w/Problem Paying For Item*
1 OUT-OF-HOME: movies, restaurants, sports HF 80% 2 Dress clothes or shoes CS 72% 3 Telephone F 72% 4 Gas for car or truck CB 72% 5 Car or truck insurance CB 69% 6 Electricity F 67% 7 IN-HOME: TV, cable, games, etc. HF 66% 8 Meat, fish, eggs, fruit/vegetables GS 65% 9 Casual clothes CS 65%
10 Dental insurance MD 63% 11 Repairs to car or truck (parts, labor) CB 61% 12 Medical/health care MD 61%
* Percentage of those 190 most needy households answering any of the “Market Basket” questions on page 6 of the survey questionnaire. (See also, Appendix 2, Table 2.I.1) .
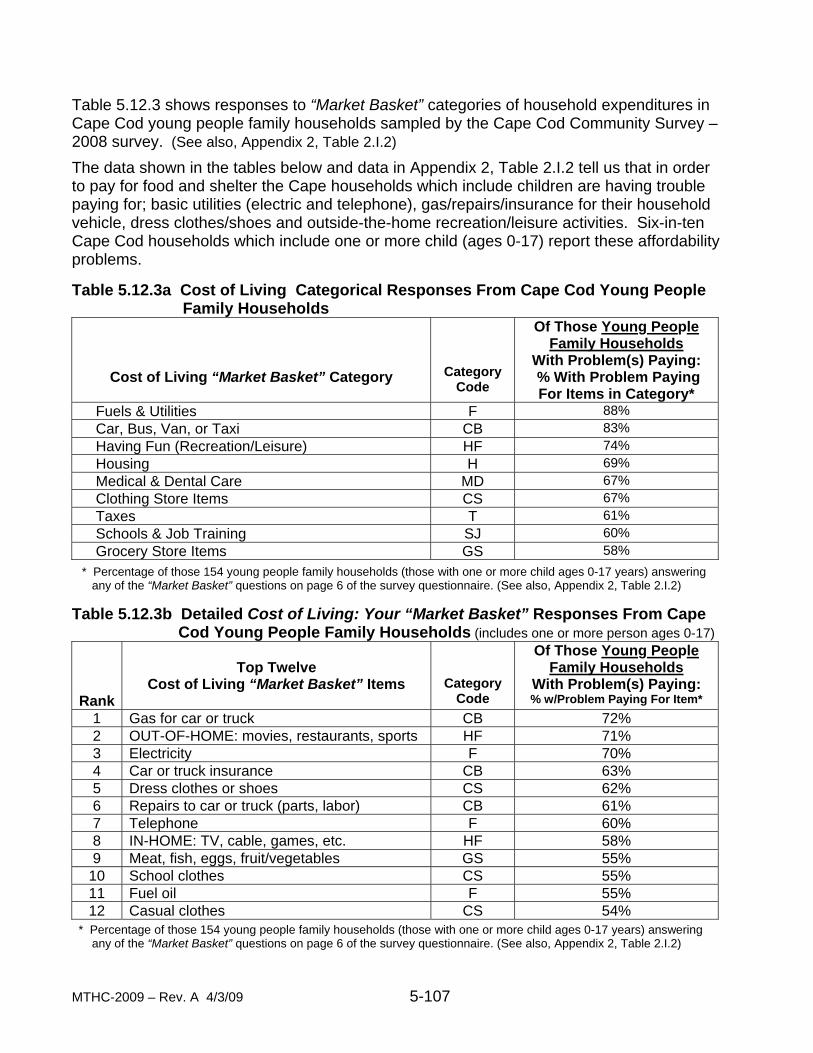
MTHC-2009 – Rev. A 4/3/09 5-107
Table 5.12.3 shows responses to “Market Basket” categories of household expenditures in Cape Cod young people family households sampled by the Cape Cod Community Survey – 2008 survey. (See also, Appendix 2, Table 2.I.2)
The data shown in the tables below and data in Appendix 2, Table 2.I.2 tell us that in order to pay for food and shelter the Cape households which include children are having trouble paying for; basic utilities (electric and telephone), gas/repairs/insurance for their household vehicle, dress clothes/shoes and outside-the-home recreation/leisure activities. Six-in-ten Cape Cod households which include one or more child (ages 0-17) report these affordability problems. Table 5.12.3a Cost of Living Categorical Responses From Cape Cod Young People Family Households
Cost of Living “Market Basket” Category
Category
Code
Of Those Young People Family Households
With Problem(s) Paying: % With Problem Paying For Items in Category*
Fuels & Utilities F 88%
Car, Bus, Van, or Taxi CB 83% Having Fun (Recreation/Leisure) HF 74% Housing H 69% Medical & Dental Care MD 67% Clothing Store Items CS 67% Taxes T 61% Schools & Job Training SJ 60% Grocery Store Items GS 58%
* Percentage of those 154 young people family households (those with one or more child ages 0-17 years) answering any of the “Market Basket” questions on page 6 of the survey questionnaire. (See also, Appendix 2, Table 2.I.2) Table 5.12.3b Detailed Cost of Living: Your “Market Basket” Responses From Cape Cod Young People Family Households (includes one or more person ages 0-17)
Rank
Top Twelve
Cost of Living “Market Basket” Items
Category
Code
Of Those Young People Family Households
With Problem(s) Paying: % w/Problem Paying For Item*
1 Gas for car or truck CB 72% 2 OUT-OF-HOME: movies, restaurants, sports HF 71% 3 Electricity F 70% 4 Car or truck insurance CB 63% 5 Dress clothes or shoes CS 62% 6 Repairs to car or truck (parts, labor) CB 61% 7 Telephone F 60% 8 IN-HOME: TV, cable, games, etc. HF 58% 9 Meat, fish, eggs, fruit/vegetables GS 55%
10 School clothes CS 55% 11 Fuel oil F 55% 12 Casual clothes CS 54%
* Percentage of those 154 young people family households (those with one or more child ages 0-17 years) answering any of the “Market Basket” questions on page 6 of the survey questionnaire. (See also, Appendix 2, Table 2.I.2)

MTHC-2009 – Rev. A 4/3/09 5-108
Table 5.12.4 shows responses to “Market Basket” categories of household expenditures on Cape Cod from households with someone age 65 or older sampled by the Cape Cod Community Survey – 2008 survey. (See also, Appendix 2, Table 2.I.2)
The data shown in the tables below and data in Appendix 2, Table 2.I.2 tell us that in order to pay for food and shelter the Cape households with someone age 65 or older are having trouble paying for; dental care, gas/repairs/insurance for their household vehicle, and outside- the-home recreation/leisure activities. At least four-in-ten Cape Cod households which include someone age 65 or older report these affordability problems. Table 5.12.4a: Cost of Living Categorical Responses From Cape Cod Households With Someone Age 65 or Older
Cost of Living “Market Basket” Category
Category Code
Of Those Households With Someone Age 65+ With Problem(s) Paying: % With Problem Paying For Items in Category*
Car, Bus, Van, or Taxi CB 66% Fuels & Utilities F 61%
Medical & Dental Care MD 60% Having Fun (Recreation/Leisure) HF 52% Taxes T 51% Housing H 45% Clothing Store Items CS 34% Grocery Store Items GS 34% Schools & Job Training SJ 10%
* Percentage of those 148 households with someone age 65 or older answering the “Market Basket” questions on page 6 of the survey questionnaire. (See also, Appendix 2, Table 2.I.1) Table 5.12.4b Detailed Cost of Living: Your “Market Basket” Responses From Cape Cod Households With Someone Age 65 or Older
Rank
Top Twelve
Cost of Living “Market Basket” Items
Category
Code
Of Those Households With Someone Age 65+ With Problem(s) Paying:
% w/Problem Paying For Item* 1 Dental insurance MD 53% 2 Gas for car or truck CB 51% 3 OUT-OF-HOME: movies, restaurants, sports HF 49% 4 Repairs to car or truck (parts, labor) CB 44% 5 Car or truck insurance CB 44% 6 Real estate taxes T 43% 7 Electricity F 40% 8 Homeowner’s or renter’s insurance H 34% 9 Medical/dental insurance MD 34%
10 Fuel oil F 33% 11 IN-HOME: TV, cable, games, etc. HF 33% 12 Meat, fish, eggs, fruit/vegetables GS 31%
* Percentage of those 148 households with someone age 65 or older answering the “Market Basket” questions on page 6 of the survey questionnaire. (See also, Appendix 2, Table 2.I.1)

MTHC-2009 – Rev. A 4/3/09 5-109
Table 5.12.5 shows responses to “Market Basket” categories of household expenditures on Cape Cod from households with someone age 75 or older sampled by the Cape Cod Community Survey – 2008 survey. (See also, Appendix 2, Table 2.I.2)
The data shown in the tables below and data in Appendix 2, Table 2.I.2 tell us that in order to pay for food and shelter the Cape households with someone age 75 or older are having trouble paying for; gas/repairs for their household vehicle, real estate taxes, outside-the- home recreation/leisure activities, and dental care, Four-in-ten Cape Cod households which include someone age 75 or older report these affordability problems. Table 5.12.5a: Cost of Living Categorical Responses From Cape Cod Households With Someone Age 75 or Older
Cost of Living “Market Basket” Category
Category Code
Of Those Households With Someone Age 75+ With Problem(s) Paying: % With Problem Paying For Items in Category*
Car, Bus, Van, or Taxi CB 59% Fuels & Utilities F 58%
Medical & Dental Care MD 56% Having Fun (Recreation/Leisure) HF 50% Taxes T 50% Housing H 43% Grocery Store Items GS 31% Clothing Store Items CS 25% Schools & Job Training SJ 6%
* Percentage of those 67 households with someone age 75 or older answering any of the “Market Basket” questions on page 6 of the survey questionnaire. (See also, Appendix 2, Table 2.I.1) Table 5.12.5b Detailed Cost of Living: Your “Market Basket” Responses From Cape Cod Households Which Include Someone Age 75 or Older
Rank
Top Twelve
Cost of Living “Market Basket” Items
Category
Code
Of Those Households With Someone Age 75+ With Problem(s) Paying:
% w/Problem Paying For Item* 1 Dental insurance MD 49% 2 Repairs to car or truck (parts, labor) CB 47% 3 OUT-OF-HOME: movies, restaurants, sports HF 46% 4 Real estate taxes T 43% 5 Gas for car or truck CB 41% 6 Car or truck insurance CB 37% 7 Homeowner’s or renter’s insurance H 35% 8 Fuel oil F 35% 9 Electricity F 35%
10 Medical/dental insurance MD 29% 11 IN-HOME: TV, cable, games, etc. HF 29% 12 Meat, fish, eggs, fruit/vegetables GS 27%
* Percentage of those 67 households with someone age 75 or older answering any of the “Market Basket” questions on page 6 of the survey questionnaire. (See also, Appendix 2, Table 2.I.1)
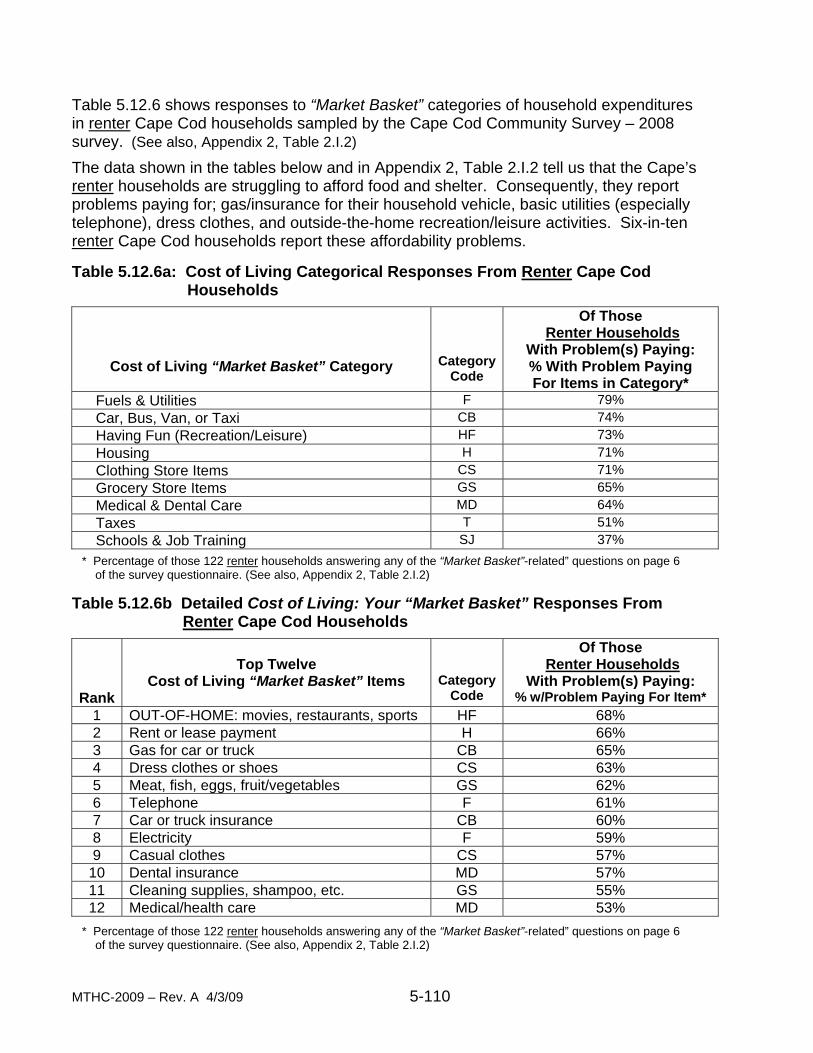
MTHC-2009 – Rev. A 4/3/09 5-110
Table 5.12.6 shows responses to “Market Basket” categories of household expenditures in renter Cape Cod households sampled by the Cape Cod Community Survey – 2008 survey. (See also, Appendix 2, Table 2.I.2)
The data shown in the tables below and in Appendix 2, Table 2.I.2 tell us that the Cape’s renter households are struggling to afford food and shelter. Consequently, they report problems paying for; gas/insurance for their household vehicle, basic utilities (especially telephone), dress clothes, and outside-the-home recreation/leisure activities. Six-in-ten renter Cape Cod households report these affordability problems. Table 5.12.6a: Cost of Living Categorical Responses From Renter Cape Cod Households
Cost of Living “Market Basket” Category
Category Code
Of Those Renter Households
With Problem(s) Paying: % With Problem Paying For Items in Category*
Fuels & Utilities F 79%
Car, Bus, Van, or Taxi CB 74% Having Fun (Recreation/Leisure) HF 73% Housing H 71% Clothing Store Items CS 71% Grocery Store Items GS 65% Medical & Dental Care MD 64% Taxes T 51% Schools & Job Training SJ 37%
* Percentage of those 122 renter households answering any of the “Market Basket”-related” questions on page 6 of the survey questionnaire. (See also, Appendix 2, Table 2.I.2) Table 5.12.6b Detailed Cost of Living: Your “Market Basket” Responses From Renter Cape Cod Households
Rank
Top Twelve
Cost of Living “Market Basket” Items
Category Code
Of Those Renter Households
With Problem(s) Paying: % w/Problem Paying For Item*
1 OUT-OF-HOME: movies, restaurants, sports HF 68% 2 Rent or lease payment H 66% 3 Gas for car or truck CB 65% 4 Dress clothes or shoes CS 63% 5 Meat, fish, eggs, fruit/vegetables GS 62% 6 Telephone F 61% 7 Car or truck insurance CB 60% 8 Electricity F 59% 9 Casual clothes CS 57%
10 Dental insurance MD 57% 11 Cleaning supplies, shampoo, etc. GS 55% 12 Medical/health care MD 53%
* Percentage of those 122 renter households answering any of the “Market Basket”-related” questions on page 6 of the survey questionnaire. (See also, Appendix 2, Table 2.I.2)
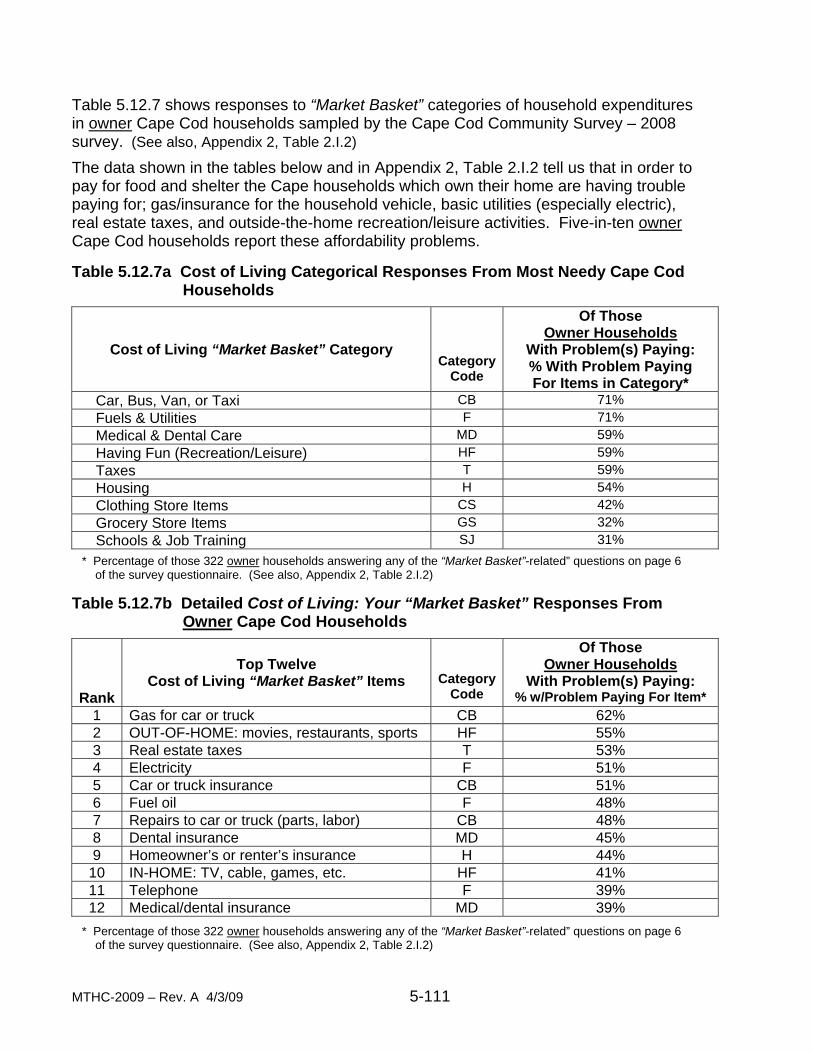
MTHC-2009 – Rev. A 4/3/09 5-111
Table 5.12.7 shows responses to “Market Basket” categories of household expenditures in owner Cape Cod households sampled by the Cape Cod Community Survey – 2008 survey. (See also, Appendix 2, Table 2.I.2)
The data shown in the tables below and in Appendix 2, Table 2.I.2 tell us that in order to pay for food and shelter the Cape households which own their home are having trouble paying for; gas/insurance for the household vehicle, basic utilities (especially electric), real estate taxes, and outside-the-home recreation/leisure activities. Five-in-ten owner Cape Cod households report these affordability problems. Table 5.12.7a Cost of Living Categorical Responses From Most Needy Cape Cod Households
Cost of Living “Market Basket” Category
Category Code
Of Those Owner Households
With Problem(s) Paying: % With Problem Paying For Items in Category*
Car, Bus, Van, or Taxi CB 71% Fuels & Utilities F 71%
Medical & Dental Care MD 59% Having Fun (Recreation/Leisure) HF 59% Taxes T 59% Housing H 54% Clothing Store Items CS 42% Grocery Store Items GS 32% Schools & Job Training SJ 31%
* Percentage of those 322 owner households answering any of the “Market Basket”-related” questions on page 6 of the survey questionnaire. (See also, Appendix 2, Table 2.I.2) Table 5.12.7b Detailed Cost of Living: Your “Market Basket” Responses From Owner Cape Cod Households
Rank
Top Twelve
Cost of Living “Market Basket” Items
Category Code
Of Those Owner Households
With Problem(s) Paying: % w/Problem Paying For Item*
1 Gas for car or truck CB 62% 2 OUT-OF-HOME: movies, restaurants, sports HF 55% 3 Real estate taxes T 53% 4 Electricity F 51% 5 Car or truck insurance CB 51% 6 Fuel oil F 48% 7 Repairs to car or truck (parts, labor) CB 48% 8 Dental insurance MD 45% 9 Homeowner’s or renter’s insurance H 44%
10 IN-HOME: TV, cable, games, etc. HF 41% 11 Telephone F 39% 12 Medical/dental insurance MD 39%
* Percentage of those 322 owner households answering any of the “Market Basket”-related” questions on page 6 of the survey questionnaire. (See also, Appendix 2, Table 2.I.2)

MTHC-2009 – Rev. A 4/3/09 5-112

MTHC-2009 – Rev. A 4/3/09 5-113
Section 5. Research Findings
13. Special Focus on Service Assistance Results Reponses to the Cape Cod Community Survey – 2008 “Household Situations: Tell Us About Any Help You Asked For” questions provide insight into obtaining satisfactory assistance for a range of everyday household needs, including needs for:
o Job and career planning, o Bus, van, or taxi rides, o Child care, o Help from food pantry, o Mental health care, and o Legal help.
“Help You Asked For” Categories and Need Items:
Needs explored in depth in the Cape Cod Community Survey – 2008 include the following: (See also, Page 7 of sample questionnaire in Appendix 1)
• Job & Career Planning: o Job counseling o Job training o Help finding a job o Job advancement classes.
• Bus, Van, or Taxi: o Ride on Villager bus o Ride on B-bus o Ride on Flex-Route bus o Ride on Sealine bus o Ride in Senior Center van o Ride in a taxi o Ride on P & B bus
• Child Care: o After-school child care o Child day care
• Help from Food Pantry: o More food o More nutritious food
• Mental Health Care: o [Mental health] care for a child (ages 0-17) o [Mental health] care for adult (age18-64) o [Mental health] care for a senior (age 65+):
• With Alzheimer’s Disease • Without Alzheimer’s
• Legal Help: o To understand my rights o To understand the Courts o A lawyer for a Court case: o for a criminal case o for a civil case
MTHC-2009 – Rev. A 4/3/09 5-114
Cape Cod Households Requesting Assistance With Everyday Needs
Overall, about one-third of Cape Cod households reported addressing one or more of the “need” items listed on page 7 of the survey questionnaire—some sought help, some did not. Of the 845 Cape Cod households responding to the Cape Cod Community Survey – 2008, about 210 (25%) report requesting help to alleviate one or more of these everyday needs. About one-in-ten households indicated that they needed help but did not seek it. Summary Findings: Results from seeking help to overcome everyday needs were mixed. Overall, one-half of those households that sought help were satisfied, but many report that their results were less than satisfactory. In fact, in many instances, they report getting “no help at all” as a result of their attempts.
As noted, attempts to alleviate everyday needs show varying degrees of success. In fact, success rates tend to vary by population sub-group. Key population sub-groups report vastly different success rates from one another. This Section provides highlights of findings from our inquiries into “help you asked for” on Cape Cod.
In general, three service categories predominate among those providing the least satisfactory results. These are “Job & Career Planning,” “Child Care,” and “Legal Help.”
Job & Career Planning: All four measures of jobs and career planning studied in our survey come under extreme criticism by survey respondents. Services for job counseling, help in finding a job, job training, and career advancement assistance are all noted as “no help at all” by at least one-third of all those responding to these survey questions.
Child Care: Help in securing after-school child care was singled-out as the least helpful (“no help at all”) service by more than one-half of all those responding to these survey questions. The second child care service studied, child day care, also received strong criticism in terms of it’s lack of overall helpfulness to those seeking relief.
Legal Help: All four measures of legal help studied in our survey come under strong criticism by survey respondents. Legal representation to assist Cape Cod residents with both civil and criminal court cases were noted as of “no help at all” by at least one-third of all those responding to these survey questions. Further, assistance in understanding their legal rights, and in helping Cape residents understand and negotiate the court system were severely criticized by at least one-half of respondents as not fully meeting their needs.
Data Tables: The data shown in the tables below and in Appendix 2, Table 2.J.1 tell us about the most prevalent categories of need, and about help that was sought after but where results were less than satisfactory (that is, the need was not completely met).

MTHC-2009 – Rev. A 4/3/09 5-115
Table 5.13.1 shows responses to “Help You Asked For” categories of everyday household needs on Cape Cod from all households sampled by the Cape Cod Community Survey – 2008 survey. (See also, Appendix 2, Tables 2.J.1a and 2.J.1b)
The data shown in the Tables 5.13.1a and 5.13.1b and data in Appendix 2, Tables 2.J.1a and 2.J.1b tell us that all across Cape Cod households are facing challenges in obtaining help; securing after-school child care, help in finding a job, securing mental health services for children, help with job advancement (classes, etc.), obtaining needed legal assistance, and securing adequate food (especially nutritious food). At least six-in-ten Cape Cod house- holds that sought such assistance report that their needs were not completely satisfied. Table 5.13.1a: “Help You Asked For” Categorical Responses From All Sampled Cape Cod Households
“Help You Asked For” Category
Category Code
Of Those Cape Cod Households That Sought Any Help: % SEEKING HELP With
Item(s) in Category* Job & Career Planning JCP 42%
Mental Health Care MHC 38% Help From Food Pantry HFFP 35% Legal Help LH 32% Bus, Van, or Taxi BVT 20% Child Care CC 16%
* Percentage of those 207 sampled households that sought help with any of the items listed on page 7 of the survey questionnaire. (See also, Appendix 2, Table 2 J.1a and Table 2.J.3) Table 5.13.1b Detailed “Help You Asked For” Item Responses From All Sampled Cape Cod Households
Rank
Top Twelve “Help You Asked For” Needs Items
Category Code
Of Those Cape Cod Households That Sought Any Help:
% NEED NOT COMPLETELY MET* 1 After-school child care CC 78% 2 Help finding a job JCP 74% 3 [Mental health] care for a child (ages 0-17) MHC 71% 4 Job advancement classes JCP 71% 5 [Legal help] - a lawyer for a Criminal case LH 67% 6 More nutritious food HFFP 64% 7 [Legal help] a lawyer for a Civil Court case LH 62% 8 Job Training JCP 56% 9 Job counseling JCP 54%
10 More food HFFP 52% 11 [Legal help] - to understand my rights LH 50% 12 Ride on B-Bus BVT 50%
* Percentage of those 207 sampled households that sought help with any of the items listed on page 7 of the survey questionnaire. (See also, Appendix 2, Table 2 J.1b and Table 2.J.3)
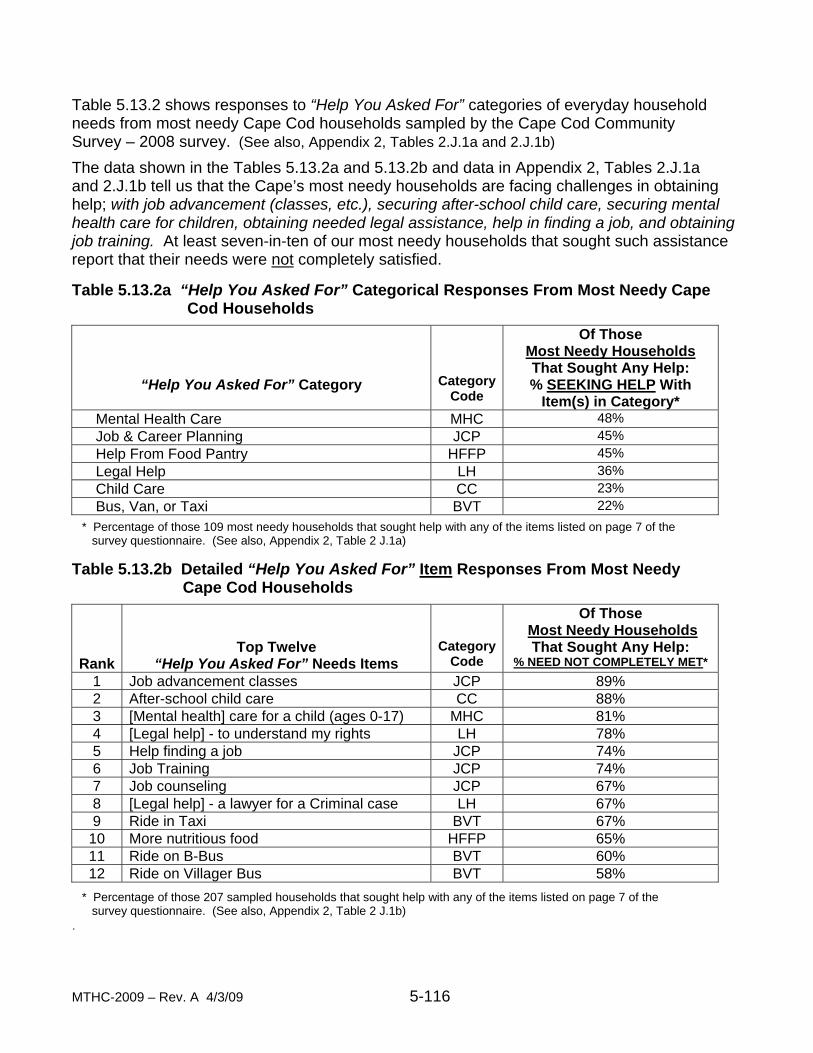
MTHC-2009 – Rev. A 4/3/09 5-116
Table 5.13.2 shows responses to “Help You Asked For” categories of everyday household needs from most needy Cape Cod households sampled by the Cape Cod Community Survey – 2008 survey. (See also, Appendix 2, Tables 2.J.1a and 2.J.1b)
The data shown in the Tables 5.13.2a and 5.13.2b and data in Appendix 2, Tables 2.J.1a and 2.J.1b tell us that the Cape’s most needy households are facing challenges in obtaining help; with job advancement (classes, etc.), securing after-school child care, securing mental health care for children, obtaining needed legal assistance, help in finding a job, and obtaining job training. At least seven-in-ten of our most needy households that sought such assistance report that their needs were not completely satisfied. Table 5.13.2a “Help You Asked For” Categorical Responses From Most Needy Cape Cod Households
“Help You Asked For” Category
Category Code
Of Those Most Needy Households That Sought Any Help: % SEEKING HELP With
Item(s) in Category* Mental Health Care MHC 48% Job & Career Planning JCP 45%
Help From Food Pantry HFFP 45% Legal Help LH 36% Child Care CC 23% Bus, Van, or Taxi BVT 22%
* Percentage of those 109 most needy households that sought help with any of the items listed on page 7 of the survey questionnaire. (See also, Appendix 2, Table 2 J.1a) Table 5.13.2b Detailed “Help You Asked For” Item Responses From Most Needy Cape Cod Households
Rank
Top Twelve “Help You Asked For” Needs Items
Category Code
Of Those Most Needy Households
That Sought Any Help: % NEED NOT COMPLETELY MET*
1 Job advancement classes JCP 89% 2 After-school child care CC 88% 3 [Mental health] care for a child (ages 0-17) MHC 81% 4 [Legal help] - to understand my rights LH 78% 5 Help finding a job JCP 74% 6 Job Training JCP 74% 7 Job counseling JCP 67% 8 [Legal help] - a lawyer for a Criminal case LH 67% 9 Ride in Taxi BVT 67%
10 More nutritious food HFFP 65% 11 Ride on B-Bus BVT 60% 12 Ride on Villager Bus BVT 58%
* Percentage of those 207 sampled households that sought help with any of the items listed on page 7 of the survey questionnaire. (See also, Appendix 2, Table 2 J.1b) .
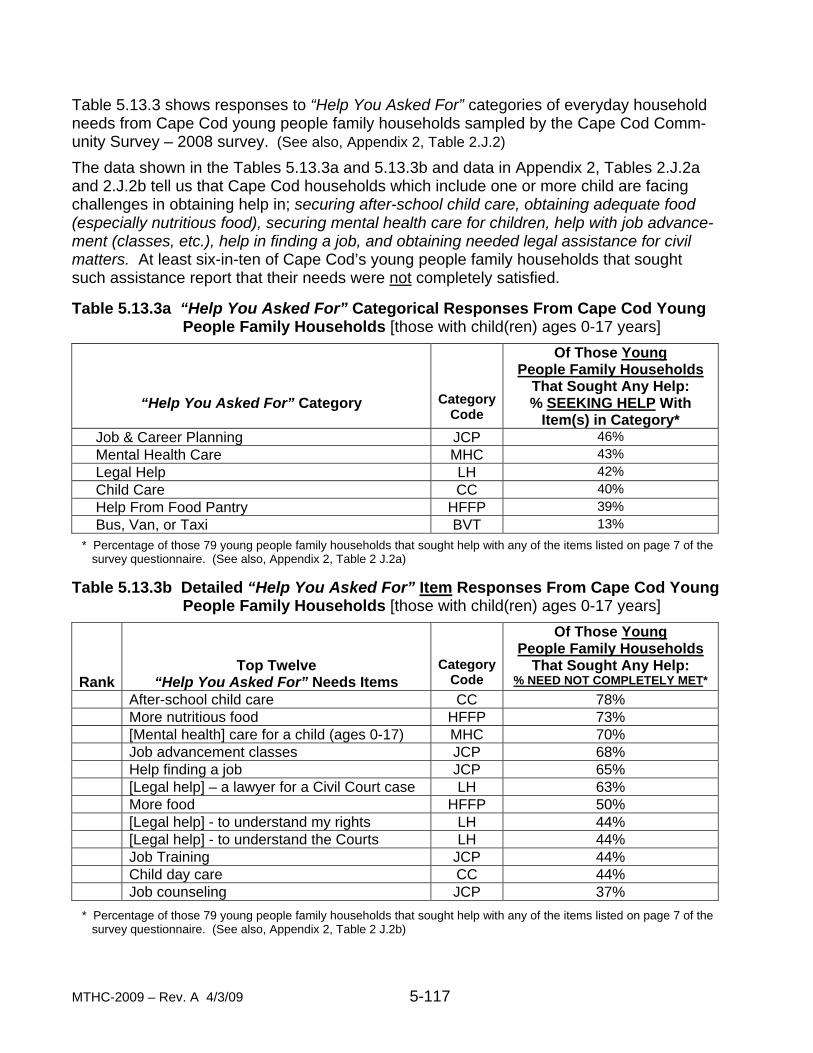
MTHC-2009 – Rev. A 4/3/09 5-117
Table 5.13.3 shows responses to “Help You Asked For” categories of everyday household needs from Cape Cod young people family households sampled by the Cape Cod Comm- unity Survey – 2008 survey. (See also, Appendix 2, Table 2.J.2)
The data shown in the Tables 5.13.3a and 5.13.3b and data in Appendix 2, Tables 2.J.2a and 2.J.2b tell us that Cape Cod households which include one or more child are facing challenges in obtaining help in; securing after-school child care, obtaining adequate food (especially nutritious food), securing mental health care for children, help with job advance- ment (classes, etc.), help in finding a job, and obtaining needed legal assistance for civil matters. At least six-in-ten of Cape Cod’s young people family households that sought such assistance report that their needs were not completely satisfied. Table 5.13.3a “Help You Asked For” Categorical Responses From Cape Cod Young People Family Households [those with child(ren) ages 0-17 years]
“Help You Asked For” Category
Category Code
Of Those Young People Family Households
That Sought Any Help: % SEEKING HELP With
Item(s) in Category* Job & Career Planning JCP 46%
Mental Health Care MHC 43% Legal Help LH 42% Child Care CC 40% Help From Food Pantry HFFP 39% Bus, Van, or Taxi BVT 13%
* Percentage of those 79 young people family households that sought help with any of the items listed on page 7 of the survey questionnaire. (See also, Appendix 2, Table 2 J.2a) Table 5.13.3b Detailed “Help You Asked For” Item Responses From Cape Cod Young People Family Households [those with child(ren) ages 0-17 years]
Rank
Top Twelve “Help You Asked For” Needs Items
Category Code
Of Those Young People Family Households
That Sought Any Help: % NEED NOT COMPLETELY MET*
After-school child care CC 78% More nutritious food HFFP 73% [Mental health] care for a child (ages 0-17) MHC 70% Job advancement classes JCP 68% Help finding a job JCP 65% [Legal help] – a lawyer for a Civil Court case LH 63% More food HFFP 50% [Legal help] - to understand my rights LH 44% [Legal help] - to understand the Courts LH 44% Job Training JCP 44% Child day care CC 44% Job counseling JCP 37%
* Percentage of those 79 young people family households that sought help with any of the items listed on page 7 of the survey questionnaire. (See also, Appendix 2, Table 2 J.2b)

MTHC-2009 – Rev. A 4/3/09 5-118
Table 5.13.4 shows responses to “Help You Asked For” categories of everyday household needs from Cape Cod households with someone age 65 or older sampled by the Cape Cod Community Survey – 2008 survey. (See also, Appendix 2, Table 2.J.2)
The data shown in the Tables 5.13.4a and 5.13.4b and data in Appendix 2, Tables 2.J.2a and 2.J.2b tell us that Cape Cod households which include one or more person age 65+ are facing challenges in obtaining help in; securing adequate food (especially nutritious food) and help in finding a job. At least four-in-ten Cape Cod households with these older adults that sought such assistance report that their needs were not completely satisfied. Table 5.13.4a “Help You Asked For” Categorical Responses From Cape Cod House-
holds That Include Someone Age 65 or older
“Help You Asked For” Category
Category Code
Of Those Households With Someone Age 65+ That Sought Any Help: % SEEKING HELP With
Item(s) in Category* Mental Health Care MHC 45% Job & Career Planning JCP 39%
Help From Food Pantry HFFP 26% Legal Help LH 24% Bus, Van, or Taxi BVT 15% Child Care CC 3%
* Percentage of those 46 households with someone age 65+ that sought help with any of the items listed on page 7 of the survey questionnaire. (See also, Appendix 2, Table 2 J.2a) Table 5.13.4b Detailed “Help You Asked For” Item Responses From Cape Cod Households That Include Someone Age 65 or older
Rank
Top “Help You Asked For” Needs Items
Category Code
Of Those Households With Someone Age 65+ That Sought Any Help:
% NEED NOT COMPLETELY MET* More nutritious food HFFP 60% Help finding a job JCP 50% More food HFFP 42%
* Percentage of those 46 households with someone age 65+ that sought help with any of the items listed on page 7 of the survey questionnaire. (See also, Appendix 2, Table 2 J.2b)

MTHC-2009 – Rev. A 4/3/09 5-119
Table 5.13.5 shows responses to “Help You Asked For” categories of everyday household needs from households with someone age 75 or older sampled by the Cape Cod Community Survey – 2008 survey. (See also, Appendix 2, Table 2.J.2)
The data shown in the Tables 5.13.5a and 5.13.5b and data in Appendix 2, Tables 2.J.2a and 2.J.2b tell us that that Cape Cod households which include one or more person age 75+ may be facing challenges in obtaining help in; securing mental health services. Unfortunately, very small survey sample sizes were obtained for this household segment, thus, a detailed item-level analysis of the assistance needs of Cape Cod households which include one or more such elder member is not possible. Table 5.13.5a “Help You Asked For” Categorical Responses From Cape Cod House- holds That Include Someone Age 75 or older
“Help You Asked For” Category
Category Code
Of Those Households With Someone Age 75+ That Sought Any Help: % SEEKING HELP With
Item(s) in Category* Mental Health Care MHC 50% Job & Career Planning JCP 23%
Bus, Van, or Taxi BVT 23% Help From Food Pantry HFFP 21% Legal Help LH 20% Child Care CC 0%
* Percentage of those 22 households with someone age 75+ that sought help with any of the items listed on page 7 of the survey questionnaire. (See also, Appendix 2, Table 2 J.2a) Table 5.13.5b Detailed “Help You Asked For” Item Responses From Cape Cod Households That Include Someone Age 75 or older
Rank
Top “Help You Asked For” Needs Items
Category Code
Of Those Households With Someone Age 75+ That Sought Any Help:
% NEED NOT COMPLETELY MET* Undefined - -
* Percentage of those 22 households with someone age 75+ that sought help with any of the items listed on page 7 of the survey questionnaire. (See also, Appendix 2, Table 2 J.2b)
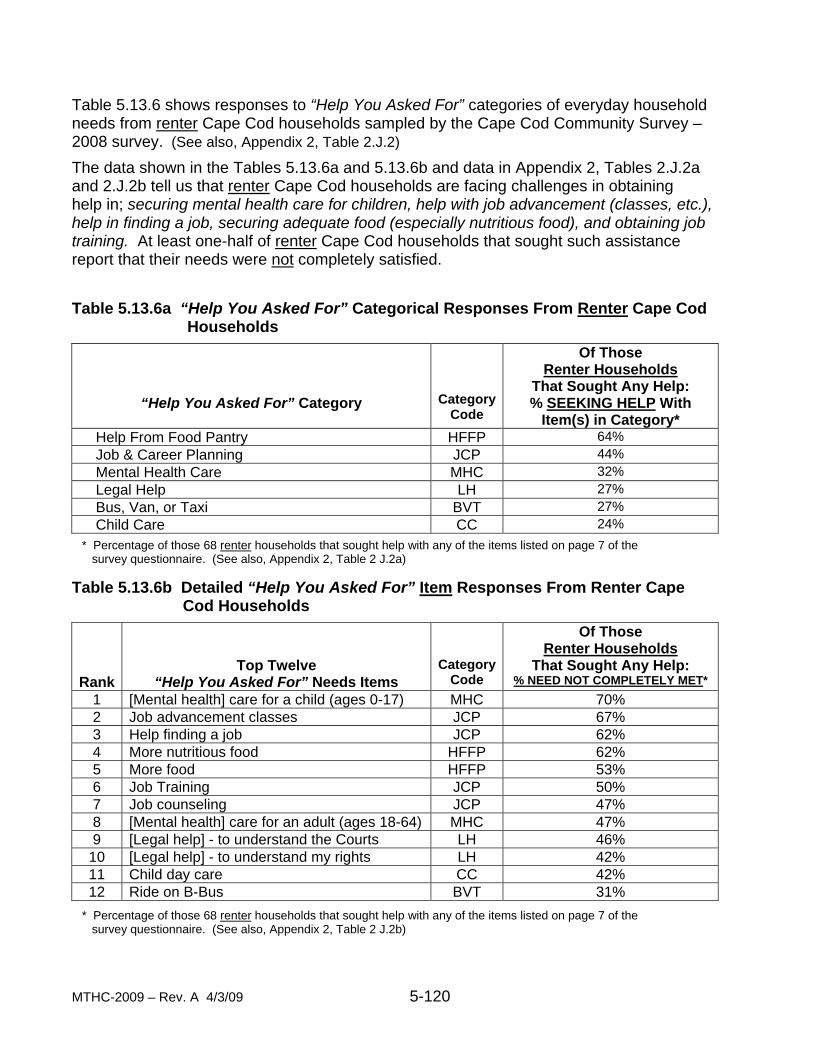
MTHC-2009 – Rev. A 4/3/09 5-120
Table 5.13.6 shows responses to “Help You Asked For” categories of everyday household needs from renter Cape Cod households sampled by the Cape Cod Community Survey – 2008 survey. (See also, Appendix 2, Table 2.J.2)
The data shown in the Tables 5.13.6a and 5.13.6b and data in Appendix 2, Tables 2.J.2a and 2.J.2b tell us that renter Cape Cod households are facing challenges in obtaining help in; securing mental health care for children, help with job advancement (classes, etc.), help in finding a job, securing adequate food (especially nutritious food), and obtaining job training. At least one-half of renter Cape Cod households that sought such assistance report that their needs were not completely satisfied. Table 5.13.6a “Help You Asked For” Categorical Responses From Renter Cape Cod Households
“Help You Asked For” Category
Category Code
Of Those Renter Households
That Sought Any Help: % SEEKING HELP With
Item(s) in Category* Help From Food Pantry HFFP 64% Job & Career Planning JCP 44%
Mental Health Care MHC 32% Legal Help LH 27% Bus, Van, or Taxi BVT 27% Child Care CC 24%
* Percentage of those 68 renter households that sought help with any of the items listed on page 7 of the survey questionnaire. (See also, Appendix 2, Table 2 J.2a) Table 5.13.6b Detailed “Help You Asked For” Item Responses From Renter Cape Cod Households
Rank
Top Twelve “Help You Asked For” Needs Items
Category Code
Of Those Renter Households
That Sought Any Help: % NEED NOT COMPLETELY MET*
1 [Mental health] care for a child (ages 0-17) MHC 70% 2 Job advancement classes JCP 67% 3 Help finding a job JCP 62% 4 More nutritious food HFFP 62% 5 More food HFFP 53% 6 Job Training JCP 50% 7 Job counseling JCP 47% 8 [Mental health] care for an adult (ages 18-64) MHC 47% 9 [Legal help] - to understand the Courts LH 46%
10 [Legal help] - to understand my rights LH 42% 11 Child day care CC 42% 12 Ride on B-Bus BVT 31%
* Percentage of those 68 renter households that sought help with any of the items listed on page 7 of the survey questionnaire. (See also, Appendix 2, Table 2 J.2b)

MTHC-2009 – Rev. A 4/3/09 5-121
Table 5.13.7 shows responses to “Help You Asked For” categories of everyday household needs from owner Cape Cod households sampled by the Cape Cod Community Survey – 2008 survey. (See also, Appendix 2, Table 2.J.2)
The data shown in the Tables 5.13.7a and 5.13.7b and data in Appendix 2, Tables 2.J.2a and 2.J.2b tell us that owner Cape Cod households are facing challenges in obtaining help in; securing adequate food (especially nutritious food), help in finding a job, help with job advancement (classes, etc.) and job training. At least four-in-ten owner Cape Cod households that sought such assistance report that their needs were not completely satisfied. Table 5.13.7a “Help You Asked For” Categorical Responses From Owner Cape Cod Households
“Help You Asked For” Category
Category Code
Of Those Owner Households
That Sought Any Help: % SEEKING HELP With
Item(s) in Category* Mental Health Care MHC 42% Job & Career Planning JCP 38%
Legal Help LH 31% Help From Food Pantry HFFP 14% Bus, Van, or Taxi BVT 10% Child Care CC 9%
* Percentage of those 102 owner households that sought help with any of the items listed on page 7 of the survey questionnaire. (See also, Appendix 2, Table 2 J.2a) Table 5.13.7b Detailed “Help You Asked For” Item Responses From Owner Cape Cod Households
Rank
Top Twelve “Help You Asked For” Needs Items
Category Code
Of Those Owner Households
That Sought Any Help: % NEED NOT COMPLETELY MET*
1 More nutritious food HFFP 70% 2 More food HFFP 64% 3 Help finding a job JCP 63% 4 Job advancement classes JCP 54% 5 Job Training JCP 46% 6 [Legal help] - to understand my rights LH 35% 7 Job counseling JCP 33% 8 [Legal help] – a lawyer for a Civil Court case LH 33% 9 [Mental health] care for an adult (ages 18-64) MHC 30%
10 [Legal help] - to understand the Courts LH 25% 11 [Mental health] care for senior (age 65+) with
Alzheimer’s
MHC
17% 12 Ride on P & B Bus BVT 7%
* Percentage of those 102 owner households that sought help with any of the items listed on page 7 of the survey questionnaire. (See also, Appendix 2, Table 2 J.2b)
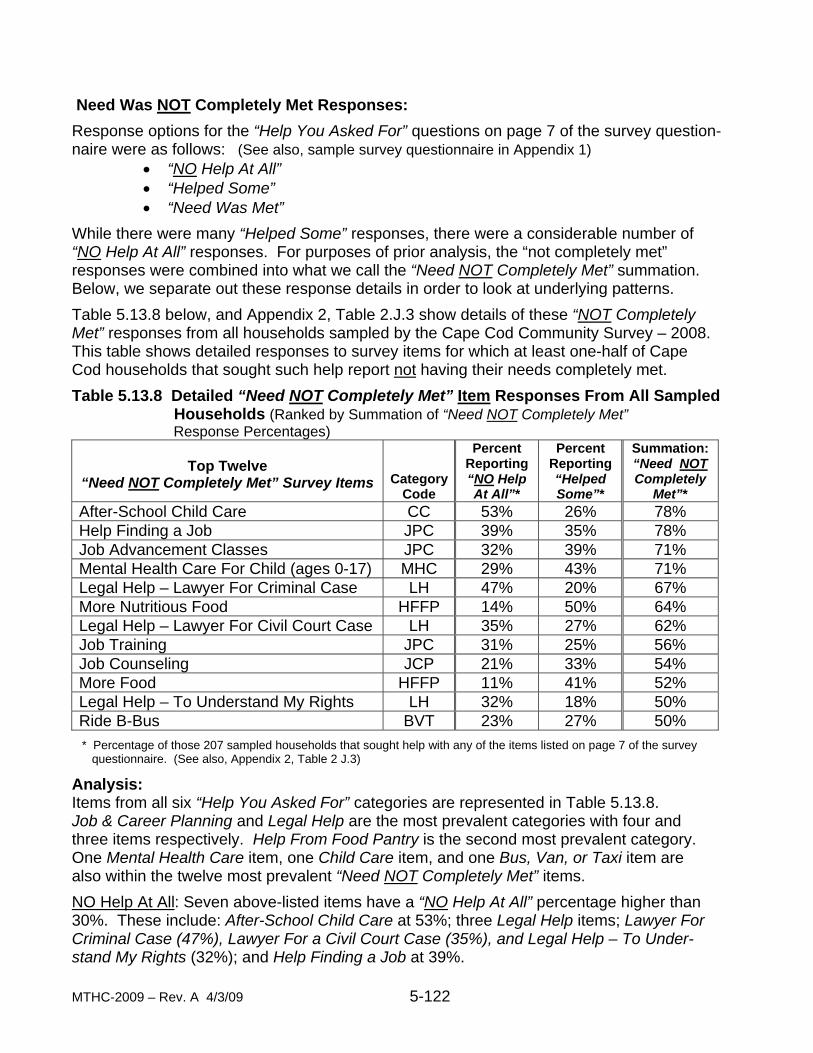
MTHC-2009 – Rev. A 4/3/09 5-122
Need Was NOT Completely Met Responses:
Response options for the “Help You Asked For” questions on page 7 of the survey question-naire were as follows: (See also, sample survey questionnaire in Appendix 1)
• “NO Help At All” • “Helped Some” • “Need Was Met”
While there were many “Helped Some” responses, there were a considerable number of “NO Help At All” responses. For purposes of prior analysis, the “not completely met” responses were combined into what we call the “Need NOT Completely Met” summation. Below, we separate out these response details in order to look at underlying patterns.
Table 5.13.8 below, and Appendix 2, Table 2.J.3 show details of these “NOT Completely Met” responses from all households sampled by the Cape Cod Community Survey – 2008. This table shows detailed responses to survey items for which at least one-half of Cape Cod households that sought such help report not having their needs completely met.
Table 5.13.8 Detailed “Need NOT Completely Met” Item Responses From All Sampled Households (Ranked by Summation of “Need NOT Completely Met” Response Percentages)
Top Twelve
“Need NOT Completely Met” Survey Items
CategoryCode
Percent Reporting “NO Help At All”*
Percent Reporting “Helped Some”*
Summation: “Need NOT Completely
Met”* After-School Child Care CC 53% 26% 78% Help Finding a Job JPC 39% 35% 78% Job Advancement Classes JPC 32% 39% 71% Mental Health Care For Child (ages 0-17) MHC 29% 43% 71% Legal Help – Lawyer For Criminal Case LH 47% 20% 67% More Nutritious Food HFFP 14% 50% 64% Legal Help – Lawyer For Civil Court Case LH 35% 27% 62% Job Training JPC 31% 25% 56% Job Counseling JCP 21% 33% 54% More Food HFFP 11% 41% 52% Legal Help – To Understand My Rights LH 32% 18% 50% Ride B-Bus BVT 23% 27% 50%
* Percentage of those 207 sampled households that sought help with any of the items listed on page 7 of the survey questionnaire. (See also, Appendix 2, Table 2 J.3)
Analysis: Items from all six “Help You Asked For” categories are represented in Table 5.13.8. Job & Career Planning and Legal Help are the most prevalent categories with four and three items respectively. Help From Food Pantry is the second most prevalent category. One Mental Health Care item, one Child Care item, and one Bus, Van, or Taxi item are also within the twelve most prevalent “Need NOT Completely Met” items.
NO Help At All: Seven above-listed items have a “NO Help At All” percentage higher than 30%. These include: After-School Child Care at 53%; three Legal Help items; Lawyer For Criminal Case (47%), Lawyer For a Civil Court Case (35%), and Legal Help – To Under- stand My Rights (32%); and Help Finding a Job at 39%.