Hoang Lan Nguyen and Uyen Trang Nguyen Presenter: Hoang Lan Nguyen

MONITORING REPORT II From 01/01/2012 to 30/06/2013
For the verification of Biogas Program for Animal Husbandry Sector of Vietnam
Version 3.2 22/04/2015 Prepared by:
Hoang Thanh Ha
Eric Buysman [email protected]
Nexus-Carbon for Development 352 Tanglin Road #02-02
Singapore 247671
Unique Entity Number: 200915559E
#33 Sothearos boulevard
Phnom Penh, Cambodia
P.O. Box 956
www.nexus-c4d.org

2
Acronyms AWMS Animal Waste Management System BE Baseline emission BUS Biogas User Survey
CDM Clean Development Mechanism CH4 Methane Gas
CO2 Carbon Dioxide CO2eq Relative potency of non-CO2 gases compared to CO2
EF Emission factor ER Emission reduction GBM Gold Standard Bio-digester Methodology GHG Greenhouse Gas GS Gold Standard GSPR Gold Standard Passport Report GWP Global Warming Potential hh (HH) household IPCC Intergovernmental Panel on Climate Change LPG Liquefied Petroleum Gas LSC Local Stakeholder Consultation Report MCF Methane conversion factor MS Manure system (equivalent to AWMS) MPx Monitoring Period x (I or II) MRx Monitoring Report (I or II)
N2O Nitrous oxide NRB Non-Renewable Biomass PDD Project Description Document PE Project Emission SNV Netherlands Development Organization UNFCCC United Nation Framework Convention on Climate Change VER Voluntary emission reduction
VGS Voluntary Gold Standard

3
CONTENTS MONITORING REPORT II ........................................................................................................................................ 1
MONITORING REPORT SUMMARY ......................................................................................................................... 4
SECTION A. DESCRIPTION OF PROJECT ACTIVITY .................................................................................................... 5
A.1. PURPOSE AND GENERAL DESCRIPTION OF PROJECT ACTIVITY ..................................................................................... 5 A.2. LOCATION OF PROJECT ACTIVITY .......................................................................................................................... 6 A.3. PARTIES AND PROJECT PARTICIPANT(S) ................................................................................................................. 9 A.4. REFERENCE OF APPLIED METHODOLOGY ............................................................................................................... 9 A.5. CREDITING PERIOD OF PROJECT ACTIVITY .............................................................................................................. 9
SECTION B. IMPLEMENTATION OF PROJECT ACTIVITY ......................................................................................... 10
B.1. DESCRIPTION OF IMPLEMENTED REGISTERED PROJECT ACTIVITY ............................................................................... 10 B.2. POST REGISTRATION CHANGES .......................................................................................................................... 14 B.3. FAR RAISED IN MPI .............................................................................................................................................. 15
SECTION C. DESCRIPTION OF MONITORING SYSTEM ........................................................................................... 17
C.1. QUALITY CONTROL MONITORING .............................................................................................................................. 17 C.2. CARBON MONITORING SURVEY (CMS) ..................................................................................................................... 20 C.3. USAGE SURVEY (US) .............................................................................................................................................. 22
SECTION D. DATA AND PARAMETERS .................................................................................................................. 23
D.1. DATA AND PARAMETERS THAT ARE AVAILABLE AT VALIDATION ....................................................................................... 23 D.2. DATA AND PARAMETERS MONITORED ....................................................................................................................... 26 D.3. IMPLEMENTATION OF SAMPLING PLANS ..................................................................................................................... 31
SECTION E. CALCULATION OF EMISSION REDUCTIONS OR GHG REMOVALS BY SINKS ......................................... 44
E.1. CALCULATION OF BASELINE EMISSIONS OR BASELINE NET GHG REMOVALS BY SINKS ........................................................... 44 E.2. CALCULATION OF PROJECT EMISSIONS OR ACTUAL NET GHG REMOVALS BY SINKS .............................................................. 48 E.3. CALCULATION OF LEAKAGE ...................................................................................................................................... 48 E.4. SUMMARY OF CALCULATION OF EMISSION REDUCTIONS OR NET ANTHROPOGENIC GHG REMOVALS BY SINKS........................... 58 E.5. COMPARISON OF ACTUAL EMISSION REDUCTIONS OR NET ANTHROPOGENIC GHG REMOVALS BY SINKS WITH ESTIMATES IN
REGISTERED PDD ......................................................................................................................................................... 62 E.6. REMARKS ON DIFFERENCE FROM ESTIMATED VALUE IN REGISTERED PDD .......................................................................... 62
SECTION F. RESULTS OF MONITORING SUSTAINABLE DEVELOPMENT INDICATOR ............................................... 62
F.1. SAFEGUARD PRINCIPLES .......................................................................................................................................... 62 F.2. SUSTAINABILITY MONITORING PLAN .......................................................................................................................... 63
ANNEX 1: CONTACT DETAILS OF THE PROJECT PARTICIPANTS ...................................................................... 69

4
Monitoring report summary
Title of the project activity Biogas Program for Animal Husbandry Sector of Vietnam
Gold Standard version 2.1
Gold Standard icon
Reference number of the project activity GS10831
Version number of the monitoring report 3.2
Completion date of the monitoring report 22/04/2015
Registration date of the project activity 28/06/2012
Monitoring period number and duration of this monitoring period
Monitoring period number 2 (MPII) 01/01/2012 to 30/06/2013
Project participant(s)
1. Biogas Program for the Animal Husbandry Sector of Vietnam 2. SNV Vietnam
Host Party(ies) Vietnam
Sectoral scope(s) and applied methodology(ies)
Sectoral scope: 1 and 13 Methodology: Technologies and practices to displace decentralized thermal energy consumption version 1.0 2
Estimated amount of GHG emission reductions or net anthropogenic GHG removals by sinks for this monitoring period in the registered PDD
868,817 tCO2e
Actual GHG emission reductions or net anthropogenic GHG removals by sinks achieved in this monitoring period
779,924 tCO2e
1 http://mer.markit.com/br-reg/public/project.jsp?project_id=103000000001847 2 http://www.cdmgoldstandard.org/wp-content/uploads/2011/10/GS_110411_TPDDTEC_Methodology.pdf

5
SECTION A. Description of project activity
A.1. Purpose and general description of project activity The Biogas Program for the Animal Husbandry Sector of Vietnam (BP) is implemented by Livestock Production Department the Biogas Project Division (BPD) (under the Ministry of Agriculture and Rural Development (MARD)) in partnership with the Netherlands Development Organization (SNV). Overall objectives of BP are (i) effectively exploiting biogas technology and developing a commercial viable biogas sector in Vietnam; and (ii) contributing to rural development and environmental protection via provision of clean and affordable energy to rural households, improvement of community’s sanitation and rural people’s health, creation of jobs for rural labor and reduction of greenhouse gas emissions (GHG). The purpose of the project activity is to (further) develop the commercial and structural deployment of
domestic biogas3 in Vietnam. To that extent, the project will:
x Promote the long-term utilization of renewable energy produced in an environmentally compatible
and economically viable way;
x Increase the awareness of prospective livestock smallholder households and extension workers on
the full extent of the potential costs and benefits of domestic biogas installations;
x Strengthen the supporting capacity of involved Biogas Construction Teams (BCTs) and (non-)
Government officials regarding all aspects of marketing, construction, after sales service and quality
management of domestic biogas installations;
x Support the development of a commercially viable, market oriented domestic biogas sector in
Vietnam;
x Strengthen the institutional infrastructure for coordination and implementation of sustained
dissemination of domestic biogas at national, provincial and district level.
With implementation of this Project, greenhouse gas (GHG) emissions will be reduced, both from the
displacement of non-renewable biomass (NRB) and fossil fuels currently used in stoves with clean and
efficient biogas technology, but also by introducing a proper animal waste management system (AWMS).
The key milestones of project developments are as below:
Table 1: Timeline of the carbon finance activities
Carbon finance activities Year Carbon feasibility study: Study Domestic Biogas and CDM financing –Proof
consideration of carbon for 2006 onwards.4
November 2005
Start date of VGS project (first application for a biogas plant, date of
completion was on 1/1/2007)
19 July 2006
PIN Reception of Letter of Endorsement (LoE) from Vietnam DNA5 28 September 2006
PDD Development by Mitsubishi Securities UFJ as bundle CDM project with
credit period start date 1-10-2006 2006- 2007
3 Domestic biogas is defined as any biogas plant with a volume between 4 to 50 m
3, the minimum daily feedstock requirement of
the smallest size is manure from 6 pigs or two bovines (20 kg/day) and the largest digester can treat around 300
kg/manure/day (MARD national standard: 10 TCN 97 -102 – 2006. Issued by decision N0 4006/QĐ-BNN-KHCN of Ministry of
Agriculture and Rural development on 26th December 2006.)
4 http://www.natuurenmilieu.nl/pdf/0500_2.1_domestic_biogas_and_cdm_financing_background_paper.pdf 5 http://www.noccop.org.vn/Data/profile/Airvariable_Projects_75233Tong%20hop%20PIN.pdf

6
Baseline development and GS PDD development by SNV (Felix ter Heegde)
(draft PDD developed: Nov 2008, start date crediting period 1-1-2008
January 2008
Approval on the QSEAP-BDP by MARD with consideration of CDM revenue in
financing mechanism
20 November 2008
Local Stakeholder Workshop in Phu Tho and Nghe An April 2009
GS consultant contract signed between BPD and Nexus – Carbon for
Development
September 2011
Registration date of the project activity 28 June 2012
First GS VER issuance 26 February 2013
According to the first monitoring period, 510,952 credits were issued. For the second
monitoring period, the expected emission reduction is 779,924 GS VER.
A.2. Location of project activity Vietnam. Since the inception of the first phase (BP I) the programme has gradually extended its coverage. In 2007
the programme was active in 24 provinces and this has increased to 52 provinces in 2013. The coordinates
of Vietnam are:
Table 2: Vietnam coordinates
North Center South Latitude 22º00´ North of the
Equator
16º00´ North of
the Equator
8º50´ North of the
Equator
Longitude 100º00´ East
of Greenwich
106º00´ East
of Greenwich
109º00´ East
of Greenwich

7
Figure 1: Project’s location The list of active provinces and its installed plants are showed in the following table.
Table 3: Number of plants installed by province in the warm zone
No Province Latitude6 Longitude7 Cumulative
installations 1 An Giang 10o30'0" 105o13'0" 1025
2 Bà Rịa-Vũng Tàu 10o30'0" 107o13'0" 1457
3 Bạc Liêu 9o17'38" 105o43'40" 20
4 Bến Tre 10o13'59" 106o22'59" 1470
5 Bình Định 14o7'59" 108o46'59" 5864
6 Bình Phước 11o45'33" 106o51'5" 9
7 Cần Thơ 10o1'59" 105o46'59" 89
8 Đồng Nai 11o6'0" 107o20'59" 1888
6 https://maps.google.com/ 7 https://maps.google.com/
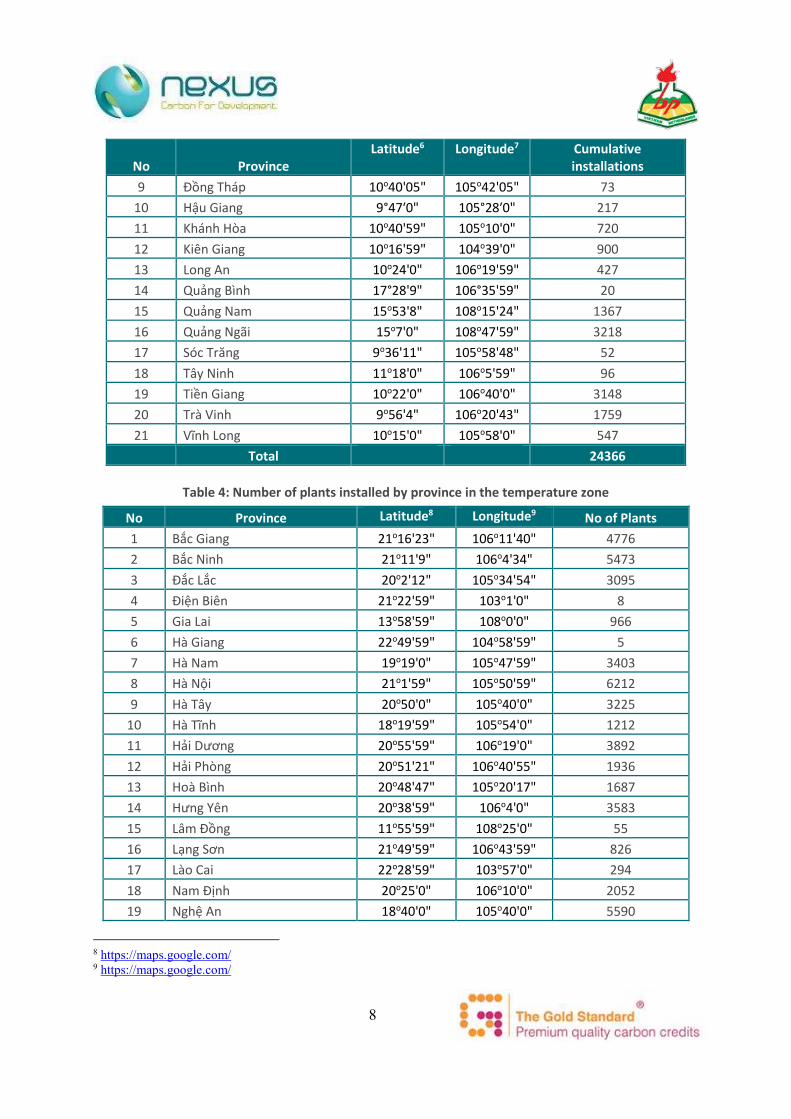
8
No Province Latitude6 Longitude7 Cumulative
installations 9 Đồng Tháp 10o40'05" 105o42'05" 73
10 Hậu Giang 9°47′0" 105°28′0" 217
11 Khánh Hòa 10o40'59" 105o10'0" 720
12 Kiên Giang 10o16'59" 104o39'0" 900
13 Long An 10o24'0" 106o19'59" 427
14 Quảng Bình 17°28'9" 106°35'59" 20
15 Quảng Nam 15o53'8" 108o15'24" 1367
16 Quảng Ngãi 15o7'0" 108o47'59" 3218
17 Sóc Trăng 9o36'11" 105o58'48" 52
18 Tây Ninh 11o18'0" 106o5'59" 96
19 Tiền Giang 10o22'0" 106o40'0" 3148
20 Trà Vinh 9o56'4" 106o20'43" 1759
21 Vĩnh Long 10o15'0" 105o58'0" 547
Total 24366
Table 4: Number of plants installed by province in the temperature zone
No Province Latitude8 Longitude9 No of Plants 1 Bắc Giang 21o16'23" 106o11'40" 4776
2 Bắc Ninh 21o11'9" 106o4'34" 5473
3 Đắc Lắc 20o2'12" 105o34'54" 3095
4 Điện Biên 21o22'59" 103o1'0" 8
5 Gia Lai 13o58'59" 108o0'0" 966
6 Hà Giang 22o49'59" 104o58'59" 5
7 Hà Nam 19o19'0" 105o47'59" 3403
8 Hà Nội 21o1'59" 105o50'59" 6212
9 Hà Tây 20o50'0" 105o40'0" 3225
10 Hà Tĩnh 18o19'59" 105o54'0" 1212
11 Hải Dương 20o55'59" 106o19'0" 3892
12 Hải Phòng 20o51'21" 106o40'55" 1936
13 Hoà Bình 20o48'47" 105o20'17" 1687
14 Hưng Yên 20o38'59" 106o4'0" 3583
15 Lâm Đồng 11o55'59" 108o25'0" 55
16 Lạng Sơn 21o49'59" 106o43'59" 826
17 Lào Cai 22o28'59" 103o57'0" 294
18 Nam Định 20o25'0" 106o10'0" 2052
19 Nghệ An 18o40'0" 105o40'0" 5590
8 https://maps.google.com/ 9 https://maps.google.com/

9
No Province Latitude8 Longitude9 No of Plants 20 Ninh Bình 20o15'14" 105o58'29" 4253
21 Phú Thọ 21o20'0" 105o10'0" 2622
22 Quảng Ninh 21o14'00" 107o20'05" 2653
23 Quảng Trị 16o45'0" 107o12'0" 40
24 Sơn La 21o19'0" 103o54'0" 1041
25 Thái Bình 20o27'0" 106o19'59" 2718
26 Thái Nguyên 21o35'34" 105o50'39" 3951
27 Thanh Hoá 19o48'0" 105o46'0" 9604
28 Thừa Thiên Huế 16o28'0" 107o35'59" 1646
29 Tuyên Quang 21o49'23" 105o13'5" 365
30 Vĩnh Phúc 21o17'59" 105o36'00" 2889
31 Yên Bái 21o42'0" 104o52'0" 1733
Total 81805
A.3. Parties and project participant(s)
Party involved Private and/or public entity(ies) project
participants (as applicable)
Indicate if the Party involved wishes to be considered as project
participant (Yes/No)
Vietnam (host) x Biogas Program for the Animal Husbandry
Sector of Vietnam x SNV Vietnam
Yes
A.4. Reference of applied methodology Technologies and practices to displace decentralized thermal energy consumption, version 1.0 Sectoral
scope 1,3,13.
Available online: http://www.cdmgoldstandard.org/wp-
content/uploads/2011/10/GS_110411_TPDDTEC_Methodology.pdf
A.5. Crediting period of project activity The crediting period of the Project is from 28/06/2010 to 27/06/2017 (Renewable).

10
SECTION B. Implementation of project activity
B.1. Description of implemented registered project activity BP is supporting the installment of biogas units of volumes between 4 to 50 m3 in households with
livestock (cattle, buffalos or pigs). The smallest digester has a minimum feedstock requirement of around
20 kg/day, roughly equivalent to 2 bovines or 6 pigs, the largest digester can treat around 300 kilo of
manure per day. The amount of the daily feedstock per digestion m3 is depending on the region as below10:
Table 5: Daily feedstock11
Region Local Daily feeding (kg/day/m3)
I The North mountainous region 6 - 9
II The South Vietnam 11 - 16
III Other locations 8 - 12
The detail feedstock by each capacity could also be found in the “Training material for Biogas Technician, 2011“. The table below gives some examples for daily waste requirement:
Table 6. Example of daily feedstock for KT1 type for area with mean temperature from 15 to 200C
Parameters Unit Size
Size m3 5.3 7.9 10.5 13.2 15.9 21.2 26.5 31.8
Daily supply of waste kg/day 50 75 100 125 150 200 250 300
In this way the manure management is improved leading to less GHG emissions and improved hygienic
and environmental living conditions. The installed biogas units are of fixed dome type. The produced
biogas is used to replace conventional fuels like firewood, coal, LPG, kerosene and agricultural residues
for cooking. Apart from cooking, biogas lamps are installed that can replace conventional light bulbs
(usually in the kitchen), or are used when power cuts occur. Apart from biogas, the slurry produced from
the digestion process can replace fertilizers.
The installed biogas units contribute to the reduction of GHG emission in 3 ways:
1. Avoidance of methane emissions from the baseline manure management system by
capturing and destroying methane for energy services;
2. Fuel switch from non-sustainable energy sources for cooking and lighting to biogas;
3. The effluent from a biogas system, bio-slurry (digestate), replaces chemical fertilizers.
However, due to the lack of data and for simplification reasons, the emission reductions for the fertilizer
substitution will not be accounted for, which increases conservativeness of the calculations. In addition,
some household will use biogas for water heating, stable heating and electricity generation. The emission
10 The higher the temperature the faster the digestion, therefore the volumetric feeding rate can be higher in warm zones
compared to areas with lower temperatures such as the North of Vietnam. 11 Training material for Biogas Technician, 2011

11
reductions from the displacement of grid electricity by these activities will not be accounted for, which is
also conservative.
Figure 2: Biogas generation process
The project involves the installation and implementation of model types KT.1 and KT.2 domestic biogas
plan or equivalent12. In case other domestic biogas technologies are included; a detailed description of
the equivalent technology will be included in the monitoring report. Each installation will be installed
according to the MARD national standard13, and in that case the expected lifetime is in the order of 25
years. At the end of this monitoring period around 74.7% of the digesters installed are of KT.1 type and
25.3% of KT.2 type. The KT.1, KT.2 and other models of biogas plants have been developed after 1990s in
Vietnam. Development is done by the Institute of Energy as well as others based on earlier Chinese and
German design. Design, construction and fitting has been standardized in MARD’s “Standards for small
size biogas plants # 10 TCN 497 – 2005 - Part 6”.
The hemi-spherical fixed dome plants are made on-site, entirely out of brick work. The materials required
for construction, including bricks, cement, iron bars, fitting materials etc. are all locally manufactured.
Basic appliances, which are also widely available, consist of gas pipe, main valves, stoves and gas lamps.
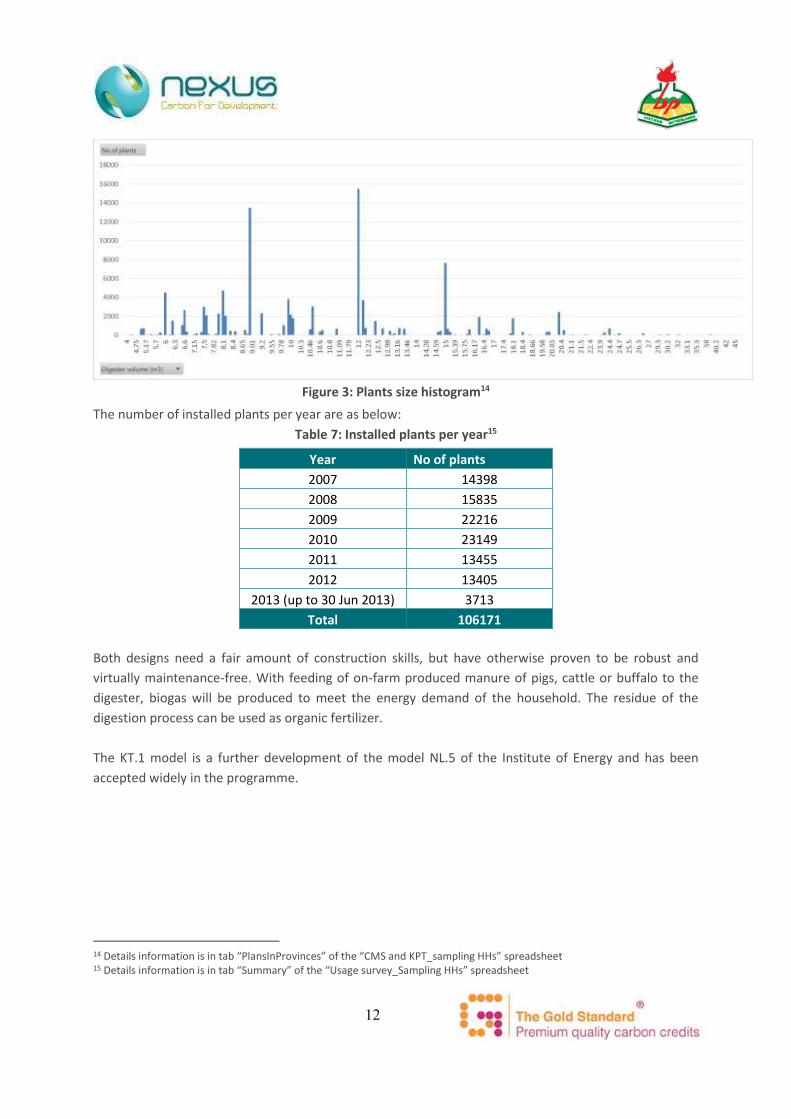
Biogas plants will be installed in the range of 4 m3 to 50 m3 with a current average size of 11.26 m3 (average
of units built between 01/01/2007 and 30/06/2013). The size histogram is illustrated as below:
12 Biogas plants that are recognized in the MARD biogas standard for small scale biogas 13 MARD national standard: 10 TCN 97 - 102 – 2006. Issued by decision N0 4006/QĐ-BNN-KHCN of Ministry of Agriculture and
Rural development on 26th December 2006.
12
Figure 3: Plants size histogram14
The number of installed plants per year are as below:
Table 7: Installed plants per year15
Year No of plants 2007 14398
2008 15835
2009 22216
2010 23149
2011 13455
2012 13405
2013 (up to 30 Jun 2013) 3713
Total 106171
Both designs need a fair amount of construction skills, but have otherwise proven to be robust and
virtually maintenance-free. With feeding of on-farm produced manure of pigs, cattle or buffalo to the
digester, biogas will be produced to meet the energy demand of the household. The residue of the
digestion process can be used as organic fertilizer.
The KT.1 model is a further development of the model NL.5 of the Institute of Energy and has been
accepted widely in the programme.
14 Details information is in tab “PlansInProvinces” of the “CMS and KPT_sampling HHs” spreadsheet 15 Details information is in tab “Summary” of the “Usage survey_Sampling HHs” spreadsheet

13
Figure 4: Blueprint of the KT.1 domestic biogas plant
The KT.2 model follows the TG-BP design as applied in the Mekong Delta by the Can Tho University. Similar
to KT.1, the revised design for KT.2 accommodates digester volumes of 4 to 50 m3.
Figure 5: Blueprint of the KT.2 biogas plant design
Although the KT.1 model optimizes material economy best, it needs deeper excavation. For areas with a
high water table or rocky ground, the KT.2 is then better suited.
For both models, design variations allow for the type of manure (pig and cattle/buffalo), the dilution ratios
of water and manure (1/1, 2/1 and 3/1) and the specific climatic conditions (the North with a cold winter
KT.1 Domestic biogas design
KT.2 Domestic biogas design

14
and the South with a warm winter). The programme uses an elaborate design manual, combining over
100 design variations
B.2. Post registration changes B.2.1. Temporary deviations from registered monitoring plan or applied methodology
>> N/A
B.2.2. Corrections
>> N/A
B.2.3. Permanent changes from registered monitoring plan or applied methodology
Baseline Field Test (BFT) & Project Field Test (PFT)
According to the registered monitoring plan, the BFT and PFT should be conducted annually for updating the related baseline parameters as well as the parameters in the project scenario. According to the GS issuance review dated 26/02/2013, page 4, and PP response round 2 proposed that “the BFT will only be organized once for the crediting period and the PFT will be biennial”16. There was a typo mistake from the DOE for MPI between two words “biennial” (which means every two years) and “bi-annually” (which is 2 times per year) in the DOE response round 2. Please find the confirmation in the supporting document named “Confirmation about PFT from GS”.
In summary, the BFT will be conducted once for each crediting period while the PFT will be conducted biennial for the remaining monitoring periods. The BFT and PFT were not conducted during MPI and the result from MPII will be applied retroactively to the MPI credit.17 Any difference will be deducted/added from the MPII.
B.2.4. Changes to project design of registered project activity
>> N/A
B.2.5. Changes to start date of crediting period
>> N/A
B.2.6. Types of changes specific to afforestation or reforestation project activity
>> N/A
16 This approach is in accordance to Annex 5 of TPDDTEC methodology, page 49 which states clearly that the PFT should be conducted every two years after first verification. 17 Refer to the Verification Report No. 01 996 9105066812-GS 1stVeri, Version No. 01.4, 2013-02-21by TÜV Rheinland (China)
Ltd and GS issuance review report date 26/02/2013

15
B.3. FAR raised in MPI During the MPI, 5 FARs were raised in DOE Verification Report (Version No. 01.4, dated 21/02/2013) and 1 Forward Action Request was raised in the GS issuance review (dated 26/02/2013). The FARs from GS issuance review report was addressed as below
Table 8: FARs from GS issuance review report
Contents Summary of project participants’ response Forward Action Request 1 In future monitoring period, the PP shall report if the trained masons and technicians were chosen in line with the defined rules and the DOE shall verify this
According to the SD indicator number 4 of Quality of Employment, the future target for SD4 is that: “At least 2 district biogas technicians and 2 biogas masons per district provided with training”. In order to meet the defined rules, during its implementation, the BP program has been expanding to new districts as well as trained new masons and technician who based in these new districts. In the meantime, the new masons and technicians in existing districts which have only 1 trained mason or technician have also been selected for training to meet the target. In the MPII period (from 01/01/2012 to 30/06/2013), the program provided training for masons and technicians as below18:
1. For masons: By end of MPI, districts which have at least 1 trained masons were 381 districts (accounted 74.6% of the total 511 districts which have biogas plants). The percentage of district which met the target of having at least 2 masons per district in MPI was 45.6%. During MPII, there were 29 new districts added to the programme and 116 new masons were trained so the total trained masons increased from 922 in MPI to 1038 masons in MPII. The percentage of districts with at least 1 trained mason and districts which met target increased to 80.2% and 49.1%, respectively.
2. For technicians: By the end of MPI, districts which have at least 1 trained technicians were located in 383 districts (accounted 75.0% of the total 511 districts which have biogas plants). The percentage of district which met the target of having at least 2 technicians per district in MPI was 28.0%. During MPII, there were 27 new districts added to the programme and 85 new technicians were trained so the total trained technicians increased from 622 in MPI to 707 technicians in MPII. The percentage of districts with at least 1 trained technician and districts which met target increased to 80.2% and 33.1%, respectively.
The FARs from DOE Verification Report were addressed as below
18 Detail information are from the training records for masons and technicians.
16
Table 9: FARs from DOE Verification Report
Contents Summary of project participants’ response FAR01 Please confirm if any double-counting of the biogas digester households between the VGS and potential subsequent CPA in the CDM PoA under the UNFCCC
During the MPII, there is not any double counting of the biogas digesters between the VGS and the CPA in the CDM PoA under UNFCCC because the soonest start of crediting period of the CPA19 is 10/01/2014 while the MPII period is from 01/01/2012 to 30/06/2013.
FAR02 Please ensure the trained masons and technicians were chosen in line with the defined rules in the monitoring of SD parameter of Quality of Employment as requested by GS during the 1st verification.
Please find the response in the table 08 above to the FAR raised by GS.
FAR03 Please ensure the digestate management system implemented by the biogas users in project scenario is monitored and the project emissions is taken account for the methane emissions from digestate as requested by GS during the 1st verification
The project emission from digestate was monitored and calculated in the Section D.2 below.
FAR04 Please ensure the GS approved emission factor of charcoal production is applied as requested by GS during the 1st verification
As from CMS result, there are only 2% of households e using charcoal for the business purpose therefore the emission factor of charcoal production is not applied in the MPII. In future monitoring period if the households using charcoal, the GS approved emission factor will be applied accordingly.
FAR05 Please ensure BFT is conducted once for each crediting period and PFT is carried out biannually 20 for the project activity as approved by GS during the 1st verification referring to Annex 5 of the applied GS methodology
A carbon monitoring survey (CMS) which included the BFT for the first crediting period was executed from January 2014 to April 2014 amongst a representative sample of biogas user with the objective to obtain reliable and unbiased data on the impact of the program on sustainable development and on GHG emission modalities, such as fossil and fuel consumption and manure management practices. According to the Annex 5 of the GS methodology, the PFT should be conducted every two years after the first verification. The first verification was conducted in 2013 and the PFT was conducted in beginning of 2014 or one year after the first verification. The next PFT will also be conducted in beginning of 2016 following the Annex 5 of the GS methodology.
19 http://cdm.unfccc.int/ProgrammeOfActivities/cpa_db/3TFCA4GQYRDZSBIOPWUMV5086XEN79/view 20 This word “biannually” was a typo mistake from the DOE in their MPI verification report. It was corrected as “biennial” as
explained in Section B.2.3 above.
17
SECTION C. Description of monitoring system BPD applies three monitoring methods
x Quality control measures
x Carbon monitoring survey
x Usage survey
C.1. Quality control monitoring The Quality control (QC) on construction is executed by a number of persons: DT (District Technician), PT
(Provincial Technician), BPD (Biogas Project Division), PBPD (Provincial Biogas Project Division), the
masons and through the independent Biogas user survey. The objectives are:
y Guarantee the accomplishment of a unique standard for the unification of all steps of QC at all levels;
y Manage QC in accordance with the project requirements, at all levels;
y Make sure that biogas plants are constructed under the project standard in terms of design;
y Ensure subsidy provision for each household.
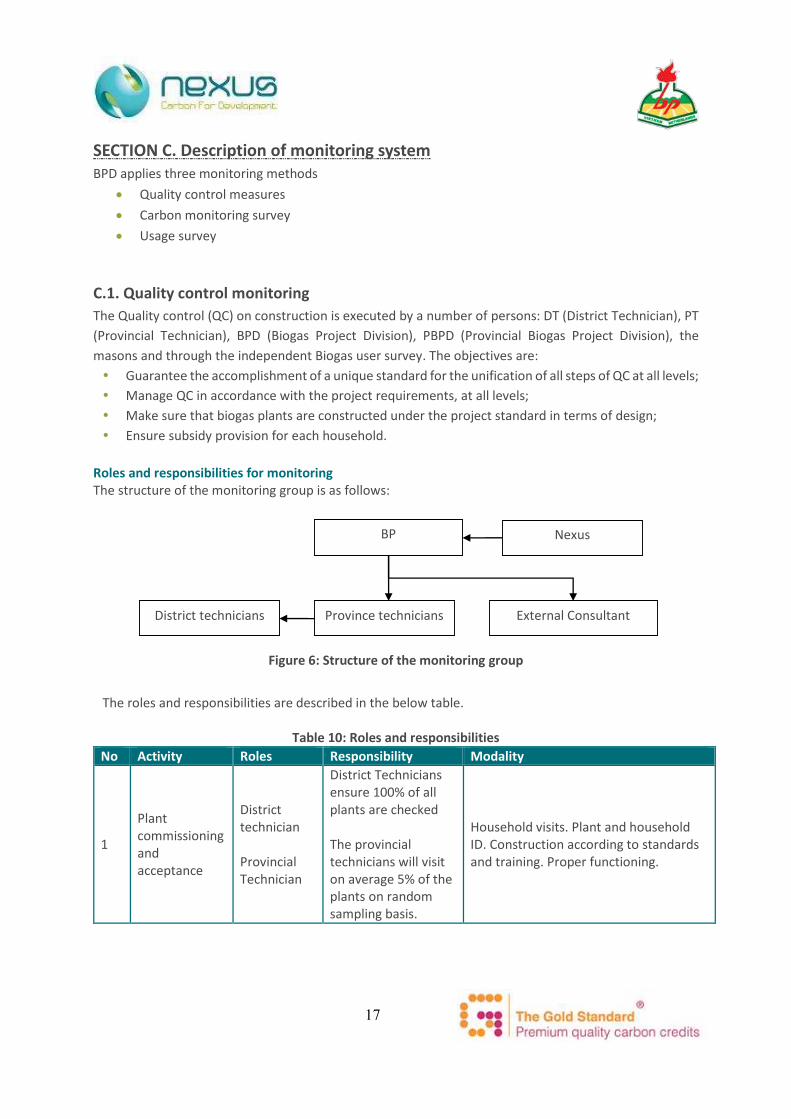
Roles and responsibilities for monitoring The structure of the monitoring group is as follows:
Figure 6: Structure of the monitoring group
The roles and responsibilities are described in the below table.
Table 10: Roles and responsibilities No Activity Roles Responsibility Modality
1
Plant commissioning and acceptance
District technician Provincial Technician
District Technicians ensure 100% of all plants are checked The provincial technicians will visit on average 5% of the plants on random sampling basis.
Household visits. Plant and household ID. Construction according to standards and training. Proper functioning.
BP
Province technicians District technicians External Consultant
Nexus

18
2
Quality control of “under construction” plant
District technician
The district technicians will visit each and every plants being constructed.
Household visits. Plant and household ID. Construction according to standards and training. Feedback given to the masons to ensure the quality compliance of quality standards.
3
Quality control of “construction completed” plant
Provincial Technician
Based on the received testing & acceptance forms, the provincial technician will, at random, visit 10% of the biogas installations.
Household visits. Plant and household ID. Construction according to standards and training. Proper functioning. Quality check on the data and information filled in the form by the district technicians.
BP Staff
BP Staff will randomly check 1.5% of the completed plants.
4
Provisions of after-sale-services and complaints mechanisms
District technician/ Provincial technician will be involved if a problem cannot be solved
100% biogas users will receive post- construction training. The household visit will be implemented upon receiving complaints from biogas users.
Household visit. Plant and household ID, functionality.
5 Biogas User Survey (BUS)
External Consultant
Stratified Random Sample, annual
Household visit. Plant and household ID, functionality and operation. User’s satisfaction, applied benefits and evaluation of the program’s impacts21.
6 Carbon monitoring and reporting
Nexus GS monitoring Household sampling, questionnaire, emission reduction calculation, monitoring report.
The next figure shows a flow chart of the activities number 1, 2 and 3 of the table above. The percentages
in the flow charter refer to the percentage of units checked.
21 From the MPII, the BUS survey is combined with the carbon monitoring survey (CMS)

19
Household (HH) registration
Construction contract & start
Construction process
Construction finished/acceptance made
Plant in operation
Acceptance files submitted to PBPD by DT
Acceptance files submitted to BP by PBPD
DT & mason validate via form 3 filled by HH
DT check with form 9
PT check with form 9
DT check with form 7
PT check with form 7 & from 10
BP check with from 10
Process stop
Correction by mason
100%
Yes No
No
Yes Warranty given
Yes
No
Yes
No
Subsidy payment
BP checks and accepts
PT check and input to database
5%
0.5% BP check with form 9
100%
10%
1.5%
Process finished
Figure 7: Quality control flow chart enforcement in Biogas Project Where: DT=District Technician, PT = provincial technician, PBPD= Provincial Biogas Programme Department

20
Data management and archiving The hard copies of the main forms above (7 and 9) are entered into the online program database. All the hard copies will be stored at least 5 years after the end of the project activity. Emergency procedures The data server has a backup server to avoid deletion or corruption of data. The server service supplier is FPT telecom22 and data will be backed up every 2 days. Besides, the list of plants with household, plants code and other detail information will be extracted to the excel database regularly for each crediting period as an offline backup database.
C.2. Carbon Monitoring Survey (CMS) A Carbon Monitoring Survey (CMS) was executed from January 2014 to April 2014 amongst a representative sample of biogas user in each climate zone23 with the objective to obtain reliable and unbiased data on the impact of the program on sustainable development and on GHG emission modalities, such as fossil and fuel wood consumption and manure management practices. Data obtained from each zone will be used to calculate the emission reductions and weighted by the proportion of households that are situated in each zone. The next table shows the CMS studies and the studies included in MPII.
Table 11: Carbon Monitoring Survey (CMS) studies and KPT
# Name of study Monitoring interval MPII
1 Project non-renewable biomass (NRB) assessment;
Once for the first crediting period
fNRB is established once for the first crediting period. The figure from the PDD is adopted for MPII.
2 Project studies (PS) of target population characteristics;
Annual Included in CMS MPII
3
Baseline Fuel Test and Project Performance Field Test (PFT) of fuel consumption;
Biennial for PFT and once for BFT in this crediting period24
Included in CMS MPII and retroactively applied to MPI
4 Monitoring of the SD parameters.
Annual Included in CMS MPII
5 Leakage emission assessment
Every two year after first verification
Not included in CMS MPII as the first verification was conducted in 2013, the leakage emission assessment will be conducted in 2015.
22 http://www.fpt.vn/en/ 23 The IPCC provides values for 3 climate zones (cool <15ᵒC, temperate ≥15,< 26ᵒC and warm ≥ 26ᵒC), see Chapter 10: Emissions
from Livestock and Manure Management, Volume 4 - AGRICULTURE, FORESTRY AND OTHER LAND USE, 2006 IPCC Guidelines for National Greenhouse Gas Inventories.
24 This is an approved deviation from the Goldstandard during the first monitoring period.

21
6 Maintenance of total sale record and project database
Continuous Continuous activity
1. NRB Assessment Over the course of a project activity the project proponent may at any time choose to re-examine renewability by conducting a new NRB assessment. In case of a renewal of the crediting period and as per Gold Standard rules, the NRB fraction must be reassessed as any other baseline parameters and updated in line with most recent data available. According to Annex 5 of the applied methodology the NRB assessment shall be updated as proposed by the project proponent (PP). The PP chooses to update the fNRB for each crediting period. 2. Project survey (PS) of the target population characteristic In addition to the parameters monitored as per PDD and GSPR, the CMS survey includes a set of target population parameters, such as household size, digester size, ID code. 3. Baseline Fuel Test (BFT) and the Project Performance Field (BFT) The baseline performance field tests (BFT and project performance field test (PFT) measure real, observed technology performance in the field. BFT: The BFT will measure baseline fuel consumption. The degree is measured in kg/hh/day. PFT: The PFT will measure the performance of the biogas plant, which is defined as degree that biogas displaces baseline fuels. The degree is measured in kg/hh/day of baseline fuel). The measurements will be conducted with calibrated scales. The consultant who conducting the site survey have to maintain and get it calibrated before the expired date or using the new scale. Every scale should have the certification of verification which the expired date is still valid at time of conducting the field survey. 4. Sustainability assessment The CMS survey includes the monitoring of the SD parameters where it applies to biogas households.
5. Leakage emission assessment A leakage investigation will be conducted every 2 years after the first verification as per page 49 of the
applied methodology. As the first verification was conducted in 2013 so the leakage assessment is not
conducted in the current MPII which is taken placed in 2014.
6. Maintenance of total sale record and project database All data sale records are collected and stored in a central database and continuously updated. Excerpts of
this database will be made available in the excel workbook belonging to this report.

22
C.3. Usage survey (US) The usage survey provides a single usage parameter that is weighted based on drop off rates that are
representative of the age distribution for project technologies in the database. A usage parameter must
be established to account for drop off rates as project technologies age and are replaced. Prior to a
verification, a usage parameter is required that is weighted to be representative of the quantity of project
technologies of each age being credited in a given project scenario.
For example, if only technologies in the first year of use (age 0-1) are being credited, a usage parameter
must be established through a usage survey for technologies age 0-1. If an unequal number of
technologies in the first year of use (age 0-1 ) and second year of use (age 1-2 ) are credited, a usage
parameter is required that is weighted to be equally representative of drop off rates for technologies age
0-1 and age 1-2 . The minimum total sample size is 100, with at least 30 samples for project technologies
of each age being credited
The majority of interviews in a usage survey must be conducted in person and include expert observation
by the interviewer within the kitchen in question, while the remainder may be conducted via telephone
by the same interviewers on condition that in kitchen observational interviews are first concluded and
analyzed such that typical circumstances are well understood by the telephone interviewers.
To ensure conservativeness, participants in a usage survey with technologies in the first year of use (age
0-must have technologies that have been in use on average longer than 0.5 years. For technologies in the
second year of use (age 1-2), the usage survey must be conducted with technologies that have been in
use on average at least 1.5 years, and so on.
The US monitoring procedure applied will consist of the following steps:
I. Details of the biogas households of each age group are gathered;
II. Simple random selection of at least 30 households from each age group (35 were selected by
applying oversampling). The sampling is executed using a web based random number generator25.
Screenshots were made of the generated numbers and available at request.
III. The generated numbers were linked to the households, i.e. randomly generated number 97 was
linked with number 97 of the age group, number 97 was then included in the list of samples.
IV. BP personal surveyed the sampled households, and the gathered data was entered into a
database at the head office after inspection of the quality.
V. The obtained drop-off rate will be used to discount emission reductions
25 http://www.graphpad.com/quickcalcs/index.cfm
23
SECTION D. Data and parameters
D.1. Data and parameters that are available at validation
Data / Parameter: EFb,CO2
Data unit: kgCO2/TJ fuel Description: CO2 emission factor arising from use of fuels in the baseline scenario Source of data used: 2006 IPCC Guidelines defaults, see chapter 2 Stationary Combustion:
http://www.ipcc-nggip.iges.or.jp/public/2006gl/vol2.html Value applied: Fuel b EFCO2,
(kg/TJ) LPG 63100 Charcoal 112000 Coal 94 600 Firewood 112000 Agriculture residues 100000 Kerosene 71900 Charcoal production 1285 gCO2 /kg charcoal26
Any comment: The CO2 emissions from agricultural residues are considered renewable; hence the CO2 emission will be zero.
Data / Parameter: EFi,CH4
Data unit: kgCH4/TJ fuel Description: CH4 emission factor arising from use of fuels in the baseline scenario Source of data used: 2006 IPCC Guidelines defaults see chapter 2 Stationary Combustion:
http://www.ipcc-nggip.iges.or.jp/public/2006gl/vol2.html, table 2.9 and for Charcoal production Good Practice Guidance and Uncertainty Management in National GHG inventories: http://www.ipcc-nggip.iges.or.jp/public/gp/bgp/2_2_Non-CO2_Stationary_Combustion.pdf table 1
Value applied: Fuel i EFCH4,
(kg/TJ) LPG 11.95 Charcoal 330.5 Coal 1458.5 Firewood 1224 Agriculture residues 2210 Kerosene 12.6 Charcoal production 1000
Any comment: Some of the EF values in table 2.9 are ranges; in that case the average value is taken.
26 Averaged CO2 emissions from Kirk R. Smith, David M. Pennise (1999) Charcoal-Making Kilns in Thailand. Smith et al reported
the CO2 emission as being between 970-1600 gCO2/kg charcoal produced, 1285 is the average of that figure. Charcoal kilns are assumed to be similar or better in Thailand compared to Vietnam.
24
Data / Parameter: EFi,N2O Data unit: kgN2O/TJ fuel Description: N2O emission factor arising from use of fuels in the baseline scenario Source of data used: 2006 IPCC Guidelines defaults, see chapter 2 Stationary Combustion, table 2.9
http://www.ipcc-nggip.iges.or.jp/public/2006gl/vol2.html Value applied:
Fuel i EFN20,
(kg/TJ) LPG 2.1 Charcoal 5.45 Coal NA Firewood 11.25 Agriculture residues 9.7 Kerosene 1.55 Charcoal production NA
Any comment: Some of the EF values in table 2.9 are ranges; in that case the average value is taken.
Data / Parameter: NCVi Data unit: TJ/Gg Description: Net calorific value of the fuel i used in the baseline Source of data used: 2006 IPCC Guidelines defaults, see chapter 1 Energy table 1.2 http://www.ipcc-
nggip.iges.or.jp/public/2006gl/vol2.html Value applied:
Fuel i NCVi (TJ/Gg) LPG 47.3 Charcoal 29.5 Coal 25.8 Firewood 15.6 Agriculture residues 11.6 Kerosene 43.8
Any comment:
Data / Parameter: GWPCH4
Data unit: tCO2e per tCH4 Description: Global Warming Potential (GWP) of methane Source of data used: SAR IPCC Any comment: 21 and 25 for the first and second commitment period, respectively. Shall be
updated to any future COP/MOP decisions
Data / Parameter: GWPN2O
Data unit: tCO2e per tN2O Description: Global Warming Potential (GWP) of nitrous oxide Source of data used: SAR IPCC Any comment: 310 and 298 for the first and second commitment period, respectively. Shall be
updated to any future COP/MOP decisions

25
Data and parameters not monitored AWMS
Data / Parameter: VS (T) Data unit: kg dry matter per animal per day Description: Daily volatile solid excreted for livestock category T Source of data used: Volume 4 of the 2006 IPCC Guidelines for National Greenhouse Gas Inventories,
chapter 10 (online: http://www.ipcc-nggip.iges.or.jp/public/2006gl/vol4.html) Value applied:
Any comment: Any comment: 365 = basis for calculating annual VS production, days per year
Data / Parameter: Bo(T) Data unit: m3 CH4 per kg of VS excreted Description: Maximum methane production capacity for manure produced by livestock
category T Source of data used: Volume 4 of the 2006 IPCC Guidelines for National Greenhouse Gas Inventories,
chapter 10 (online: http://www.ipcc-nggip.iges.or.jp/public/2006gl/vol4.html) Value applied:
Any comment:
Data / Parameter: MCF(k) Data unit: [-] Description: Methane conversion factor for each manure management system by climate
region k Source of data used: Volume 4 of the 2006 IPCC Guidelines for National Greenhouse Gas Inventories,
chapter 10 (online: http://www.ipcc-nggip.iges.or.jp/public/2006gl/vol4.html) Value applied: 10% for bio-digester systems Any comment:
Data / Parameter: Data unit: [-]% Description: Combustion efficiency of the biogas stove
Animal VS(T)
T kg/day
Pig 0.3Buffalo 3.9Dairy cow 2.8Cattle 2.3
Animal VS(T) Bo(T)
T kg/day m3CH4/kgVS
Pig 0.3 0.29Buffalo 3.9 0.1Dairy cow 2.8 0.13Cattle 2.3 0.1
ηbiogasstove

26
Source of data used: 98%, the default value from the GS methodology: Indicative Programme, baseline, and monitoring methodology for Small Scale Bio-digester
Value applied 98% Any comments
Data / Parameter: EFawms(T)
Data unit: kgCH4 per animal per year for livestock type T
Description: Animal waste methane emission factor by average temperature
Source of data used: IPCC default values for the region Asia from volume 4 of the 2006 IPCC
Guidelines for National Greenhouse Gas Inventories, chapter 10 (online:
http://www.ipcc-nggip.iges.or.jp/public/2006gl/vol4.html)
Value applied: Animal T EF (kgCH4/head/year)
Temperate zone Warm zone
Pig 5.00 7.00
Buffalo 2.00 2.00
Dairy cow 23.00 31.00
Cattle 1.00 1.00
Any comment: For baseline emission calculation. The IPCC default value depends on the
average annual temperature, and for each zone an average is calculated based
on the temperature in participating provinces in the respective zone. The EF
values for buffalo and cattle were the same in each province for the
temperature ranges observed.
D.2. Data and parameters monitored
Data / Parameter: fNRB,y
Data unit: Fraction of non-renewability Description: Non-renewability status of woody biomass fuel in scenario I during year y Source of data to be used:
Literature review, surveys
Value of data applied for the purpose of calculating expected emission reductions
67%
QA/QC procedures to be applied:
Any comment: Fixed by baseline study for each crediting period
Data / Parameter: Pb,y
Data unit: kg/hh/day Description: Quantity of fuel that is consumed in the baseline scenario in year y

27
Source of data to be used:
Original data is in KPT monitoring survey27 tab “FuelSaving”. Summary result in tab “ER_fuel” of the MPII Monitoring database.
Value of data applied for the purpose of calculating expected emission reductions
Fuel i Average per household
kg/hh/day LPG 0.10
Firewood 5.26
Agriculture residues
1.88
QA/QC procedures to be applied:
Fuel data is collected by the third party during the monitoring survey.
Any comment: Vietnam consists of two climatic zones, temperate and warm. The average temperature between the zones differs with only around 4 degrees (23 degrees average in temperate zone and 27 in the warm zone). Therefore it is reasonable to assume that fuel use for cooking is independent of temperature and therefore it is not necessary to differentiate in the KPT by climate zone. This is different for the carbon monitoring survey as this includes questions on manure management where certain parameters are temperature dependent.
Data / Parameter: Ph,y Data unit: kg/hh/day Description: Quantity of fuel that is consumed in the project scenario in year y Source of data to be used:
Original data is in KPT monitoring survey tab “FuelSaving”. Summary result in tab “ER_fuel” of the MPII Monitoring database.
Value of data applied for the purpose of calculating expected emission reductions
Fuel i Average per household
kg/hh/day LPG 0.01
Firewood 0.76
Agriculture residues
0.28
QA/QC procedures to be applied:
Fuel data is collected by the third party during the monitoring survey.
Any comment: Vietnam consists of two climatic zones, temperate and warm. The average temperature between the zones differs with only around 4 degrees (23 degrees average in temperate zone and 27 in the warm zone). Therefore it is reasonable to assume that fuel use for cooking is independent of temperature and therefore it is not necessary to differentiate in the KPT by climate zone. This is different for the carbon monitoring survey as this includes questions on manure management where certain parameters are temperature dependent.
Data / Parameter: Up,y
Data unit: Percentage Description: Percentage of bio-digesters in use in monitoring period y
27 The KPT monitoring survey for this proposed project which include the PFT and the BFT for fuel consumption is required by
the methodology as well as requested by the GS during the first verification.

28
Source of data to be used:
Original data is in Usage survey result, from Group 0-1 to Group 5-6. Summary result in tab “US_results” of the MPII Monitoring database.
Value of data applied for the purpose of calculating expected emission reductions
85.32%
QA/QC procedures to be applied:
Conservative sample of 35 household per year for each programme year was taken instead of 30. All data was collected by provincial or district technicians (expert persons) and checked at national level by BP before entering into the database.
Any comment:
AWMS data and parameters monitored over the crediting period
Data / Parameter: Np,y
Data unit: Units Description: Number of biogas plants commissioned Source of data to be used:
BPD database
Value of data applied for the purpose of calculating expected emission reductions
106,171
QA/QC procedures to be applied:
100% of all plants are checked after completion of the construction by the district technician on compliance with the MARD biogas standard. 5% of the plants were visited by the provincial technician for the same check (QC on random sampling basis.
Any comment:
Data / Parameter: MS(T,S,k)
Data unit: [-]& Description: Fraction of livestock category T’s manure fed into the bio-digester S, in climate
zone k
Source of data used: CMS monitoring survey, tab “Data” Value of data applied for the purpose of calculating expected emission reductions
The next table shows the share in % of manure fed into the bio-digesters.
Climate zone Pig Buffalo Dairy cow Cattle temperate 97.77 25.00 N/A 60.87
warm 97.63 100.00 N/A 31.78
QA/QC procedures to be applied:
Data will be collected according to the CMS sampling plan
Any comment:
Data / Parameter: MS(P,S,k)
Data unit: [-]&

29
Description: Fraction of livestock category T’s manure not fed into the bio-digester S, in climate zone k
Source of data used: CMS monitoring survey, tab “Data” Value of data applied for the purpose of calculating expected emission reductions
The next table shows the share of manure not fed into the bio-digesters.
Climate zone Pig Buffalo Dairy cow Cattle temperate 2.23 75.00 N/A 39.13
warm 2.37 0.00 N/A 68.22
Monitoring frequency Annual QA/QC procedures to be applied:
Data will be collected according to the CMS sampling plan
Any comment: None of the farmers in the sample owned dairy cows
Data / Parameter: N(T)
Data unit: [-] Description: Number of animals of livestock category T Source of data used: CMS monitoring survey, tab “Data” Value of data applied for the purpose of calculating expected emission reductions
Animal N(T),h climate
zone temperate N(T),h climate zone
warm
T # #
Pig 24.94 28.18
Buffalo 0.05 0.01
Dairy cow 0 0
Cattle 0.23 1.98
Monitoring frequency Annual QA/QC procedures to be applied:
Any comment: The average number of pig is based on AMS-III.D paragraph 16 (g) with equation 3 on the calculation of average animals held over the year:
¸̧¹
·¨̈©
§u
365,
,,yp
ydayLT
NNN
Where:
ydaN , = Number of days animal is alive in the farm in the year y (numbers)
ypN , = Number of animals produced annually of type LT for the year y
(numbers) Source: https://cdm.unfccc.int/UserManagement/FileStorage/U3VXM2PADRFH7YOJBL94ENI18W0CZ5
Data / Parameter: PL
Data unit: % Description: Physical leakage of the bio-digester

30
Data / Parameter: EFawms,T, Data unit: kgCH4 per animal per year for livestock type T in the project Description: Animal waste methane emission factor calculated by average local
temperatures, IPCC default values and result of CMS monitoring survey. Source of data used: IPCC default values for the region Asia from volume 4 of the 2006 IPCC
Guidelines for National Greenhouse Gas Inventories, chapter 10 (online: http://www.ipcc-nggip.iges.or.jp/public/2006gl/vol4.html) CMS monitoring Local temperatures (tab “Input”, monitoring database spreadsheet)
Value of data applied for the purpose of calculating expected emission reductions
EF AWMS by animal
Zone temperate Zone Warm
Pig 2.086 2.171
Buffalo 4.530 9.537
Dairy cow 0.000 0.000
Cattle 3.791 2.731
Any comment: For project emission calculation. The IPCC default value depends on the average annual temperature. EFawms,T is calculated from average local temperature, the IPCC default values such as VS(T), Bo(T), MCF(k) and also the actual waste management practice MS(T,S,k) from CMS monitoring.
Data / Parameter: PEbio-slurry
Data unit: tCO2/year Description: Emissions from anaerobic disposal of bio-slurry Source of data used: Original data is in CMS monitoring survey, tab “Data”. Summary result in tab
“PE_Bioslurry” of the MPII Monitoring database. Value of data applied for the purpose of calculating expected emission reductions
For 2012 vintage:
Average Bio-slurry emissions Units CO2e/unit CO2e
Temperate 81,805 0.011 921
Source of data to be used:
Default value of the applied methodology is adopted (TPDDTEC page 52)
Value of data applied for the purpose of calculating expected emission reductions
10%
Monitoring frequency Updated with new IPCC guidance, the PP will check annually if there are new IPCC default values applicable
QA/QC procedures to be applied:
Any comment: The physical leakage is not monitored, this is not possible.

31
Warm 24,366 0.016 394
Total 106,171 1315
Average emissions 0.012 tCO2e/year/hh For 2013 vintage:
Average Bio-slurry emissions Units CO2e/unit CO2e
Temperate 81,805 0.013 1097
Warm 24,366 0.019 469
Total 106,171 1566
Average emissions 0.015 tCO2e/year/hh
Any comment:
D.3. Implementation of sampling plans D.3.1. Sampling approach The next table summarizes the design of the surveys:
Table 12: Survey designs summary
Item CMS survey PFT BFT Usage survey
Target group Users with a bio-digester
Users with a bio-digester
Households without a bio-digester
Households with a bio-digester that has been in use for at least 6 months before the end of MPII
Main topics
User characteristics, AWMS and SD survey
Project fuel use Baseline fuel use Drop-off rate
Sampling method Cluster sampling Probability proportional to size sampling
Selection based on PFT sampling frame
Cluster sampling
Cluster District District PFT cluster Age group
Sample size 17 households (including 10% oversampling)
3 households per district 28
3 households per district
35 household (oversampling with 5 households)
28 The BFT and PFT were combined with the CMS survey. The 3 PFT households will be randomly selected from those 17
households of each CMS cluster

32
Number of clusters
20 (10 for each zone)
20 20 6
Total sample size 340 60 60 210
D.3.2. CMS survey The CMS sampling plan is implemented according to the registered monitoring plan as follow: Table 13: CMS survey design
Sampling plan Sampling MPII Sampling objective: The objective of the sampling effort is to obtain reliable data for the
CMS survey; Field Measurement Objectives and Data to be collected:
The survey will consist of household visit in random selected end-users to collect data described in PDD section B.7.1. Data will be collected using interview methods;
Target Population and Sampling Frame:
As Vietnam consists of two climate zones, temperate and warm, the CMS will study each zone separately29. The ERs are calculated based on the information gathered from both zones, and in case one zone contains more households than the other, a proportional weight is applied to the larger zone to adjust for the size difference. The sampling frame for each climate zone will be drawn from the database; all households in the sampling frame represent the target population. Target population membership is recorded in the database and uniquely identifiable based on the ID code of the biogas plant.
Sampling method (approach):
Clustered random sampling in each climate zone, in each climate zone 10 clusters will be selected randomly for each monitoring interval. One cluster is one district. The clusters are selected by applying the Probability-Proportional-to-size (PPS) random cluster sampling using two-stage cluster design: (1) clusters are selected with probability-proportional-to-size (PPS) at the first stage of sample selection and (2) a number of households are chosen from each cluster at the second stage. The primary sampling units, the clusters, are randomly selected districts and the second sampling units are randomly selected households belonging to the target group in the clusters. PPS sampling is statistically the most significant sampling method as it ensures that each household has the same probability to be selected. The two zones are based on IPCC climatic classification: temperate and warm. Data obtained from both zones will be aggregated proportionally (a weight will be applied to the data of each zone based on the total number of biogas households in each zone i.e. if zone A is has only 25% of the households in zone B, the weight of zone B is 3 and zone A 1).
29
The IPCC distinguishes 3 climate zones: cool <15ᵒC, temperate ≥15,≤ 25ᵒC and warm > 25ᵒC, see Chapter 10: Emissions from Livestock and Manure Management, Volume 4 - AGRICULTURE, FORESTRY AND OTHER LAND USE, 2006 IPCC Guidelines for
National Greenhouse Gas Inventories.

33
Implementation: The CMS was executed by a selected independent consultant in from Feb to Apr 2014.
Desired Precision/Expected Variance and Sample Size.
The confidence precision level will be based on the VGS methodology guidance.
Procedures for Administering Data Collection and Minimizing Non-Sampling Errors:
The standard procedure for conducting the data collection is the following steps (1) Development of questionnaire; (2) Training and selection of surveyors; (3) Pilot testing of the questionnaire to ascertain that the questionnaire is appropriate and yields the required information. (4) Field survey.
Sample size: The sample size equation which was mentioned in the registered PDD, page 57 was:
𝑛 = 𝑁𝑥1 + 𝑁𝑥(𝑒)2
Where:
n = minimal sample size
e = level of precision (10%)
Nx = the BP biogas population in zone x
x = Temperature zone (warm or temperature)
The above formulae is for calculating the minimum number of samples. In the following section of the PDD (page 58, 59) the designed effect (D=1.5) and rate of oversampling (10%) was also discussed to cover the loss of effectiveness when conduct cluster sampling and non-responses of surveyed households.
Therefore in this current monitoring report, the sample size equation was combined all above factors together to one formulae as below30:
𝑛 = 𝑁𝑥1 + 𝑁𝑥(𝑒)2 ∗ 𝐷 ∗ 110%
Where:
n = minimal sample size
e = level of precision (10%)
Nx = the BP biogas population in zone x
x = Temperature zone (warm or temperature)
D = Design effect (1.5 according to the approved PDD page 59)
110% = Oversampling rate (according to the approved PDD page 59)
Table 14: Minimum sample size per zone31
Zone Classification N Calculated n Round up n A Temperate 81,805 164.80 170 B Warm 24,366 164.33 170
30 Please refer to the registered PDD for more detail. 31 Details calculation in row 133 of tab “Input” of the “MPII_Monitoring database” spreadsheet
34
Total 340 The calculated n is 170 households for each zone. According to the registered PDD, in each climate zone 10 clusters will be selected randomly for each monitoring interval, one cluster is one district. Therefore, the cluster sample size is consequently 170/10 = 17. The total sample size, in the two zones and 10 clusters per zone, will then be 17*10*2 = 340 households.
Sampling procedure – cluster selection The sampling procedure of the district selection consisted of the following steps:
x Drafting a list of districts by zone; x Random selection of 10 districts in each zone base on the probability proportional to size
method using a random number generator; x In case a district does not contain enough samples, the neighboring district was also included in
the cluster. This can happen as continuously new districts are included in the program. Initial installation rates are very low in the newest districts.
Sampling results Warm zone:
x List all districts in the project area and their population in Temperate zone (column A and B in tab “Warm” of the “CMS and KPT_Sampling HHs” excel database. There are 191 districts in total.
x Calculate the running cumulative population (Column D). The last number in this column is the total population of the project area. In this project case, the total population is 24,366.
x Determine the number of sites which is 10 according to the approved PDD x The Sampling Interval (SI) will be determined by dividing the total population of the project area
by the number of sites which results 2,437. x Choose a number between 1 and the SI at random. This is the Random Start (RS). In this sample,
the RS is 1,689. x Calculate the following series: RS; RS + SI; RS + 2SI; RS + 3SI; RS + 4SI; RS + 5SI; RS + 6SI; RS + 7SI;
RS + 8SI; RS + 9SI. The result are in the following table: Table 15: Sampled steps for warm zone
No Interval Value 1. RS 1,689 2. RS + 1SI 4,126 3. RS + 2SI 6,563 4. RS + 3SI 9,000 5. RS + 4SI 11,437 6. RS + 5SI 13,874 7. RS + 6SI 16,311 8. RS + 7SI 18,748 9. RS + 8SI 21,185 10. RS + 9SI 23,622
x Each of these 10 numbers corresponds to a site on the list of district. The districts selected are
those for which Column D, the cumulative population, contains the numbers in the series calculated above. For example, the second number in the series (4,126) is contained in district named “CAM RANH-Khanh Hoa”, which holds numbers from 4,048 to 4,136. The third number in

35
the series (6,563) is contained in district named “Dien Khanh-Khanh Hoa”, which holds numbers from 6,519 to 6,619.
x Continuing in this manner, the desired number of sites will be selected as below Table 16: Randomly selected clusters in zone B: Warm32
# Cluster Number of plants in cluster
1 Ba Tri-Ben Tre 457
2 CAM RANH-Khanh Hoa 88
3 Dien Khanh-Khanh Hoa 100
4 H. Go Cong Tay-Tien Giang 528
5 Huyen Chau Phu-An Giang 231
6 Huyen Phu Tan-An Giang 144
7 Nhon Trach-Dong Nai 80
8 Tay Son-Binh Dinh 1185
9 Thi xa Tan Chau-An Giang 96
10 Van Canh-Binh Dinh 85
Temperate zone
Similarly, the following districts were selected for zone Temperate. Details for selection result could be found in tab “Temperate” of the CMS and KPT excel database. Table 17: Randomly selected clusters in zone A: Temperate33
# Cluster Number of plants in cluster
1 Binh Luc-Ha Nam 905
2 Dong Hung-Thai Binh 392
3 Hoang Hoa-Thanh Hoa 428
4 Kim Bang-Ha Nam 704
5 Luong Tai-Bac Ninh 644
6 Phu Luong-Thai Nguyen 364
7 Tam Duong-Vinh Phuc 505
8 Thanh pho Yen Bai-Yen Bai 239
9 Tinh Gia-Thanh Hoa 392
10 Yen Binh-Yen Bai 385
The next figure shows the selected districts in Vietnam. Evidences of the random selection and screenshots are available to DOE at verification.
32 Details calculation in tab “Warm” of the “CMS and KPT_Sampling HHs” excel file 33 Details calculation in tab “Temperate” of the ”CMS and KPT_sampling HHs” excel spreadsheet
36
Figure 8: Selected provinces by climate zone
Sampling procedure – household selection The households are selected according to the following procedure:
x Gathering of all biogas user data of the selected clusters by zone;
Warm zone
Temperate zone

37
x Random selection of 17 households in each cluster using a random number generator;
x Gathering the selected households in a list for survey execution.
Since the list is very large, 340 households, it is not attached as Annex. The list of the randomly selected households is available at request for inspection. Back up households For each cluster, 17 backup households which are randomly selected were also prepared. It may happen that households are not at home and in that case the household is replaced from a list of backup households. D.3.3. Baseline fuel test (BFT) and the project performance field (PFT) The baseline performance field tests (BFT and project performance field test (PFT) measure real, observed technology performance in the field. Consumption is measured with a representative sample of end users under each defined baseline scenario (in the absence of the project technology) and project scenario. The KPT is executed according to this protocol34: - Test period shall be 1 days = the measurement campaign (MC). - The selected test day will span fuel measurement consumption for human food cooking, boiling
water and animal feed preparation totalling 24 hours. - Cooking practices shall be during ‘normal days’.
o Normal days are defined as periods outside festivals or holidays and during the week. The MC
can take place in the weekend if it can be demonstrated that fuel use is not higher during these
days (i.e. the same number of people eat meals as during the week). This was for example the
case in GS751.
o Pig farming has a cyclic nature with continued successive cycles of pig breeding – fattening –
breeding. Only the number of sows is stable throughout the year. Normal days for pig farming
are defined as the moment that the farmer has the average or a lower number of pigs.
- The KPT questionnaire also addressed seasonality by asking if the selected day is representative for the whole year. If the majority responds that the day is not representative, the KPT will be executed during the season with the lowest fuel use.
- Households are instructed that they cook normally during the test. The aim is to capture their usual behaviour in the kitchen, as if no tests were happening, to feed the usual variation of people with the usual variation of food types.
- To conduct the tests, ensured is that the cook uses fuel only from a designated stock which is pre-weighed.
- During the tests, also was find out how many people have eaten and how many meals each, so that you can enter into the data sheet the number of “person-meals” (individual meals as opposed to meals shared) cooked with the weighed fuel each day. Note that this count can include meals sold commercially as well as meals consumed in the domestic environment. The number of people eating meals shall be recorded using the following categories: Child 0-14 years, Female over 14 years, male 15-59 and male over 59 years old.
34 The KPT protocol is based on the approved guidelines used by GS751 project. This protocol was sent to GS on 27/09/2013 for
approval before implementation.

38
- The fuel is typical of the fuel normally used through the year. It is also important that the subjects are paying for fuel so they have an incentive to conserve it. Subjects can be told they will be rewarded for their effort and time at the end of the test, once it is successfully completed.
- A quality control phone call will be made in the evening to ensure that the household properly understands the purpose and method of the KPT.
The measurements were conducted with calibrated scales of 15±0.02 kg. The figures below showed the scale and its certificate of calibration by the Quality Assurance And Testing Center 1 (QUATEST 1).
Figure 9 Calibrated scale for survey
The KPT targets two groups:
Table 18: KPT target groups
Group Description of target group Sample size
PFT household
Randomly selected household from the project database with a bio-digester
60
BFT household
Nearest equivalent households to the randomly selected project household by a selection criteria of non-biogas household in perception of similar cook stoves, difference in number of animals as below:
x Similar number of household members: ± 2 people x Similar cooking stove type: either open stove (3,4 legs), closed
stove (cement, brick, clay), home comb stove, LPG stove, kerosene stove
x Similar house appearance or economic wealth: relative impression
x Similar types and quantities of animals: same type, each type of animals, ±30% in quantity each type
60
Total sample 120
Only after data collection it can be know if the data meets the required precision, this is per Annex 4 of the applied methodology. KPT survey design

39
Vietnam consists of two climatic zones, temperate and warm. The average temperature between the zones differs with only around 4 degrees, 23 degrees average in temperate zone and 27 in the warm zone. Therefore fuel use for cooking is not dependent of temperature and it is not necessary to differentiate in the KPT by climate zone. This is different for the carbon monitoring survey as this includes questions on manure management for which important emission parameters, such as MCF, are temperature dependent. The KPT will therefore target all the provinces where GS1083 is active. The KPT consists of 2 target groups which are PFT households and BFT households. Sampling method: Cluster sampling with probability proportional to cluster size random sampling. This method is chosen as simple random sampling is impractical in a country the size of Vietnam. Hereunder it will be discussed how conservativeness and precision is warranted with that approach. Sizing of the sample:
a. As per methodology, at least 30 BFT and 30 PFT households for simple random sampling
b. Design effect35: Usually the design effect (D) of 1 to 3 is used. However, in case there is a low degree of homogeneity within the clusters (a district is a large administrative unit and consists of multiple communes(around 10 in each district), each commune contains many villages and important ER variables such as type of fuel, type and number of animal and bio-digester size vary considerably amongst households), the households are known ex-ante (all household data is recoded and stored in the project database) and the number of units taken from each cluster is small, a low D can be justified. A D of 1.5 is adopted by BP as the households to be surveyed are known. It is good practice to employ oversampling not only to compensate for any attrition, outliers or non-response associated with the sample but also for the reason that in the event the required reliability is not achieved additional sampling efforts would be required to determine the parameter value (CDM EB 65 Annex 2). Oversampling is employed by increasing the sample size by 10%.
c. The total HHs in PFT to be select will be: NPFT = 30 *1.5*1.1 ~ 50 NBFT = 50
The total sample size will be 50 per group, and 100 in total for the PFT.
Number of clusters According to Purnami et al (2011)36 a reliable way of cluster selection is with the following equation:
𝑘 ≈ (𝑛2)
1/2
35 For more details, please referred to the registered PDD 36 International Journal of Database Theory and Application Vol 4 No.1 March 2011. Available online:
http://www.sersc.org/journals/IJDTA/vol4_no1/3.pdf

40
Where k is the minimum sample of clusters and n the total population of clusters.
In the case of GS0183, there are 511 districts37, one district is one cluster. Therefore there are 511 clusters. The number of sampled cluster are:
𝑘 ≈ (5112 )
1/2≈ 16
Combining CMS and KPT The carbon monitoring survey of GS1083 also performs cluster sampling and selects 10 clusters in each climate zone (temperate and warm). The total number of clusters for the CMS is therefore 20. The KPT is executed in the same clusters as the CMS, which is conservative as it would mean surveying not in 16 but in 20 clusters. CMS and KPT Households per cluster (Sampling frame) The minimum number of households is 50 for the PFT and BFT. Since it is not possible to divide 50 households over 20 clusters the project participant increased the sample size to 60, or 3 per cluster (3 BFT and 3 PFT). This is conservative. In case of the CMS there are 17 households per cluster, the 3 PFT households will be randomly selected from those 17. Because these 17 households are randomly selected in each cluster, the randomly selection of these 3 households among them still satisfy the random selecting method. BFT households: As the baseline households are not known ex-ante and because there is no national database to sample from, the sample frame of the PFT is used for the BFT. The BFT household will be a matching neighboring household to the PFT household. The match, or equivalence, will be checked in the BFT questionnaire as below.
Table 19: Questionnaire for selecting a BFT HH Area of comparison Non-biogas HH (BFT) Biogas HH (PFT) Criteria for non-biogas HH Criteria
met (Y/N)?
No of member ± 2 to biogas HH Cooking stove type Similar to biogas HH used House appearance/ economic status
indicator for relative wealth
Type and quantity of animal
same as PFT HH ±30% (pigs, cow, buffalo)
Reason for considering this HH as equivalent to PFT HH
37 According to the project database.

41
Following the GS comments during issuance review, the following baseline scenarios were segregated: x Baseline scenario 1: LPG only households (22 household). Among them, 5 household are outlier
so they are removed from the ER estimation. x Baseline scenario 2: Biomass (fuel wood or agricultural residues) only households. There are 19
households. x Baseline scenario 3: Mix fuel (LPG and biomass) households. There are 19 households. Among
them, 1 household is outlier so it is removed from the ER estimation. 90/30 rule check The precision has been calculated and the 90/30 rule according to the GS methodology was checked. In case the 90/30 check of emission reduction of any baseline scenario was fail, it will be applied the 90% confidence rule. D.3.4. Usage survey design (US) The table below summarize the sampling plan for usage survey
Table 20: US Sample plan and objective
Sampling plan Sampling MPII
Sampling objective: The objective of the sampling effort is to obtain reliable data for the US survey;
Field Measurement Objectives and Data to be collected:
The survey will consist of household visit in random selected end-users to collect usage data;
Target Population and Sampling Frame: The sampling frame will be drawn from the database of each age group;
Sampling method (approach):
Simple random sampling, each observation is chosen randomly and entirely by chance, such that each observation has the same probability of being chosen.
Implementation: The US was executed in Dec 2013 and will be executed annually after the first verification38
Desired Precision/Expected Variance and Sample Size.
The minimum total sample size is 100, with at least 30 samples for project technologies of each age being credited. The applied methodology does not prescribe a desired precision. By surveying 210 households, BP ensured that the minimum requirements were easily met.
Procedures for Administering Data Collection and Minimizing Non-Sampling Errors:
Data was checked by the BP staff at the head office
The next table shows the number of households selected by age group and the population of units that belongs to that age group. Of each age group 35 units were selected randomly
38 According to Annex 5 of the methodology “Technologies and Practices to Displace Decentralized Thermal Energy
Consumption”

42
Table 21: Usage survey selection by age group
Year Age
group
Units included that are at least
in use for (years)
Period inclusive of both dates
Units built in that period (age group population)
Sample drawn from units built
(at random)
Numbers
in use
Usage rate
2012 0-1 0.5 01/01/12 31/12/12 13,455 35 34 97.1%
2011 1-2 1.5 01/01/11 31/12/11 13,455 35 31 88.6%
2010 2-3 2.5 01/01/10 31/12/10 23,149 35 31 88.6%
2009 3-4 3.5 01/01/09 31/12/09 22,216 35 31 88.6%
2008 4-5 4.5 01/01/08 31/12/08 15,835 35 32 91.4%
2007 5-6 4.5 01/01/07 31/12/07 14,398 35 31 88.6%
Weight average of usage rate 90.1% Among the units which are in operation, some of the bio-digester units may undergo periodically emptying and are therefore not in use for a number of days. Other causes of temporarily non-use of the digester are repairs. Therefore the days without biogas were taken into account in the effective usage rate which calculated as below39:
Where:
UFy,h = Effective cumulative usage rate for technologies in project scenario p in year y, based on cumulative adoption rate and drop off rate revealed by usage surveys (fraction) Uy,h = Cumulative usage rate for technologies in project scenario p in year y, based on cumulative adoption rate and drop off rate revealed by usage surveys (fraction) Upy,h = Uptime (having biogas)
The weighted average uptime was calculated according to the table below: Table 22: Weighted average uptime40
Age group Average number of days that units
are not in operation in survey sample (days/unit)
Number of not working days in group
Total number of days in group
0 - 1 0.029 383 455,770
1 - 2 0.829 11,148 417,105
2 - 3 2.200 50,928 717,619
3 - 4 2.143 47,606 688,696
4 - 5 2.229 35,289 506,720
5 - 6 1.886 27,151 446,338
39 For more detail, please refer to the MPI monitoring report (page 42). 40 For more detail, please refer to the tab “US_results” of the “MPII_Monitoring database” spreadsheet

43
Sum 172,505 3,232,248 Weighted average share of units in operation 94.66%
Therefore the effective cumulative usage rate is:
UFy,h = Uy,h * Upy,h = 85.32% 41 D.3.5. Household characteristics Roles of respondents in households The majority of biogas respondents are plant owners then his/her wife/husband, children and parents. There were 3 biogas households with responses from a brother/sister of the household owner. The graph below presents the relation of respondents to the head of the surveyed households in all surveyed biogas households, in biogas households with PFT.
Figure 10: Role of respondents in households
Gender and age of respondents 65% of the biogas respondents were male and 35% were female. Respondents are from 19 to 87 years old, in which the majority is from 40 to 60. The graph below shows the distribution of respondents by gender.
Figure 11: Gender of household respondents
41 Therefore the units in use for the ER calculation are 106,171*85.32% =90,589; or the units dropped out are 106,171-90,589 =
15,582 units.
67%�
68%�
25%�
23%�
3%�
5%�
4%�
3%�
0%� 10%� 20%� 30%� 40%� 50%� 60%� 70%� 80%� 90%� 100%�
All�biogas�users�
Biogas�users�with�PFT�
Role�of�respondents�in�households�
Plant�owner� wife/husband�of�plant�owner� Parent� Children� Other�
65%�
75%�
65%�
35%�
25%�
35%�
0%� 10%� 20%� 30%� 40%� 50%� 60%� 70%� 80%� 90%� 100%�
Non�biogas�users�with�BFT�
Biogas�user�with�PFT�
All�biogas�user�
Gender�of�respondents�
Male� Female�

44
Family size The family size is identified with number of people living in the surveyed households at the surveying time. The size of surveyed households ranged from 1 to 16 members. There were 97% of surveyed households (biogas and non-biogas users) with from 1 to 7 members living in the house. On average, each biogas household had 4.47 people. This number in biogas households with PFT and non-biogas households were 4.45 and 4.37
Size of bio-digesters The average value of 340 surveyed bio-digesters and 106,171 bio-digesters in the period 2007-2013 from database was 10.26m3 and 11.26 m3 respectively.
Fuel type The surveyed households use many types of fuel such as firewood, coal/honeycomb coal, charcoal, LPG, agriculture residues and biogas for their preparation of human food (including boiling water), animal feeds and of other businesses (as wine, tofu,etc.). Firewood is most often seen and being used as main fuel for cooking. There was no HHs using kerosene for these purposes.
SECTION E. Calculation of emission reductions or GHG removals by sinks The CMS and KPT survey were conducted with the representative samples of end users in the project scenario and the baseline scenario. These selection follow the random method as well as addressed the abnormal situation, seasonality issues therefore the results are representative for the whole monitoring period.
E.1. Calculation of baseline emissions or baseline net GHG removals by sinks E.1.1. Ex-post Baseline emission from thermal energy demand
Table 23: NCV of fuels
Fueli NCVi
(TJ/Gg)
LPG 47.3
Firewood 15.6
Agriculture residues 11.6
In absence of national relevant emission factors the default emission factors from the IPCC 2006 Guidelines for National Greenhouse Gas Inventories, volume 2: Energy, Chapter 1 are used, see the next table.
Table 24: CO2, CH4 and N2O emission factors
Fuel i EFCO2, (kg/TJ)
EFCH4,
(kg/TJ) EFN20,
(kg/TJ)

45
Firewood 112000 1224 11.25
Agriculture residues 100000 2210 9.7
The fNRB. is estimated to be 67%, the NRB assessment can be found in Annex 3 of the registered PDD. The fNRB. value is applicable to CO2 emissions from firewood, agricultural residues and charcoal consumption and production. Methane and nitrous oxide emission is 100% non-renewable by definition. The baseline emission is the baseline thermal energy consumption multiplied by emission factors and the global warming potential of each GWP. The GWP applied for the first commitment period (before 2013) were taken from the Second Assessment Report of the IPCC, 21 and 310 for CH4 and N20 respectively. For the second commitment period (from 01/01/2013), the GWP are 25 and 298 for CH4 and N20 respectively.42 The ex-post baseline emissions will be calculated as follow:
𝑩𝑬𝒕𝒉,𝒉 = ∑(𝒇𝑵𝑹𝑩,𝒚 𝑭𝒊,𝒃𝒍,𝒉 × 𝑵𝑪𝑽𝒊 × 𝑬𝑭𝑪𝑶𝟐,𝒊 +𝒊
𝑭𝒊,𝒃𝒍,𝒉 × 𝑵𝑪𝑽𝒊 × 𝑬𝑭𝒏𝒐𝒏𝑪𝑶𝟐,𝒊)
Where
BEth,h
fNRB,y
=
=
The total baseline emissions from the thermal energy demand of one
household (tCO2e/year)
Fraction of biomass during year y that is non-renewable (100% for fossil fuels)
Fi,bl,h = Quantity of fuel i consumed in the baseline during year y (kg/household/year)
Total amount of fuel type i in the baseline scenario (kg/year) of one household
NCVi = Net Calorific Value of fuel type i (TJ/ton of fuel)
EFCO2,i
EFnonCO2,i
=
=
The CO2 emission factor per unit of energy of fuel i (tCO2e/TJ)
The nonCO2 emission factor per unit of energy of fuel i (tCO2e/TJ)
Emission reduction with baseline scenario 1: For 2012 vintage:43
BEth,h,LPG,(2012 vintage) = 0.16 (tCO2e/year) For 2013 vintage44:
BEth,h, ,LPG (2013 vintage) = 0.16 (tCO2e/year)
Emission reduction with baseline scenario 2: For 2012 vintage:45
BEth,h,Biomass,(2012 vintage) = 6.56 (tCO2e/year) For 2013 vintage46:
BEth,h, ,Biomass (2013 vintage) = 6.92 (tCO2e/year)
42 http://www.ipcc.ch/publications_and_data/ar4/wg1/en/ch2s2-10-2.html 43 Details calculation in cell V68, sheet “BFT_LPG” of the “MPII_Monitoring database_2012 vintage” spreadsheet. 44 Details calculation in cell V68, sheet “BFT_LPG” of the “MPII_Monitoring database_2013 vintage” spreadsheet 45 Details calculation in cell V68, sheet “BFT_Biomass” of the “MPII_Monitoring database_2012 vintage” spreadsheet. 46 Details calculation in cell V68, sheet “BFT_Biomass” of the “MPII_Monitoring database_2013 vintage” spreadsheet

46
Emission reduction with baseline scenario 3: For 2012 vintage:47
BEth,h,Mix,(2012 vintage) = 4.15 (tCO2e/year) For 2013 vintage48:
BEth,h, ,Mix (2013 vintage) = 4.44 (tCO2e/year)
Emission reduction for fuel:
The weighted average emission reduction for fuel is:
For 2012 vintage:49
BEth,h,Mix,(2012 vintage) = 3.14 (tCO2e/year) For 2013 vintage50:
BEth,h, ,Mix (2013 vintage) = 3.33 (tCO2e/year)
E.1.2. Ex-post Estimation of baseline emissions from AWMS The following equation is applied to estimate the baseline emissions from animal waste management systems:
Where:
BEawms,h The baseline emissions from handling of animal waste in premise h (tCO2e/year) GWPCH4 Global warming potential of methane (tCO2e per tCH4). The GWP applied for the
first commitment period (before 2013) were taken from the Second Assessment Report of the IPCC, 21 and 310 for CH4 and N20 respectively. For the second commitment period, the GWP are 25 and 298 for CH4 and N20 respectively
N(T),h The number of animals of livestock species per category T51 EFawms(T) Emission factor for the defined livestock population category T, (ton CH4 per
head per yr). The relevant Default methane emission factor for livestock for default animal waste methane emission factors by temperature and region can be found in tables 10.14, 10.15 & 10.16 in Chapter 10: Emissions from Livestock and Manure Management, Volume 4 - AGRICULTURE, FORESTRY AND OTHER LAND USE, 2006 IPCC Guidelines for National Greenhouse Gas Inventories.
The IPCC lists for each regions default values for methane emissions from AWMS at various average temperatures in chapter 10 volume 4 of the IPCC 2006 guidelines. As Vietnam has more than 1 climate zones, a determination of the IPCC default value for each climate zone is required. Climate date for each
47 Details calculation in cell V68, sheet “BFT_Mix” of the “MPII_Monitoring database_2012 vintage” spreadsheet. 48 Details calculation in cell V68, sheet “BFT_Mix” of the “MPII_Monitoring database_2013 vintage” spreadsheet 49 Details calculation in cell G2, sheet “ER” of the “MPII_Monitoring database_2012 vintage” spreadsheet. 50 Details calculation in cell G2, sheet “ER” of the “MPII_Monitoring database_2013 vintage” spreadsheet 51 Excluding households which treat the waste of more than 5 pigs/m3 digester volume. These households are not included in
the calculation of baseline emissions as per registered PDD.

47
province has been collected and for each province a separate IPCC default factor is obtained. This approach is allows for maximum precision. Once the average annual temperature was determined for each province and the respective IPCC default value was obtained; the average weighted emission factor could be determined in Vietnam.
Table 25: Methane emission factors by climate zone
Animal Zone A: Temperate Zone B: Warm Pig 5.00 7.00
Buffalo 2.00 2.00
Dairy cow 23.00 31.00
Cattle 1.00 1.00
The table shows that the EF for pig and dairy cows are temperature dependent, the EF of the other animals are the same for the temperature ranges observed in Vietnam. The next table shows the calculated BE from AWMS and the animal population obtained from the CMS.
Table 26: Ex-post BE AWMS emission in the climate zone A: Temperate52
Animal N(T),h EFawms(T)
T # kgCH4/head/year
Pig 24.94 5.00
Buffalo 0.05 2.00
Dairy cow 0 23.00
Cattle 0.23 1.00
BEAWMS, temperate, (2012 vintage)
2.63
BEAWMS, temperate, (2013 vintage) 3.13
And the climate zone warm: Table 27: Ex-post BE AWMS emission in the climate zone B: Warm53
Animal N(T),h EFawms(T)
T # kgCH4/head/year
Pig 28.18 7.00
Buffalo 0.01 2.00
52 Details calculation in cell G10, sheet “ER_AWMS” of the “MPII_Monitoring database_2012 vintage” and the
“MPII_Monitoring database_2013 vintage” spreadsheets, respectively. 53 Details calculation in cell Q10, sheet “ER_AWMS” of the “MPII_Monitoring database_2012 vintage” and the
“MPII_Monitoring database_2013 vintage” spreadsheets, respectively.

48
Dairy cow 0.00 31.00
Cattle 1.98 1.00
BEAWMS, warm, (2012 vintage)
4.18
BEAWMS, warm, (2013 vintage) 4.98
The average weighted annual emissions from AWMS are54: BEAWMS, (2012 vintage) = 2.98 tCO2 per household. BEAWMS, (2013 vintage) = 3.55 tCO2 per household.
E.2. Calculation of project emissions or actual net GHG removals by sinks Project Emissions from Thermal Energy demand Not all fuels will be replaced by biogas. The fuels that people continue to use in the project scenario will be obtained from the monitoring surveys. The next table shows the estimated remaining fuel consumptions sourced from KPT survey for MPII.
Table 28: Fuel consumption of project HHs55
Fuel i Average per household (kg/year)
Firewood 277.40
Agriculture residues 101.23
LPG 5.23
Similarly to the baseline emission for thermal energy demand, the ex-post baseline emissions will be calculated as follow: For 2012 vintage: 56
PEth,h,(2012 vintage) = 0.52 (tCO2e/year) For 2013 vintage57:
PEth,h,(2013 vintage) = 0.56 (tCO2e/year)
E.3. Calculation of leakage The project emissions involve emissions from the bio-digester, which include physical leakage and incomplete combustion of biogas, as well as emissions from the animal waste not treated in the bio-digester and emissions from bio-slurry storage.
54 Details calculation in cell D70, sheet “ER_AWMS” of the “MPII_Monitoring database_2012 vintage” and the
“MPII_Monitoring database_2013 vintage” spreadsheets, respectively. 55 Details calculation in row 7 of tab “SD” of the “MPII_Monitoring database” spreadsheet 56 Details calculation in sheet “ER_fuel” of the “MPII_Monitoring database_2012 vintage”. 57 Details calculation in sheet “ER_fuel” of the “MPII_Monitoring database_2013 vintage”.

49
The EFAWMS in the project scenario has been calculated using the IPCC Tier 2 approach using default values for the maximum methane potential (Bo), volatile solids excretion (VS) and methane density and the manure management category bio-digester. The manure management categories (MS) for each climate zone and applicable MCF are shown in the next two tables, where MS(P,S,k) is the fraction of manure not fed into the biogas plants, which are the sum of manure management systems which are not biogas plant and MS(T,S,k) is the MS system biogas plant. The MS is simply calculated by dividing the amount of manure fed in a system by the total amount of manure, i.e. if 2 kilo is put in a slurry system out of the 100 kilo available daily, then the MS slurry is 2% (2/100). Another example, MS pasture is the fraction of time that the animals are in the field, i.e. if this is 6 hours/day, then it is assumed that 25% (6/24) of manure is left in the field. Thus, in this case, if the amount of manure measured is 100 kilo/day, then this amount measured comprises 75% (or 18 hours) of the total as 25% (6 hours) cannot be measured as it is excreted in the field. The total amount of manure is in that case: 1+(25%/75%)*100 = 133 kilo/day. E.3.1. Physical leakage and incomplete combustion of biogas The project emissions from the bio-digester system has been calculated as below:
𝑃𝐸𝑎𝑤𝑚𝑠,ℎ,𝑦 = 𝐺𝑊𝑃𝐶𝐻4
× ∑(𝑁(𝑇),ℎ,𝑦 × 𝐸𝐹𝑎𝑤𝑚𝑠(𝑇)). 𝑃𝐿𝑦
+ ∑(𝐿𝐶(𝑇),ℎ,𝑦 × 𝐸𝐹𝑎𝑤𝑚𝑠(𝑇)) × (1 − 𝜂𝑏𝑖𝑜𝑔𝑎𝑠𝑠𝑡𝑜𝑣𝑒)(1 − 𝑃𝐿𝑦) 𝑃𝐸𝑎𝑤𝑚𝑠,ℎ,𝑦 = 𝐺𝑊𝑃𝐶𝐻4
× ∑(𝑁(𝑇),ℎ,𝑦 × 𝐸𝐹𝑎𝑤𝑚𝑠(𝑇)). 𝑃𝐿𝑦 + ∑(𝐿𝐶(𝑇),ℎ,𝑦 × 𝐸𝐹𝑎𝑤𝑚𝑠(𝑇)) × (1 − 𝜂𝑏𝑖𝑜𝑔𝑎𝑠𝑠𝑡𝑜𝑣𝑒)(1 − 𝑃𝐿𝑦)
Where:
PEawms,h,y = Mean emission per household h (tCO2e/year)
N(T),h,y
= Number of animals of livestock category T in year y in premise h
EFawmsT
= Emission factor for the defined livestock category T, (ton CH4 per animal per year). Estimated using the IPCC TIER 2 approach.
PLy = Physical leakage of the biodigester in year y (10 %)58
EFT = Annual CO2 emission factor for livestock category T, (tCO2e animal-1
yr-1)
GWPCH4 = Global Warming Potential (GWP) of methane (tCO2eq per tCH4): 21 and 25 for the first and second commitment period, respectively.
ηbiogasstove = Combustion efficiency of the biogas stove
The EFAWMS will be calculated using the IPCC tier 2 approach:
The following formula is used from the Voluntary Gold Standard Biodigester Methodology to estimate the
animal waste management emissions.
58 Default value of the applied methodology is adopted (TPDDTEC page 52)

50
𝑬𝑭𝑨𝑾𝑴𝑺(𝑻) = (𝑽𝑺(𝑻) × 𝟑𝟔𝟓) × ⌈𝑩𝒐(𝑻) × 𝑫𝑪𝑯𝟒 × ∑ 𝑴𝑪𝑭𝑩𝑳,𝒌𝟏𝟎𝟎 × 𝑴𝑺(𝑻,𝐒,𝒌)
𝒌⌉ 𝑬𝑭𝑨𝑾𝑴𝑺(𝑻)
= (𝑽𝑺(𝑻) × 𝟑𝟔𝟓) × ⌈𝑩𝒐(𝑻) × 𝑫𝑪𝑯𝟒 × ∑ 𝑴𝑪𝑭𝑩𝑳,𝒌𝟏𝟎𝟎 × 𝑴𝑺(𝑻,𝐒,𝒌)
𝒌⌉
Where:
EFAWMS(T) = CH4 emission factor for livestock category T in the project scenario, (tCH4.animal-1)
VS(T) = Daily volatile solid excreted for livestock category T, (kg VS per animal.day -1)
365 = Basis for calculating annual VS production, (days yr-1)
Bo(T) = Maximum methane producing capacity for manure produced by livestock category
T,( m3 CH4 kg-1 of VS)
DCH4 = Conversion factor of m3 methane to kg methane, (0,067 kg/m3)
MCF(BL,k) = Methane conversion factors for the animal waste handling system in the baseline
situation, bl, by climate zone k, %
MS(T,S,k) = Fraction of livestock category T’s manure treated in the animal waste management system S, in climate region k, (dimensionless)
For 2012 vintage: Table 29: Share of manure management systems in the project scenario in climate zone: Temperate59
Manure management
system
Pig Buffalo Cattle MCF factor by system from
IPCC guidelines Volume 4,
chapter 10 at 23 degrees
Bio digester 97.77% 25.00% 60.87% 10.0%
Anaerobic lagoon 0.00% 0.00% 0.00% 79.0%
Slurry/liquid system 0.00% 0.00% 0.00% 55.0%
Solid storage 0.16% 50.00% 8.70% 4.0%
Composting 1.54% 25.00% 26.09% 1.0%
Daily spread 0.09% 0.00% 0.00% 0.5%
Drying in the sun 0.00% 0.00% 0.00% 0.0%
Fish pond 0.00% 0.00% 0.00% 0.0%
Other 0.44% 0.00% 4.35% 1.0%
59 Details calculation in tab “ER_AWMS” of the “MPII_Monitoring database_2012 vintage” spreadsheet
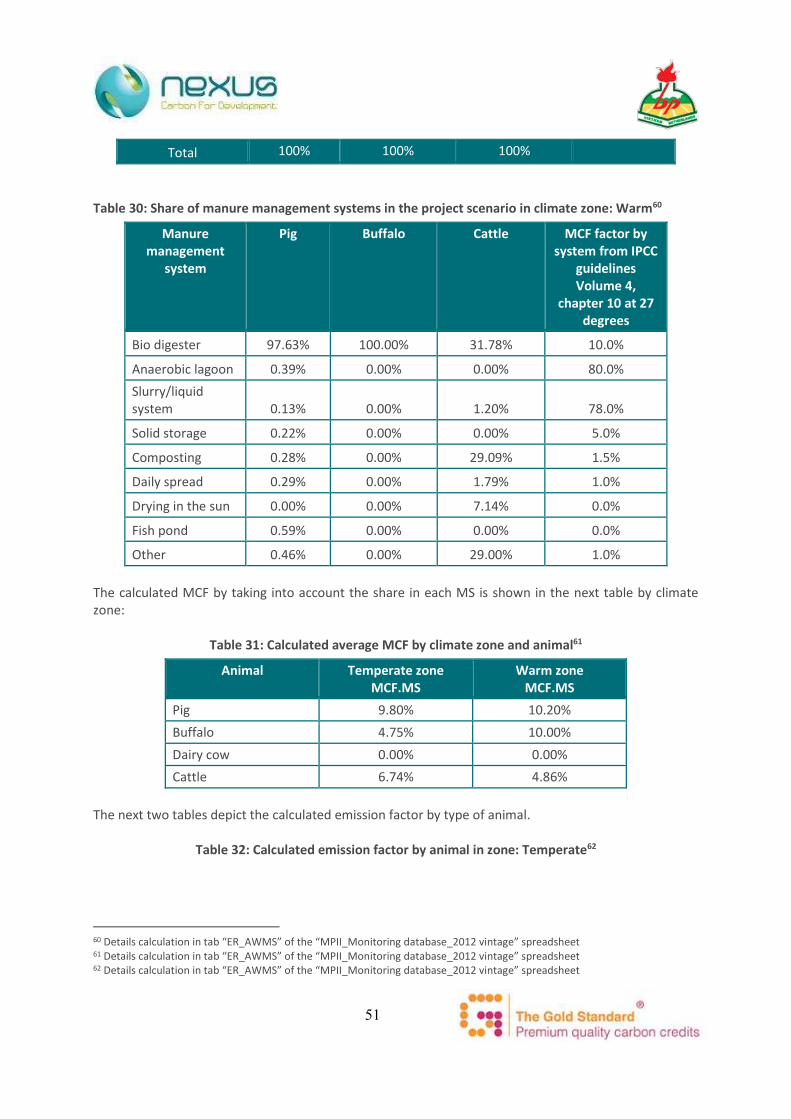
51
Total 100% 100% 100%
Table 30: Share of manure management systems in the project scenario in climate zone: Warm60
Manure management
system
Pig Buffalo Cattle MCF factor by system from IPCC
guidelines Volume 4,
chapter 10 at 27 degrees
Bio digester 97.63% 100.00% 31.78% 10.0%
Anaerobic lagoon 0.39% 0.00% 0.00% 80.0%
Slurry/liquid system 0.13% 0.00% 1.20% 78.0%
Solid storage 0.22% 0.00% 0.00% 5.0%
Composting 0.28% 0.00% 29.09% 1.5%
Daily spread 0.29% 0.00% 1.79% 1.0%
Drying in the sun 0.00% 0.00% 7.14% 0.0%
Fish pond 0.59% 0.00% 0.00% 0.0%
Other 0.46% 0.00% 29.00% 1.0%
The calculated MCF by taking into account the share in each MS is shown in the next table by climate zone:
Table 31: Calculated average MCF by climate zone and animal61
Animal Temperate zone MCF.MS
Warm zone MCF.MS
Pig 9.80% 10.20%
Buffalo 4.75% 10.00%
Dairy cow 0.00% 0.00%
Cattle 6.74% 4.86%
The next two tables depict the calculated emission factor by type of animal.
Table 32: Calculated emission factor by animal in zone: Temperate62
60 Details calculation in tab “ER_AWMS” of the “MPII_Monitoring database_2012 vintage” spreadsheet 61 Details calculation in tab “ER_AWMS” of the “MPII_Monitoring database_2012 vintage” spreadsheet 62 Details calculation in tab “ER_AWMS” of the “MPII_Monitoring database_2012 vintage” spreadsheet
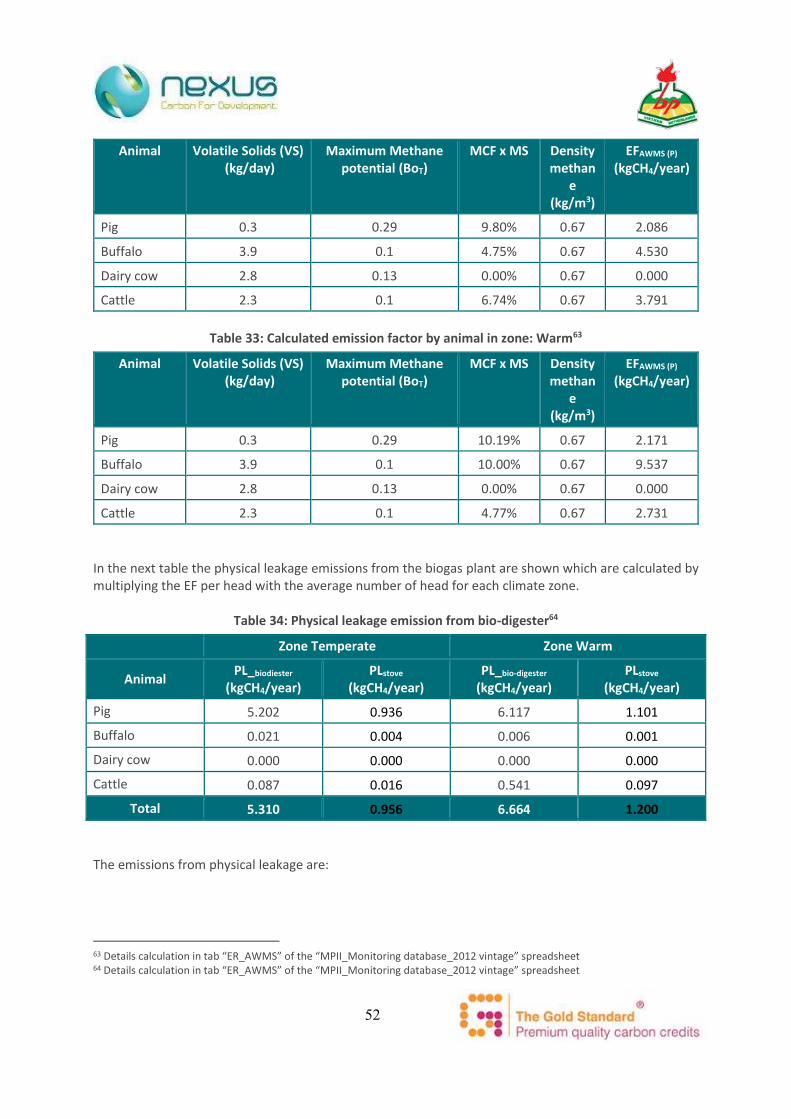
52
Animal Volatile Solids (VS) (kg/day)
Maximum Methane potential (BoT)
MCF x MS Density methan
e (kg/m3)
EFAWMS (P) (kgCH4/year)
Pig 0.3 0.29 9.80% 0.67 2.086
Buffalo 3.9 0.1 4.75% 0.67 4.530
Dairy cow 2.8 0.13 0.00% 0.67 0.000
Cattle 2.3 0.1 6.74% 0.67 3.791
Table 33: Calculated emission factor by animal in zone: Warm63
Animal Volatile Solids (VS) (kg/day)
Maximum Methane potential (BoT)
MCF x MS Density methan
e (kg/m3)
EFAWMS (P) (kgCH4/year)
Pig 0.3 0.29 10.19% 0.67 2.171
Buffalo 3.9 0.1 10.00% 0.67 9.537
Dairy cow 2.8 0.13 0.00% 0.67 0.000
Cattle 2.3 0.1 4.77% 0.67 2.731
In the next table the physical leakage emissions from the biogas plant are shown which are calculated by multiplying the EF per head with the average number of head for each climate zone.
Table 34: Physical leakage emission from bio-digester64
Zone Temperate Zone Warm
Animal PL_biodiester
(kgCH4/year) PLstove
(kgCH4/year) PL_bio-digester
(kgCH4/year) PLstove
(kgCH4/year)
Pig 5.202 0.936 6.117 1.101
Buffalo 0.021 0.004 0.006 0.001
Dairy cow 0.000 0.000 0.000 0.000
Cattle 0.087 0.016 0.541 0.097
Total 5.310 0.956 6.664 1.200 The emissions from physical leakage are:
63 Details calculation in tab “ER_AWMS” of the “MPII_Monitoring database_2012 vintage” spreadsheet 64 Details calculation in tab “ER_AWMS” of the “MPII_Monitoring database_2012 vintage” spreadsheet

53
Zone Classification Units LE/unit (tCO2e/unit)
Total LE (tCO2e)
A Temperate 81,805 0.132 10,764
B Warm 24,366 0.165 4,024
Weighted average PEawms,h,y 2012 vintage tCO2e/unit 0.14
For 2013 vintage65: Similarly, PEawms,h,y 2013 vintage = 0.17 (tCO2e/unit)
E.3.1. Emissions from digestate (bio-slurry) Biogas households were surveyed about their usage of bio-slurry. 183 respondents were not using bio-slurry, 20 are using it partially and 137 respondents are using the bio-slurry fully. Amongst 137 responses on full usage of bio-slurry, 106 respondents used bio-slurry directly, 21 stored it before use and the remaining 10 respondents used bio-slurry partly directly and partly by storing before use.
Figure 12. Usage of bio-slurry
The following leakage emission source is accounted for in this section: CH4 emissions from the anaerobic decay of the residual organic content of digestate subjected to anaerobic storage. Digestate typically has low biodegradability because easily biodegradable organic matter has been converted in the anaerobic digester and therefore the biodegradability of digestate is much lower than manure66. This emission source is determined through the following steps:
1. Estimation of the total amount of VS entering the bio-digester
65 Details calculation is on cell D71, sheet “ER_AWMS” of the “MPII_Monitoring database_2013 vintage” spreadsheet 66 http://cdm.unfccc.int/Panels/meth/meeting/11/051/mp51_an13.pdf
183�
106�
21� 10� 17�2� 1�
0�20�40�60�80�100�120�140�160�180�200�
HHs�not�use�bioslurry�at�
all�
HHs�use�all�bioslurry�directly�
HHs�store�all�bioslurry�before�use�
HHs�use�all�bioslurry�
directly�and�store�before�
use�
HH�use�part�of�bioslurry�directy�and�discharge�
HH�use�part�of�bioslurry�for�store�before�use�
and�discharge�
HH�use�part�of�slurry�
directly,�store�before�use�
and�discharve�
Usage�of�bioslurry�

54
2. Assessment of remaining VS content of digestate
3. Assessment of methane potential of bio-slurry
4. MCF of the digestate management systems (DMS)
5. Calculation of PEdig using the information obtained in the previous steps
Estimation of the total amount of VS entering the bio-digester The total amount of VS entering the biogas plant depends on the type of animal and the share of manure that is fed into the biogas plant. The share of manure fed into the biogas plant can be found in tables below, and is calculated as:
MSfed in digester,T = 1 - MSnot fed,T
Where, MSfed in digester is the share of manure fed into the digester and MSno fed the share not fed into the digester of animal category T. The next tables depict the total amount of VS that enters the average bio-digester which is calculated by multiplying the amount of VS excreted by the average number of animals and the MSfed in digester into the bio-digester by climate zone.
Table 35: Daily VS production of the average bio-digester in climate zone temperate67
Animal T VS excretion
kgVS/hd/day
Head/average bio-digester
Total amount of VS excreted
kgVS.day-1
MSfed in digester
Share fed into bio-digester
Total VS entering the bio-digester kgVS.day-1
A B AxB =C D CxD
Pig 0.30 24.94 7.48 97.8% 7.32
Buffalo 3.90 0.05 0.18 25.0% 0.05
Dairy cow 2.80 0.00 0.00 0.0% 0.00
Cattle 2.30 0.23 0.53 60.9% 0.32
Sum 7.68
Table 36: Daily VS production of the average bio-digester in climate zone warm68
Animal T VS excretion
kgVS/hd/day
Head/average bio-digester
Total amount of VS excreted
kgVS.day-1
MSfed in digester
Share fed into bio-digester
Total VS entering the bio-digester kgVS.day-1
A B AxB =C D CxD
Pig 0.30 28.18 8.45 97.6% 8.25
67 Details calculation in tab “PE_Bioslurry” of the “MPII_Monitoring database_2012 vintage” spreadsheet 68 Details calculation in tab “PE_Bioslurry” of the “MPII_Monitoring database_2012 vintage” spreadsheet

55
Buffalo 3.90 0.01 0.02 100.0% 0.02
Dairy cow 2.80 0.00 0.00 0.0% 0.00
Cattle 2.30 1.98 4.56 31.8% 1.45
Sum 9.72 Assessment of remaining VS content of digestate
During anaerobic digestion VS is converted into biogas. The efficiency of that process determines how much VS remains in bio-slurry. The efficiency depends on may factors and are difficult to estimate, such as retention time, dilution ratio, temperature C/N ratio etc. According to the Biogas Handbook (2008) of Big East, the digestion efficiency of agricultural biogas plants is typically in the range 50-60%69. This means that digestate contains 40-50% of the initial organic dry matter, primarily as fibers. With other words, it can be assumed that around 55% of the initial concentration of VS is converted into biogas and that around 45% remains in digestate. Or with other words, the MSdigester is 55% and the MSdigestate is 45% of total VS entering the biogas plant. The remaining VS however has a different composition than VS in manure, it is more fibrous and therefore it will more slowly degrade under continued anaerobic conditions. Some compounds, could even be recalcitrant to further anaerobic biodegradation. The next table shows the calculated amount of VS that leaves the average bio-digester per day:
Table 37: Average amount of VS in digester effluent by zone70
Zone (A) Total VS entering the bio-
digester kgVS.day-1
Digester efficiency (B) Total VS destroyed in the
bio-digester kgVS.day-1
A-B Total VS in bio-slurry kgVS.day-1
Temperate 7.68 45% 3.46 4.23
Warm 9.72 45% 4.38 5.35
Assessment of the methane potential of digestate As the nature of VS has changed during anaerobic conversion, the default methane potential (Bo) value is no longer applicable to VS in digestate. According to EB66 Annex 32 the remaining fraction of the original methane potential is 20% for the liquid digestate of conventional digesters. The effluent from bio-digesters in Vietnam is liquid and therefore this fraction was applied. The B0 of digestate is calculated with the following equation:
Bo,dig,T = Fww,CH4,default × B0,T
Where:
69 P55 http://www.lemvigbiogas.com/BiogasHandbook.pdf 70 Details calculation in tab “PE_Bioslurry” of the “MPII_Monitoring database_2012 vintage” spreadsheet

56
Bo,dig,T = Methane potential of digestate from animal type T manure Fww,CH4, = Default factor representing the remaining CH4 production capacity of
liquid digestate B0,T = Methane potential of manure from animal type T
With this equation it is possible to calculate for each animal the remaining methane potential.
Table 38: Calculated methane potential of digestate from manure by animal type71
Animal T Fww,CH4,default 72 Bo(T)
(m3CH4/kgVS)* Bo,dig
(m3CH4/kgVS)
Pig 20% 0.290 0.058
Buffalo 20% 0.100 0.02
Dairy cow 20% 0.130 0.026
Cattle 20% 0.100 0.02
However, since farmers often have a mix of animals it is necessary to calculate the average methane potential of digestate from mixed sources and that average has to be weighted as the population of pigs is, for example, much larger than the other animals, relevant calculations can be found in the monitoring database. The following table shows the weighted averaged methane potential for digestate by climate zone
Table 39: Weighed average methane potential of digestate by zone73
Zone Weighed B0,dig
(m3CH4/kgVS) Temperate 0.058
Warm 0.055
All calculations can be found in the excel workbook. MCF of the digestate management systems (DMS) The monitoring survey investigated the storage systems of slurry by the households. The results are shown in the table below:
Table 40: Digestate management systems by type and zone74
DMS Temperate (%) Warm (%) Flow to farm yield 33.32% 29.72%
Flow into sufficient size storage area 0.00% 0.00%
71 Details calculation in tab “PE_Bioslurry” of the “MPII_Monitoring database_2012 vintage” spreadsheet 72 According to EB66 Annex 32 page 1 73 Details calculation in tab “PE_Bioslurry” of the “MPII_Monitoring database_2012 vintage” spreadsheet 74 Details calculation in tab “PE_Bioslurry” of the “MPII_Monitoring database_2012 vintage” spreadsheet

57
Stored dry with hut 0.00% 0.00%
flow into large pond 0.00% 0.00%
Flow into river, channel 53.41% 61.18%
Stored under dry conditions with other organic matter 8.94% 7.35%
Other 4.33% 1.75%
Sum 100% 100.0% Each DMS has a different methane conversion factor (MFC). MFCs are sourced from the IPCC 2006 guidelines, volume 4 chapter 10, for each AWMS that is similar to the DMS.
Table 41: Applicable MCF values to the DMS75
DMS Applicable IPCC MS category
Applicable MCF zone temperate
(23◦C)
Applicable MCF zone
warm (27◦C)
Flow to farm yield daily spread 0.5% 1.0%
Flow into sufficient size storage area slurry 55.0% 78.0%
Stored dry with hut solid storage 4.0% 5.0%
flow into large pond other 1.0% 1.0%
Flow into river, channel other 1.0% 1.0%
Stored under dry conditions with other organic matter solid storage 4.0% 5.0%
Other other 1.0% 1.0%
The sum of the MCF times the %DMS is the average MCF. The summations are presented in the next table:
Table 42: Average MCF by zone76
Zone ∑DMSxMCF Temperate 1.10%
Warm 1.29%
Calculation of PEdig using the information obtained in the previous steps Fww and Bo,dig is a default factor and applicable to the remaining VS in the digestate, see equation 6 of EB 66 Annex 32. However, as it is now known what the COD concentration of liquid digestate is, the proxy VS remaining in bio-slurry is used. The next table shows the calculated emissions from digestate by each zone using the IPCC tier 2 approach. The emissions are calculated using equation 16 of the applied GS methodology as per registered PDD.
75 Details calculation in tab “PE_Bioslurry” of the “MPII_Monitoring database_2012 vintage” spreadsheet 76 Details calculation in tab “PE_Bioslurry” of the “MPII_Monitoring database_2012 vintage” spreadsheet

58
𝑬𝑭𝑨𝑾𝑴𝑺(𝑻) = (𝑽𝑺(𝑻) × 𝟑𝟔𝟓) × ⌈𝑩𝒐(𝑻) × 𝑫𝑪𝑯𝟒 × ∑ 𝑴𝑪𝑭𝑩𝑳,𝒌𝟏𝟎𝟎 × 𝑴𝑺(𝑻,𝐒,𝒌)
𝒌⌉ 𝑬𝑭𝑨𝑾𝑴𝑺(𝑻)
= (𝑽𝑺(𝑻) × 𝟑𝟔𝟓) × ⌈𝑩𝒐(𝑻) × 𝑫𝑪𝑯𝟒 × ∑ 𝑴𝑪𝑭𝑩𝑳,𝒌𝟏𝟎𝟎 × 𝑴𝑺(𝑻,𝐒,𝒌)
𝒌⌉
Table 43: Calculated emissions from digestate by zone
Zone Total VS in bio-slurry kgVS.day-1
B0,dig (m3CH4/kgVS)
∑DMSxMCF
DCH4
(kg/m3CH4)
Digester emissions
(tCO2/year/hh) (2012 vintage) 77
Digester emissions
(tCO2/year/hh) (2013 vintage) 78
Temperate 3.46 0.058 0.011 0.67 0.011 0.013
Warm 4.38 0.055 0.013 0.67 0.016 0.019
The weighted emissions from digestate are, taking into account the proportion of units built in each zone, shown in the next table:
Table 44: Weighted average emissions from digestate79
No of units in zone Temperate 81805
Warm 24366
Average LE Bio-slurry (tCO2e/year/hh) (2012 vintage) 0.012
Average LE Bio-slurry (tCO2e/year/hh) (2013 vintage) 0.015
E.4. Summary of calculation of emission reductions or net anthropogenic GHG removals by sinks The next table shows the ex-ante estimate of the emission reductions for each biogas unit: For 2012 vintage
Table 45: Average annual emission reductions for 2012 vintage80 Emission source BE
(tCO2e/h/year) PE
(tCO2e/h/year) ER
(tCO2e/h/year)
Fuel use 3.62 0.52 3.10
AWMS 2.98 0.12 2.86
Digestate NA 0.012 -0.012
77 Detail calculation are in cell G51 and O51, tab “PE_Bioslurry” of the “MPII_Monitoring database_2012 vintage” 78 Detail calculation are in cell G51 and O51, tab “PE_Bioslurry” of the “MPII_Monitoring database_2013 vintage” 79 Detail calculation is in cell L7, tab “PE_Bioslurry” of the “MPII_Monitoring database_2012 vintage” and “MPII_Monitoring
database_2013 vintage” spreadsheet, respectively. 80 Detail calculation is in cell G5, tab “ER” of the “MPII_Monitoring database_2012 vintage” spreadsheet

59
Sum 6.61 0.65 5.95 For 2013 vintage
Table 46: Average annual emission reductions for 2013 vintage81
Emission source BE (tCO2e/h/year)
PE (tCO2e/h/year)
ER (tCO2e/h/year)
Fuel use 3.83 0.56 3.28
AWMS 3.55 0.14 3.41
Digestate 0.00 0.015 -0.015
Sum 7.38 0.72 6.67 The cumulative ex-post emission reductions are calculated with the following calculation:
𝑬𝑹𝒚,𝒉 = 𝑼𝒚,𝒉 × (𝑩𝑬𝒚,𝒉−𝑷𝑬𝒚,𝒉)𝑬𝑹𝒚,𝒉 = 𝑼𝒚,𝒉 × (𝑩𝑬𝒚,𝒉−𝑷𝑬𝒚,𝒉) x Np,y Where:
𝐸𝑅𝑦,ℎ𝐸𝑅𝑦,ℎ = Annual average emission reductions in year y
𝑈𝑦,ℎ𝑈𝑦,ℎ = Cumulative usage rate for technologies in project scenario p in year y, based on cumulative adoption rate and drop off rate revealed by usage surveys (fraction)
𝐵𝐸𝑦,ℎ𝐵𝐸𝑦,ℎ = Annual average baseline emissions per household in year y
𝑃𝐸𝑦,ℎ𝑃𝐸𝑦,ℎ = Annual average project activity emissions per household in year y
Np,y = Total number of biogas units commissioned as of year y
The calculated usage rate, Uy,h is 90.13%. However the effective usage rate UFy,h = 85.32% was applied.82 The next table shows the ER summary.
81 Detail calculation is in cell G5, tab “ER” of the “MPII_Monitoring database_2013 vintage” spreadsheet 82 See explanation in Section 3.4 above

Table 47: Emission reductions in the m
onitoring period83
Date (inclusive of both dates)
Installation in
month
Cumulativ
e units ER fuel
ER AWM
S PE Bio slurry
ER Em
ission reductions
Percentage in operation
ER/month
# #
tCO2/year
tCO2/year
tCO2/year
tCO2/ye
ar tCO
2/mon
th %
tCO
2 1-Jan-12
31-Jan-12 191
89,244 3.14
2.84 0.01
5.97 0.5
85.32%
37,818
1-Feb-12 29-Feb-12
436 89,680
3.14 2.84
0.01 5.97
0.5 85.32%
37,900
1-Mar-12
31-Mar-12
1181 90,861
3.14 2.84
0.01 5.97
0.5 85.32%
38,085
1-Apr-12
30-Apr-12
1701 92,562
3.14 2.84
0.01 5.97
0.5 85.32%
38,586
1-May-12
31-May-12
2183 94,745
3.14 2.84
0.01 5.97
0.5 85.32%
39,309
1-Jun-12 30-Jun-12
1556 96,301
3.14 2.84
0.01 5.97
0.5 85.32%
40,236
1-Jul-12 31-Jul-12
1187 97,488
3.14 2.84
0.01 5.97
0.5 85.32%
40,896
1-Aug-12
31-Aug-12
1230 98,718
3.14 2.84
0.01 5.97
0.5 85.32%
41,401
1-Sep-12 30-Sep-12
905 99,623
3.14 2.84
0.01 5.97
0.5 85.32%
41,923
1-Oct-12
31-Oct-12
862 100,485
3.14 2.84
0.01 5.97
0.5 85.32%
42,307
1-Nov-12
30-Nov-12
842 101,327
3.14 2.84
0.01 5.97
0.5 85.32%
42,673
1-Dec-12
31-Dec-12
1131 102,458
3.14 2.84
0.01 5.97
0.5 85.32%
43,031
1-Jan-13 31-Jan-13
288 102,746
3.33 3.39
0.01 6.70
0.56 85.32%
48,821
1-Feb-13 28-Feb-13
252 102,998
3.33 3.39
0.01 6.70
0.56 85.32%
48,958
1-Mar-13
31-Mar-13
396 103,394
3.33 3.39
0.01 6.70
0.56 85.32%
49,079
1-Apr-13
30-Apr-13
791 104,185
3.33 3.39
0.01 6.70
0.56 85.32%
49,267
1-May-13
31-May-13
949 105,134
3.33 3.39
0.01 6.70
0.56 85.32%
49,644
1-Jun-13 30-Jun-13
1037 106,171
3.33 3.39
0.01 6.70
0.56 85.32%
50,096
Total
780,030 83 Detail calculation is in tab “ER” of the “M
PII_ER from both vintages” spreadsheet

61
In line with the FAR05 above, the KPT result will be retroactively applied to the carbon credit from MPI. Besides, there was an error
in calculation of the project emission from incomplete combustion from stove in MPI, so it was updated and adjusted in MPII. The
retroactive GS VER result is 510,846 GS VER. Because 510,952 credits were issued for the MPI, an amount of 106credit will be
deducted in MPII.
Monitoring period Credits (GS VER)
MPI (issued credit from first verification) 510,952
MPI (retroactive calculation) 510,846
Difference -106
The requested for issuance of carbon credit in MPII will be
ERMPII = 780,030 – 106 = 779,924 GS VER

E.5. Comparison of actual emission reductions or net anthropogenic GHG removals by sinks with estimates in registered PDD
Item Values estimated in ex-ante calculation of registered PDD
Actual values achieved during this monitoring period
Emission reductions or GHG removals by sinks (t CO2e) 868,817 779,924
E.6. Remarks on difference from estimated value in registered PDD >>
The actual ER was less than the estimated value in registered PDD. The main reason is because of the reducing in biogas usage rate. In the PDD, the usage rate was 100% and in the MPII, it is 85.32%.
Besides, the KPT result in MPII showed that the average fuel consumption is slightly less than in MPI and it was retroactively applied to the MPI ER calculation. The difference between the issued credit for MPI and the retroactive result has been deducted in the requested for issuance in MPII.
SECTION F. Results of monitoring sustainable development indicator
F.1. Safeguard Principles The next table summarizes the outcome of the ‘Do no Harm’ Assessment in the GSPR, and list the safeguard principles for which mitigation has been identified.
Safeguarding principles Application of mitigation measure
1.The project respects internationally proclaimed human rights including dignity, cultural property and uniqueness of indigenous people. The project is not complicit in Human Rights abuses.
Not required
2. The project does not involve and is not complicit in involuntary resettlement.
Not required
3. The project does not involve and is not complicit in the alteration, damage or removal of any critical cultural heritage
Not required
4. The project respects the employees’ freedom of association and their right to collective bargaining and is not complicit in restrictions of these freedoms and rights
Not required
5. The project does not involve and is not complicit in any form of forced or compulsory labor
Not required
6. The project does not employ and is not complicit in any form of child labor Not required
7. The project does not involve and is not complicit in any form of discrimination based on gender, race, religion, sexual orientation or any other basis.
Not required

63
8. The project provides workers with a safe and healthy work environment and is not complicit in exposing workers to unsafe or unhealthy work environments.
Not required
9. The project takes a precautionary approach in regard to environmental challenges and is not complicit in practices contrary to the precautionary principle.
Not required
10. The project does not involve and is not complicit in significant conversion or degradation of critical natural habitats, including those that are (a) legally protected, (b) officially proposed for protection, (c) identified by authoritative sources for their high conservation value, or (d) recognized as protected by traditional local communities.
Not required
11. The project does not involve and is not complicit in corruption. Not required
Additional relevant critical issues for my project type Environmental protection Not required
The safeguard principles identified by the Gold Standard are relevant for all projects, however for this project no mitigation measures are to be monitored according to the GSPR.
F.2. Sustainability monitoring plan This section assesses the performance of the VGS project on the sustainability indicators by indicator (ID) identified according to the monitoring plan described in the GSPR using survey methods where applicable. ID 1: Air quality The next table shows the scoring on the SD indicator air quality.
Table 48: Scoring on SD indicator Air quality
No 1 Indicator Air quality Mitigation measure N/A Repeat for each parameter
Chosen parameter Reduction in fuel (wood, agricultural residues, kerosene and
coal) consumption (kg of fuel reduced/year) Situation at 31/12/201184 Charcoal: 65.3
Coal: 67.9 Firewood: 966.6 Agriculture residuals: 322.8 Kerosene: 32.4
Situation at 30/06/201385 Charcoal: 0 Coal: 0 Firewood: 1,643.2 Agriculture residuals: 584.4 Kerosene: 0
84 According to the Monitoring report of MPI 85 According to the KPT survey in MPII

64
Estimation of baseline situation of parameter
Charcoal: 0 Coal: 0 Firewood: 0 Agriculture residuals: 0 Kerosene: 0
Future target for parameter Displacement of all fuels used for cooking inside the house by biogas
Way of monitoring How Conduct the PFT for measuring the consumed fuel. When Updated for every 2 years or more frequently By who A third party conducted the monitoring commissioned by BP,
the data are reported in a monitoring report and is made available for each verification.
ID 2: Soil condition The next table shows the scoring on the SD indicator air quality.
Table 49: Scoring on SD indicator soil condition
No 2 Indicator Soil condition Mitigation measure
N/A
Repeat for each
parameter
Chosen parameter
Usage of bio-slurry
Situation at 31/12/2011
Zone Fertilizer Don't use Fish feed Other Temperate 75.2% 19.2% 5.6% 0.0%
Warm 54.5% 19.0% 24.8 1.7%
Situation at 30/06/2013
Zone Fertilizer Don't use Fish feed Other Temperate 42.17% 53.41% 3.25% 1.17%
Warm 36.51% 61.18% 1.69% 0.62%
Estimation of baseline situation of parameter
0
Future target for parameter
Most households use bio-slurry as fertilizer
Way of monitoring
How Conduct the CMS survey. When
Updated for every 2 years or more frequently
By who
A third party conducted the monitoring commissioned by BP, the data are reported in a monitoring report and is made available for each verification.
ID 3: Biodiversity The next table shows the scoring on the SD indicator Biodiversity.

65
Table 50: Scoring on SD indicator Biodiversity
No 3 Indicator Biodiversity Mitigation measure N/A Repeat for each parameter
Chosen parameter Cumulative savings of wood (tons/year) Situation at 31/12/2011 84,879 Situation at 30/06/2013 148,859 Estimation of baseline situation of parameter
0
Future target for parameter Significant reduction of wood demand realized by the provision of a clean and sustainable fuel: biogas
Way of monitoring How Conduct the PFT for measuring the consumed fuel. When Updated for every 2 years or more frequently By who A third party conducted the monitoring commissioned by BP,
the data are reported in a monitoring report and is made available for each verification.
Due to the BP project activities a significant amount of wood is saved per household. The reduction in wood use will help to keep habitat intact which will have a positive effect on biodiversity. ID 4: Quality of Employment The next table shows the scoring on the SD indicator Quality of Employment.
Table 51: Scoring on SD indicator Quality of Employment
No 4 Indicator Quality of Employment Mitigation measure N/A Repeat for each parameter
Chosen parameter Number of masons and technicians participating in the
trainings Situation at 13/09/201186 Number of masons: 922
Number of technicians: 622 Situation at 31/12/201187 Number of masons: 922
Number of technicians: 622 Situation at 30/06/2013 Number of masons: 1038
Number of technicians: 707 Estimation of baseline situation of parameter
0
Future target for parameter At least 2 district biogas technicians and 2 biogas masons per district provided with training
Way of monitoring How The PP keeps track on the number of trained masons and technicians
86 According to the GS passport version 3.1, dated 25/09/2012. 87 There was not any training course during 13/09/2011 to 31/12/2011, therefore the number of trained masons and
technicians stayed the same.

66
When Annually By who BP
In order to meet the defined rules, during its implementation, the BP program has been expanding to new districts as well as trained new masons and technician who based in these new districts. In the meantime, the new masons and technicians in existing districts which have only 1 trained mason or technician have also been selected for training to meet the target of at least 2 masons or technicians per district. During the MPII, there were 116 new masons and 85 new technicians trained under the program activity. The figures below show the ongoing trend to meet the target:
Figure 13: Number of masons in MPI and MPII
Figure 14: Number of technicians in MPI and MPII
0
50
100
150
200
250
300
350
400
450
Districts which had at least 1 mason Districts which met target
MPI MPII
0
50
100
150
200
250
300
350
400
450
Districts which had at least 1 technician Districts which met target
MPI MPII

67
ID 5: Livelihood of the poor The next table shows the scoring on the SD indicator Livelihood of the poor
Table 52: Scoring on SD indicator “Livelihood of the poor”
No 5 Indicator Livelihood of the poor Mitigation measure N/A Repeat for each parameter
Chosen parameter Number of people having access to an improved waste
management system Situation at 31/12/2011 436,962 Situation at 30/06/2013 427,53988
Estimation of baseline situation of parameter
0
Future target for parameter 625,470 Way of monitoring How The PP keeps track on the number of households with bio-
digesters and conduct the CMS survey for the average number of people in a household.
When Updated for every 2 years or more frequently By who BP
ID 6: Access to affordable and clean energy services The next table shows the scoring on the SD indicator “Access to affordable and clean energy services”
Table 53: Scoring on SD indicator Access to affordable and clean energy services
No 6 Indicator Access to affordable and clean energy services Mitigation measure N/A Repeat for each parameter
Chosen parameter Total amount of energy replaced by biogas (MJ/hh/year)
Situation at 31/12/2011 33,232 Situation at 30/06/2013 33,840 Estimation of baseline situation of parameter
0
Future target for parameter Displacement of all fuels used for cooking inside the house by biogas
Way of monitoring How Conduct the PFT for measuring the consumed fuel. When Updated for every 2 years or more frequently By who A third party will conduct the monitoring commissioned by BP,
the data will be reported in a monitoring report and is made available for each verification.
88 Number of people having access to an improved waste management system is calculated by multiply the number of units
which are still in operation with the average number of people per households. In this MPII, the number of units which are still in operation was adjusted to exclude the drop off based on the user survey results the drop-off rate. The number of in use are 106,171*90.13% =95,697; or the units dropped out are 10,474 units.

68
ID 7: Technology transfer and technological self-reliance The next table shows the scoring on the SD indicator Technology transfer and technological self-reliance
Table 54: Scoring on SD indicator “Technology transfer and technological self-reliance”
No 7 Indicator Technology transfer and technological self-reliance Mitigation measure N/A Repeat for each parameter
Chosen parameter Number of masons trained in the construction of KT1 or KT2 bio-
digesters
Situation at 13/09/201189 Number of masons: 922 Situation at 31/12/201190 Number of masons: 922 Situation at 30/06/2013 Number of masons: 1038 Estimation of baseline situation of parameter
0
Future target for parameter At least 2 biogas masons per district provided with training Way of monitoring How The PP keeps track on the number of trained masons
When Annually By who BP
During the MPII, there were 116 new masons trained under the program activity to meet the future target of at least 2 biogas masons per district provided with training.
89 According to the GS passport version 3.1, dated 25/09/2012. 90 There was not any training course during 13/09/2011 to 31/12/2011, therefore the number of trained masons and
technicians stayed the same.
69
Annex 1: Contact details of the Project Participants Organization: Biogas Program for the Animal Husbandry Sector of Vietnam Street/P.O.Box: 298 Kim Ma Building: Room 104, Bldg 2G, Van Phuc Compound City: Hanoi State/Region: N/A Postcode/ZIP: 1000 Country: Vietnam Telephone: 04.3726 1771 FAX: 04.3726 1773 E-Mail: [email protected] URL: www.biogas.org.vn Represented by: Mr. Tong Xuan Chinh Title: Director Salutation: N/A Last name: Tong Middle name: Xuan First name: Chinh Department: Department of Livestock Production – Ministry of Agricultural and Rural
Development (DLP-MARD) Mobile: Direct FAX: 04.3734 4829 Direct tel: 04.3734 4829 Personal e-mail:
Organization: SNV Netherlands Development Agency Street/P.O.Box: La Thanh Hotel, 218 Doi Can Building: 6th Floor, Building B City: Ba Dinh, Ha Noi State/Region: Postcode/ZIP: Country: Vietnam Telephone: FAX: E-Mail: URL: www.snvworld.org
Represented by: Dagmar Zwebe Title: Sector Leader Salutation: Ms Last name: Zwebe Middle name: First name: Dagmar Department: Renewable Energy - Vietnam Mobile: +84 (0) 1238163324


![[Young Marketers Marathon - Elite Assignment] Hoang Tthach - Hoang Lan](https://static.fdocuments.net/doc/165x107/55d72dcfbb61eb890a8b45bd/young-marketers-marathon-elite-assignment-hoang-tthach-hoang-lan.jpg)


![[Young Marketers Elite 2013] Assignment 14.1 - Hoang Thach - Hoang Lan](https://static.fdocuments.net/doc/165x107/54b72f904a795903318b46c0/young-marketers-elite-2013-assignment-141-hoang-thach-hoang-lan.jpg)