MONITORING REPORT FORM (FCDMMR) · 2016-07-19 · Stove, Fixed Esperanza and Rocket Barn1) for the...
31
UNFCCC/CCNUCC CDM – Executive Board Page 1 MONITORING REPORT FORM (FCDMMR) Version 02.0 MONITORING REPORT Title of the project activity Integrated Biomass Energy Conservation Project, Malawi Reference number of the project activity Gold Standard 613 Version number of the monitoring report Version 6 Completion date of the monitoring report 08/04/2015 Registration date of the project activity 01/10/2010 Monitoring period number and duration of this monitoring period Monitoring period number 4 - 02/10/2012 to 01/10/2013 (inclusive of both dates). Project participant(s) Hestian Innovation Ltd. Host Party(ies) Malawi Sectoral scope(s) and applied methodology(ies) Scope 3 - Energy demand Methodology: Gold Standard Technologies and Practices to Displace Decentralised Thermal Energy Consumption version 1.0 Estimated amount of GHG emission reductions or net anthropogenic GHG removals by sinks for this monitoring period in the registered PDD 77,500 tCO2e for year 5 as per registered PDD Version 6 Actual GHG emission reductions or net anthropogenic GHG removals by sinks achieved in this monitoring period 80,496 tCO2e for year 02/10/2012 to 01/10/2013 (inclusive of both dates): 02/10/2012 to 31/12/2012 – 18,053 tCO2e 01/01/2013 to 01/10/2013 – 62,443 tCO2e
Transcript of MONITORING REPORT FORM (FCDMMR) · 2016-07-19 · Stove, Fixed Esperanza and Rocket Barn1) for the...
UNFCCC/CCNUCC
CDM – Executive Board Page 1
MONITORING REPORT FORM (FCDMMR)
Version 02.0
MONITORING REPORT
Title of the project activity Integrated Biomass Energy Conservation Project,
Malawi
Reference number of the project activity Gold Standard 613
Version number of the monitoring report Version 6
Completion date of the monitoring report 08/04/2015
Registration date of the project activity 01/10/2010
Monitoring period number and duration of
this monitoring period
Monitoring period number 4 - 02/10/2012 to
01/10/2013 (inclusive of both dates).
Project participant(s) Hestian Innovation Ltd.
Host Party(ies) Malawi
Sectoral scope(s) and applied
methodology(ies)
Scope 3 - Energy demand
Methodology: Gold Standard Technologies and
Practices to Displace Decentralised Thermal Energy
Consumption version 1.0
Estimated amount of GHG emission
reductions or net anthropogenic GHG
removals by sinks for this monitoring period
in the registered PDD
77,500 tCO2e for year 5 as per registered PDD Version
6
Actual GHG emission reductions or net
anthropogenic GHG removals by sinks
achieved in this monitoring period
80,496 tCO2e for year 02/10/2012 to 01/10/2013
(inclusive of both dates):
02/10/2012 to 31/12/2012 – 18,053 tCO2e
01/01/2013 to 01/10/2013 – 62,443 tCO2e
UNFCCC/CCNUCC
CDM – Executive Board Page 2
SECTION A. Description of project activity
A.1 Purpose and general description of project activity
The project reduces greenhouse gas emissions from non-renewable biomass fuel by dissemination of
improved cook-stoves to replace existing inefficient stoves.
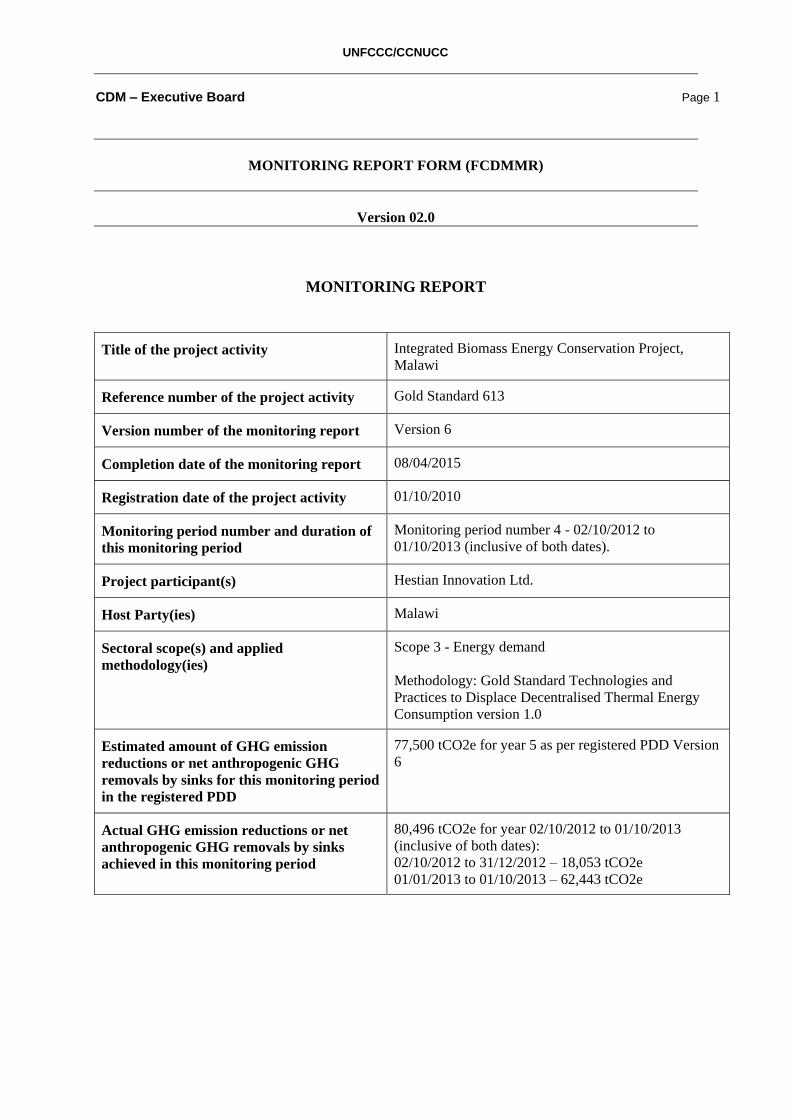
This Monitoring Report covers two of the five technologies which are progressively installed as part
of the project activities. No VERs are claimed for the remaining three technologies (Urban Cook
Stove, Fixed Esperanza and Rocket Barn1) for the monitoring period and as such these technologies
are not included in this monitoring report. The two technologies which are detailed in the Monitoring
Report are:
(1) Portable Ceramic Stoves and
(2) Institutional Cook Stoves.
(1) Portable Ceramic Stove (2) Institutional Cook Stove
Kitchen Surveys and Aging Tests have been conducted for these fuel-efficient devices.
Project benefits include reduced exposure to indoor air pollution as well as relief from high fuel costs,
less time spent hand-gathering domestic fuel-wood and reduced burden for some institutions to
transport wood over distances that are increasing. Public benefits of the devices promoted come in the
form of reduced pressure on Malawi’s natural resources.
During the current monitoring period of 02/10/2012 to 01/10 2013 (inclusive of both dates) it is
calculated that 80,496 tCO2e emission reductions have been generated.
A.2 Location of project activity
The project has activities in all the three regions of Malawi i.e. Northern, Southern and Central
regions.
A.3 Parties and project participant(s)
Party involved
((host) indicates a host Party)
Private and/or public
entity(ies) project participants
(as applicable)
Indicate if the Party involved
wishes to be considered as
project participant (Yes/No)
1 Under current conditions it is felt that the three technologies not included in the monitoring report have been
omitted based on a cost-benefit analysis performed by the PP in consultation with project implementers.

UNFCCC/CCNUCC
CDM – Executive Board Page 3
Malawi (host) Hestian Innovation Ltd., a
private company registered in
the British Virgin Islands
No
A.4 Reference of applied methodology
Please see revised monitoring plan.
The project follows the Gold Standard Methodology “technologies and practices to displace
decentralised thermal energy consumption” (11/04/2011).
A.5 Crediting period of project activity
The current crediting period for the project is 24/11/2008 to 23/11/2015 (both days included).
SECTION B. Implementation of project activity
B.1 Description of implemented registered project activity
The project activity disseminated in the monitoring period Portable Ceramic Stoves (PCS) and
Institutional Cook Stoves (ICS) as detailed in the box below with a calculated GHG offset of 80,496
tCO2e generated during the monitoring period.
PCS ICS
24/11/2008 – 01/10/2009 1,767 0
02/10/2009 – 01/10/2010 5,308 1
02/10/2010 – 01/10/2011 5,839 30
02/10/2011 – 01/10/2012 7,228 126
02/10/2012 – 31/12/2012 0 9
01/01/2013 – 01/10/2013 6,588 94
Total 26,730 260
Table 1: Devices sold generating emission reductions in MP4
Note:
GS613’s small scale limit is reached by including PCS and ICS sales up to September 8,
2012. Other devices which were sold in MP4 but are not included in MR4 will either be
grouped into a new project or will be included as necessary for MR5, with the understanding
that the emission reductions those devices would have generated in monitoring period 4
cannot be claimed in monitoring period 5.
The values for PCS and ICS disseminated 02/10/2011 – 01/10/2012 presented in MR4 reflect
an increase on values presented in MR3. Technologies disseminated in monitoring period 3
exceeded the small scale limit for GS613; therefore, only as many technologies were included
in MR3 as necessary to reach small scale limit. PCS were included up to Dec. 5, 2011 and

UNFCCC/CCNUCC
CDM – Executive Board Page 4
ICS up to Sept. 29, 2011. First year emission reductions for these additional stoves which
were generated in MP3 are not being claimed in MR4; rather, ONLY their second year
emission reductions which occurred in MP4 are claimed in MR4, and year two usage rates
and efficiencies are appropriately applied. This approach adds to the conservativeness of
GS613.
As per MR3, UCS and FES stoves are not actively promoted under GS613 at the moment,
therefore no device sales are recorded in MR4, nor emission reductions claimed for any
devices sold in previous monitoring period which may still be in use.
For MR4, Rocket Barns are also excluded from emission reduction claims. GS613’s Rocket
Barns may be claimed for separately as a new project with retroactive crediting.
In parallel with sales of stoves, a rigorous monitoring of the project activity has been ongoing per
schedule below:
Date Activity Purpose
October 2, 2012 to October 1, 2013 Sales recording Establish sales database to track number
of devices sold and determine clusters
for kitchen surveys.
Ongoing Non-Renewable Biomass –
monitoring for official credible
publicly available value
Determine percentage of non- renewable
biomass.
22nd January to 12th March, 2013
Ongoing (PCS)
Aging Stove Tests – Water
Boiling Tests (PCS)
To measure efficiency changes for aging
stoves (PCS).
November 25th – November 28th
2013 (PCS)2
Usage & Monitoring Surveys
(PCS)
Determine if clusters are still
representative. To establish drop-off
rates in PCS performance & other
relevant factors in aging PCS, to
establish the average lifespan of the
PCS.
September 25th – October 28th 2013
(ICS)
Usage & Monitoring Surveys
(ICS)
Determine if clusters are still
representative. To establish drop-off
rates in ICS performance & other
relevant factors in aging ICS.
In response to FAR P4 of MR3, Monitoring Surveys were revised to explicitly address the issue of
leakage for domestic stove, and enumerators retrained to effectively address this issue. As per FAR
Q1 of MR3, while it is not feasible to conduct a simple random sample of the entire sales database, a
simple random sample was applied to select a number of geographic areas for survey. A simple
random sample was then conducted from among these sampled geographic areas to determine the
average lifespan of the PCS stoves.
Where necessary, new cluster(s) shall be formed and a new baseline shall be established and
validated, based on results of ongoing monitoring activities.
B.2 Post registration changes
2 Some monitoring activity may occur after end of the monitor period to ensure that stoves meet the
requirements for minimum length of time in use. This lends to the conservativeness of the single weighted
usage parameter.
UNFCCC/CCNUCC
CDM – Executive Board Page 5
B.2.1. Temporary deviations from registered monitoring plan or applied methodology
N/A
B.2.2. Corrections
N/A
B.2.3. Permanent changes from registered monitoring plan or applied methodology
The PP has become aware of revised values for CO2 and non CO2 emission factors which are used in
calculation of emission reductions. Values used in MR4 reflect both old GWP valid up to December
31, 2012, as well as the most up to date emission factors based on the 2006 IPCC Guidelines for
National Greenhouse Gas Inventories, effective January 1, 2013.
B.2.4. Changes to project design of registered project activity
On 31/10/2012 the GSF approved PP’s request to change the scale of the project from Large Scale to
Small Scale.
As of MR3, validated by GSF on September 23, 2013, UCS, RBs and FES stoves are not currently
included under GS613.
B.2.5. Changes to start date of crediting period
N/A
B.2.6. Types of changes specific to afforestation or reforestation project activity
N/A
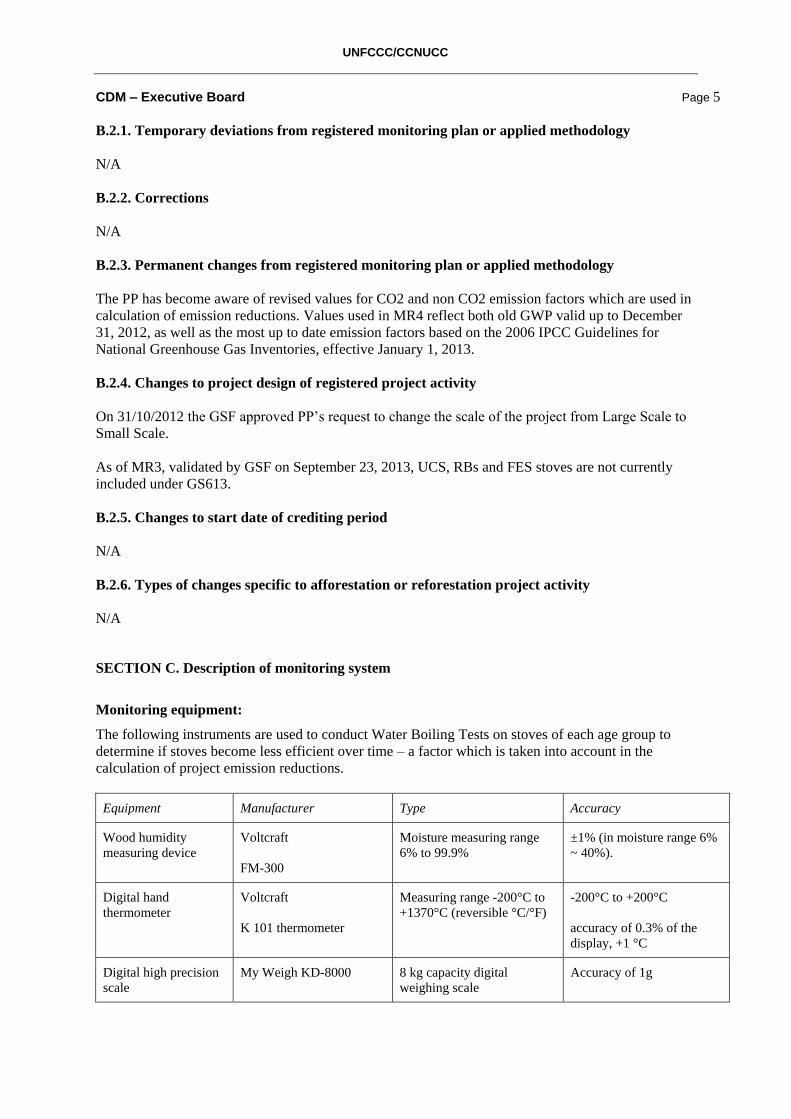
SECTION C. Description of monitoring system
Monitoring equipment:
The following instruments are used to conduct Water Boiling Tests on stoves of each age group to
determine if stoves become less efficient over time – a factor which is taken into account in the
calculation of project emission reductions.
Equipment Manufacturer Type Accuracy
Wood humidity
measuring device
Voltcraft
FM-300
Moisture measuring range
6% to 99.9%
±1% (in moisture range 6%
~ 40%).
Digital hand
thermometer
Voltcraft
K 101 thermometer
Measuring range -200°C to
+1370°C (reversible °C/°F)
-200°C to +200°C
accuracy of 0.3% of the
display, +1 °C
Digital high precision
scale
My Weigh KD-8000 8 kg capacity digital
weighing scale
Accuracy of 1g
UNFCCC/CCNUCC
CDM – Executive Board Page 6
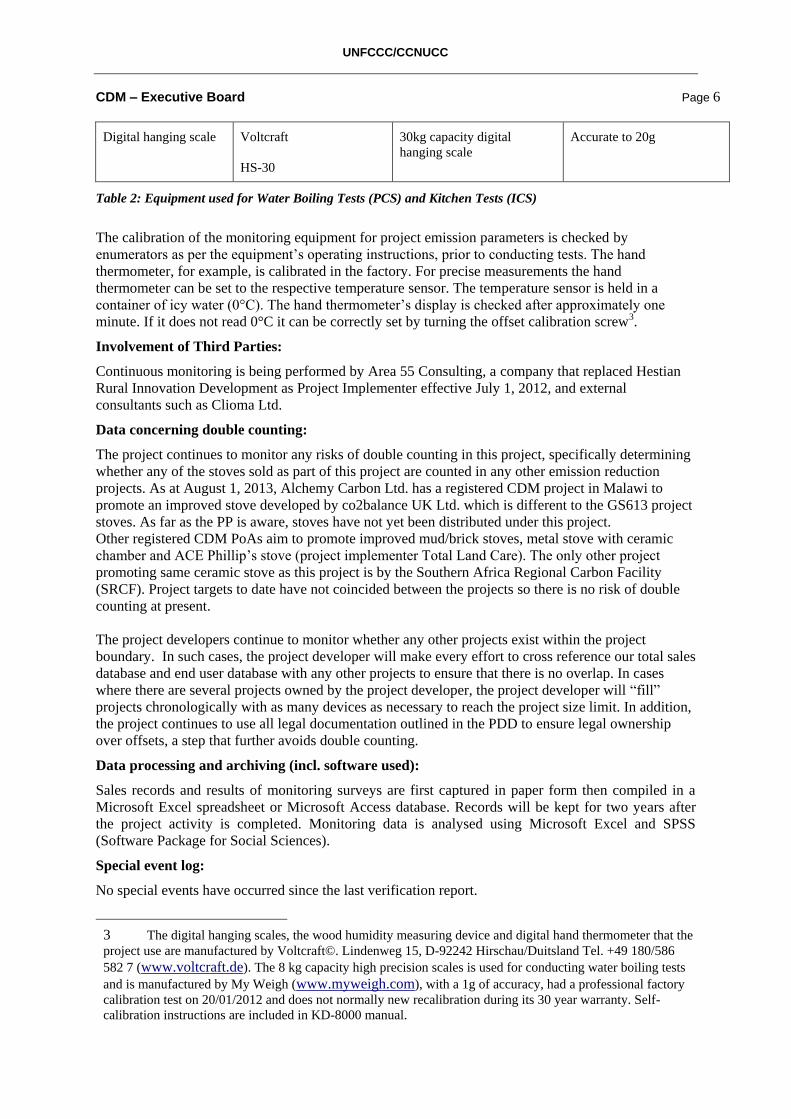
Digital hanging scale Voltcraft
HS-30
30kg capacity digital
hanging scale
Accurate to 20g
Table 2: Equipment used for Water Boiling Tests (PCS) and Kitchen Tests (ICS)
The calibration of the monitoring equipment for project emission parameters is checked by
enumerators as per the equipment’s operating instructions, prior to conducting tests. The hand
thermometer, for example, is calibrated in the factory. For precise measurements the hand
thermometer can be set to the respective temperature sensor. The temperature sensor is held in a
container of icy water (0°C). The hand thermometer’s display is checked after approximately one
minute. If it does not read 0°C it can be correctly set by turning the offset calibration screw3.
Involvement of Third Parties:
Continuous monitoring is being performed by Area 55 Consulting, a company that replaced Hestian
Rural Innovation Development as Project Implementer effective July 1, 2012, and external
consultants such as Clioma Ltd.
Data concerning double counting:
The project continues to monitor any risks of double counting in this project, specifically determining
whether any of the stoves sold as part of this project are counted in any other emission reduction
projects. As at August 1, 2013, Alchemy Carbon Ltd. has a registered CDM project in Malawi to
promote an improved stove developed by co2balance UK Ltd. which is different to the GS613 project
stoves. As far as the PP is aware, stoves have not yet been distributed under this project.
Other registered CDM PoAs aim to promote improved mud/brick stoves, metal stove with ceramic
chamber and ACE Phillip’s stove (project implementer Total Land Care). The only other project
promoting same ceramic stove as this project is by the Southern Africa Regional Carbon Facility
(SRCF). Project targets to date have not coincided between the projects so there is no risk of double
counting at present.
The project developers continue to monitor whether any other projects exist within the project
boundary. In such cases, the project developer will make every effort to cross reference our total sales
database and end user database with any other projects to ensure that there is no overlap. In cases
where there are several projects owned by the project developer, the project developer will “fill”
projects chronologically with as many devices as necessary to reach the project size limit. In addition,
the project continues to use all legal documentation outlined in the PDD to ensure legal ownership
over offsets, a step that further avoids double counting.
Data processing and archiving (incl. software used):
Sales records and results of monitoring surveys are first captured in paper form then compiled in a
Microsoft Excel spreadsheet or Microsoft Access database. Records will be kept for two years after
the project activity is completed. Monitoring data is analysed using Microsoft Excel and SPSS
(Software Package for Social Sciences).
Special event log:
No special events have occurred since the last verification report.
3 The digital hanging scales, the wood humidity measuring device and digital hand thermometer that the
project use are manufactured by Voltcraft©. Lindenweg 15, D-92242 Hirschau/Duitsland Tel. +49 180/586
582 7 (www.voltcraft.de). The 8 kg capacity high precision scales is used for conducting water boiling tests
and is manufactured by My Weigh (www.myweigh.com), with a 1g of accuracy, had a professional factory
calibration test on 20/01/2012 and does not normally new recalibration during its 30 year warranty. Self-
calibration instructions are included in KD-8000 manual.

UNFCCC/CCNUCC
CDM – Executive Board Page 7
Quality assurance and quality control measures
Quality control tools were developed for the Chitetezo Mbaula and are used in stove trainings. During
training, producers are instructed not to ‘fire’ stoves which are not of the correct specifications.
Further to this, retailers individually inspect the stoves before purchasing from the producer and
substandard stoves are not purchased, which acts as a further internal quality control. In event of
problems with the larger technology (the institutional cook stove), the warranty system explained
under ‘Roles and Responsibilities’ applies.
Documented procedures and management plan:
A simplified monitoring plan has been developed by the project coordinator, which aims to build
capacity of project managers and their field staff in line with monitoring tasks outline roles and
responsibilities documented below.
Roles and responsibilities:
The Project Coordinator assists the project implementing and monitoring bodies (project
implementers), such as Area 55 Consulting and Concern Universal (CU), and the specific project
managers to maintain and make available accurate records. The Project Coordinator collates a
composite electronic Total Sales Record and project implementers keep back-up paper records. The
existing accounting and records system accurately tracks sales, inventories and supply and purchases.
Project implementers maintain a full electronic sales database of all household sales that take place,
listed according to the sales mechanism, date, device, type etc. Sales databases are cross-checked with
production records and other data to ensure consistency and accuracy.
Area 55, who is the only project implementer currently promoting institutional stoves, implements a 2
year limited warranty system for the institutional cook stoves. There is no formal overarching
warranty system in place for household cookstoves, from any of the project implementers.

UNFCCC/CCNUCC
CDM – Executive Board Page 8
Replacement within areas less than 10km away from promoter and production group may be done if
stove breaks within first few weeks of use at the discretion of the stove promoter and production
group4. Further than this it is too difficult to assess for simple ceramic stove if stove broke during
transport or recklessness or fault of user.
End user information is collected through direct sales to end-users by retailers or agents of the project
and is contained in warranty and/or emission reduction contract. This information is collated into an
electronic database from which project monitoring can be conducted. The database and Excel records
are backed up and sent to the project coordinator for checking prior to using them as the basis for
monitoring activities. Hard copies of ER contracts and warranty are filed as additional backup and for
verification purposes. During monitoring period 4, one of the main project implementers Area 55
Consulting began scanning these paper records to prevent any losses in case of emergencies such as
fire/theft.
Direct sales to end-users information is collected by implementers’ agents who are issued with
contract forms in advance and submit the forms to the relevant project managers. The customers in the
sales record for which phone numbers or addresses are available are used for survey sampling to
support the periodic monitoring activities.
Monitoring tasks, such as monitoring surveys, assessment of leakage and other such tasks are
managed by the project managers who are best capable of collecting this data because they know the
technology and the end-users best, with the support of the project coordinator.
It is important to note that monitoring surveys are not used directly in ER calculations, but instead
serve to inform whether new clusters are required (which could in turn effect ER calculations) and
monitor certain Gold Standard sustainability indicators. Surveys and tests are organised by project
implementer staff with guidance from the project coordinator, and enumerators are trained prior to
conducting surveys and tests. Survey and test results are filed in paper at Area 55’s office and are
analysed using Excel to compile reports. The integrity of data is constantly cross-checked with other
variables to ensure consistency and avoid mistakes.
Trainings:
Kitchen Surveys (KS), Kitchen Performance Tests (KPTs), Usage Surveys and Monitoring Surveys
are performed by trained enumerators and supervised by relevant project managers and the project
coordinator as necessary. These enumerators perform monitoring activities and report directly to the
respective project managers. The Project Coordinator collates the information provided by the
respective project managers.
Project implementers also take the lead in training of new producers and promoters. Project
implementers prefer to use local enumerators and artisans in different parts of the country because it
decreases transport costs and employs local people, which is a benefit to the community and helps
strengthen the project’s local presence. Households seem to be more comfortable and trustful of local
people performing the surveys / tests.
Project implementers and their agents also train end-users on proper use of the stove, as outlined in
section below on troubleshooting.
Involvement of Third Parties:
4 The approach is an informal agreement between producers, promoters and customers. The complementary
replacement stove promotes customer loyalty and helps to market the stoves locally.

UNFCCC/CCNUCC
CDM – Executive Board Page 9
Clioma Ltd. provides technical assistance to the project in areas of quality control and project
monitoring.
Dr. Wilson Jere and Amulike Msukwa from Bunda College, University of Malawi periodically
provide the Project with assistance in statistical analysis of the usage and monitoring surveys for all
technologies and the adjusted adult meals for ICS.
Internal audits and control measures:
The volume of devices sold is the basis to determining the emissions reductions. Respective project
managers manage their sales records, project database and information on sustainable development
indicators, and forward them to the project coordinator.
Project implementers are subjected to financial audits under Malawi law.
Troubleshooting procedures:
Troubleshooting procedures (as commonly understood) do not apply to this project.
The following measures improve the lifetimes of the technologies and help to maintain efficiency:
(1) Project implementers and their agents provide user-training to each and every end-user on how: (i)
to operate the devices (i.e. user training), (ii) to improve kitchen management and (iii) to improve
firewood management. Producers are trained on production techniques and design specifications.
(2) Stove users are encouraged to avoid leaving portable stoves out in the rain and protect fixed stoves
from the elements. By protecting stoves, their life-span can be extended.
(3) End-users are trained on how to improve firewood management by drying and splitting, firewood
before use, by not overloading the furnace or fire chamber with too much fuel and by extinguishing
un-used firewood in sand so that it can be used later.
(4) Kitchen management is promoted to reduce exposure to smoke by encouraging improved kitchen
ventilation and to improve cooking practices by using a lid while cooking, by soaking beans
overnight, by using the hot stove after cooking to heat water for bathing etc.
(5) As part of Surveys, home visits are made as required by the methodology. During these visits,
proper use of the stove and firewood and kitchen management is discussed. Project implementers and
their agents also periodically follow up with users through its extensive sales network. These visits
serve to reinforce proper use principles outlined above.
(6) The project’s decentralized production of stoves facilitates after-sales services from producer /
contractor to end-user. Some of the troubleshooting and quality assurance measures that are in place
include:
For the PCS, quality control occurs both before and after firing the stoves in a fuel-efficient
kiln. The production batch is recorded in the ceramic stove’s serial number so that the
performance of each batch is monitored. Producers are trained to not fire stoves that are not of
correct specifications and for marketing, only stoves which are market ready and purchased
from production group so producers know poor quality stoves will not be purchased.
The ICS includes a two year warranty and health checks including minor maintenance as
necessary, which is facilitated by income generated through carbon financing. The project
implementer has complied with requests for repairs and maintenance in line with warranties and there
are no problems with the warranty system to date.
UNFCCC/CCNUCC
CDM – Executive Board Page 10
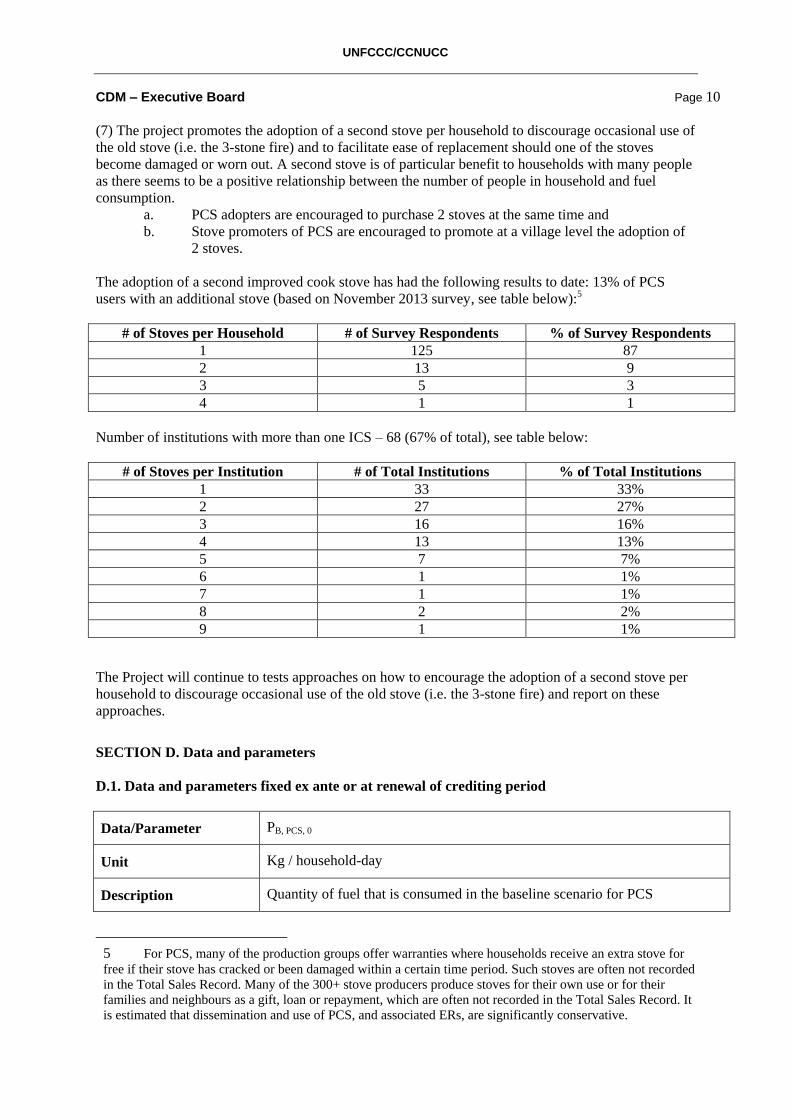
(7) The project promotes the adoption of a second stove per household to discourage occasional use of
the old stove (i.e. the 3-stone fire) and to facilitate ease of replacement should one of the stoves
become damaged or worn out. A second stove is of particular benefit to households with many people
as there seems to be a positive relationship between the number of people in household and fuel
consumption.
a. PCS adopters are encouraged to purchase 2 stoves at the same time and
b. Stove promoters of PCS are encouraged to promote at a village level the adoption of
2 stoves.
The adoption of a second improved cook stove has had the following results to date: 13% of PCS
users with an additional stove (based on November 2013 survey, see table below):5
# of Stoves per Household # of Survey Respondents % of Survey Respondents
1 125 87
2 13 9
3 5 3
4 1 1
Number of institutions with more than one ICS – 68 (67% of total), see table below:
# of Stoves per Institution # of Total Institutions % of Total Institutions
1 33 33%
2 27 27%
3 16 16%
4 13 13%
5 7 7%
6 1 1%
7 1 1%
8 2 2%
9 1 1%
The Project will continue to tests approaches on how to encourage the adoption of a second stove per
household to discourage occasional use of the old stove (i.e. the 3-stone fire) and report on these
approaches.
SECTION D. Data and parameters
D.1. Data and parameters fixed ex ante or at renewal of crediting period
Data/Parameter PB, PCS, 0
Unit Kg / household-day
Description Quantity of fuel that is consumed in the baseline scenario for PCS
5 For PCS, many of the production groups offer warranties where households receive an extra stove for
free if their stove has cracked or been damaged within a certain time period. Such stoves are often not recorded
in the Total Sales Record. Many of the 300+ stove producers produce stoves for their own use or for their
families and neighbours as a gift, loan or repayment, which are often not recorded in the Total Sales Record. It
is estimated that dissemination and use of PCS, and associated ERs, are significantly conservative.

UNFCCC/CCNUCC
CDM – Executive Board Page 11
Source of data Baseline FT for PCS
Value(s) applied 14.35 kg / household day (equivalent to 5.237 t / household year
Purpose of data Calculation of baseline emissions for PCS users.
Additional comment With the inclusion of baseline data being assessed for suppressed demand the
initial fixed baseline data for PCS users (7.02 kg / household day, equivalent
to 2.561 tons / household year) was assessed in terms of suppressed demand.
The initial baseline survey and test were conducted in April / May before the
cold season when households may use more wood for space heating, and just
after the rainy season when perhaps more wood is used to compensate for
higher moisture content.
Data/Parameter PB, ICS, 0
Unit Kg / adult-adjusted meal
Description Quantity of fuel that is consumed in the baseline scenario for ICS
Source of data Baseline FT for ICS
Value(s) applied 0.3604 kg / adult-adjusted meal
Purpose of data This is the initial fixed baseline data for ICS users.
Additional comment Baseline data for ICS has not yet been assessed for suppressed demand.
Data/Parameter Person - meal
Unit % of person meal or adult-adjusted meal
Description Appropriate weighting for (i) Workforce (male and female), (ii) children’s
meal (primary school), (iii) 6 year olds and under (pre-primary school) (iv)
light meals (e.g. tea).
Source of data Baseline FT for ICS; Conversion factors used to estimate Adult Equivalent
(AE) are sourced from Government of Malawi, Impact and output indicators
for agriculture, food security, nutrition and natural resources projects/
programmes in Malawi, July 2008.
Value(s) applied Workforce (male and female) meal = 0.90 person meal
Children’s meals (primary school) = 0.75 person meal
6 year olds and under (pre-primary school) = 0.60 person meal
Teas = 0.50 person meal
Purpose of data This parameter is used to normalise workforce made up of women and men,
primary school meals, orphanage meals and light meals (e.g. tea).
Additional comment
UNFCCC/CCNUCC
CDM – Executive Board Page 12
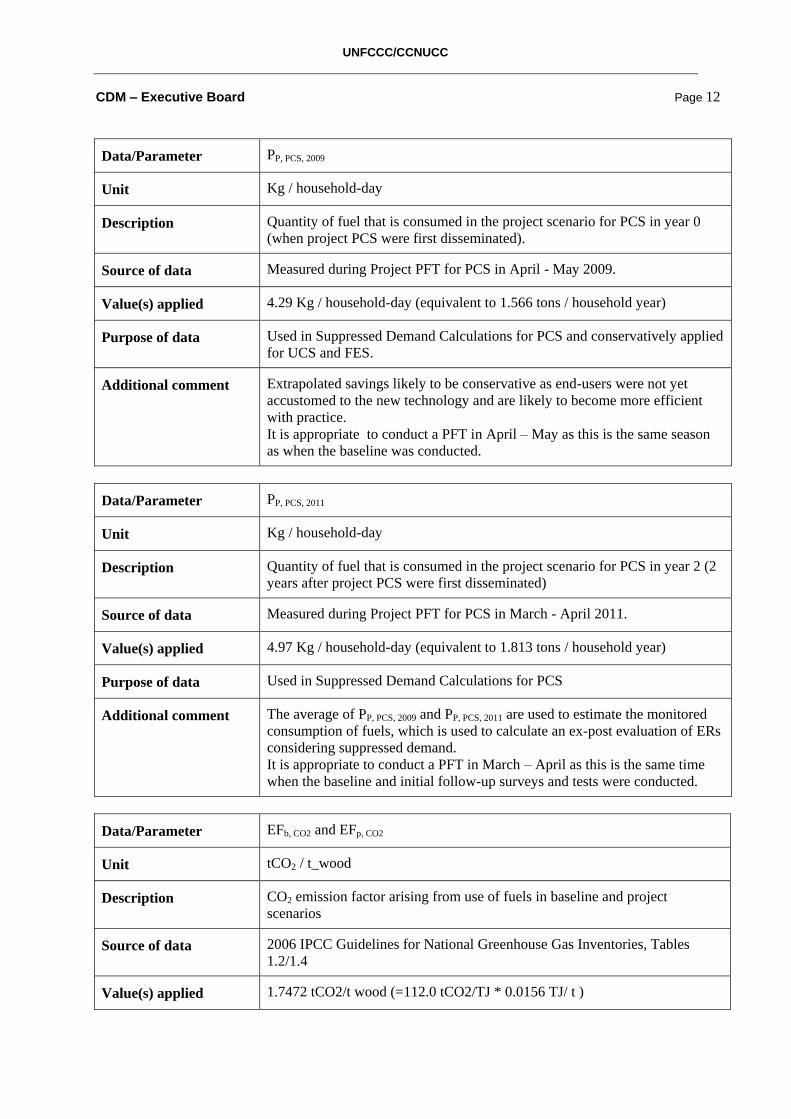
Data/Parameter PP, PCS, 2009
Unit Kg / household-day
Description Quantity of fuel that is consumed in the project scenario for PCS in year 0
(when project PCS were first disseminated).
Source of data Measured during Project PFT for PCS in April - May 2009.
Value(s) applied 4.29 Kg / household-day (equivalent to 1.566 tons / household year)
Purpose of data Used in Suppressed Demand Calculations for PCS and conservatively applied
for UCS and FES.
Additional comment Extrapolated savings likely to be conservative as end-users were not yet
accustomed to the new technology and are likely to become more efficient
with practice.
It is appropriate to conduct a PFT in April – May as this is the same season
as when the baseline was conducted.
Data/Parameter PP, PCS, 2011
Unit Kg / household-day
Description Quantity of fuel that is consumed in the project scenario for PCS in year 2 (2
years after project PCS were first disseminated)
Source of data Measured during Project PFT for PCS in March - April 2011.
Value(s) applied 4.97 Kg / household-day (equivalent to 1.813 tons / household year)
Purpose of data Used in Suppressed Demand Calculations for PCS
Additional comment The average of PP, PCS, 2009 and PP, PCS, 2011 are used to estimate the monitored
consumption of fuels, which is used to calculate an ex-post evaluation of ERs
considering suppressed demand.
It is appropriate to conduct a PFT in March – April as this is the same time
when the baseline and initial follow-up surveys and tests were conducted.
Data/Parameter EFb, CO2 and EFp, CO2
Unit tCO2 / t_wood
Description CO2 emission factor arising from use of fuels in baseline and project
scenarios
Source of data 2006 IPCC Guidelines for National Greenhouse Gas Inventories, Tables
1.2/1.4
Value(s) applied 1.7472 tCO2/t wood (=112.0 tCO2/TJ * 0.0156 TJ/ t )
UNFCCC/CCNUCC
CDM – Executive Board Page 13
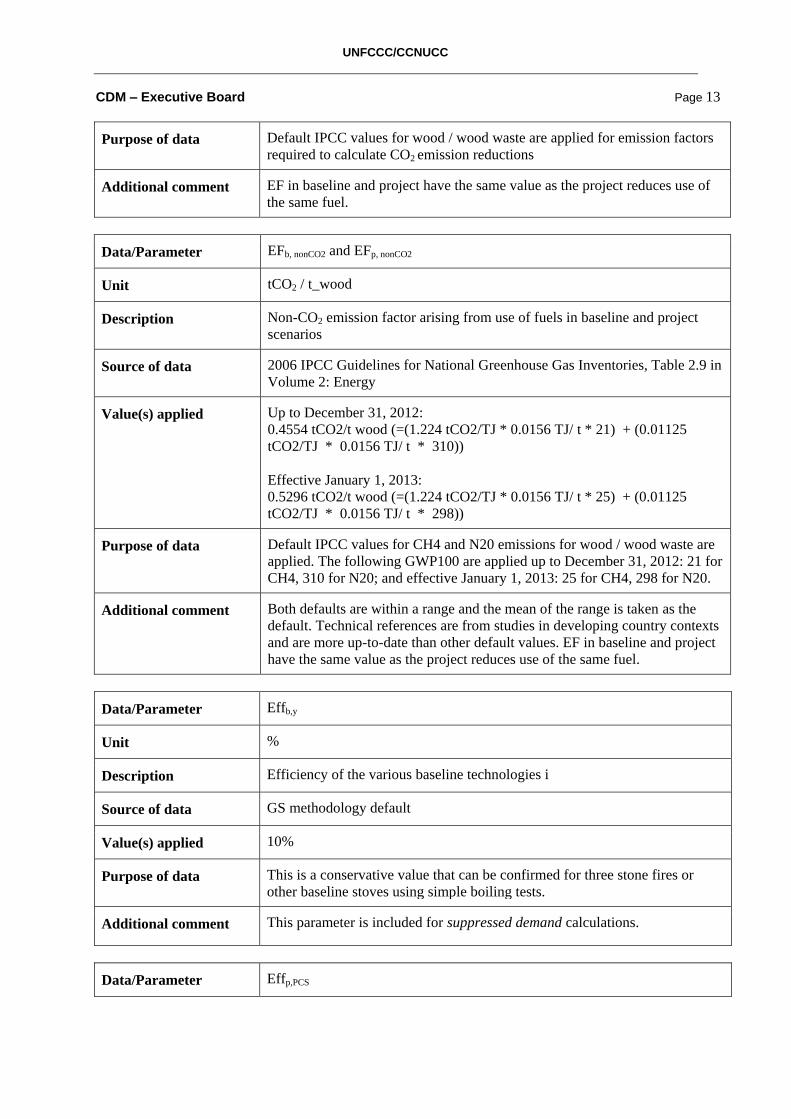
Purpose of data Default IPCC values for wood / wood waste are applied for emission factors
required to calculate CO2 emission reductions
Additional comment EF in baseline and project have the same value as the project reduces use of
the same fuel.
Data/Parameter EFb, nonCO2 and EFp, nonCO2
Unit tCO2 / t_wood
Description Non-CO2 emission factor arising from use of fuels in baseline and project
scenarios
Source of data 2006 IPCC Guidelines for National Greenhouse Gas Inventories, Table 2.9 in
Volume 2: Energy
Value(s) applied Up to December 31, 2012:
0.4554 tCO2/t wood (=(1.224 tCO2/TJ * 0.0156 TJ/ t * 21) + (0.01125
tCO2/TJ * 0.0156 TJ/ t * 310))
Effective January 1, 2013:
0.5296 tCO2/t wood (=(1.224 tCO2/TJ * 0.0156 TJ/ t * 25) + (0.01125
tCO2/TJ * 0.0156 TJ/ t * 298))
Purpose of data Default IPCC values for CH4 and N20 emissions for wood / wood waste are
applied. The following GWP100 are applied up to December 31, 2012: 21 for
CH4, 310 for N20; and effective January 1, 2013: 25 for CH4, 298 for N20.
Additional comment Both defaults are within a range and the mean of the range is taken as the
default. Technical references are from studies in developing country contexts
and are more up-to-date than other default values. EF in baseline and project
have the same value as the project reduces use of the same fuel.
Data/Parameter Effb,y
Unit %
Description Efficiency of the various baseline technologies i
Source of data GS methodology default
Value(s) applied 10%
Purpose of data This is a conservative value that can be confirmed for three stone fires or
other baseline stoves using simple boiling tests.
Additional comment This parameter is included for suppressed demand calculations.
Data/Parameter Effp,PCS

UNFCCC/CCNUCC
CDM – Executive Board Page 14
Unit %
Description Efficiency of portable ceramic stove (PCS)
Source of data Testing the Chitetezo Mbaula. Biomass Research Centre of the Centre for
Research in Energy and Energy Conservation (CREEC), Makerere University
– College of Engineering, Design, Art and Technology, Kampala, Uganda,
August 2012.
Value(s) applied 31%
Purpose of data Thermal efficiency of PCS that can be compared with efficiency of aging
project PCS using simple water boiling tests.
Additional comment This parameter is included for suppressed demand calculations.
D.2. Data and parameters monitored
Data/Parameter fNRB
Unit Percent
Description Non-renewability status of woody biomass fuel for the project in monitoring
period 2.
Measured/Calculated/
Default
Default
Source of data CDM – SSC WG Thirty fifth meeting report, Annex 20, page 4 (February
2012).
Value(s) of monitored
parameter
81%
Monitoring equipment
Measuring/Reading/
Recording Frequency
Fixed by baseline study for a given crediting period, updated if necessary
QA/QC procedures Transparent data analysis and reporting
Purpose of data Calculation of baseline emissions.
Additional comment 73.82% was the value used in registered PDD Version 3 from Baseline Study
conducted by PP (section B.2.2 in PDD); At registration and verification
(FAR1) PP asked to be replace fNRB by “a more actual official credible
value as soon as a value is publicly available for the republic of
Malawi”.81% is the value used in registered PDD Version 6, page 25 with
confirmation of acceptance by Malawi’s DNA, the Environmental Affairs
Department, on 15 June 2012 as the default value of non-renewable biomass
(fNRB) for the Republic of Malawi.
UNFCCC/CCNUCC
CDM – Executive Board Page 15
Data/Parameter PP, ICS, 2013
Unit Kg / adjusted adult meal
Description Quantity of fuel that is consumed in the project scenario for ICS in year 0
(when project ICSs were first disseminated)
Measured/Calculated/
Default
Measured
Source of data Average of Project PFT for ICS in 2011 and Project PFT for ICS in
September 2013 – October 2013.
Value(s) of monitored
parameter
0.0538 Kg / adjusted adult meal
Monitoring equipment Generic spring-dial hoist scales (100 kg capacity, precision of 0.5 kg)
Measuring/Reading/
Recording frequency
Updated every 2 years, or more frequently
Calculation method (if
applicable)
Wood is weighed at the start and the end of each day for three consecutive
feeding days.
2011 KPT value = 0.0854 kg / adjusted adult meal
2013 KPT value = 0.0223 kg / adjusted adult meal
Average = (0.0854 + 0.023)/2 = 0.0538 kg / adjusted adult meal
QA/QC procedures Pre-testing conducted to train enumerators; paired tests to minimise external
factors, large sample (n=93 (3 days info from 31 institutions)) used to
minimise bias.
To normalise different types of meals into person-meals or adult equivalent
meals, adjustment factors are presented in person meal parameter presented in
data and parameters fixed ex-ante above.
Purpose of data Calculation of project emissions
Additional comment
Data/Parameter EffP,ICS
Unit tonnes wood / 10,000 meals
Description Efficiency of aging project ICS
Measured/Calculated/
Default
Calculated
Source of data Average of Project PFT for ICS in 2011 and Project PFT for ICS in September
2013 – October 2013
Value(s) of monitored
parameter
EffP,ICS,0-1 = 0.538 tonnes wood / 10,000 meals
EffP,ICS,1-2 = 0.538 tonnes wood / 10,000 meals
UNFCCC/CCNUCC
CDM – Executive Board Page 16
EffP,ICS,2-3 = 0.538 tonnes wood / 10,000 meals
EffP,ICS,3-4 = 0.538 tonnes wood / 10,000 meals
Monitoring equipment Generic spring-dial hoist scales (100 kg capacity, precision of 0.5 kg)
Measuring/Reading/
Recording frequency
Every 2 years
Calculation method (if
applicable)
Wood is weighed at the start and the end of each day for three consecutive
feeding days.
2011 KPT value = 0.0854 kg / adjusted adult meal
2013 KPT value = 0.0223 kg / adjusted adult meal
Average = (0.0854 + 0.022)/2 = 0.0538 kg / adjusted adult meal
QA/QC procedures Pre-testing conducted to train enumerators; paired tests to minimise external
factors, large sample (n=93 (3 days info from 31 institutions)) used to
minimise bias.
To normalise different types of meals into person-meals or adult equivalent
meals, adjustment factors are presented in person meal parameter presented in
data and parameters fixed ex-ante above.
Purpose of data Calculation of project emissions
Additional comment
Data/Parameter UP, PCS
Unit Percent
Description Single Weighted Usage Parameter for PCS age 0-4 in year 5 of the project.
Based on cumulative usage rate for technologies in project scenario PCS.
Usage of stoves over time to determine project fuel consumption for PCS
users.
Measured/Calculated/
Default
Calculated
Source of data Usage surveys for PCS in November 2013.
Value(s) of monitored
parameter
70.32%
Monitoring equipment
Measuring/Reading/
Recording frequency
Annual or more frequently, in all cases on time for any request for Issuance.
One Usage Survey per monitored household.
Calculation method (if
applicable)
Usage rates for PCS of each age group taken as percentage of stoves in use
with 90 % confidence intervals. A normal linear regression model was fitted
to the data to determine the trend.
UP, PCS, 0-1 = 85.7% (after 6 months)
UP, PCS, 1-2 = 76.9% (after 18 months)
UNFCCC/CCNUCC
CDM – Executive Board Page 17
UP, PCS, 2-3 = 68.2% (after 30 months)
UP, PCS, 3-4 = 59.4% (after 42 months)
Single weighted usage parameter is the sum of products of usage rates and %
of total technology days for PCS of each age group:
= (% of technology days age 0-1 * 85.7%) + (% of technology days age 1-2 *
76.9%) + (% of technology days age 2-3 * 68.2%) + (% of technology days
age 3-4 * 59.4%)
QA/QC procedures Pre-testing conducted to train enumerators; large sample (n=144) used to
minimise bias.
Purpose of data Calculation of emission reductions
Additional comment The data was tested for dependency and both the autocorrelation and partial
autocorrelation were not significant. Therefore, time series models
(autoregressive and moving average models) could not be fit to the data.
Data/Parameter UP, ICS
Unit Percent
Description Single Weighted Usage Parameter for ICS ages 0-4 in year 5 of the project.
Based on cumulative usage rate for technologies in project scenario ICS.
Usage of stoves over time to determine project fuel consumption for ICS
users.
Measured/Calculated/
Default
Calculated
Source of data Usage and monitoring surveys September – October 2013
Value(s) of monitored
parameter
89.4%
Monitoring equipment
Measuring/Reading/
Recording frequency
Annual or more frequently, in all cases on time for any request for issuance.
One Usage Survey per monitored institution.
Calculation method (if
applicable)
Percentage of stoves in use
UP, ICS, 0-1 = 100% (after 6 months)
UP, ICS, 1-2 = 89% (after 18 months)
UP, ICS, 2-3 = 75% (after 30 months)
UP, ICS, 3-4 = 100% (after 42 months) – Note that this is because there is only
one stove in this age group and it is still in use.
Single weighted usage parameter is the sum of products of usage rates and %
of total technology days for ICS of each age group:
UNFCCC/CCNUCC
CDM – Executive Board Page 18
= (% of technology days age 0-1 * 100%) + (% of technology days age 1-2 *
89%) + (% of technology days age 2-3 * 75%) + (% of technology days age
3-4 * 100%)
QA/QC procedures
Purpose of data Calculation of emission reductions
Additional comment
Data/Parameter NPCS, y
Unit Technology days
Description Technology days in the project database for the project scenario PCS through
year. Used to calculate emission reductions.
Measured/Calculated/
Default
Calculated
Source of data Total sales record. Calculated from day after technology is disseminated for
specific monitoring periods (all dates inclusive).
Value(s) of monitored
parameter
NPCS, 02/10/2012 – 01/10/2013 = 7,979,987 technology days
Monitoring equipment
Measuring/Reading/
Recording frequency
Continuous
Calculation method (if
applicable)
Technology days = number of devices * number of days in use for current
monitoring period
QA/QC procedures Transparent data analysis and recording
Purpose of data Calculation of emission reductions
Additional comment
Data/Parameter NICS, y
Unit Technology days
Description Technology days in the project database for the project scenario ICS through
year. Used to calculate emission reductions.
Measured/Calculated/
Default
Calculated
UNFCCC/CCNUCC
CDM – Executive Board Page 19
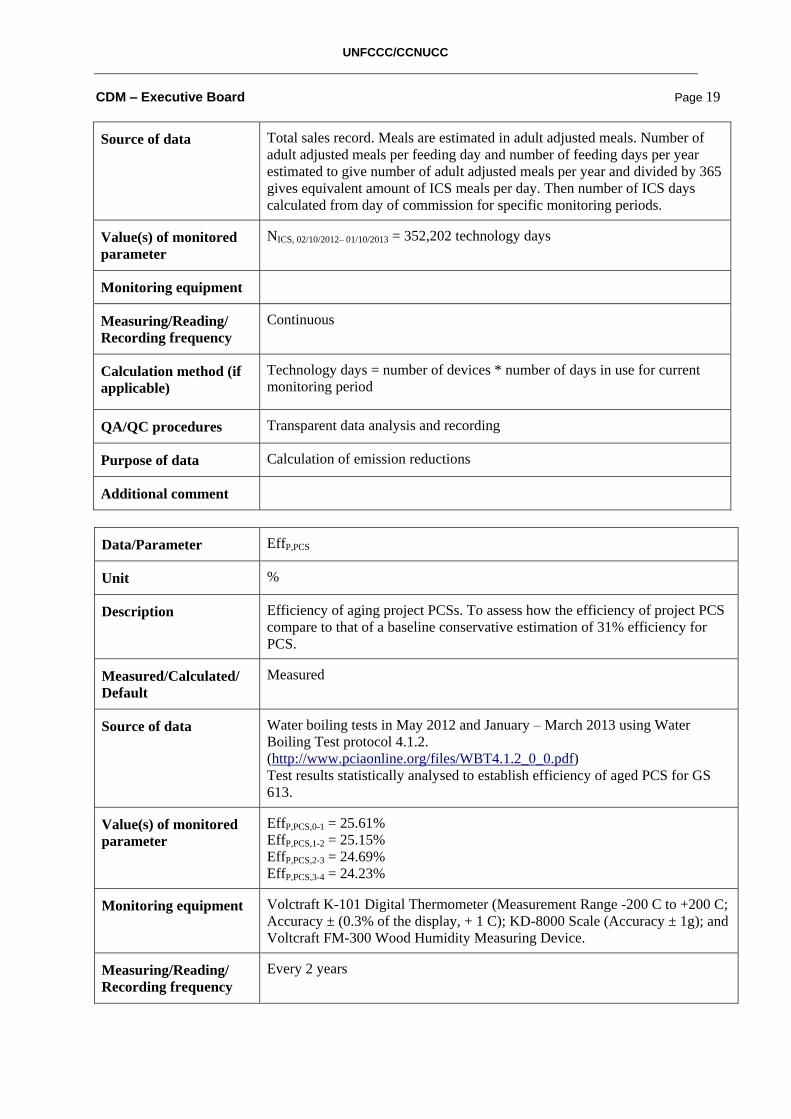
Source of data Total sales record. Meals are estimated in adult adjusted meals. Number of
adult adjusted meals per feeding day and number of feeding days per year
estimated to give number of adult adjusted meals per year and divided by 365
gives equivalent amount of ICS meals per day. Then number of ICS days
calculated from day of commission for specific monitoring periods.
Value(s) of monitored
parameter
NICS, 02/10/2012– 01/10/2013 = 352,202 technology days
Monitoring equipment
Measuring/Reading/
Recording frequency
Continuous
Calculation method (if
applicable)
Technology days = number of devices * number of days in use for current
monitoring period
QA/QC procedures Transparent data analysis and recording
Purpose of data Calculation of emission reductions
Additional comment
Data/Parameter EffP,PCS
Unit %
Description Efficiency of aging project PCSs. To assess how the efficiency of project PCS
compare to that of a baseline conservative estimation of 31% efficiency for
PCS.
Measured/Calculated/
Default
Measured
Source of data Water boiling tests in May 2012 and January – March 2013 using Water
Boiling Test protocol 4.1.2.
(http://www.pciaonline.org/files/WBT4.1.2_0_0.pdf)
Test results statistically analysed to establish efficiency of aged PCS for GS
613.
Value(s) of monitored
parameter
EffP,PCS,0-1 = 25.61%
EffP,PCS,1-2 = 25.15%
EffP,PCS,2-3 = 24.69%
EffP,PCS,3-4 = 24.23%
Monitoring equipment Volctraft K-101 Digital Thermometer (Measurement Range -200 C to +200 C;
Accuracy ± (0.3% of the display, + 1 C); KD-8000 Scale (Accuracy ± 1g); and
Voltcraft FM-300 Wood Humidity Measuring Device.
Measuring/Reading/
Recording frequency
Every 2 years

UNFCCC/CCNUCC
CDM – Executive Board Page 20
Calculation method (if
applicable)
QA/QC procedures Training and pre-testing of protocol. Use of accurate equipment that was
recently calibrated in factory.
Purpose of data Calculation of emission reductions
Additional comment This parameter is included for suppressed demand calculations as per GS613
PDD Version 6 Annex 5. The efficiency for each age is used in calculation of
ER calculations expressed in “tonnes CO2 / HH / day” columns in the “ER
Calcs” Excel database for each technology being credited. Calculations are as
follows:
ER / hh / day = (UP,PCS,Y * (Pb,y * (1 – (Effb,y / EffP,PCS,Y))) / 365
Data/Parameter Bpj,y
Unit Tonnes of dry biomass
Description Monitored consumption of fuels over time. Tonnes of dry biomass used in
the project for technology and fuel combination pj in year y
Measured/Calculated/
Default
Calculated
Source of data (i) Baseline Field Test (BFT) for PCS, and
(ii) Project Field Test for PCS users 2 years after purchasing PCS; April 2009
and April 2011
Monitoring equipment: Voltcraft FM-300 Wood Humidity Measuring
Device; Voltcraft digital hanging scales to weigh biomass; Biomass
consumption and moisture content are monitored and measured using
protocols prescribed in the methodology
Value(s) of monitored
parameter
1.6895 Tonnes of dry biomass = ((1.566 + 1.813 tonnes biomass)/2)
Monitoring equipment Voltcraft FM-300 Wood Humidity Measuring Device; Voltcraft digital
hanging scales to weigh biomass;
Measuring/Reading/
Recording frequency
Fixed updated baseline; BPY
Calculation method (if
applicable
QA/QC procedures Trained enumerators, sufficiently large sample.
Purpose of data Calculations for suppressed demand
Additional comment This parameter is included for suppressed demand calculations.
Baseline wood use = Bpj,y * (Eff p,y / Eff b,y)
Baseline emissions (Effb,y) = Baseline wood use * Emission factor of

UNFCCC/CCNUCC
CDM – Executive Board Page 21
baseline and project fuel
Effb,y ultimately used in ER calculations as follows :
ER / hh / day = (UP,Y * (Pb,y * (1 – (Effb,y / EffP,Y))) / 365
To be updated for MR4.
Data/Parameter LEp,MR4
Unit %
Description Leakage in project scenario during year 02/10/2012 – 01/10/2013
Measured/Calculated/
Default
Calculated
Source of data PCS Usage and Monitoring surveys – November 2013
ICS Usage and Monitoring Surveys 2013
Value(s) of monitored
parameter
PCS – 5%
ICS – 10%
Monitoring equipment
Measuring/Reading/
Recording frequency
Every 2 years
Calculation method (if
applicable)
Leakage was taken as 5% of gross PCS emission reductions to account for
user households which also retain use of their baseline stoves, and 10% of
gross ICS emission reductions to account for retained use of baseline stoves.
QA/QC procedures Transparent data analysis and reporting
Purpose of data Calculation of emission reductions
Additional comment Leakage assessed is reported every 2 years and thus far has been reported as
a zero value.
Aggregate leakage is assessed for multiple project scenarios through ongoing
monitoring surveys for each of the project technologies, dates of which are
reported above. To date the only source of leakage which has been identified
is the continued use of the baseline stove together with the project stove in
some households. No households claim to use the stoves for any purpose
other than cooking and heating water (no space heating). Please see Part IV.4
for further discussion on leakage.

UNFCCC/CCNUCC
CDM – Executive Board Page 22
Monitoring Results for Gold Standard Sustainability Indicators as per GS613 Passport Version
4 (Gold Standard Requirement)
Indicator Data type Data
variable
Data unit Value Source
Air quality Survey and/or
PM
concentrations
Air pollutants
(CO,
particulates)
Survey
observations
and /or
indoor air
pollution
Qualitative: 100% of survey respondents
stated that there is less smoke from devices
promoted by the project In the Kitchen
Survey for PCS conducted in November
2013. 95% of ICS surveyed users also claim
that there is less smoke in the kitchen with
this project stove
Quantitative: Air quality tests carried out in
2009 reveal an average reduction of 41% in
PM concentrations for PCS users.
PCS KS results
excel.
ICS KS results
excel.
Water
quality and
quantity
Survey Soil erosion /
river siltation
-mitigated
due to
reduction in
tree-felling.
Proper use
of devices
Sales data
All end-users are using improved devices
properly and are generating wood fuel
savings.
Shire river produces most of Malawi’s
hydro electricity and has been identified by
Malawi’s National Adaptation Programme
of Action (NAPA) as a region where
reforestation should be prioritised.
Approximately 26,730 households that have
accessed PCS are located in the Upper Shire
region in keeping with priorities of NAPA.
It is assumed that wood savings translate
into reduced tree felling or a reduction in
the increase of tree felling associated with
current trends in deforestation and increased
pressure on natural resources.
PCS KS results
excel.
Note – positive
impact of ICS
use not
included
Soil
condition
Survey Soil quality at
a community
level - Soil
condition
enhanced due
to reduced
soil erosion.
Clay
collection
for use as an
input into
stove
production.
Sources of clay for all PCS production
centres monitored.
Reduced wood harvests and associated
reduction in deforestation, which is the
norm, are likely not to deteriorate soil
quality.
Clay
monitoring
excel.
Biodiversity Surveys Alteration
and
destruction of
natural
habitat
mitigation
Proper use
of stoves
Reduced pressure on natural resources can
improve the integrity of natural habitat for
flora and fauna.
26,730 households using improved Cook
Stoves and 101 institutions using improved
Institutional cook stoves contribute
positively to reducing pressure on natural
resources.
PCS KS results
excel, ICS KS
excel.
Quality of
employmen
t
Policies Provision of
health
insurance for
Project Staff
Project staff
with health
insurance.
All staff employed directly by the project
are covered with health insurance
Area 55
General
Policies and
Procedures
Livelihood
of the poor
Survey Financial
impact (Note:
savings
MK (Malawi
Kwacha)
saved per
From the devices disseminated by the
project to date:
Livelihood of
poor excel,
PCS KS results

UNFCCC/CCNUCC
CDM – Executive Board Page 23
estimated are
only
economic
estimation of
wood savings
and not real
monetary
saving for
households
since the
wood is
mostly
collected and
not
purchased).
year
Savings of wood is valued at MK 270
million p.a.
Savings of labour in terms of cooking time
savings and fuel collection savings is valued
at MK 180 million p.a.
excel.
Access to
affordable
and clean
energy
services
Monitoring of
sales
Access to
clean
technologies
Number of
stoves and
rocket barns
sold.
Up to 26,730 households have accessed
affordable and appropriate PCS.
101 institutions are using 260 improved
institutional stoves.
PCS Sales
Records (from
November 24
2008 to
September
9,2012),
ICS Sales
Records (from
November 24,
2008 to
October 1,
2013)
Human and
Institutional
capacity
Survey Numbers Trainees,
employees
with new
skills
450 people trained in various new skills –
stove production, promotion, sales,
environmental education, business, database
management, geographic information
systems, data collection and project
monitoring. 67% of all direct employment
are female.
Employment
and skills
development
excel.
Quantitative
employmen
t and
income
generation
Survey Numbers –
job creation
Jobs / year The project is generating income for 450
people (94% in rural areas, 6% in urban)
Employment
and skills
development
excel.
Balance of
payments &
investment
Clay
monitoring
info and
example
invoices from
new
companies
Increased
investment in
dissemination
of improved
devices
New
businesses.
New
production
groups.
The PP makes direct foreign investment for
project implementation.
New groups
documented in
clay
monitoring
excel.
Technology
transfer &
technologic
al self-
reliance
Total sales
records
Disseminatio
n record
Number of
stoves and
rocket barns
sold.
As in access to clean technologies above. PCS Sales
Records (from
November 24
2008 to
September
8,2012),
ICS Sales
Records (from
November 24,
2008 to
October 1,
2013)

UNFCCC/CCNUCC
CDM – Executive Board Page 24
D.3. Implementation of sampling plan
For MP4 both usage and monitoring surveys and kitchen performance tests were required for the ICS.
Since the KPT requires the enumerator to visit the same institutions each day for 4 consecutive days,
emphasis was placed on reaching institutions [and stoves] in relatively close proximity to one another.
A random sample was not conducted; rather, great effort was made to reach as many institutions and
stoves as possible within the districts with the greatest concentration of stoves. In total, institutions
and stoves from 5 districts representative of Central and Southern region were surveyed and tested.
For the PCS, over 90% of the stoves sold are in a concentrated area within 3 – 4 TAs (Traditional
Authorities) that consist of more than 800 villages in 3 of the 30 districts of Malawi. As per FAR Q1
of MR3, a simple random sample was used for usage and monitoring surveys and to assess average
stove lifespan. The simple random sample was first applied to the GVHs (a purely random sample
from the total sales record would present enormous financial and logistical challenges) to obtain
between three and five GVHs with the highest numbers of stoves per age group, and then to all stoves
from those GVHs in the total sales record to obtain a minimum of 40 households for survey. (Previous
sampling was based on discussions with field officers and as allowed by the Methodology6: five
geographic jurisdictions locally called Group Village Headman (GVH) each containing on average 10
villages, were selected as being representative of 800-plus villages and users of technologies of each
age were random sampled from this cluster. This approach was justified as the villages share very
similar socioeconomic, cultural, climatic, geographic and altitudinal characteristics. This approach
also facilitated efficient and effective monitoring in terms of time, effort and financial costs.)
For PCS domestic stoves demand is seasonal and dissemination is not evenly distributed throughout
the year, which complicated calculating usage at time intervals of 6 months, 18 months and 30
months. The results of the usage surveys in MP4 were similar to those in MP3; therefore, the PP
continues to use the stove lifespan as per regression analysis in MP3 conducted by qualified
statisticians to calculate usage at the various time intervals to ensure conservativeness in all
calculations of fuel savings and emission reductions.
In all cases the minimum sample sizes have been met, where possible, and in some cases there has
been over-sampling for PCS. Minimum sample sizes were been met in 3 of 4 cases for the ICS due to
slow uptake in the first 3 years of the project.
Water boiling tests have been conducted for aging PCS. Stoves of various ages were randomly
selected from one village and the users were asked to give up their old stoves in return for a new
stove. Water boiling tests will be continually conducted using a similar approach for aging stoves.
In terms of the desired precision for wood savings estimations, the “90 : 30” rule has been satisfied
for all technologies.
A new implementation schedule was presented in the revised monitoring plan of MR3, which plans
for GS 613 to conform with “Technologies and Practices to Displace Decentralised Thermal Energy
Consumption (11/04/2011).”
SECTION E. Calculation of emission reductions or GHG removals by sinks
Emission reduction calculation follows Gold Standard methodology Technologies and Practices to
Displace Decentralised Thermal Energy Consumption (11/04/2011); calculation steps are detailed in
GS613 PDD V6 (Date November 2, 2012).
E.1. Calculation of baseline emissions or baseline net GHG removals by sinks
6 Page 23, Section C. (a) Ongoing Monitoring Studies

UNFCCC/CCNUCC
CDM – Executive Board Page 25
For the two technologies currently promoted by GS 613, the baseline fuel (i.e. woody biomass) and
the project fuel (i.e. woody biomass) are the same, the baseline and project emission factors are the
same.
From October 2, 2012 – December 31, 2012:
EFb, wood, CO2 = EFp, wood, CO2 = 1.747 tCO2/t wood
EFb, wood, nonCO2 = EFp, wood, nonCO2 = 0.455 tCO2/t wood
fNRBi,p = fNRBi,b = 0.81
In the baseline and project scenarios the combined CO2 and non-CO2 emission factor for wood is:
= ((1.747 * 0.81) + 0.455) tCO2/t wood
= 1.870 tCO2/t wood
From January 1, 2013 – October 1, 2013:
EFb, wood, CO2 = EFp, wood, CO2 = 1.747 tCO2/t wood
EFb, wood, nonCO2 = EFp, wood, nonCO2 = 0.529 tCO2/t wood
fNRBi,p = fNRBi,b = 0.81
In the baseline and project scenarios the combined CO2 and non-CO2 emission factor for wood is:
= ((1.747 * 0.81) + 0.529) tCO2/t wood
= 1.944 tCO2/t wood
Before considering SD Adjusted Baseline considering Suppressed Demand
HH
stove
Tons_wood / HH p.a. Savings Fuel efficiency Tons_wood / HH p.a.
Pb,0 Pp,0 Pb,0-Pp,0 % Default value CREEC, 2012 B pj, 2011 B pj,
2009
Pb,0,SD
Effb,y Effp,y,0
PCS 2.561 1.566 0.995 39% 10% 31% 1.813 1.6895 5.237
Table 3: Comparison of domestic stoves in tonnes_wood / HH p.a.
Table 3: Comparison of domestic stoves in tonnes_wood / HH p.a.Table 3 above clearly shows that of
the PCS domestic stove promoted by GS 613 has a low project consumption and high percentage
project savings relative to the baseline.
The project applies the suppressed demand approach, with the suppressed demand adjusted baseline
consumption of 5.237 tonnes_wood / HH p.a. which is equivalent to baseline domestic stove
emissions of 9.793 tCO2eq / HH p.a. up to December 31, 2012; and 10.180 tCO2eq / HH p.a.
beginning January 1, 2013, as per calculations below:
Suppressed demand adjusted baseline consumption x Emission Factor of Baseline and Project Fuels
From October 2, 2012 – December 31, 2012:
5.237 tonnes_wood/HH/year x 1.870 tonnes_CO2e/tonne_biomass = 9.793 tCO2eq/HH/year
From January 1, 2013 – October 1, 2013:
5.237 tonnes_wood/HH/year x 1.944 tonnes_CO2e/tonne_biomass = 10.180 tCO2eq/HH/year
For institutional cook stoves, baseline and project emissions are based on adjusted adult meals, where
children’s meals and light meals (e.g. teas) are normalised to be on the same metric as adult meals.
Baseline consumption of wood for one adult meal was 60.2 g_wood / adjusted adult meal, which is

UNFCCC/CCNUCC
CDM – Executive Board Page 26
equivalent to 6.739 tCO2eq / 10,000 adjusted adult meals. up to December 31, 2012, and 7.006
tCO2eq / 10,000 adjusted adult meals beginning January 1, 2013, as per calculations below:
From October 2, 2012 – December 31, 2012:
3.604 tonnes_wood/10,000 meals x 1.870 tonnes_CO2e/tonne_biomass = 6.739 tCO2eq/HH/year
From January 1, 2013 – October 1, 2013:
3.604 tonnes_wood/10,000 meals x 1.944 tonnes_CO2e/tonne_biomass = 7.006 tCO2eq/HH/year
Baseline emissions in absence of project activity shown below:
MR1 MR2 MR3
Offset vintage Device Devices sold24/11/2008 -
1/10/2010
2/10/2010 -
1/10/2011
2/10/2011 -
1/10/2012
2/10/2012 -
31/12/2012
1/1/2013 -
1/10/2013Total
PCS 1,767 5,431 10,636 10,033 2,630 4,726 33,456
RB 153 4,197 4,339 4,424 0 0 12,960
PCS 5,308 5,193 34,421 31,104 7,901 24,548 103,168
FES 1,524 3,633 6,380 0 0 0 10,013
UCS 51 310 0 0 0 310
ICS 1 7 9 2 5 23
RB 588 20,323 18,374 17,008 0 0 55,704
PCS 5,839 24,907 35,194 8,806 27,563 96,469
FES 862 3,126 1,797 0 0 4,923
UCS 204 578 0 0 0 578
ICS 102 198 756 154 482 1,589
RB 211 5,835 5,616 0 0 11,451
PCS 7,228 9,873 11,036 34,544 55,454
ICS 697 1,047 3,278 4,325
PCS 0 0 0 0
ICS 57 341 0 341
PCS 6,588 0 14,919 14,919
ICS 399 673 0
38,777 109,111 115,812 31,917 110,738 405,682
Monitoring period
MR4
341
169,218
115,010
59,779
46,415
14,919
2/10/2012 -
31/12/2012
1/1/2013 -
1/10/2013
2/10/2009 -
1/10/2010
2/10/2010 -
1/10/2011
2/10/2011 -
1/10/2012
Baseline Emissions (tCO2e)
Carbon flows
24/11/2008 -
1/10/2009
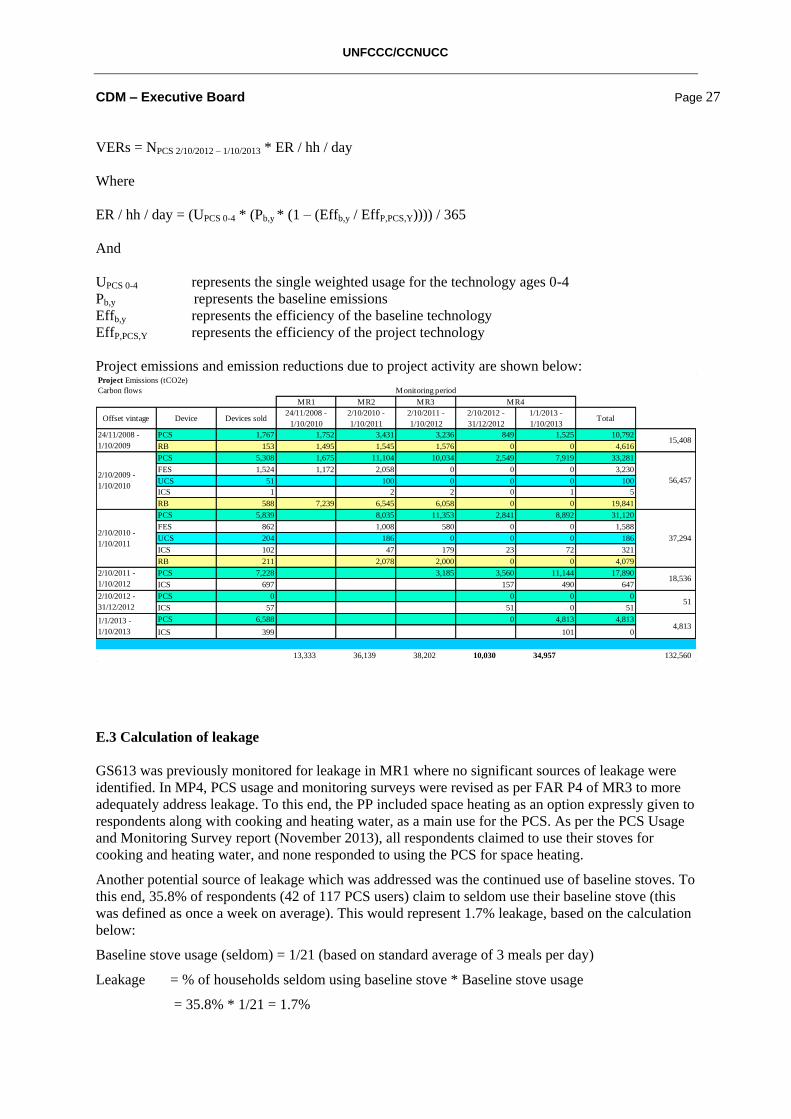
E.2 Calculation of project emissions or actual net GHG removals by sink
Project emissions are calculated for PCS as per Annex 5 of the GS 613 PDD V 6:
Project Fuel Consumption * Emission Factor of Project Fuel
Ending December 31, 2012 = 1.690 tonnes_wood / hh year * 1.870 = 3.15
Beginning January 1, 2013 = 1.690 tonnes_wood / hh / year * 1.944 = 3.28
For ICS, project emissions are calculated per 10,000 meals in a similar way:
Project Fuel Consumption (per 10,000 meals) * Emission Factor of Project Fuel
Ending December 31, 2012 = 0.5387 tonnes_wood / 10,000 meals * 1.870 = 1.007 tCO2e / 10,000
meals
Beginning January 1, 2013 = 0.538 tonnes_wood / 10,000 meals * 1.944 = 1.047 tCO2e / 10,000
meals
The ERs achieved during the monitoring period are the sum of calculations for each technology (less
leakage) using the formula below:
7 0.602 tonnes wood per 10,000 meals is the average of 2011 project KPT result 0.854 tonnes wood used per
10,000 meals and the 2013 project KPT result 0.350 tonnes wood used per 10,000 meals, in keeping with
conservative approach of project.
UNFCCC/CCNUCC
CDM – Executive Board Page 27
VERs = NPCS 2/10/2012 – 1/10/2013 * ER / hh / day
Where
ER / hh / day = (UPCS 0-4 * (Pb,y * (1 – (Effb,y / EffP,PCS,Y)))) / 365
And
UPCS 0-4 represents the single weighted usage for the technology ages 0-4
Pb,y represents the baseline emissions
Effb,y represents the efficiency of the baseline technology
EffP,PCS,Y represents the efficiency of the project technology
Project emissions and emission reductions due to project activity are shown below:
MR1 MR2 MR3
Offset vintage Device Devices sold24/11/2008 -
1/10/2010
2/10/2010 -
1/10/2011
2/10/2011 -
1/10/2012
2/10/2012 -
31/12/2012
1/1/2013 -
1/10/2013Total
PCS 1,767 1,752 3,431 3,236 849 1,525 10,792
RB 153 1,495 1,545 1,576 0 0 4,616
PCS 5,308 1,675 11,104 10,034 2,549 7,919 33,281
FES 1,524 1,172 2,058 0 0 0 3,230
UCS 51 100 0 0 0 100
ICS 1 2 2 0 1 5
RB 588 7,239 6,545 6,058 0 0 19,841
PCS 5,839 8,035 11,353 2,841 8,892 31,120
FES 862 1,008 580 0 0 1,588
UCS 204 186 0 0 0 186
ICS 102 47 179 23 72 321
RB 211 2,078 2,000 0 0 4,079
PCS 7,228 3,185 3,560 11,144 17,890
ICS 697 157 490 647
PCS 0 0 0 0
ICS 57 51 0 51
PCS 6,588 0 4,813 4,813
ICS 399 101 0
13,333 36,139 38,202 10,030 34,957 132,560
18,536
2/10/2012 -
31/12/201251
1/1/2013 -
1/10/20134,813
Monitoring period
15,408
56,457
37,2942/10/2010 -
1/10/2011
2/10/2011 -
1/10/2012
Carbon flows
MR4
Project Emissions (tCO2e)
24/11/2008 -
1/10/2009
2/10/2009 -
1/10/2010
E.3 Calculation of leakage
GS613 was previously monitored for leakage in MR1 where no significant sources of leakage were
identified. In MP4, PCS usage and monitoring surveys were revised as per FAR P4 of MR3 to more
adequately address leakage. To this end, the PP included space heating as an option expressly given to
respondents along with cooking and heating water, as a main use for the PCS. As per the PCS Usage
and Monitoring Survey report (November 2013), all respondents claimed to use their stoves for
cooking and heating water, and none responded to using the PCS for space heating.
Another potential source of leakage which was addressed was the continued use of baseline stoves. To
this end, 35.8% of respondents (42 of 117 PCS users) claim to seldom use their baseline stove (this
was defined as once a week on average). This would represent 1.7% leakage, based on the calculation
below:
Baseline stove usage (seldom) = 1/21 (based on standard average of 3 meals per day)
Leakage = % of households seldom using baseline stove * Baseline stove usage
= 35.8% * 1/21 = 1.7%

UNFCCC/CCNUCC
CDM – Executive Board Page 28
1.7% of survey respondents (2 of 117 PCS users) claim to use their baseline stoves often (defined as
at least once every 2 days). This would represent an additional 0.28% leakage, based on the
calculation below:
Baseline stove usage (often) = 3.5/21 = 16.6%
Leakage = % of households using baseline stove often * Baseline stove usage
= 1.7% * 16.6% = 0.28%
Total leakage as per PCS usage and monitoring surveys (November 2013) = 1.7% + 0.28% = 1.98%
The PP has opted to apply 5% leakage to the overall ERs for PCS households so that its estimations of
emission reductions remain conservative.
For ICS, the annual survey revealed that 25% of institutions using the ICS were also using baseline
stoves. If we assume that each institution used 1 baseline stove for every 3 ICS stoves, representing
25% of total usage, leakage is calculated at 6.25%. The PP has conservatively applied a 10% leakage
factor.
The following possible sources of leakage continue to be monitored in annual Monitoring and Usage
Surveys, and Project Field Performance Tests:
Increased use of non-renewing biomass as a result of savings in woodfuel use. Evidence from
the baseline kitchen surveys and tests demonstrate (i) increasing scarcity of wood and (ii)
increasing price of woodfuel. Avoided consumption should also be considered in a context
where basic energy needs are not being met in baseline scenarios.
Users of efficient stoves replace lower emissions technology than the improved stove. For
example, switching from inefficient fuelwood to efficient charcoal can yield an increase in
overall emissions in some cases. There is also evidence from the baseline Kitchen Surveys
and Tests for the portable ceramic stove in Balaka that some of the few rural households that
were using charcoal during the baseline shifted to use of wood fuel with lower net GHG
emissions. GS 613 does not promote the use of charcoal or appliances that use charcoal; and
its fuel-efficient wood-burning devices aim to discourage the use of charcoal, which is
currently harvested unsustainably and produced inefficiently in Malawi.
Improved stove users compensate for loss of the space heating effect of inefficient cook-
stoves by adopting some other form of heating, such as open fires, or by retaining some use of
inefficient stoves. Space heating effect is already duly captured in the KPTs (over a 72-hour
period). The baseline was not conducted in cold period or in high altitude areas thus avoiding
bias in the pre-project consumption. KPTs were conducted in the same season as the baseline
which is appropriate.
The traditional or conventional stoves replaced by the improved stoves are re-used by the
same families or other families in a manner suggesting increased consumption of woodfuel
beyond the baseline demand level. GS 613 predominantly replaces 3-stone fires which are
used by over nine out ten rural households in Malawi (Energy Policy 2003).
Manufacture, distribution, or use of the improved stoves gives rise to new emissions
associated with transport or manufacturing. Wood that is used in the firing of ceramics (e.g.
portable ceramic stove) is negligible (e.g. 2 kg / stove compared to the annual savings (e.g. >1
tonne / stove / year).

UNFCCC/CCNUCC
CDM – Executive Board Page 29
Future offset calculations will be adjusted accordingly if sources of leakage are later identified. It
should be considered that the basic energy needs are not being met in the baseline scenarios and
savings are used to bridge this gap and are unlikely to be wasted or lost through leakages.
E.4 Summary of calculation of emission reductions or net anthropogenic GHG removals by
sinks
Time Period
Baseline
emissions or
baseline net
GHG removals
by sinks
Project
emissions or
actual net
GHG removals
by sinks
5% Leakage
Emission
reductions or
net
anthropogenic
GHG removals
by sinks
(tCO2e) (tCO2e) (tCO2e) (tCO2e)
02/10/2012 –
31/12/2012 31,917.40 10,029.53 3,834.76 18,053.11
01/01/2013 –
01/10/2013 110,738.20 34,956.63 13,338.67 62,442.90
Total 142,655.60 44,986.16 17,173.43 80,496.01
The Project underwent a simple scale reduction and is now within the Small Scale threshold of 80,581
CO2 eq . p.a. (see calculation below):
Using 81% NRB for Malawi the tonnes CO2eq / tonne wood is calculated as:
1.871 using old GWP for N2O and CH4, effective up to December 31, 2012 (applied to the first 91
days (25%) of the 365-day crediting period) and
1.944 using new GWP for N20 and CH4, effective as at January 1, 2013 (applied to the latter 274
days (75%) of the 365-day crediting period)
Weighted average of EF for baseline and project fuels
= (1.870 * 25%) + (1.944 * 75%) = 1.925
15.6GJ/tonne wood * 1000MJ/GJ/3.6MJ/kWh/100,000kWh/GWh
= 0.0043GWh/tonne wood
So 180GWh/year = 41,860 tonnes of wood or,
41,860 tonnes wood/year * 1.925 tonnes CO2/tonne wood
= 80,581 tonnes CO2/year
Total VERs to be claimed in MR4 is 80,496 which is equivalent to 41,816 tonnes wood/year below
the small scale threshold of 41,860 tonnes of wood.
E.5. Comparison of actual emission reductions or net anthropogenic GHG removals by sinks
with estimates in registered PDD
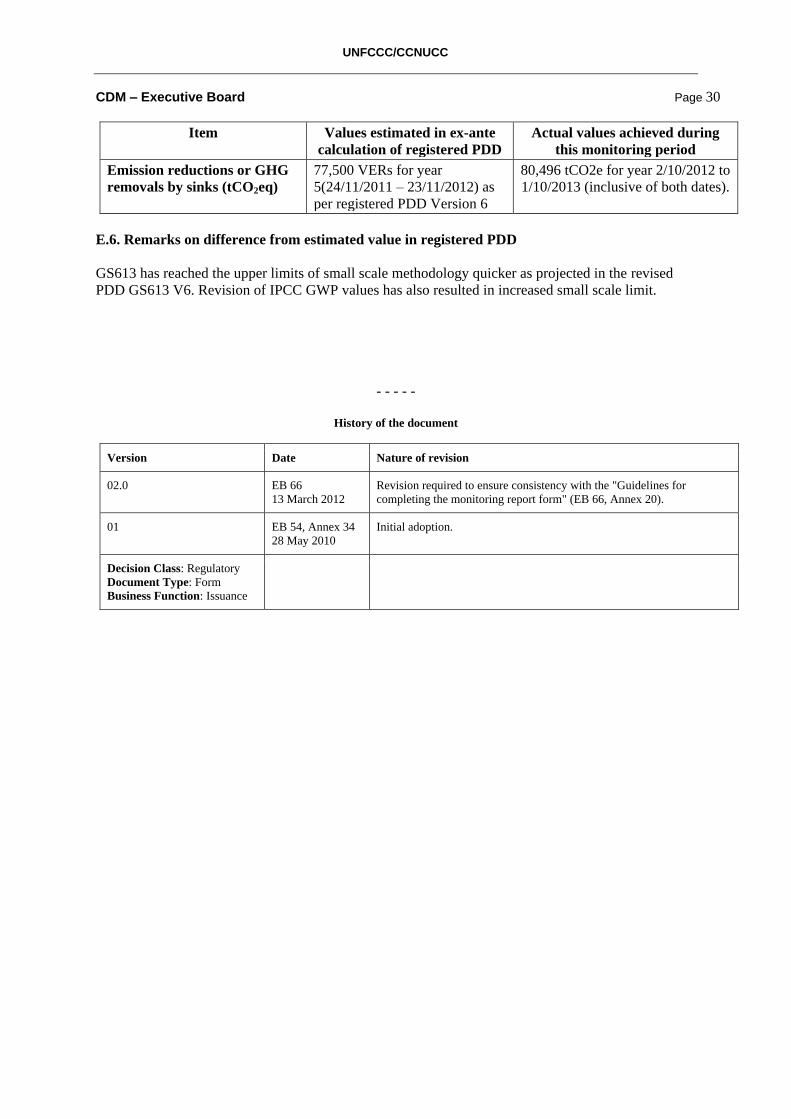
UNFCCC/CCNUCC
CDM – Executive Board Page 30
Item Values estimated in ex-ante
calculation of registered PDD
Actual values achieved during
this monitoring period
Emission reductions or GHG
removals by sinks (tCO2eq)
77,500 VERs for year
5(24/11/2011 – 23/11/2012) as
per registered PDD Version 6
80,496 tCO2e for year 2/10/2012 to
1/10/2013 (inclusive of both dates).
E.6. Remarks on difference from estimated value in registered PDD
GS613 has reached the upper limits of small scale methodology quicker as projected in the revised
PDD GS613 V6. Revision of IPCC GWP values has also resulted in increased small scale limit.
- - - - -
History of the document
Version Date Nature of revision
02.0 EB 66
13 March 2012
Revision required to ensure consistency with the "Guidelines for
completing the monitoring report form" (EB 66, Annex 20).
01 EB 54, Annex 34
28 May 2010
Initial adoption.
Decision Class: Regulatory
Document Type: Form
Business Function: Issuance
UNFCCC/CCNUCC
CDM – Executive Board Page 31
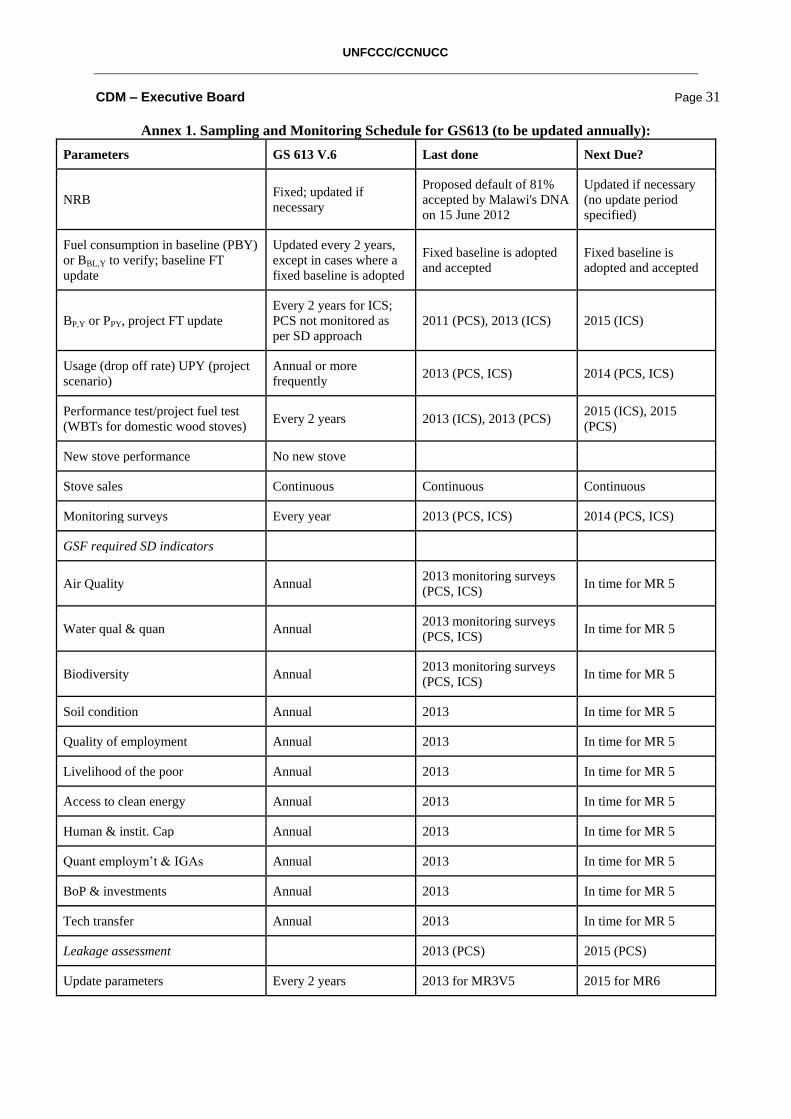
Annex 1. Sampling and Monitoring Schedule for GS613 (to be updated annually):
Parameters GS 613 V.6 Last done Next Due?
NRB Fixed; updated if
necessary
Proposed default of 81%
accepted by Malawi's DNA
on 15 June 2012
Updated if necessary
(no update period
specified)
Fuel consumption in baseline (PBY)
or BBL,Y to verify; baseline FT
update
Updated every 2 years,
except in cases where a
fixed baseline is adopted
Fixed baseline is adopted
and accepted
Fixed baseline is
adopted and accepted
BP,Y or PPY, project FT update
Every 2 years for ICS;
PCS not monitored as
per SD approach
2011 (PCS), 2013 (ICS) 2015 (ICS)
Usage (drop off rate) UPY (project
scenario)
Annual or more
frequently 2013 (PCS, ICS) 2014 (PCS, ICS)
Performance test/project fuel test
(WBTs for domestic wood stoves) Every 2 years 2013 (ICS), 2013 (PCS)
2015 (ICS), 2015
(PCS)
New stove performance No new stove
Stove sales Continuous Continuous Continuous
Monitoring surveys Every year 2013 (PCS, ICS) 2014 (PCS, ICS)
GSF required SD indicators
Air Quality Annual 2013 monitoring surveys
(PCS, ICS) In time for MR 5
Water qual & quan Annual 2013 monitoring surveys
(PCS, ICS) In time for MR 5
Biodiversity Annual 2013 monitoring surveys
(PCS, ICS) In time for MR 5
Soil condition Annual 2013 In time for MR 5
Quality of employment Annual 2013 In time for MR 5
Livelihood of the poor Annual 2013 In time for MR 5
Access to clean energy Annual 2013 In time for MR 5
Human & instit. Cap Annual 2013 In time for MR 5
Quant employm’t & IGAs Annual 2013 In time for MR 5
BoP & investments Annual 2013 In time for MR 5
Tech transfer Annual 2013 In time for MR 5
Leakage assessment 2013 (PCS) 2015 (PCS)
Update parameters Every 2 years 2013 for MR3V5 2015 for MR6