Monitoring of bunker fuel consumption · Monitoring of fuel consumption and GHG emissions from...
34
Monitoring of bunker fuel consumption Report Delft, March 2013 Author(s): Jasper Faber Dagmar Nelissen Martine Smit
Transcript of Monitoring of bunker fuel consumption · Monitoring of fuel consumption and GHG emissions from...

Monitoring of bunker fuel
consumption
Report Delft, March 2013
Author(s): Jasper Faber
Dagmar Nelissen
Martine Smit
2 March 2013 7.A40.0 - Monitoring of bunker fuel consumption
Publication Data
Bibliographical data:
Jasper Faber, Dagmar Nelissen, Martine Smit
Monitoring of bunker fuel consumption
Delft, CE Delft, March 2013
Publication code: 13.7A40.23
CE publications are available from www.cedelft.eu
Commissioned by: T&E and Seas at Risk.
Further information on this study can be obtained from the contact person, Jasper Faber.
© copyright, CE Delft, Delft
CE Delft
Committed to the Environment
CE Delft is an independent research and consultancy organisation specialised in
developing structural and innovative solutions to environmental problems.
CE Delft’s solutions are characterised in being politically feasible, technologically
sound, economically prudent and socially equitable.

3 March 2013 7.A40.0 - Monitoring of bunker fuel consumption
Contents
Summary 5
1 Introduction 7
2 Bunker Delivery Notes 9 2.1 Description of monitoring method 9 2.2 Assessment of monitoring method 9
3 Tank monitoring 13 3.1 Description of monitoring method 13 3.2 Assessment of monitoring method 14
4 Flow meters 19 4.1 Description of monitoring method 19 4.2 Assessment of monitoring method 20
5 Direct emissions monitoring 25 5.1 Description of monitoring method 25 5.2 Assessment of monitoring method 25
6 Conclusions 29
7 Literature 33

4 March 2013 7.A40.0 - Monitoring of bunker fuel consumption

5 March 2013 7.A40.0 - Monitoring of bunker fuel consumption
Summary
Monitoring of fuel consumption and GHG emissions from international shipping
is currently under discussion at the EU level as well as at the IMO. There are
several approaches to monitoring, each with different characteristics.
Important differences exist with regards to the costs of the equipment,
operational costs, the accuracy of the measurements, and the potential to
monitor emissions of gases other than CO2. Moreover, some approaches offer
more opportunities to improve the operational fuel-efficiency of ships and fit
better to possible future policies than others.
Based on a survey of the literature and information from equipment suppliers,
this report analyses the four main methods for monitoring emissions:
1. Bunker delivery notes (i.e. a note provided by the bunker fuel supplier
specifying, amongst others, the amount of fuel bunkered).
2. Tank sounding (i.e. systems for measuring the amount of fuel in the fuel
tanks).
3. Fuel flow meters (i.e. systems for measuring the amount of fuel supplied
to the engines, generators or boilers). And
4. Direct emissions monitoring (i.e. measuring the exhaust emissions in the
stack).
The report finds that bunker delivery notes and tank soundings have the lowest
investment cost. The former because no equipment is needed, the latter
because the majority of ships have tank sounding systems. However, unless
tank sounding is automated, these systems have higher operational costs than
fuel flow meters or direct emissions monitoring because manual readings have
to be entered in monitoring systems. Moreover, manually entering data in
systems may result in errors. The costs of verification could therefore also be
higher.
Fuel flow meters have the highest potential accuracy. Depending on the
technology selected, their accuracy can be an order of magnitude better than
the other systems, which typically have errors of a few percent.
By providing real-time feed-back on fuel use or emissions, fuel flow meters
and direct emissions monitoring provide ship operators with the means to train
their crew to adopt fuel-efficient sailing methods and to optimise their
maintenance and hull cleaning schedules. The latter can, to a lesser extent,
also be provided by tank soundings. However, bunker delivery notes are
unlikely to provide this benefit as bunkerings may be several weeks (and hence
several voyages) apart.
Except for bunker delivery notes, all systems allow for both time-based and
route-based (or otherwise geographically delineated) systems. Because a ship
can sail for several weeks after one bunkering, and is not restricted to routes
or area, bunker delivery notes cannot be used to monitor emissions in a
geographically delineated system.
All systems can monitor CO2 and provide estimates of SO2 emissions. Only
direct emissions monitoring can also monitor other exhaust emissions.

6 March 2013 7.A40.0 - Monitoring of bunker fuel consumption

7 March 2013 7.A40.0 - Monitoring of bunker fuel consumption
1 Introduction
Monitoring of fuel consumption and GHG emissions from international shipping
is currently under discussion at the EU level as well as at the IMO.
The European Commission supports an internationally agreed global solution to
decrease GHG emissions from ships. In October 2012, the European
Commission announced it was preparing a proposal on a monitoring, reporting
and verification (MRV) system for ship emissions based on fuel consumption as
a necessary starting point to further mitigation strategies such as the
development of market-based instruments or ship efficiency measures.
At its sixty-third session the Marine Environment Protection Committee agreed
that the development of an IMO performance standard for fuel consumption
measurement for ships could be a useful tool, that the standard should be
considered at future sessions, and invited further submissions on specific
aspects of such a standard. (MEPC 63/23, 14 March 2012)
In response IMarEST presented an analysis of four approaches for fuel
monitoring in a submission (MEPC 65/INF. 3/Rev.1) to the IMO. The submission
argues that there is a trade-off between accuracy, complexity, and through-
life costs of these four approaches. Not only would their accuracy increase in
the following order of the approaches but also their complexity and through-
life costs:
1. Bunker delivery note (BDN) and periodic stock-takes of tanks.
2. Bunker fuel tank monitoring on-board.
3. Flow metres for applicable combustion processes. And
4. Direct emissions measurement.
The choice of a specific mandatory fuel measurement approach such as those
outlined by IMarEST has direct as well as indirect impacts.
For ship owners two direct impacts are conceivable. On the one hand, they
may have to incur costs for purchasing and installing additional equipment as
well as for monitoring and reporting data. These costs could vary between the
approaches. On the other hand, through this work they might identify
potentially new fuel consumption savings opportunities if the data monitored
provided new and useful insights.
For the shipping market as a whole, monitoring emissions may result in more
transparency about the fuel-efficiency of ships, depending on the
circumstances and on what is being monitored and reported. Charterers could
take better-informed decisions if ship fuel consumption data were publicised.
Last but not least, if the MRV mechanism is considered as a first step towards
a market-based instrument or an efficiency measure, the cost and the burden
of data collection and verification needs to be addressed as it will form part of
the overall evaluation of the system alternatives.
The current choice of a fuel measurement approach could have far-reaching
indirect impacts as it may not only have an impact on the cost-effectiveness
and political acceptability of potential market-based instruments or efficiency
measures but also limit the choice of the potential future instruments.
8 March 2013 7.A40.0 - Monitoring of bunker fuel consumption
In this note we will first describe and then assess the four monitoring
approaches as presented in the IMarEST submission.
The following questions are addressed:
How is data gathered?
Which equipment is needed?
Which data is gathered?
Is there a legal obligation to apply the approach currently?
If not: What is the general practice? Is the approach applied and how
frequently?
In the assessment the following criteria are considered:
1. Accuracy, completeness, consistency:
How accurate is the fuel consumption measurement?
Which part of the on-board fuel consumption can be captured? (e.g. is
the consumption of auxiliary engines and boilers included?)
Is the approach standardized?
Can the monitoring system be bypassed/avoided?
How susceptible to fraud is the approach?
2. Verifiability:
What should ideally be ensured for the verification of the reported
data?
Which options has the verifier to ensure that the reported data is
consistent with the actual fuel consumption?
3. Costs:
Can an estimate be given for the purchasing price of the equipment?
What is the burden for the manning/burden for data collection and
verification?
4. Direct incentive for emissions reduction:
Can the monitored data be expected to incentivize emissions
reductions?
If the fuel consumption data were make public, would the data
publicized help charterers or shippers select the most fuel-efficient
ships?
5. Implication for the choice of market-based measures or efficiency
measures:
Does the monitored data provide sufficient information for a time-
based measure?
Does the monitored data provide sufficient information for a route-
based measure?
As to the last point, the implications for the choice of the MBMs or efficiency
instrument, we naturally focus on the fuel consumption data need.
The additional data needed for efficiency measures e.g. actual or standardized
transport work to which the fuel consumption could relate to is not part of this
study.
In this report, a time-based measure is defined as a measure where the fuel
consumed/the CO2 emitted within a certain time period (e.g. per year) falls
under the regulation, independent of where the fuel has been consumed.
A route-based measure is defined as a measure where only the fuel
consumed/emitted on certain routes or in a certain geographic scope falls
under the regulation.

9 March 2013 7.A40.0 - Monitoring of bunker fuel consumption
2 Bunker Delivery Notes
2.1 Description of monitoring method
There are IMO requirements in force (Regulation 18 of MARPOL Annex VI) that
oblige vessels of 400 GT and above as well as platforms and drilling rigs to
keep a record of the fuel oil that they bunker by means of a bunker delivery
note (BDN).
Although the BDN is currently used for air pollution regulation purposes, it also
contains information that may be used for the monitoring of fuel consumption
in a certain time period and therefore to estimate CO2 emissions.
The BDN is issued by the bunker fuel supplier. The BDN has to contain at least
the following information (MEPC.1/Circ.508):
name and IMO number of receiving ship;
port;
date of commencement of delivery;
name, address and telephone number of marine fuel oil supplier;
product name(s);
quantity (metric tons);
density at 15˚C (kg/m3);
sulphur content (% m/m); and
a declaration signed and certified by the fuel oil supplier’s representative
that the fuel oil supplied is in conformity with regulation 14(1) or (4)(a)and
Regulation 18(1) of MARPOL Annex VI.
According to Regulation 18 of MARPOL Annex VI, the bunker delivery notes
have to be kept on-board for a period of not less than three years following
the delivery.
Note that information on the amount of fuel bunkered within a certain time
frame is not sufficient for determining the amount of fuel that is used within
this time frame because the tanks will most probably not be empty at the
beginning and at the end of this period. Thus to establish a periodic fuel
consumption, stock-takings at the beginning and at the end of the period are
necessary too.
2.2 Assessment of monitoring method
2.2.1 Accuracy, completeness and consistency
Accuracy The accuracy of BDN data varies depending on how the fuel quantity stated on
the BDN is determined. BDNs have an accuracy level of 1 to 5% (Bunkerspot,
2009) and according to Cardiff University (2013), disputes over the quality and
quantity of fuel is common between bunkerers and ship operators.
The BDNs also provide information on the quality of the fuel that is bunkered.
This information is necessary for the calculation of the emissions related to
the bunker fuel consumption.
10 March 2013 7.A40.0 - Monitoring of bunker fuel consumption
Completeness When the fuel consumption of vessels is monitored by means of bunker
delivery notes this ensures that all fuel oil that is used on-board is captured,
no matter for what purpose (e.g. main engine, auxiliary engine, boiler) the
fuel is used.
Consistency Regarding standardisation, the BDN has no specific format but the information
that the BDN should at least contain is prescribed. The BDN is standardized in
the sense that the quantity of the bunker fuel delivered should be given in
metric tonnes and that the testing of the fuel’s density and sulphur content
should be conducted according to certain ISO standards.
The BDN monitoring approach could be undermined in different ways:
1. The documentation presented to the verifier could be incomprehensive,
i.e. not all BDNs of all bunker operations are kept and presented.
2. A falsified BDN could be issued. According to Öko-Institut (2011), the
reliability of BDNs has been questioned by industry representatives due to
possibilities of corruption and falsification (see also Cardiff University,
2013a; 2013b).
3. The marine bunkering reporting mechanism could be circumvented by
using marine heavy fuel oil (HFO) that stems from stocks that were
produced as other heating oil products (Öko-Institut, 2011). For these
products, a bunker delivery note may not be necessary.
2.2.2 Verifiability To verify the reported fuel consumption data it should ideally be ensured that:
1. All BDNs that a ship has received are presented.
2. A ship has received BDNs for all its bunkering operations.
3. The BDNs presented are not falsified.
The verifier has three major options to ensure that the reported data are
consistent with the actual fuel consumed by the ship:
1. The reported data can be cross-checked with other data on fuel
consumption on-board (e.g. in the oil record book or the engine log book)
2. Plausibility tests can be applied either by again using on-board data (e.g.
data on distances covered and by applying an average emission factor) or
by comparing the fuel consumption of the ship under consideration with
the fuel consumption of comparable ships.
3. The bunker fuel suppliers are also obliged to keep copies of the BDNs.
So the accounts and the BDNs kept by the fuel suppliers could be
cross-checked, at least for those bunker fuel suppliers that are located in a
country that has ratified MARPOL Annex VI.1 The lists of bunker fuel
suppliers that national maritime administrations are obliged to establish
according to MARPOL Annex VI, Regulation 18 could be used to this end.
However, the BDNs are frequently supplied by a subcontractor, rather than
the registered bunkerer and the registration number of the bunkerer does
not always appear on the BDN (Cardiff University, 2013a).
Verification could turn out to be difficult when the ship’s copy of a BDN is a
carbon copy. BDNs are frequently hand-written and not always legible,
particularly after a period of storage (Cardiff University, 2013a; 2013b). In this
case one could cross-check the carbon copy of the BDN with the original BDN,
at least if the registration number of the bunkerer is specified. However, that
would require access to BDNs of bunkerers, which could be located in different
parts of the world.
1 In March 2013, 72 countries have ratified the MARPOL Annex VI convention. (IMO, 2013).

11 March 2013 7.A40.0 - Monitoring of bunker fuel consumption
2.2.3 Costs BDNs are already issued and the additional costs of keeping the BDNs are low
but there will be additional costs for reporting, e.g. for entering the BDN
information into a database.
Since conscientious verification would call for cross-checks with bunker fuel
suppliers this could turn out to be complicated, very costly and time-
consuming.
2.2.4 Direct incentive for emissions reductions BDNs (combined with stock-takes) provide an insight into the absolute amount
of fuel consumed by a ship in a specific period of time.
In the following we will discuss whether one can expect that this insight will
directly incentivize additional emissions reductions by prompting either ship
owners or charterers and shippers to take some action.
Regarding ship owners it is very unlikely that the fuel consumption established
by the BDNs constitutes a new insight because fuel consumption is already
regularly monitored and reported within the company; after all BDNs are being
issued and retained already.
But even if the fuel consumption data would constitute a new insight for ship
owners it is not likely that this would trigger direct emissions reductions.
For ship owners to consider taking any additional fuel saving measures due to
the information that becomes available from the BDNs:
1. The fuel consumption established by the BDNs would have to be
unexpectedly high (i.e. outside the common volatility in fuel use due to
operational practices, weather, etc.). And
2. The ship owner would have to be able to profit from potential benefits
(absence of split incentives).
When the second circumstance is available, one can expect the ship owner to
already have taken those operational and technical measures that are widely
acknowledged and proven to be efficient for the vessel under consideration.
But an additional uptake of innovative operational and technical measures can
also not be expected due to the information that becomes available from the
BDNs: There are many factors that determine the fuel consumption of a ship,
such as speed, load and draught conditions, sea conditions, etc. and the
information from the BDNs does neither allow for relating the fuel
consumption to these determinants nor does it give any transparency as to
which purpose the fuel is used on-board (e.g. boiler, auxiliary engines, etc.).
So just knowing the amount of fuel a ship consumes per unit of time does not
provide enough information to detect options for improving the fuel-efficiency
of a ship and to control for the actual change of the fuel-efficiency of a ship if
a measure was taken. So only for owners of vessels engaged in liner shipping or
of ferries with comparable transport work and comparable routes over the
years could the information from the BDNs theoretically lead to fuel-efficiency
improvements. But just as for all other ship owners, it is however very
questionable whether for these sections of the world fleet would the BDNs
provide any additional information.

12 March 2013 7.A40.0 - Monitoring of bunker fuel consumption
For shippers and charterers, the fuel consumption data could constitute an
additional piece of information if the data would become publicly available at
a ship specific level. However, just this information would not be sufficient
because shippers and charterers would want to base their choice of a ship on
the relative energy efficiency of the ships and not on the absolute fuel
consumption data as provided by the BDNs. Just knowing that a ship has used a
certain amount of fuel in a certain year will not allow a charterer to evaluate
a ship’s performance, since he does not have information on its load
conditions, where the ship sailed, how fast it sailed, etc. Thus again one
cannot expect that fuel consumption monitoring by means of BDNs will
incentivize direct emissions reductions.
2.2.5 Implications for market-based instrument or efficiency measures The BDNs can provide an insight into the absolute amount of fuel consumed in
a specific period of time when combined with a stock-take at the beginning
and at the end of the time period under consideration. This monitoring
approach can therefore be used for time-based policy measures.
For route-based measures the fuel consumed on specific routes needs to be
monitored and reported. The data provided by the BDNs will not provide this
route-specific data. Ocean vessels can operate over long distances without
refuelling. So even if the routes defined in the policy measures were routes
between two ports, BDN-data would not be sufficient for the monitoring under
a route-based measure.
13 March 2013 7.A40.0 - Monitoring of bunker fuel consumption
3 Tank monitoring
3.1 Description of monitoring method
The fuel consumption of a ship can also be determined by monitoring the tanks
of the ship. Fuel tank levels are commonly measured on-board ships. This is
also called tank sounding. The depth of the fluid from the surface to the
bottom of the tank is thereby derived first and the corresponding volumetric
quantity is then calculated. Sounding tables are necessary to convert tank
level to volume. Typically, this is available in an approved form through the
ship stability documentation. Fuel density information is necessary to
calculate the corresponding mass. This is available from the BDN, however
blending on-board may cause slight complications. Fuel temperature will also
affect volume (CE Delft, 2009).
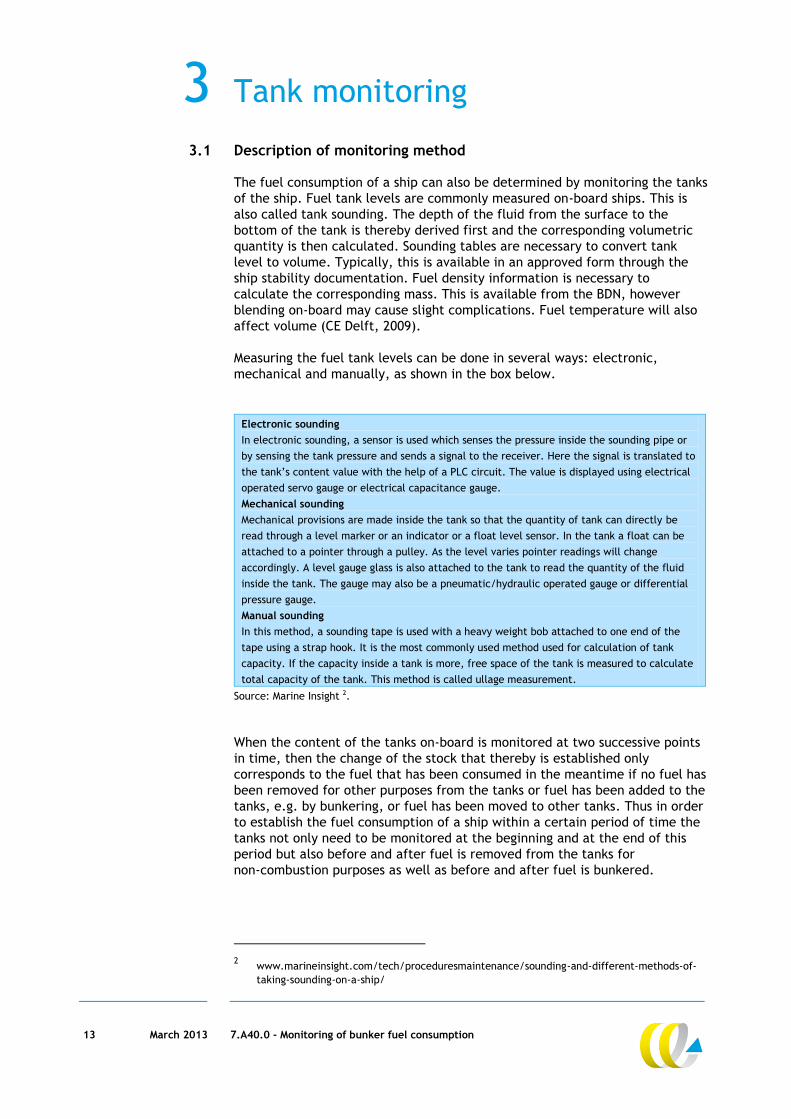
Measuring the fuel tank levels can be done in several ways: electronic,
mechanical and manually, as shown in the box below.
Electronic sounding
In electronic sounding, a sensor is used which senses the pressure inside the sounding pipe or
by sensing the tank pressure and sends a signal to the receiver. Here the signal is translated to
the tank’s content value with the help of a PLC circuit. The value is displayed using electrical
operated servo gauge or electrical capacitance gauge.
Mechanical sounding
Mechanical provisions are made inside the tank so that the quantity of tank can directly be
read through a level marker or an indicator or a float level sensor. In the tank a float can be
attached to a pointer through a pulley. As the level varies pointer readings will change
accordingly. A level gauge glass is also attached to the tank to read the quantity of the fluid
inside the tank. The gauge may also be a pneumatic/hydraulic operated gauge or differential
pressure gauge.
Manual sounding
In this method, a sounding tape is used with a heavy weight bob attached to one end of the
tape using a strap hook. It is the most commonly used method used for calculation of tank
capacity. If the capacity inside a tank is more, free space of the tank is measured to calculate
total capacity of the tank. This method is called ullage measurement.
Source: Marine Insight 2.
When the content of the tanks on-board is monitored at two successive points
in time, then the change of the stock that thereby is established only
corresponds to the fuel that has been consumed in the meantime if no fuel has
been removed for other purposes from the tanks or fuel has been added to the
tanks, e.g. by bunkering, or fuel has been moved to other tanks. Thus in order
to establish the fuel consumption of a ship within a certain period of time the
tanks not only need to be monitored at the beginning and at the end of this
period but also before and after fuel is removed from the tanks for
non-combustion purposes as well as before and after fuel is bunkered.
2 www.marineinsight.com/tech/proceduresmaintenance/sounding-and-different-methods-of-
taking-sounding-on-a-ship/
14 March 2013 7.A40.0 - Monitoring of bunker fuel consumption
Tank monitoring is a common practice in the sector, sounding frequency on a
ship however differs from company to company and according to the working
policy and the nature of operations going on board. According to Marine Insight
(2013), all fuel oil tanks lube oil tanks and diesel oil tanks must be sounded
twice a day, once in the morning and once in the evening, and recorded in the
event of a leak or any other emergency related to the oil content of tanks.
As the bunkering operation is one of the most critical operations, the
frequency of operation increases at the initial and final stages of the operation
(every 15 minutes) to check the inflow of oil into the correct tank at the initial
stage and to avoid overflow of oil during the final stage of operation.
3.2 Assessment of monitoring method
3.2.1 Accuracy, completeness and consistency
Accuracy The accuracy of tank monitoring is estimated at 2-5% (Saniship).
Fuel tank levels are commonly measured on-board ships. In modern ships, tank
soundings are normally taken using built-in automatic systems, such as pitot
tubes (which measure pressure) or radar tank level indication systems, both of
which transmit readings to the engine control room. These devices need to be
regularly calibrated to ensure accuracy (CE Delft, 2009). The accuracy of tank
monitoring is very sensitive and depends on the means by and conditions under
which they are carried out.
Many small ships still rely on the traditional (manual) bunkering measurement.
Look-up tables and a density measurement are used in conjunction with the
‘dip’ to calculate the total ‘mass’ of the bunker fuel delivered. There are
many factors that contribute to errors in this calculation, such as the strike
plate location, the dip tape, accuracy of tables, tank straps, and human error.
Furthermore, large ships may have a large number of fuel tanks, with different
quantities and grades of fuel. The accuracy of tank monitoring may be limited
by trim, heeling, etc. Manual sounding may be very inaccurate at sea if the
ship is moving (IMO/IMarEST, 2012).
Another way in which inaccuracy may occur is due to the fact that the tank
monitoring devices need to be regularly calibrated to ensure accuracy
(calibration dates should be recorded),and this may currently not always be
done as there are no regulations for this (CE Delft, 2009).
Lastly, discrepancies may exist between the tank volume determined and the
actual volume consumed. Differences may exist e.g. due to sludge and water
removed from the fuel (fuel treatment on-board). This may lead to a tendency
to over-estimate fuel usage (IMO/IMarEST, 2012).
In order to derive the emissions on the basis of the fuel consumption
monitored, information on the fuel quality is necessary too. This information is
available when the tank monitoring approach is applied, since fuel density
information is necessary to correctly determine the volume of fuel that is left
in the tanks.
Completeness Only if all tanks on-board are actually monitored, can all fuel oil that is used
on-board be captured with the tank monitoring approach.

15 March 2013 7.A40.0 - Monitoring of bunker fuel consumption
Consistency There are different techniques for tank monitoring and unless each ship uses
the technique that is most suitable for its design and it is used with the same
care, there will always be a difference between ships in the accuracy of the
measurement. International quality standards could be developed/applied to
ensure consistency to a certain degree.
The tank monitoring approach could be undermined in different ways:
1. Not all relevant tanks are monitored.
2. The tanks could be monitored with insufficient frequency.
3. The maintenance of the monitoring device could be insufficient.
4. The monitored data could be documented falsely.
5. The monitored data could be reported falsely.
3.2.2 Verifiability To verify the reported fuel consumption data it should ideally be ensured that
1. All relevant tanks have been equipped with a tank monitoring device.
2. All tanks have been monitored sufficiently often (i.e. at the beginning and
at the end of the respective period, whenever stock changes take place
that are not related to the fuel consumption (e.g. bunkering) and also, if a
route-based approach was chosen, whenever a ship enters or exits the
geographical scope of a system).
3. All tanks have correctly been monitored.
4. The data monitored has correctly been documented. And
5. The documented data has correctly been reported.
The verifier has the following options to ensure that the reported data are
consistent with the actual fuel consumed by the ship:
1. The reported data can be compared with the entries on tank monitoring to
logs on-board.
2. It can be controlled on-board whether all relevant tanks are equipped with
a tank monitoring device.
3. It can be controlled on-board whether the tank monitoring devices work
correctly (this may not be necessary, since the ship owner/charterer has
an interest in a good working device. This is due to security reasons and to
ensure that the amount of bunker fuel paid for by the ship owner is
actually delivered).
4. The reported data can be cross-checked with other data on fuel
consumption on-board (e.g. bunker delivery notes, oil record book or
engine log book).
5. He can carry out plausibility tests either by again using on-board data
(e.g. data on distances covered and by applying an average emission
factor) or by comparing the fuel consumption of the ship under
consideration with the fuel consumption of comparable ships.
3.2.3 Costs Fuel tank levels are commonly measured on-board ships so that purchase of
additional equipment would not be required, at least if the methodology used
would be up to the required standard.
The cost of a tank monitor for a Panamax Bulker varies between USD 1,000 and
USD 1,300 per tank (type NicoCap, Saniship).
The burden on the crew will be minimal since in modern ships, tank soundings
are normally taken by built-in automatic systems, which transmit readings to
the engine control room.

16 March 2013 7.A40.0 - Monitoring of bunker fuel consumption
However, it is mainly the larger and modern ships that have electronic built-in
tank monitoring systems. And although less common, tank monitoring also
takes place manually. Manual tank soundings are taken with a measuring tape
and digital thermometer via sounding pipes (need to be kept free of sludge
that may cause inaccuracies in measurements) and take a greater amount of
time. But even if tank monitoring is carried out manually additional monitoring
costs would only arise if extra tank monitoring had to be carried out.
Reporting of the data however will be an additional requirement and can
expected to be more time-consuming for manual tank soundings and to be
even more time-consuming than under the BDN approach since the sounding
results have to be entered into a monitoring system.
Verification costs for the public administrations can be expected to be lower,
given that the tanks are being monitored automatically and the resultant data
is stored on-board for a sufficiently long period. There would, contrary to the
BDN approach, be no need for approaching a third party (bunker fuel supplier).
Ensuring that the tank monitoring devices work properly would however add to
verification costs. These latter costs will have to be incurred by the ship
owner.
3.2.4 Direct incentive for emissions reductions Just as for fuel consumption monitoring by means of BDNs (see 2.2.4), it is
unlikely that the data that became available by tank monitoring will directly
incentivize additional emissions reductions:
Regarding ship owners, it is very unlikely that the fuel consumption data that
becomes available constitutes a new insight, because fuel consumption is
already regularly monitored and reported within the company. But even if the
fuel consumption data constituted a new insight, the data that would became
available (fuel consumption in absolute terms) would still not provide enough
information to detect options for improving the fuel-efficiency of a ship and to
control for the actual change of the fuel-efficiency of a ship if an emission
reduction measure was taken.
For shippers and charterers, the fuel consumption monitoring data would in
many cases constitute additional information if the data would become
publicly available at a ship specific level. However, this information would be
insufficient because shippers and charterers would want to base their choice
of a ship on the relative energy efficiency of the ships and not on the absolute
fuel consumption data.
The only extra insight that tank monitoring compared to monitoring by means
of BDNs could give could be the amount of fuel consumed by the ship on a
specific route if a route-based approach is chosen. Also a better breakdown of
the fuel consumption data is conceivable in the sense that the fuel
consumption is determined per tank and can thus more easily be related to the
purpose for which it is consumed on-board.
But this information would only be useful for a ship owner if his ship sailed
more often on this specific route and if the ship either always performed the
same transport work on this route or the ship owner himself combined the
monitoring data with the respective transport work data.
Due to the business sensitivity, it is very unlikely that data related to specific
routes would become publicly available. Therefore, compared to monitoring
by means of BDNs, no extra information would become available for shippers.
17 March 2013 7.A40.0 - Monitoring of bunker fuel consumption
Note finally that, even if a route-based approach was chosen, this would not
necessarily mean that route-specific fuel consumption data would become
available. If, for example, the geographic scope were the emissions on all
routes to or from Europe, it would not be necessary to monitor fuel
consumption on specific routes to and from Europe.
3.2.5 Implications for market-based instrument and efficiency measures In principle, tank monitoring is a monitoring approach that can be used for
time-based policy measures. To this end all tanks on-board need to be
monitored at the beginning and at the end of the respective time period, as
well as before and after any change in stock that is not related to the fuel
consumption process itself like e.g. bunkering.
Tank monitoring can also be used for route-based policy measures. However,
the tanks need to be monitored more often than in case of a time-based policy
measure. Not only do the tanks need to be monitored at the beginning and at
the end of the respective period3 and whenever stock changes take place that
are not related to the fuel consumption, but also whenever a ship crosses the
‘route borders’, i.e. whenever the ship moves from inside/outside the
geographical scope of the policy measure.
3 Note that a route-based measure will have a time component too, for example when a
measure covers all emissions of ships on routes to and from Europe in a certain year.

18 March 2013 7.A40.0 - Monitoring of bunker fuel consumption

19 March 2013 7.A40.0 - Monitoring of bunker fuel consumption
4 Flow meters
4.1 Description of monitoring method
The fuel consumption of a ship can further be determined by means of flow
meters. These meters allow for determining the amount of fuel that is flowing
through the respective pipes. The fuel flow is often measured directly (by
volume, velocity or mass) or indirectly (inferential) by pressure. In order to
capture all the fuel oil that is used on-board, all outward flows of all storage
tanks on-board would actually need to be monitored.
A wide variety of flow meters is available, such as electronic, mechanical,
optical and pressure based. The following box shows different types of flow
meters used for fuel consumption monitoring.
Electronic flow meters (volume)
Electronic fuel flow meters (with digital display) are meters that are fitted to the main engine
fuel supply and monitor fuel consumption constantly. The values recorded by the flow meters
are calculated in the fuel flow calculation unit and form the basis for all other functions in the
system (CE Delft, 2009).
Velocity sensing flow meters (velocity)
Velocity sensing flow meters are measuring the flow rate of the fuel based on the velocity.
Examples of these meters are turbine flow meters and ultrasonic meters.
Turbine flow meters are common in bigger ships. Turbine flow meters measure rotational
speed of a turbine in the pipe which can be converted to volumetric flow. In many cases,
fuel flow to the settling tank or day tank is measured rather than net flow to the engine
which requires two flow meters (supply and return flow).
Ultrasonic meters measure flow velocity from observations on a sonic wave passed
through the flowing fluid, that exploit either a Doppler effect or time-of-flight principle.
Inferential flow meters (pressure-based flow meter)
Inferential flow meters do not sense flow rate through the direct measurement of a flow
variable (such as volume, velocity or mass) but estimate flow by inferring its value from other
parameters (differential pressure, variable area) They measure differential pressure within a
constriction, or by measuring static and stagnation pressures to derive the dynamic pressure.
(University of Exeter, 2008a).
Optical flow meters
Optical flow meters use light to determine flow rate. Small particles which accompany natural
and industrial gases pass through two laser beams focused a short distance apart in the flow
path. By measuring the time interval between pulses, the gas velocity is calculated.
Positive displacement flow meters (volume)
These meters measure flow-rate-based on volumetric displacement of fluid. They remain
accurate at small fractions of rated capacity, but have relatively high head-losses; therefore
they are generally suited to higher flow-rates. Mechanical parts of the meter are exposed to
the fuel. If these were prone to wear or failure, such an event could potentially cause
obstructed fuel flow. For this reason, the fuel meter should be installed with a by-pass leg.
Examples of positive displacement flow meters include: oval gear flow meters, reciprocating
piston flow meters, and nutating discs (wobble meters).

20 March 2013 7.A40.0 - Monitoring of bunker fuel consumption
Mass sensing flow meters (coriolis)
Mass flow meters are meters that measure the mass flow rate, which is the mass of the fluid
traveling past a fixed point per unit of time. Examples are the coriolis meter, linear mass
meter, thermal mass meter. The coriolis meter measures the force resulting from the
acceleration caused by mass moving toward (or away from) a center of rotation. Since mass
flow is measured, the measurement is not affected by fluid density changes. Coriolis mass flow
meters can measure flow extremely accurately so they are often used to measure high value
products or the introduction of fluids that affect the production of high value products.
4.2 Assessment of monitoring method
4.2.1 Accuracy, completeness and consistency
Accuracy The wide variety of flow meters operate on a number of different principles and deliver results of varying degrees of accuracy. Table 1 gives an overview of the accuracy for different types of flow meters.
Table 1 Accuracy of flow meters
Type flow meter Subcategory Quoted accuracy (%FSD)
Positive displacement Oval gear, rotary piston 0.1-0.2%
Inferential flow meter Variable aperture 3.0%
Velocity sensing Turbine meter NA
Mass sensing flow meter Coriolis meter 0.05%-0.2%
(display/analogue output)
Optical flow meter NA NA
Source: CE Delft (2009); University of Exeter (2008) and contacted monitoring system companies.
Electronic fuel flow meters provide an accurate and reliable method of measuring fuel consumption in marine diesel engines. Their accuracy is +/- 0.2% (CE Delft, 2009). Coriolis flow measurement technology measures the mass flow directly and eliminates the need for any mathematical conversions and is very accurate. Their accuracy varies between 0.05 and 0.2% (Emerson, KROHNE Group). The accuracy of turbine flow meters depends inter alia on accurate information on fuel viscosity and density of the fuel. They are less accurate than displacement meters at low flow rates, but exact accuracy is not reported. The flow direction is generally straight through the meter, allowing for higher flow rates and less pressure loss than displacement-type meters. In general, the accuracy of flow meters may vary depending on the installation, maintenance and calibration requirements of the system and on-board operator competence (IMO/IMarEST, 2012). Compared to the first two monitoring methods (BDNs and tank monitoring), fuel flow monitoring could potentially be more accurate since it measures the actual fuel consumed in the fuel combustion system. In order to calculate the emissions that are associated with the fuel consumption determined by fuel flow meters, the corresponding fuel quality data has to be registered too.

21 March 2013 7.A40.0 - Monitoring of bunker fuel consumption
Completeness Only if all outward flows of all storage tanks on-board are actually monitored,
can all fuel oil that is used on-board be captured with the flow meter
approach. Between storage and combustion the bunker fuel is often processed
on-board, so that monitoring of the inward flows at the engines will lead to
different results than the monitoring of the outward flows of the tanks.
Consistency There are different kinds of flow meter and unless each ship uses the
technique that is most suitable for its design, and the fuel flows on each ship
are measured in a consistent way (at tank/at engine), there will always be a
difference between ships in the accuracy of the measurement.
International quality standards to ensure sufficient accuracy of the flow
meters as such could be applied/developed to ensure consistency to a certain
degree.
The flow meter monitoring approach could be undermined in different ways:
1. Not all relevant flows are monitored.
2. The flow meter could not continuously register the fuel flows.
3. The monitored data could be documented falsely.
4. The monitored data could be reported falsely.
Compared to tank monitoring, ensuring consistency can be expected to be
easier in the sense that no manual measurement is applied and that automatic
collection and reporting is easier.
4.2.2 Verifiability To verify the reported fuel consumption data it should ideally be ensured that
1. Sufficient flow meters have been installed on-board to capture the
relevant fuel consumption.
2. The flow meters have continuously been working.
3. The flow meters have worked properly.
4. The data monitored has correctly been documented (i.e. the flow
calculation unit has worked properly). And
5. The documented data has correctly been reported.
The verifier has the following options to ensure that the reported data are
consistent with the actual fuel consumed by the ship:
1. The data stored in the flow calculation unit can be compared with the
reported data.
2. It can be controlled whether sufficient flow meters are installed on-board.
3. It can be controlled whether the flow calculation unit has constantly
received data from the flow meters.
4. The reported data can be cross-checked with other data on fuel
consumption on-board (e.g. bunker delivery notes, oil record book or
engine log book).
5. Plausibility tests can be applied either by again using on-board data
(e.g. data on distances covered and by applying an average emission
factor) or by comparing the fuel consumption of the ship under
consideration with the fuel consumption of comparable ships.
4.2.3 Costs The cost range for a fuel consumption monitoring system can be quite wide. The costs depend on the type of equipment that has to be installed to be able to measure fuel consumption. Apart from fuel measurement meters there are also other parameters which have to be considered such as density meters (to calculate mass flow) and shaft meters (to calculate efficiency parameters).

22 March 2013 7.A40.0 - Monitoring of bunker fuel consumption
The costs of equipment for the different flow meters vary largely from USD 280 for an oval gear meter (Oval MIII Flowmate) up to USD 4,500-6,000 for a coriolis meter (Exenter, 2008b). According to Krohne and VAF4, the costs of a fuel consumption monitoring system for a Panamax Bulker range from USD 15,000 to 60,500.5
When data collection is done automatically, the burden for the crew regarding
fuel consumption figures is minimized. Relating the fuel consumption figures
to the respective fuel quality would however be an extra burden for the crew.
Verification costs for the public administrations can be expected to be
comparable to the costs for automatic tank monitoring and thus lower than for
the BND approach. Just as for the tank monitoring approach, ship owners
would have to incur costs for ensuring that the monitoring devices on-board
work properly.
4.2.4 Direct incentive for emissions reductions Just as for the data that becomes available from the BDNs and from the tank
monitoring approach, the data that stems from fuel flow meters does not give
information on the fuel-efficiency of a ship.
Ship owners can therefore not be expected to additionally adopt innovative
technical emission reduction measures and shippers and charterers cannot be
expected to select different, more fuel-efficient ships.
What distinguishes the flow meter monitoring approach from the BDN and tank
monitoring approach is that it can allow for a better insight as to which
purpose (e.g. main engine, auxiliary engine, boiler) what amount of fuel is
being used.
In addition, flow metering allows for real-time feedback on fuel consumption,
and probably for each engine or boiler. This could be used to train the crew to
operate more fuel-efficiently or to optimise maintenance and hull cleaning
schedules. Some shipping companies have such systems in place.
Just as the tank monitor approach, the flow meter approach can give
information on the amount of fuel consumed by the ship on a specific route if
a route-based approach is chosen.
But this information would only be useful to a ship owner if his ship sailed
more often on this specific route and if the ship either always performed the
same transport work on this route or the ship owner himself combined the
monitoring data with the respective transport work data.
Due to the business sensitivity, it is very unlikely that data related to specific
routes would become publicly available. Therefore, compared to the
monitoring by means of BDNs, no extra information would become available
for shippers.
Note finally that, even if a route-based approach was chosen, this would not
necessarily mean that route-specific fuel consumption data would become
available. If, for example, the geographic scope were the emissions on all
routes to or from Europe, it would not be necessary to monitor fuel
consumption on specific routes to and from Europe.
4 Additional data provided on prices of fuel consumption monitoring systems by:
Krohne: http://nl.krohne.com/; VAF Instruments: http://www.vaf.nl/introduction/
5 Costs are based on a price of £ 5,100 per flow meter, and assumption of 2-4 engines.

23 March 2013 7.A40.0 - Monitoring of bunker fuel consumption
4.2.5 Implications for market-based instruments and efficiency measures With flow meters it is possible to determine the amount of fuel that a ship has
consumed over a specific period of time. Flow meters are thus a monitoring
approach that can be used for time-based policy measures.
A route-based instrument would require a geographic breakdown of the fuel
consumption data. This is conceivable if the fuel monitoring data would be
linked to geographic data (e.g. GPS data), at least whenever a ship crosses the
‘route borders’, i.e. whenever the ship moves from inside/outside the
geographical scope of the policy measure.

24 March 2013 7.A40.0 - Monitoring of bunker fuel consumption

25 March 2013 7.A40.0 - Monitoring of bunker fuel consumption
5 Direct emissions monitoring
5.1 Description of monitoring method
Under the previously discussed monitoring approaches the fuel consumption of the ships is monitored and converted into emissions. With direct emissions monitoring this is not the case because CO2 emissions are directly measured at the exhaust gas stacks. Continuous emissions monitoring systems (CEMS) were historically used as a tool to monitor flue gas for oxygen, carbon monoxide and carbon dioxide to provide information for combustion control in industrial settings but are now also applied in the shipping industry to continuously collect, record and report the required emissions data.6 However, the technology is not widely applied in the maritime transport sector yet.
The standard CEM system consists of a sample probe, filter, sample line (umbilical), gas conditioning system, calibration gas system, and a series of gas analyzers which reflect the parameters being monitored. Typical monitored emissions include: sulphur dioxide (SO2), nitrogen oxides (NOx), carbon dioxide (CO2), diluent gases (CO2 or oxygen O2), flue gas velocity and opacity ( EPA, 1994). Direct monitoring thus permits the combining of CO2 measurement with the measurement of other air pollutants.
5.2 Assessment of monitoring method
5.2.1 Accuracy, completeness and consistency
Accuracy There is little information on the accuracy of direct emissions monitoring systems on-board ships. According to the Center for Tankship Excellence (2011), CO2 stack emissions can be monitored to an accuracy of +/-2%.
Completeness If all stacks are equipped with an emissions monitoring device, all emissions of
the ship can be captured with the emissions monitoring approach.
Consistency Compared to the other methods, the consistency of the results between ships
seems to be ensured for emissions meters, since the location of the
measurement cannot vary, the measurement will always be automatic, and
there is no need for converting the fuel consumption data into emissions.
However, differences in equipment as well as the care with which these are
applied, calibrated and maintained can lead to inconsistencies between ships.
6 The Babcock & Wilcox Company. Steam: its generation and use. The Babcock & Wilcox
Company. pp. 36–5.

26 March 2013 7.A40.0 - Monitoring of bunker fuel consumption
5.2.2 Verifiability To verify the reported emissions data it should ideally be ensured that:
1. On every stack an emissions monitoring device has been installed to
capture the relevant emissions.
2. The emissions monitoring devices have continuously been working.
3. The emissions monitoring devices have worked properly.
4. The data monitored has correctly been documented (i.e. the flow
calculation unit has worked properly). And
5. The documented data has correctly been reported.
The verifier has the following options to ensure that the reported data are
consistent with the actual emissions of the ship:
1. It can be controlled whether sufficient emissions monitoring devices are
installed on-board.
2. It can be controlled whether the respective calculation unit has constantly
received data from the emissions monitoring devices.
3. It can be controlled whether the emissions monitoring devices work
properly by installing an alternative mobile unit during time in port, and at
the same time control whether the emissions calculation unit records
correctly.
4. Plausibility tests can be applied either by using on-board data on fuel
consumption or related data (e.g. data on distances covered and by
applying an average emission factor) or by comparing the emissions of the
ship under consideration with the emissions of comparable ships.
5.2.3 Costs The cost of an emission monitoring system is roughly estimated at USD 100,000 for equipment (MariNOx, Martek-Marine) while installation costs would add up to another USD 25,000 for a single main engine system. Since the data is reported automatically, the burden for the crew is minimized. It is therefore relieving crew, company staff and regulatory authorities of paperwork and prevents administrative disputes (Neef, 2009).
5.2.4 Direct incentive for emissions reductions Direct emissions monitoring provides a direct feedback of the emissions of a
ship. Since emissions are measured in the stack, it may not always be clear
where they are created, i.e. whether they result from the main engine, the
auxiliaries or from the boilers.
Hence, direct emissions monitoring can be used to provide the crew with
direct feedback on total emissions, which could be used to train the crew, just
as is the case for fuel flow meters. However, in contrast to flow meters, it
would be harder for the crew to detect whether a certain engine or boiler is
running inefficiently and needs maintenance, since it would not be possible to
immediately see where the emissions are created.
For non-CO2 emissions direct emissions monitoring would allow for a direct
feedback that none of the other methods provide. This could be used to train
the crew to operate in a way that reduces NOx and PM emissions, for example.
Direct emissions monitoring can also be used to demonstrate compliance with
ECA requirements.
Just as for the data that becomes available from the previously discussed
monitoring approaches, the data that stems from direct emissions monitoring
does not give information on the fuel-efficiency of a ship directly.

27 March 2013 7.A40.0 - Monitoring of bunker fuel consumption
Ship owners can therefore not be expected to additionally adopt innovative
technical emission reduction measures and shippers and charterers cannot be
expected to choose for different, more fuel-efficient ships.
Just as the tank monitoring and the flow meter approach the direct emissions
monitoring approach can give information on the amount of fuel consumed by
the ship on a specific route if a route-based approach is chosen.
But this information would only be useful for a ship owner if his ship sailed
more often on this specific route and if the ship either always performed the
same transport work on this route or the ship owner himself combined the
monitoring data with the respective transport work data.
Due to the business sensitivity, it is very unlikely that data related to specific
routes would become publicly available. Therefore, compared to the
monitoring by means of BDNs, no extra information would become available
for shippers.
Note finally that, even if a route-based approach was chosen, this would not
necessarily mean that route-specific fuel consumption data would become
available. If, for example, the geographic scope were the emissions on all
routes to or from Europe, it would not be necessary to monitor fuel
consumption on specific routes to and from Europe.
5.2.5 Implications for market-based instruments and efficiency measures For direct emissions monitoring the same principle holds as for flow meters.
With direct emissions monitoring it would be possible to determine the
emissions of a ship over a specific period of time. Direct emissions monitoring
is thus an approach that can be used for time-based policy measures.
A route-based instrument would require a geographic breakdown of the
emissions data. This is conceivable if the emissions monitoring data would be
linked to geographic data (e.g. GPS data), at least whenever a ship crosses the
‘route borders’, i.e. whenever the ship moves from inside/outside the
geographical scope of the policy measure.

28 March 2013 7.A40.0 - Monitoring of bunker fuel consumption

29 March 2013 7.A40.0 - Monitoring of bunker fuel consumption
6 Conclusions
Table 2 shows the need for equipment, the costs and the possibility to monitor
other pollutants using the four monitoring methods. BDNs do not require any
equipment, and bunker fuel tank monitoring equipment is relatively cheap and
already installed on many ships. Fewer ships have flow meters, although many
ships with modern fuel systems do have them. Flow meters are considerably
more expensive than tank sounding systems, but less expensive than direct
emissions monitoring systems, which very few ships have.
In contrast, the operating costs of systems that can be automated, such as
flow meters, some bunker tank monitoring systems and direct emissions
measurements are probably lower than the operating costs of a monitoring
system based on BDNs.
Direct emission measurements can be used to measure non-CO2 emissions as
well. BDNs provide information on the sulphur content of fuel and hence on
sulphur emissions. The other systems can also provide this information when
the sulphur content of the fuel is taken into account.
Table 2 Comparison of equipment costs and capabilities of various fuel consumption monitoring
systems
Equipment needed Costs/burden for ship
operator/owner
Monitoring& verification
costs/burdens
Monitoring
of other
pollutants
Bunker delivery note
and period stock-
takes of fuel tanks
None No equipment cost.
No running costs.
Data reporting costs/burden
could be high as a result of
use of paper records.
Reporting the data is an extra
burden.
Costs will be higher as a result of
use of paper records and lack of
automation possibilities.
SOx
Bunker fuel tank
monitoring on-board
Yes, but already
present on larger
ships
Equipment: USD 1,000-1,300
per tank.
Maintenance of device.
Data reporting costs/burden
modest if automatically
monitored.
If tanks are automatically
monitored and results
electronically recorded then costs
will be modest.
Costs may have to be incurred to
prove that device works properly.
(SOx)
Flow meters for
applicable
combustion processes
Yes, but already
present in ships with
modern fuel systems
Equipment: USD 15,000-
60,000.
Maintenance of device.
Data reporting costs/burden
modest if automatically
monitored.
If flow is automatically monitored
and results electronically
recorded then costs will be
modest.
Costs may have to be incurred to
prove that device works properly.
(SOx)
Direct emissions
measurements
Yes and not widely
used in sector yet
Equipment: USD 100,000.
Maintenance of device.
Data reporting costs/burden
modest with automatic
monitoring.
Automatic monitoring and
recording means costs will be
modest.
Costs may have to be incurred to
prove that device works properly.
SOx, NOx,
PM, etc. in
real-time.
Note: The cost estimate for flow meters is for a Panamax Bulker.
Note: Depending on how the system is designed, monitoring and verification cost may accrue to
the ship owner/operator or to the regulator.

30 March 2013 7.A40.0 - Monitoring of bunker fuel consumption
Fuel flow meters are the most accurate systems available, as is shown in
Table 3. Their accuracy in monitoring CO2 emissions can be an order of
magnitude better than the other systems. Direct emissions measurements are
probably most accurate in monitoring non-CO2 emissions. If systems are
installed properly, all systems can provide complete monitoring results. The
consistency of automated systems may be better since they reduce the impact
of human errors and the possibility for fraud. Verification is also easier for the
automated systems. Verification of the data reported on the basis of BDNs
could turn out to be difficult and time-consuming: BDN copies can be illegible
and/or issued by a subcontractor of the registered fuel supplier.
Table 3 Comparison of the quality of the results of various fuel consumption monitoring systems
Accuracy Completeness Consistency Verifiability
Bunker delivery
note and periodic
stock-takes of
fuel tanks
1-5% All fuel used on-board is
captured, provided that
all BDNs are presented,
every bunker operation is
covered by BDNs and BDNs
are not falsified.
Difficult to ensure:
All BDNs have to be
presented, every
bunker operation
has to be covered
by BDNs and BDN
need not to be
falsified.
Data can be verified by
cross-check with other
data
on-board
cross-check with BDNs of
bunker fuel suppliers
plausibility checks
Could turn out to be difficult
if BDN copy illegible and/or
issued by subcontractor of
fuel supplier.
Bunker fuel tank
monitoring on-
board
Limited to very
inaccurate (if
manually).
Electronically: 2-5%
All tanks need to be
monitored to capture all
fuel used on-board.
Difficult to ensure:
Different methods
can be applied with
different care.
All tanks need to be
monitored
frequently enough.
Data can be verified by
cross-check with other
data
on-board
controlling devices on-
board
plausibility checks
Verification is easier than for
BDN if tanks are monitored
automatically.
Flow meters for
applicable
combustion
processes
0.1 - 3 % All outward flows of all
tanks need to be
monitored to capture all
fuel used on-board.
Easier to ensure
than for BDN and
tank monitoring
since only
automatic
measurement.
Data can be verified by
cross-check with other
data
on-board
controlling devices
on-board
plausibility checks
Verification is easier than for
BDN since monitoring is done
automatically.
Direct emissions
measurements
+/-2% All fuel used on-board is
captured if all stacks on-
board are monitored.
Easier to ensure
than for BDN and
tank monitoring
since only
automatic
measurement.
Data can be verified by
cross-check with other
data
on-board
controlling devices
on-board
plausibility checks
Verification is easier than for
BDN since monitoring is done
automatically.

31 March 2013 7.A40.0 - Monitoring of bunker fuel consumption
MRV can provide an incentive for emissions reductions in two ways. The first,
which we have labelled ‘within company’ stems from the fact that MRV may
yield additional information on fuel use and/or existing information in a new
form to a shipping company that can be used to fine tune the operation of the
ship in real-time, train the crew, indicate a need for maintenance of engines,
hull, propeller, etc. The second, which we have labelled ‘market
transparency’, stems from the fact that public data about the fuel-efficiency
of a ship may help charterers or shippers select the most fuel-efficient ships.
This could reduce a major barrier to the implementation of cost-effective
measures to reduce emissions, which is the split incentive between ship
owners and charterers, and also more generally allow the users of shipping
services to choose vessels on the basis of their relative fuel consumption/
efficiency.
Systems that are already commonly used within companies are unlikely to
provide additional incentives to reduce emissions. Hence, it is unlikely that
BDNs or tank monitoring provide an additional incentive for emissions
reductions within a company. Since flow meters are not used in all ships and
direct emissions monitoring is hardly used, and since they can be used to
provide real-time feedback on fuel consumption, they may provide an
additional incentive to train the crew and to optimise maintenance, and allow
managers to fine-tune their operations. With respect to the latter, flow
meters are probably superior because they can yield more detailed
information on where fuel is used.
MRV systems that yield information on emissions do not provide additional
market transparency, unless combined with other data to yield fuel-efficiency
data, and are made public. This other data could be miles sailed, cargo
carried, etc. Relevant information on fuel-efficiency therefore requires
route-based emissions data which BDNs cannot supply but the other monitoring
methods can.
All monitoring systems but the BDN can yield route-based emissions data and
can hence be used for route-based policy measures. BDNs can only be used for
time-based policy measures.

32 March 2013 7.A40.0 - Monitoring of bunker fuel consumption
Table 4 Comparison of the emissions reduction incentives directly incentivized by various fuel
consumption monitoring systems
Direct incentive for emissions reductions Time-based
measures
Route-based
measures
Within company Market transparency
Bunker delivery note and
period
stock-takes of fuel tanks
Not likely since
no additional information
no efficiency data
provided
no break down of fuel
consumption possible
no real-time fuel
consumption feedback
possible
Not likely since
no efficiency data provided
Yes No
Bunker fuel tank
monitoring
on-board
Not likely since
no additional information
no efficiency data
provided
no real-time fuel
consumption feedback
possible
However:
break down of fuel
consumption possible to
certain extent
route-based information
possible
Likely when combined with other
data to yield information about a
ships efficiency
Yes Possible
Flow meters for
applicable combustion
processes
Possible that the system
provides - real-time fuel
consumption feedback.
break down of fuel
consumption possible
route-based information
available
Likely when combined with other
data to yield information about a
ships efficiency
Yes Possible
Direct emissions
measurements
Possible that the system
provides - real-time fuel
consumption feedback.
route-based information
available
real-time fuel
consumption feedback
possible
Likely when combined with other
data to yield information about a
ships efficiency
Yes Possible

33 March 2013 7.A40.0 - Monitoring of bunker fuel consumption
7 Literature
Bunkerspot, 2009
Bunkerspot, Vol. 6, No.1, Feb/March 2009
Cardiff University, 2013a
M. Bloor, S. Baker, H. Sampson, K. Dahlgren
Issues in the enforcement of future international regulations on ships’ carbon
emissions
Cardiff : Cardiff University, 2013
Cardiff University, 2013b
M. Bloor, S. Baker, H. Sampson, K. Dahlgren
Effectiveness of international regulation of pollution controls: the case of the
governance of ship emissions
Cardiff : Cardiff University, 2013
CE Delft, 2009
Technical support for European action to reduce Greenhouse Gas Emissions
from international maritime transport
Delft : CE Delft, 2009
Center of Tankship Excellence, 2011
Direct Taxation of Ship-based CO2 Emissions
Florida : Center of Tankship Excellence, 2011
EPA, 2000
Evaluation of Particulate Matter Continuous Emission Monitoring Systems
Environmental Protection Agency, 2000
EPA, 1994
An Operator’s Guide To Eliminating BiasIn CEM Systems
http://www.epa.gov/airmarkets/emissions/docs/bias.pdf
Environmental Protection Agency, 1994
ILENT, 2013
www.ilent.nl/english/merchant_shipping/ship_owners_dutch_flag/legislation/
marine_fuels_quality/
Inspectie Leefomgeving en Transport, 2013
IMarEST, 2012
Global-based approach to fuel and CO2 emissions monitoring and reporting,
MEPC 65/INF. 3
London: Institute of Marine Engineering, Science and Technology, 2012
IMO, 2013
Summary of Status of Conventions as at 6 March 2013
IMO, 2012
Report of the Marine Environment Protection Committee on its sixty-third
session, MEPC 63/23, 14 March 2012
International Maritime Organization, 2012
34 March 2013 7.A40.0 - Monitoring of bunker fuel consumption
Neef, 2009
The Development of a Global Maritime Emissions Inventory Using Electronic
Monitoring and Reporting Techniques
Mystic, Connecticut : DNA Maritime LLC, 2009
Öko-Institut, 2011
Review of Decision No 280/2004/EC (Monitoring Mechanism Decision) in view
of the agreed Climate Change and Energy package, Draft final report
Berlin : Öko-Institut, 2011
T&E, 2012a
Towards a strong and reliable ship emissions monitoring system. What are the
practical options to monitor ship emissions?
Brussels : Transport & Environment, 2012
T&E, 2012b
Energy efficiency of ships: what are we talking about?
Brussels : Transport & Environment, 2012
University of Exeter, 2008a
C. Barbour, T. Clifford, D. Millar, R. Young
Fuel flow metering for fishing vessels: preliminary report (phase 1)
Penryn, Cornwall : University of Exeter, 2008
University of Exeter, 2008b
C. Barbour, T. Clifford, D. Millar, R. Young
Fuel flow metering for fishing vessels: fuel meter tests under laboratory
conditions (phase 2)
Penryn, Cornwall : University of Exeter, 2008