Monitoring from a distance -...
4
Growing Knowledge An ongoing series provided by Oregon State University in partnership with OAN Monitoring from a distance Using a remote moisture monitoring system to manage irrigation 42 ▲ their water supply, and nervous about increased regulation. As a result, nursery professionals are exploring new methods to make irrigation more efficient. This could have the added benefit of improved TYLER HOSKINS By Tyler Hoskins, Jim Owen and Heather Stoven The availability of irrigation water is decreasing. The cost of water and fertilizer are increasing. Nurseries are feeling insecure about the protection of Figure 1 — This remote moisture monitoring system uses probes inserted into containers. A wireless transmitter then sends the data back to a base station, ultimately to be logged on a computer. fertilizer application. Researchers at Oregon State University evaluated the potential of a remote soil-moisture-sensing technol- ogy in ornamental container produc- tion systems. The study was done in cooperation with Woodburn Nursery & Azaleas Inc., Bailey Nurseries, Inc., and PureSense Environmental Inc. This technology is currently being utilized in field grown, conventional or specialty cropping systems. However, the purpose of this research was to explore the feasibility of utilizing this technology under different container production scenarios. JULY 2012 ▲ DIGGER 41
Transcript of Monitoring from a distance -...
50
▲Growing Knowledge
An ongoing series provided by Oregon State University in partnership with OAN
Monitoring from a distanceUsing a remote moisture monitoring system to manage irrigation
42
▲
their water supply, and nervous about increased regulation.
As a result, nursery professionals are exploring new methods to make irrigation more efficient. This could have the added benefit of improved
Tyler H
osk
ins
By Tyler Hoskins, Jim Owen and Heather Stoven
The availability of irrigation water is decreasing. The cost of water and fertilizer are increasing. Nurseries are feeling insecure about the protection of
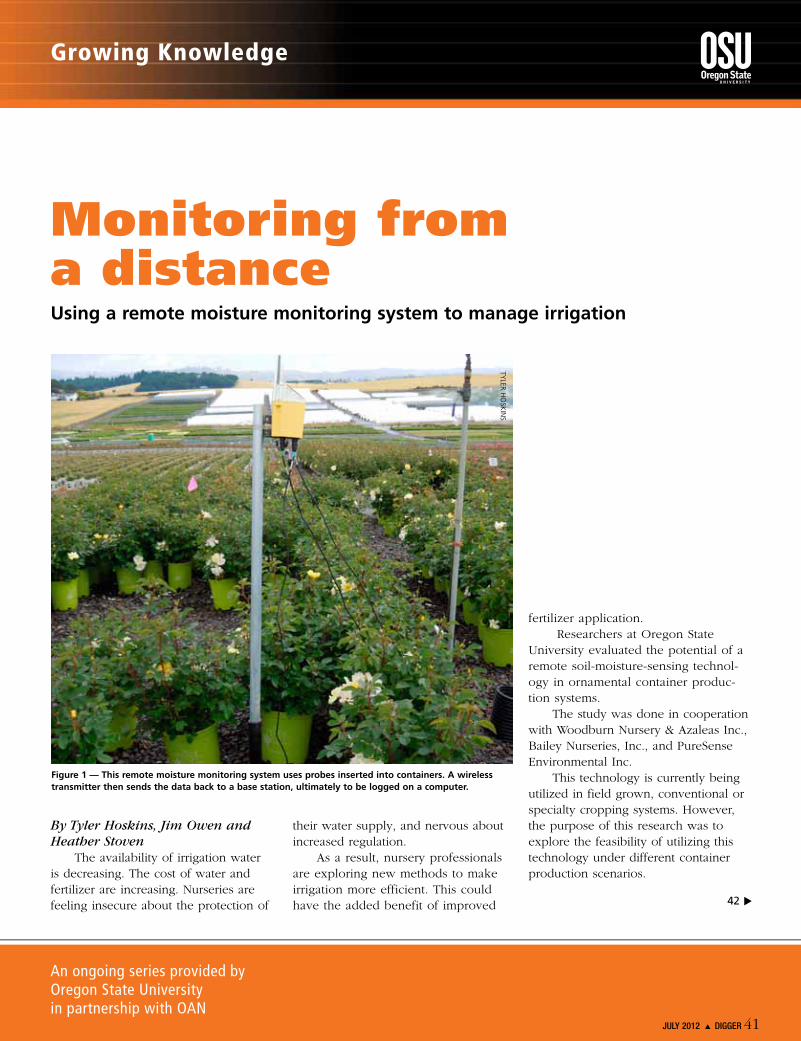
Figure 1 — This remote moisture monitoring system uses probes inserted into containers. A wireless transmitter then sends the data back to a base station, ultimately to be logged on a computer.
fertilizer application. Researchers at Oregon State
University evaluated the potential of a remote soil-moisture-sensing technol-ogy in ornamental container produc-tion systems.
The study was done in cooperation with Woodburn Nursery & Azaleas Inc., Bailey Nurseries, Inc., and PureSense Environmental Inc.
This technology is currently being utilized in field grown, conventional or specialty cropping systems. However, the purpose of this research was to explore the feasibility of utilizing this technology under different container production scenarios.
JULY 2012 ▲ DIGGER 41
▲ MonItoRInG fRoM a DIstancE
Researchers also assessed its potential use as a practical tool to monitor and manage irrigation, there-fore reducing handling and treatment of onsite water, reducing energy costs and minimizing nutrient leaching from containers.
Container production systems pose many challenges, including variation in species and plant architecture, con-tainer size, soilless substrate composi-tion and cultural management practices (such as use of plant growth regulators and pruning).
Furthermore, containerized crops require intensive irrigation manage-ment with a small water buffering capacity, when compared to field crops grown in soil.
Describing the systemThis system operates from a solar-
powered central base station, located at the nursery. Solar- or battery-pow-ered remote nodes, or radios, are placed throughout the nursery to relay information to the base station. Each node has the capacity to connect with up to four analog/digital sensors relay-ing information about soil moisture,
temperature, leaf wetness, precipita-tion, or irrigation events.
Information from the sensors is col-lected every 15 minutes and is sent to the base station, which in turn sends data to be processed off-site via a cel-lular modem. The data is available for viewing via computer or smartphone within a few minutes of being recorded and processed.
Information flows from the probe (Figure 1, Page 41) to a base station and then to a laptop or mobile device. Data is presented using a grower-friend-ly user interface that provides infor-mation at a glance via a “gas gauge” (e.g. wet or dry) or can provide more in-depth information (diurnal moisture curves) if needed.
When monitoring substrate mois-ture, growers set parameters for maxi-mum wetness and dryness based on their own preferences. The maximum dryness is the point at which the production manager would irrigate; maximum wetness is the point where irrigation should shut off. All of the components of the monitoring system typically can be purchased or leased and maintained by a service provider.
Implementing the systemFor this trial, the system was set
up to measure soilless substrate mois-ture as a means to assist with irrigation scheduling. The system was imple-mented alongside a variety of methods that have been used to evaluate the moisture content of a soilless substrate in containerized production systems of ornamental crops.
Methods included collecting leach-ing fractions (amount water leached / amount water applied), measuring container weight (where a change of 1 gram equals 1 milliliter of water gain or loss), or making estimates based on weather trends (evapotranspiration or water use estimates). These measure-ments served as a basis to compare the data from the digital system.
Each method has its own merits and provides valuable information for scheduling irrigation. However, each tra-ditional method provides only a single measurement or estimates water loss.
The benefit of the technology employed is that it provides the grower with instant water status and graphi-cal representation of all the compiled data to assist in management decisions. Furthermore, the system provides his-torical records of substrate moisture of containerized crops that can be utilized for future management decisions.
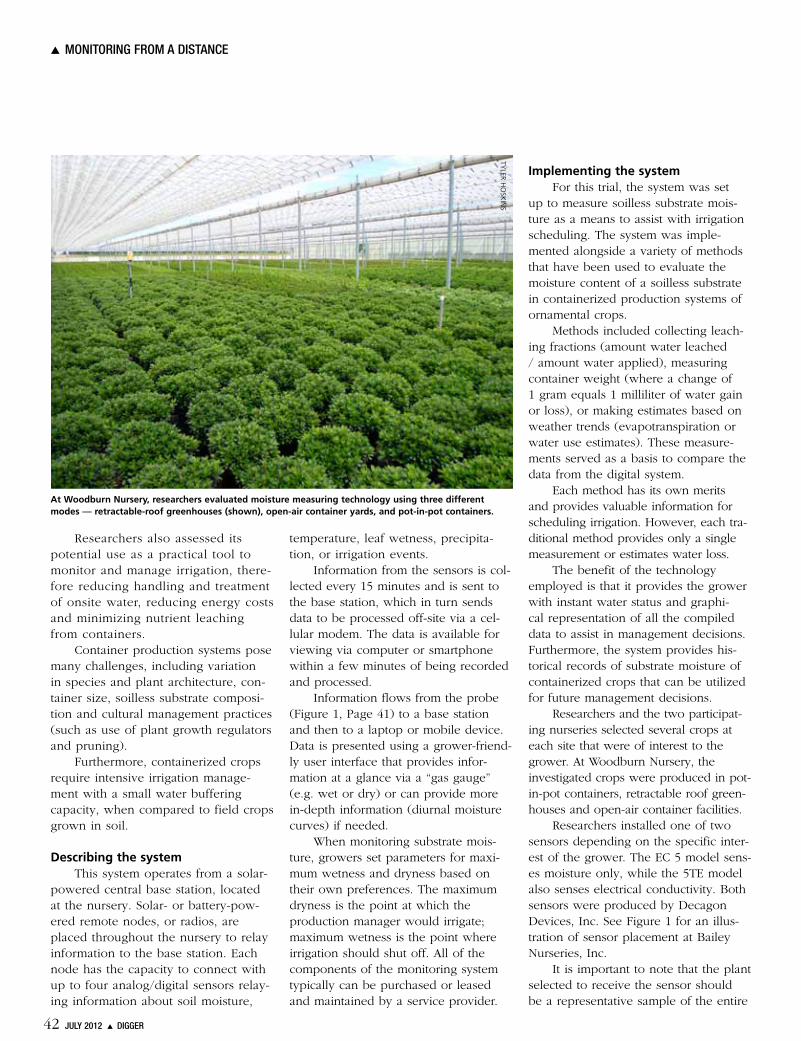
Researchers and the two participat-ing nurseries selected several crops at each site that were of interest to the grower. At Woodburn Nursery, the investigated crops were produced in pot-in-pot containers, retractable roof green-houses and open-air container facilities.
Researchers installed one of two sensors depending on the specific inter-est of the grower. The EC 5 model sens-es moisture only, while the 5TE model also senses electrical conductivity. Both sensors were produced by Decagon Devices, Inc. See Figure 1 for an illus-tration of sensor placement at Bailey Nurseries, Inc.
It is important to note that the plant selected to receive the sensor should be a representative sample of the entire
At Woodburn Nursery, researchers evaluated moisture measuring technology using three different modes — retractable-roof greenhouses (shown), open-air container yards, and pot-in-pot containers.
Tyler H
osk
ins
42 JULY 2012 ▲ DIGGER

irrigation zone. The location of this plant within the block is a strategic decision that takes into account irriga-tion uniformity, canopy interaction and specific crop water use. If unknown, irrigation uniformity and leaching frac-tion should be determined prior to net-work deployment.
One should consider that the data may not be representative. It could be misleading, if for example it is collected from a container in a dry area or one that is wetter than average. We found that growers have in-depth knowledge of irrigation system and crop water use, making them most suitable to determine sensor placement. However, by testing irrigation uniformity and monitoring leaching fraction, we found that the assumptions made are not always valid.
Once the system’s hardware is installed and functioning, the next step is to evaluate the data from each probe and customize the software to meet the attributes of a specific crop.
This process is accomplished by setting an upper and lower moisture boundary for each probe. These bound-aries represent a specific substrate mois-ture content determined by the grower. The quantitative number is not exact, however; it is relative to the grower perceived water status of the container/crop system.
The upper moisture boundary is set at or below container capacity; the maximum amount of water held in the substrate after water has drained from the container. The lower moisture boundary represents the driest a grower determines the crop should be before being irrigated.
There are two main ways informa-tion is presented to the grower. First, the software uses icons on an inter-active satellite image to depict each node’s physical location and the most current moisture reading in relation to the boundaries. Each icon functions like a car’s gas gauge and will change colors depending on how wet or dry the con-tainers substrate is (see Figure 2).
Second, a grower can take a more
Figure 2 — Sensor locations are superimposed on a satellite map of this farm. Each sensor is represented by a color-coded icon, where blue represents wet and yellow represents dry.
Figure 3 — The remote moisture monitoring system can graph moisture levels as a percentage of container volume over time. This graph shows what an ideal pattern would look like. Irrigation starts as moisture reaches a low threshhold and ends as the container reaches saturation. Moisture quickly drains until the ideal upper threshhold is reached. The moisture level then stays at that ideal level for an extended period.
in-depth look at diurnal moisture graphs for analysis of anything from a single irrigation event to the trends over a full season (see Figures 3 and 4).
ImplicationsAnalyzing diurnal substrate moisture
graphs allows a grower to evaluate how water is performing within a container at different times of the year. This helps the grower understand how cultural practices impact water management.
These graphs take different shapes 44
▲
as a result of several variables such as irrigation method, substrate composi-tion, plant type, and air temperature (as it relates to evaporative transpiration and root zone uptake).
Figure 3 is an example of a typical irrigation event and displays how mois-ture content (y axis) relates to the lower (red) and upper (blue) moisture bound-aries as set by the grower. This informa-tion is graphed as a function of time (x
JULY 2012 ▲ DIGGER 43

▲ MonItoRInG fRoM a DIstancE
axis) and reads left to right. Before irrigation, the moisture
content would slowly drop as mois-ture is either utilized by the plant or evaporates from the substrate until it approaches the red boundary indicating that the substrate is relatively dry and requires irrigation.
When irrigation begins, moisture content increases until the substrate is between container capacity and satura-tion. Once irrigation ends, any excess water in the container greater than the water holding capacity drains, reflecting a slight drop in moisture content. The final result is the net increase in volu-metric water content.
After the irrigation event, one can observe the substrate drying as it is again subject to environmental condi-tions. The cycle would repeat itself once the moisture content reaches the lower boundary again.
Figure 3 is an example of ideal irrigation practices. It is rare, how-ever, for growers to be able to gauge the perfect volume of water to apply. Understandably, most growers err on the side of applying extra, rather than risk subjecting plants to drought stress. But how much extra is too much? Analyzing the graphed moisture read-ings over the span of a single irrigation event creates a better picture.
During irrigation, if a substrate reaches saturation and the irrigation continues, the graph will display a flat-top (Figure 4). This flat-top represents a prolonged period of leaching, where water is leached from the base of the container at the rate at which it is being applied. This occurs when water is applied in excess at a rate faster than it can drain from the substrate.
Graphically, this is represented by a drastic drop to container capac-ity as soon as the irrigation is shut off, indicating that excess water is quickly drained from the container.
In each of these scenarios, excess water is leached from the container. Not only is this inefficient, but it also may reduce the efficacy of agrichemicals.
measuring technology. The sensor was unable to adequately provide usable EC information for real-time management decisions. Further research is needed to have real-time solution to monitor EC via remote monitoring systems to improve nursery production systems.
ConclusionAfter a full growing season, both
growers and researchers were encour-aged by the potential of moisture-sensing technology to improve the efficiency of container production systems. Growers valued the ability to identify instances of over-irrigation, which led to several opportunities to refine irrigation practices.
In some situations managers observed improved communication with, and education of, their irrigation staff.
Growers did raise cost as a concern for implementing this technology on a commercial scale, especially consider-ing the diverse number of plant species and production scenarios that occur at a typical nursery. Alternative strategies are being considered to reduce the scale at which this system is deployed, such as focusing on troublesome crops or to help determine irrigation practices for new and existing crops.
Ultimately, digital moisture moni-toring systems are an example of how developing technology can benefit the nursery industry. Nurseries are seeking new and innovative methods to con-serve natural and financial resources as the conversation regarding water usage becomes increasingly heated.
Tyler Hoskins is a former nursery intern at Oregon State University and current graduate student at Virginia Tech. He can be reached at [email protected]. Heather Stoven is a faculty research assistant with Oregon State University, stationed at the North Willamette Research and Extension Center. She can be reached at [email protected]. Jim Owen is an assistant pro-fessor of horticulture at Virginia Tech. He can be reached at [email protected].
This in turn may necessitate more on-site treatment of runoff.
Since the graphs are displayed as a function of time, a grower can manipulate irrigation times based on the time it takes the water content to move between the dry and wet boundary. However, it must be noted that this is a function of plant architecture and size.
The concentration of soluble salts, which may come from irrigation water and fertilizers, can be quantified by mea-suring the electrical conductivity (EC) within the substrate. EC measurements assess how efficiently an electric current passes through a solution and provides an estimate of the bulk fertilizer concen-tration. Increased concentrations allow for the current to pass through with less resistance (greater conductivity).
Proper management of EC lev-els can be associated with desired plant growth. However, if the EC level allowed to reach low or high extremes, it may result in insufficient growth or salt damage, respectively. Close moni-toring may indicate whether the EC lev-els are abnormal and whether corrective action is warranted.
The 5TE model probes do have the ability to measure EC. While their use was not the primary objective of this trial, researchers did evaluate the EC
Figure 4 — This graph shows what happens to moisture levels when a container is overwatered. Water will continue to leach off and be wasted until irrigation shuts off. Water then drains until container capacity is reached. The net change in moisture content is very low, especially considering all of the water that has been used.
44 JULY 2012 ▲ DIGGER