Monitoring CML patients by RQ-PCR
77
Monitoring CML patients by RQ-PCR Andreas Hochhaus Medizinische Fakultät Mannheim Ruprecht-Karls-Universität Heidelberg Mannheim, Germany
Transcript of Monitoring CML patients by RQ-PCR

Monitoring CML patients by RQ-PCR
Andreas Hochhaus
Medizinische Fakultät MannheimRuprecht-Karls-Universität Heidelberg
Mannheim, Germany

1010
>1012
106
108
Leukemia cells
CCyR
MMR/CMR
Undetectable range
CHR
Goals of CML Therapy
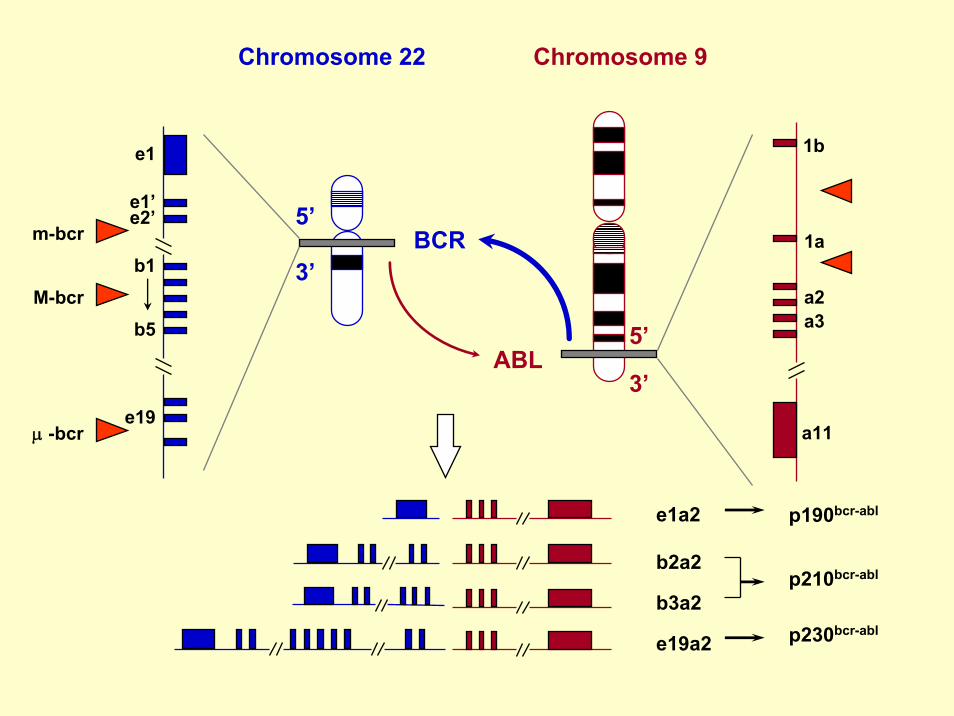
Chromosome 9Chromosome 22
ABL
BCR
5’
3’
1b
1a
a2a3
a11
5’
3’
e1
e1’e2’
b1
b5
e19
m-bcr
M-bcr
μ -bcr
e1a2
b2a2
b3a2
e19a2
p190bcr-abl
p210bcr-abl
p230bcr-abl

The PCR technique, although considered a valid clinical testingprocedure, should be used cautiously as a laboratory test until sufficientdata are available to show that it meets acceptable criteria of sensitivity, specificity, and positive and negative predictive values. How new PCR technologies such as "real-time" PCR quantification will solve theseconcerns and become a reliable tool for the clinician merits furtherinvestigation. Until then, clinicians should exercise caution in basingclinical decision making on such studies, given the significant morbidityand mortality associated with aggressive therapeutic interventions aimedat molecular disease eradication in patients who might just do as well without.
Stefan Faderl et al. (MDACC Houston), Blood 1999
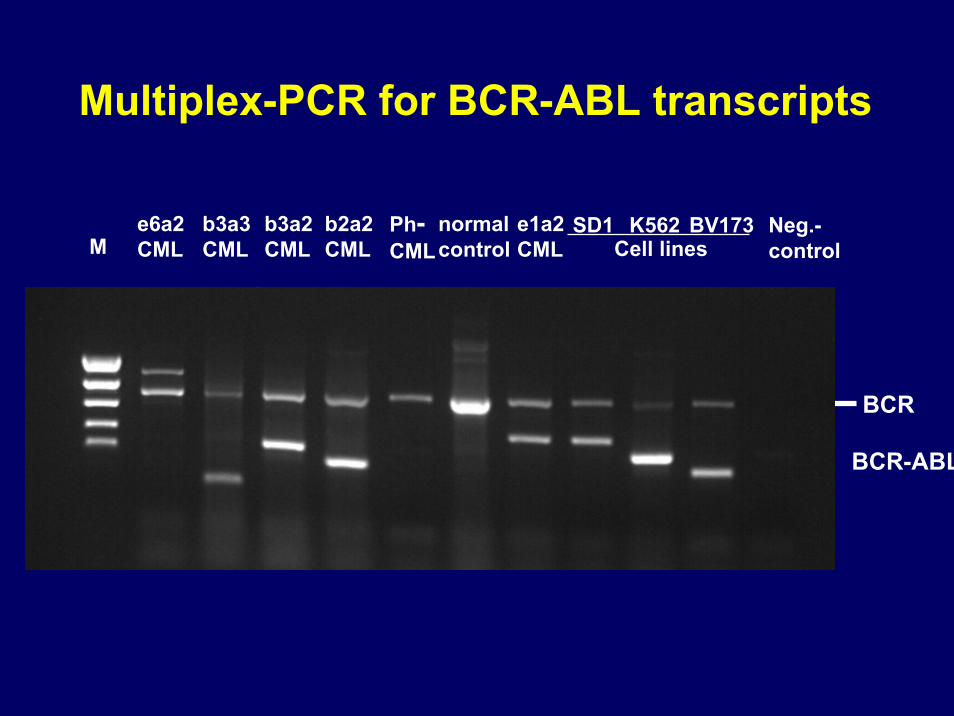
Multiplex-PCR for BCR-ABL transcripts
Me6a2CML
b3a3CML
b3a2CML
b2a2CML
Ph-CML
normalcontrol
e1a2CML
SD1 K562 BV173 Neg.-controlCell lines
BCR
BCR-ABL

e1 2 3 5 7 8 9 10 11 b1 b2 b3 b4 b5 c14 6 c2 c3 e23
BCR-C
C5e-
B2B
808 bp
BCR
a2 a3 a11IaIb
CA3-
ABL
e1 2 3 5 7 8 9 10 11 b1 b2 b34 6
B2B
a2 a3 a11
CA3-
385 bp
b3a2
128 bp
e1 2 3 5 7 8 9 10 11 b1 b24 6
B2B
a3 a11
CA3-
b2a3
p210BCR-ABL
e1 2 3 5 7 8 9 10 11 b1 b2 b34 6
B2B
a3 a11
CA3-
203 bp
b3a3
p190BCR-ABL
e1 2 3 5 7 8 9 10 11 b1 b2 b3 b4 b5 c14 6 c2 c3
B2B
a2 a3 a11
CA3-925 bp
c3a2 p230BCR-ABL
e1 2 3 5 7 8 9 10 11 b1 b24 6
B2B
a3 a11
CA3-
310 bp
b2a2 a2
e1
BCR-C
CA3-481 bp
e1a2 a2 a3 a11
e1 2 3 54 6
BCR-C
1123 bp
e6a2 a2 a3 a11
CA3-
p200BCR-ABL
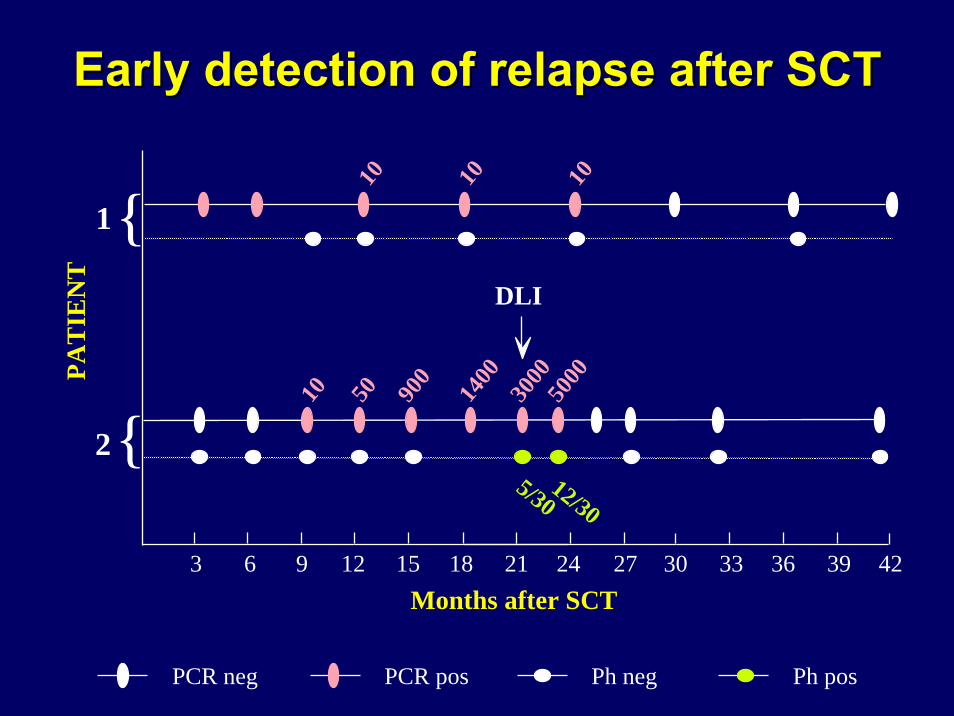
PCR neg PCR pos Ph neg Ph pos
3 6 9 12 15Months after SCT
18 21 24 27 30
EarlyEarly detectiondetection of of relapserelapse afterafter SCTSCT
33 36 39 42
PAT
IEN
T
5/3012/30
{2
10 50 900
1400
3000
5000
{1
10 1010
DLI

1993: Competitive RT-PCR
106 104105 103105.5 104.5 103.5
competitorBCR-ABL
b2 b3 a2 a3
CA3-Abl3-
b1
B2ANB1+ A2N
a4
A4-
b2 b3 a2 a3INSERTb1 a4
Cross et al Blood 1993

Pro
babi
lity
of re
laps
e(%
)
Ratio BCR-ABL/ABL < 0.045%, n=27
Ratio BCR-ABL/ABL > 0.045%, n=27
0 1 2 3 4 5 6
100
80
60
40
20
0 p < 0.0001
Years after first PCR
Relapse free survival in complete cytogenetic responders afterIFN therapy according to residual BCR-ABL transcript levels
BC

Real time quantitative RT-PCR
106
105
104
BCR-ABL plasmidmolecules
x = 40,000
x
I. Hydrolysis ProbesRelease from quenchingby hydrolysis
hν
hν
X
X
TaqManTM
II. Hybridization ProbesIncreased resonance energytransfer by hybridization
hν
hν
X
X
LightCyclerTM

a2 a3 a4
NA4-
HybProbes
a2 a3 a4
NA4-
b3b2
IaIb
A2N
B2A
BCR-ABL
ABL
Gabert et al. Leukemia. 2003.
a2 a3 a4
ENR561
a2 a3 a4
ENR1063
b3b2
IaIb
ENF1003
ENF402
BCR-ABL
ABL
ENP541
ENP1043
LightCycler
Emig et al. Leukemia. 1999.
TaqMan
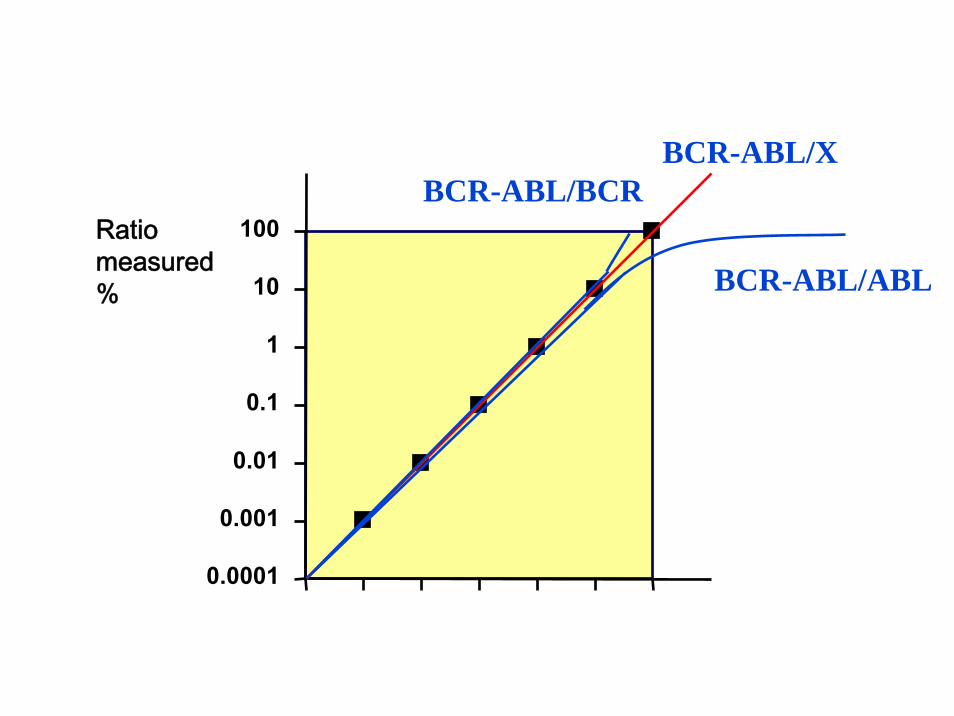
0.0001
0.001
0.01
0.1
1
10
100
BCR-ABL/X
BCR-ABL/ABL
BCR-ABL/BCRRatiomeasured%
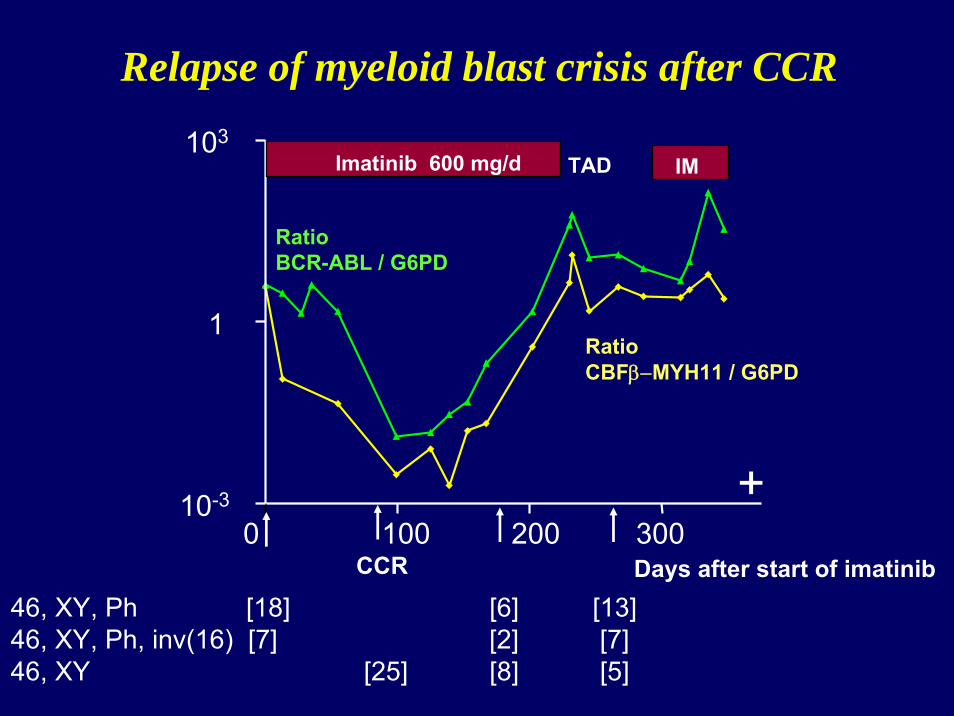
46, XY, Ph [18] [6] [13]46, XY, Ph, inv(16) [7] [2] [7]46, XY [25] [8] [5]
Relapse of myeloid blast crisis after CCR
0 100 200 30010-3
1
103
Days after start of imatinib
Imatinib 600 mg/d TAD IM
RatioBCR-ABL / G6PD
RatioCBFβ−MYH11 / G6PD
+CCR

Cytogenetic response CR PR MR NRat month 6
n 16 18 12 14
Ratio BCR-ABL / ABL (%):Month 1 29.0 49.0 50.0 52.0 n.s.
Month 2 4.7 31.0 40.0 74.0 p = 0.027
Month 3 2.5 18.0 40.0 38.0 p < 0.0001
Molecular response precedescytogenetic remission in CP patients
Merx et al., Leukemia 2002

Nested PCR positiveUndetectableBCR-ABL
Rat
io B
CR
-AB
L/A
BL
(%)
Months
Molecular Monitoring,German CML Study IV
3
1295.1
6
1400.95
9
1040.63
12
2030.25
15
820.21
18
1120.12
21
700.11
24
1580.087
27
670.052
30
490.019
36
640.012
0,01
0,1
1
10
100
nmedian
0.1%MMR

IRIS Study: Ratio BCR-ABL/BCR -by Laboratory
Hughes et al. ASH, 2002.
USAAUS UKMonths since CCR
CCR 3 6 9 12 15
n=1
n=73
n=46
n=21
n=11
2n=
85
n=18
n=95
n=79 n=9
n=62
n=60
n=11
n=52
n=38 n=9
n=50
n=37
BC
R-A
BL/
BC
Rra
tio (%
)
<0.001
0.001
0.01
0.1
1
10
100
<0.001
0.001
0.01
0.1
1
10
100

Standardized Log Reduction -by Laboratory
Hughes et al. ASH, 2002.
n=1
n=73
n=46
n=21
n=11
2n=
85
n=18
n=95
n=79 n=9
n=62
n=60
n=11
n=52
n=38 n=9
n=50
n=37
Log
redu
ctio
n
CCR 3 6 9 12 154.5
43.5
32.5
21.5
10.5
0
4.54
3.53
2.52
1.51
0.50
USAAUS UKMonths since CCR

IRIS Study: Event-Free Survival by Molecular Response at 18 Months
Baccarani et al. ASH 2006.
EFS
(%)
Response at 18 monthsCCyR with >3 log reductionCCyR with <3 log reductionNo CCyR
0102030405060708090
100
Months since randomization0 12 24 36 48 60 72

Yvonne Heimann here, today I received my 7/9/02 test results.20 normal cells, Fish NEGATIVEPCR .6Sounds like Gleevec did it again. Not sure if this qualifies me for the Zeroclub but pretty close.
Hi,I don't think I'm on your list and would like to join the others.My name is E.F. I was a member of the phase 1 group at UCLA. I was diagnosed 3/98 in Chronic Phase. I began Gleevec (300mg) 1/99 (Thefirst person to take 300mg). Reached CCR 6/99. Still not sure if I'm in MR. UCLA kept changing PCR tests so my results were never very reliable although others like L.B. have been neg on all the different tests. Last year was neg on 2 successive highly sensitive quantitative tests but relapsed (?) in June...E.F.

Hi George,Molecular remission is when they look at a large number of cellsin your blood, eg. 1 million. If no bcr/abl is found in 1 million cells, then you are in molecular remission. This can be done only through quantitative pcr testing. 0.08% means you are getting there but still not there. Different institutions have different ways of pcr testing. Some look at 10,000 cells, some look at 1 million. The bigger the sample size, more sensitive is the test. There is no universal standard. The trick is to go on testing at one particular machine and achieve their zero and mantain it. You must ask your doctor what number they consider pcr negative.Rgds, Anjana

Methods of Expression of Molecular Response
• Ratios target/standard geneAfter standardization of methods and rigorous controlrounds, eg, ratio BCR-ABL/ABL (%)
• Lab-specific reference point:Pooled diagnostic samples,eg, Δ log ratio BCR-ABL/BCR (%)
• Individual calculation of relative molecular response:MRD level after therapy/pretherapeutic level,eg, individual Δ log ratio BCR-ABL/GUS (%)

Variability of the Individual“Pretherapeutic BCR-ABL Level”
Diagnosis After initialhydroxyurea
therapy
Rat
io B
CR
-AB
L/G
6PD
(%)
Acceleratedphase
Blasticphase
0.1
1
10
100
Δlog = 0.2 (0-1.3)P = 0.01

0,0001
0,001
0,01
0,1
1
10
1001 2 3 4 5
Startingamount 3th month 6th month 12th month9th month
The evidence obtained with the IRIS study is thatthe absolute and not the relative amount is important!
CCyRMinor Molecular Response
Major Molecular Response
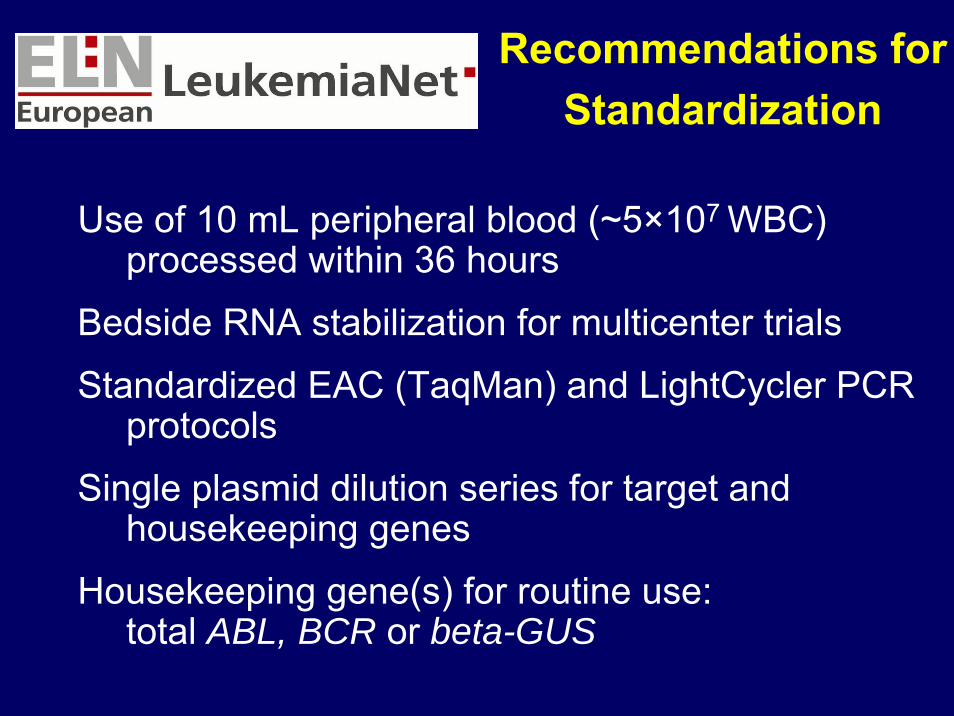
Recommendations forStandardization
Use of 10 mL peripheral blood (~5×10⁷ WBC) processed within 36 hours
Bedside RNA stabilization for multicenter trials
Standardized EAC (TaqMan) and LightCycler PCR protocols
Single plasmid dilution series for target and housekeeping genes
Housekeeping gene(s) for routine use:total ABL, BCR or beta-GUS

r=0.65
p=0.03
100
Ratio BCR-ABL/ABL [%]after 2 h storage time
Rat
io B
CR
-AB
L/A B
L [%
]af
ter 7
2 h
stor
age
time
0 25 50 75 1000
25
50
75
Unstabilized PB after 2 hrs vs. 72 hrs
Mueller et al., Leukemia 2002
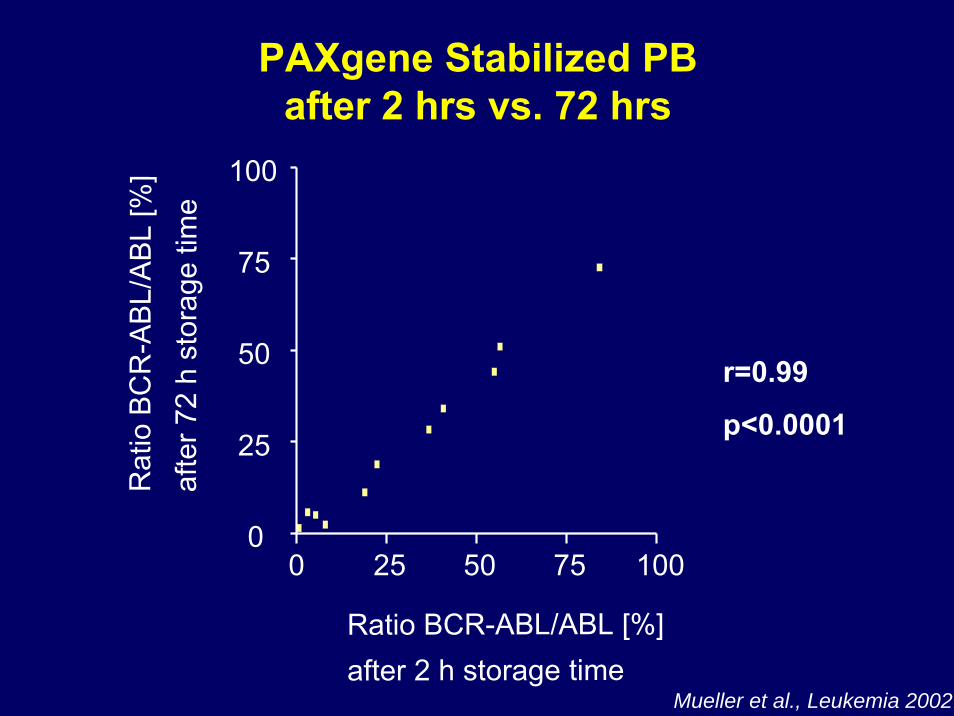
Ratio BCR-ABL/ABL [%]after 2 h storage time
Rat
io B
CR
-AB
L/A B
L [%
]af
ter 7
2 h
stor
age
time
0 25 50 75 1000
25
50
75
100
r=0.99
p<0.0001
PAXgene Stabilized PBafter 2 hrs vs. 72 hrs
Mueller et al., Leukemia 2002
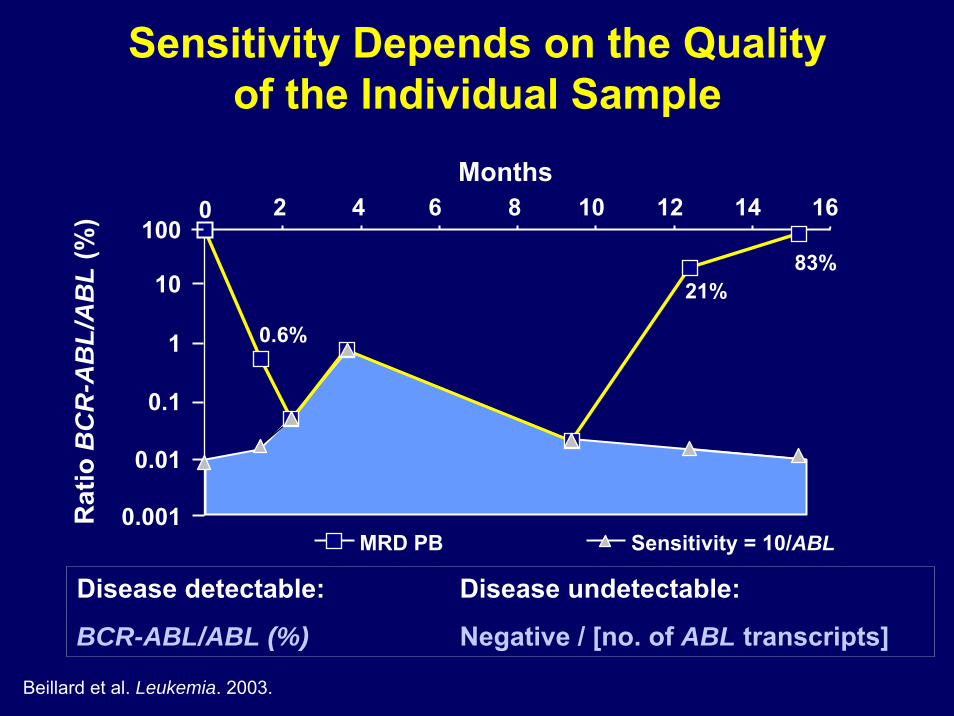
Disease detectable: Disease undetectable:
BCR-ABL/ABL (%) Negative / [no. of ABL transcripts]
MRD PB Sensitivity = 10/ABL
100
10
1
0.1
0.01
0.001
0
83%21%
0.6%
2 8 10 12 14 1664Months
Rat
io B
CR
-AB
L/A
BL
(%)
Beillard et al. Leukemia. 2003.
Sensitivity Depends on the Qualityof the Individual Sample

International Control Round (n=6)3 TaqMan labs:FrankfurtNewcastleTorino
3 Light Cycler labs:PortlandClevelandMannheim
Müller et al. ASH, 2003.
1
0.1
0.01
0.001
0.0001
0.00001
Negative
10%
1/20
1/50
1/10
Neg1/1
000 (
1T)
1/100
0 (2T
)1/1
000 (
4T)
1/100
00(1T
)1/1
0000
(2T)
1/100
00(4T
)
1/100
00(1T
)1/1
0000
(2T)
1/100
00(4T
)Neg Neg Neg
CV 0.71
Rat
io B
CR
-AB
L/A
BL
(%)
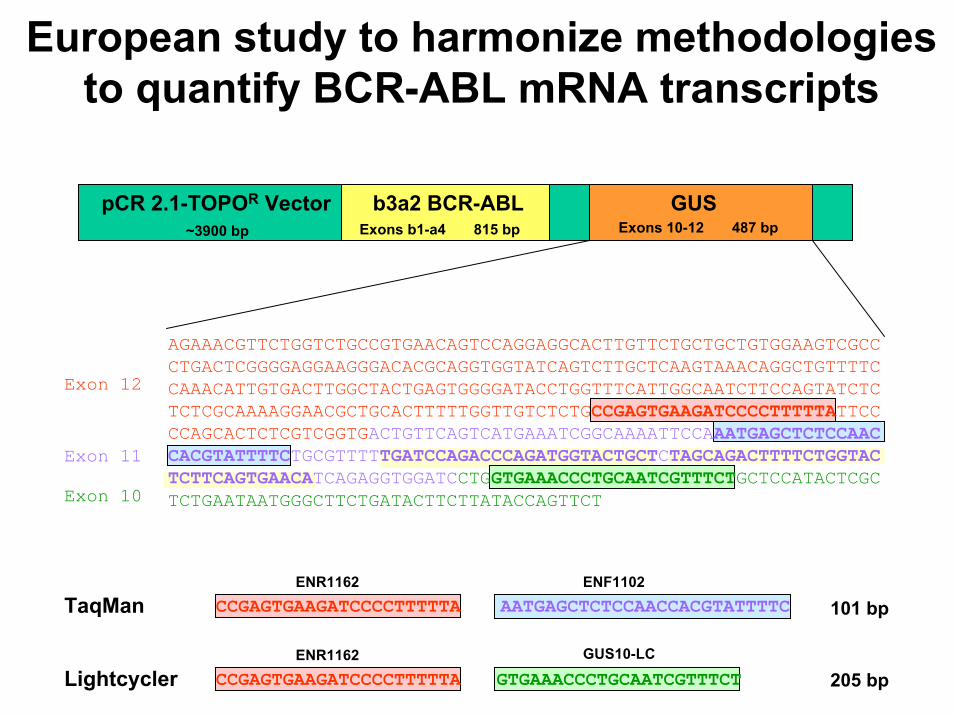
b3a2 BCR-ABL GUSExons b1-a4 815 bp Exons 10-12 487 bp
pCR 2.1-TOPOR Vector~3900 bp
AGAAACGTTCTGGTCTGCCGTGAACAGTCCAGGAGGCACTTGTTCTGCTGCTGTGGAAGTCGCCCTGACTCGGGGAGGAAGGGACACGCAGGTGGTATCAGTCTTGCTCAAGTAAACAGGCTGTTTTCCAAACATTGTGACTTGGCTACTGAGTGGGGATACCTGGTTTCATTGGCAATCTTCCAGTATCTCTCTCGCAAAAGGAACGCTGCACTTTTTGGTTGTCTCTGCCGAGTGAAGATCCCCTTTTTATTCCCCAGCACTCTCGTCGGTGACTGTTCAGTCATGAAATCGGCAAAATTCCAAATGAGCTCTCCAACCACGTATTTTCTGCGTTTTTGATCCAGACCCAGATGGTACTGCTCTAGCAGACTTTTCTGGTACTCTTCAGTGAACATCAGAGGTGGATCCTGGTGAAACCCTGCAATCGTTTCTGCTCCATACTCGCTCTGAATAATGGGCTTCTGATACTTCTTATACCAGTTCT
Exon 11
Exon 10
Exon 12
CCGAGTGAAGATCCCCTTTTTA AATGAGCTCTCCAACCACGTATTTTC
CCGAGTGAAGATCCCCTTTTTA GTGAAACCCTGCAATCGTTTCTGUS10-LC
TaqMan
Lightcycler
101 bp
205 bp
ENR1162
ENR1162
ENF1102
European study to harmonize methodologiesto quantify BCR-ABL mRNA transcripts

Variability of Ratios BCR-ABL/ABL (%)in 36 laboratories
CV 0.62
b3a2
10
%
b3a2
2 %
b3a2
1 %
b3a2
0.1
%
b3a2
neg
b2a2
10
%
b2a2
2 %
b2a2
1 %
b2a2
0.1
%
b2a2
neg
negative
0.01
0.1
1
10
100R
atio
BC
R-A
BL/
AB
L (%
)
Müller et al., Leukemia 2007
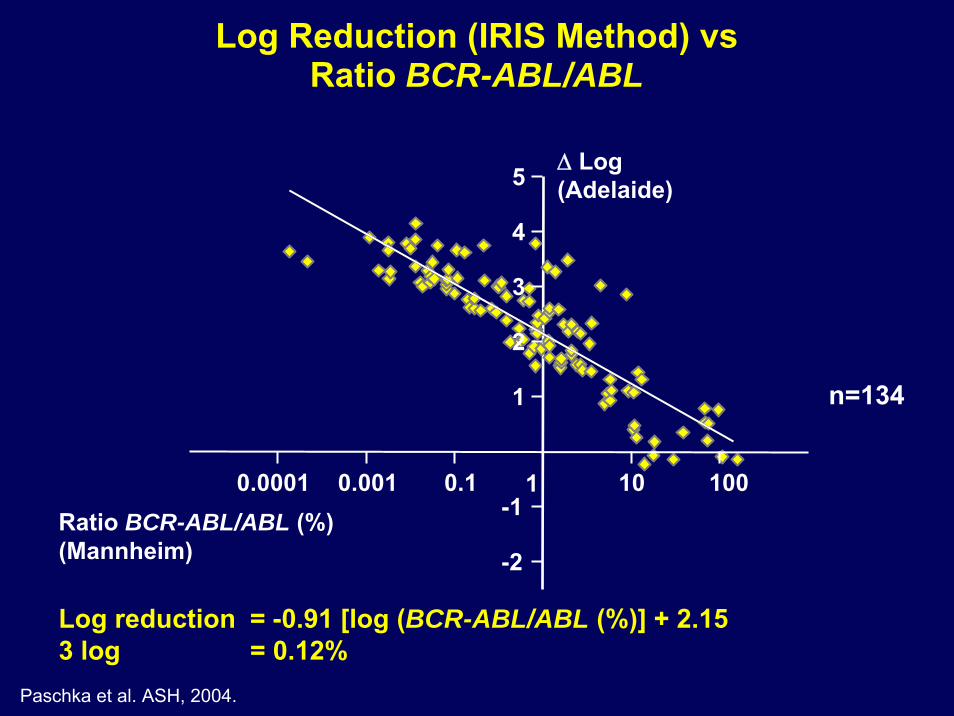
Log reduction = -0.91 [log (BCR-ABL/ABL (%)] + 2.153 log = 0.12%
Paschka et al. ASH, 2004.
Log Reduction (IRIS Method) vsRatio BCR-ABL/ABL
-2
5
Ratio BCR-ABL/ABL (%)(Mannheim)
Δ Log(Adelaide)
n=134
0.0001 0.001 0.1 10 100-1
1
2
3
4
1

Log y = (slope × (log MMRIS)) + interceptCF = MMRIS/ antilog y
Formula:
Log y = (0.9666 × (-1)) – 0.3568CF = 0.1/0.04749 = 2.1057
Example:
„Good“ example
Lab X
Lab
X

Lab X

One of 4 labs with linearity problem
„Bad“ example

0.0001
0.001
0.01
0.1
1
10
100
1000
BC
R-A
BL
Level 1 Level 2 Level 3 Level 4 Level 1 Level 2 Level 3 Level 4
MMR
BCR-ABLL
pre conversion
BCR-ABLIS
post conversionMannheim results
CV 1.85 1.06 0.91 0.87 0.28 0.27 0.33 0.43
BCR-ABL levels in 37 labs pre and post conversion

Oslo Turku St. Petersburg
Moscow
Istanbul
Athens
Barcelona
Salisbury
Vilnius
KrakowRotterdam
LilleMannheim Prague
Ostrava
Budapest Bucharest
Vienna
Tel-Hashomer
Torino
CF availableand validated, n=12
CF pending orvalidation pending,n=10
Validated CF availablein local labs, n=5
Berne
Aarhus

Oslo Turku
Salisbury
Mannheim
Torino
Local standardizationachieved or ongoing
Aarhus
Nordic countries
UK/Ireland
Italy
Germany

12 monthly
6 monthly until CCR confirmed
2 weekly until CHR confirmed
Recommendations by an Expert PanelRecommendations by an Expert Panel
BaccaraniBaccarani et al, Blood;2006;108;1809et al, Blood;2006;108;1809
MMR
3 monthly
Hematologic response
Cytogenetic response
Molecular response
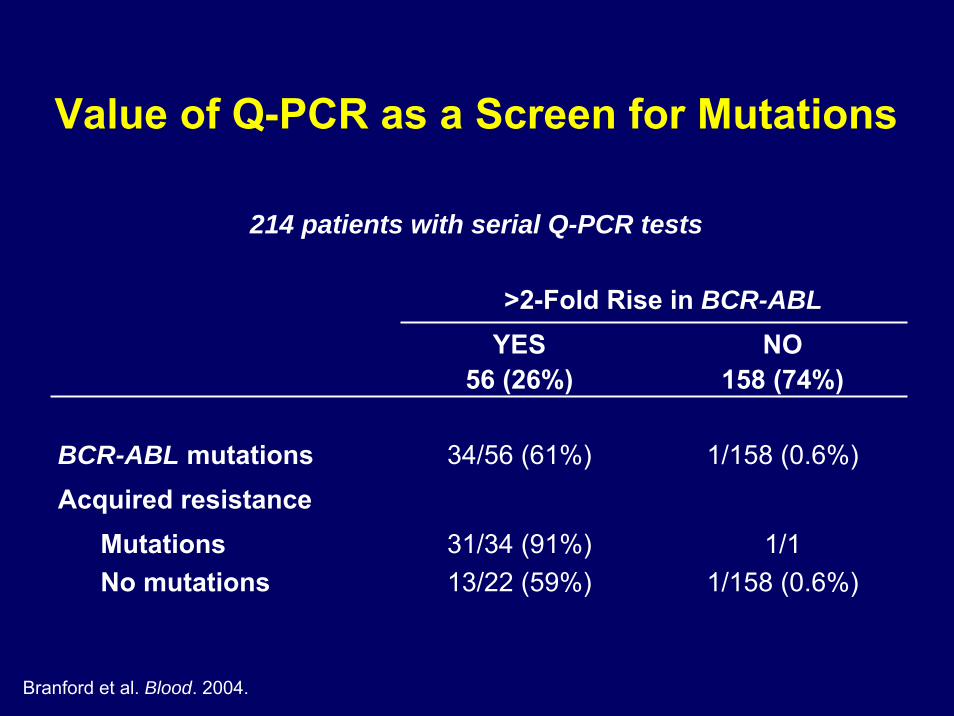
Value of Q-PCR as a Screen for Mutations
>2-Fold Rise in BCR-ABLYES NO
56 (26%) 158 (74%)
BCR-ABL mutations 34/56 (61%) 1/158 (0.6%)
Acquired resistanceMutations 31/34 (91%) 1/1No mutations 13/22 (59%) 1/158 (0.6%)
214 patients with serial Q-PCR tests
Branford et al. Blood. 2004.


loss of MMR
Recommendations by an Expert PanelRecommendations by an Expert Panel
BaccaraniBaccarani et al, Blood;2006;108;1809et al, Blood;2006;108;1809
3 monthly
Molecular response
CytoresponseMutation analysis
no MMR by 18m
5fold rise in BCR-ABL


Mutation testing:The impact of 2nd generation TK inhibitors
Andreas Hochhaus
Medizinische Fakultät MannheimRuprecht-Karls-Universität Heidelberg
Mannheim, Germany

BCR-ABL mutations (%)
Clonal evolution (%)
Combination (%)
10/20 (50)
15/29 (52)
5/17 (29)
13/21 (62)
8/16 (50)
2/9 (22)
10/33 (30)
16/22 (73)
4/17 (24)
33/74 (45)
39/67 (58)
11/43 (26)
Patients With Hematologic Resistance/Relapse
Chronicphase(n=35)
Acceleratedphase(n=33)
Blastic phase(n=66)
All (n=134)
Lahaye et al. Cancer. 2005
Molecular - Cytogenetic Causes of Resistance

0
2
4
6
8
10
12
14
16
18
V289
D27
6
L248
G25
0
Y253
E255
V304
M34
3
F311
Y353
F311
E352
M35
1
G32
1
T315
F317
E355
F359
V371
E373
V379
F382
L387
T389
H39
6
E459
F486
S417
M24
4
Q25
2
M23
7
<2%2-10%
>10%
% o
f pat
ient
s
Amino acid (ABL-B)
V V AE E
H
RIHF
KV G I G I L
IN L E T T HG D
GACV
G I LA M A PR
Y K S
Detection of BCR-ABL mutationsKinase domain mutations associated with imatinib resistance

M24
4V
G25
0E
Y253
F/H
E255
K/V
F311
L
T315
I
F317
L
M35
1T
E355
G
F359
V
V379
I
L387
M
H39
6R/P
BiochemicalCellular
Mutant BCR-ABL Have IncreasedIC50 Values for Imatinib Mesylate
wt
5
10
15
20
Fold
incr
ease
in IC
50
Corbin et al. Blood. 2003.
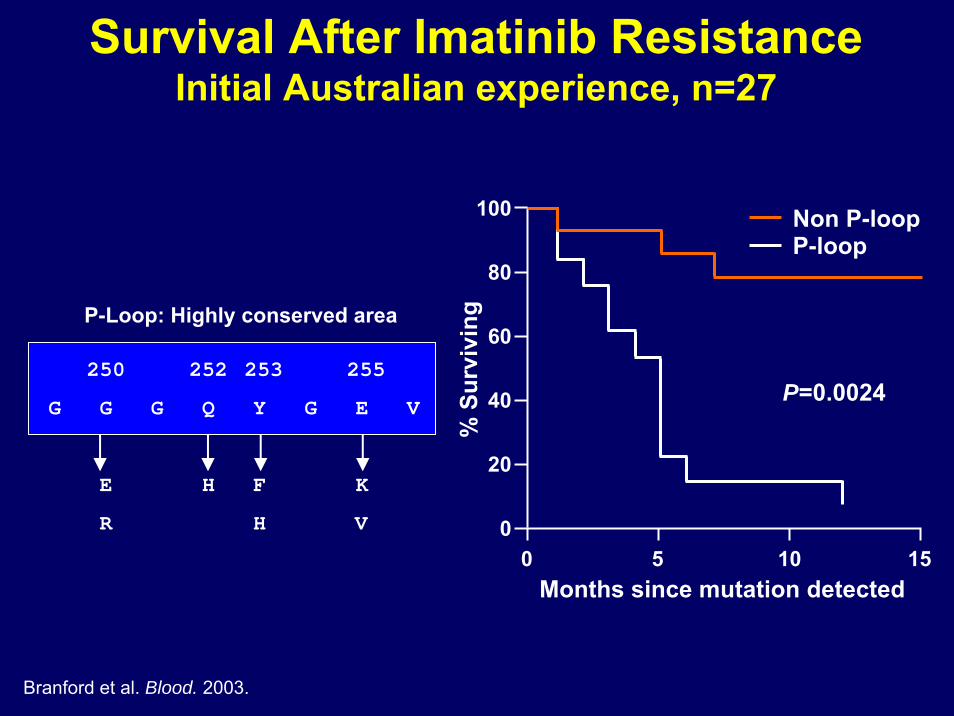
Branford et al. Blood. 2003.
P-Loop: Highly conserved area
250 252 253 255
G G G Q Y G E V
E H F K
R H V
Survival After Imatinib ResistanceInitial Australian experience, n=27
150 5 100
20
40
60
80
100
% S
urvi
ving
Months since mutation detected
Non P-loopP-loop
P=0.0024

Survival After Imatinib FailureCurrent Experience, n=105
0 1 2 3 40
25
50
75
100
T315I, n=14
Others, n=53
P-Loop, n=38p=0.031 for T315I
Prob
abili
tyof
sur
viva
l(%
)
Years

Imatinib 400-600 mg/d
Hydroxyurea
0 1 2 3
0
25
50
75
100
% M
utat
ed B
CR
-AB
L
Y253H, 100%
% CRKL-P
Years after startof imatinib
CML, CP,IFN resistant
Dynamics of resistance clones

Remission ResistanceMutated Nonmutated BCR-ABL
Pre-imatinibmesylate
P<0.0001 P<0.0001 P=0.002
0
25
50
75
100
% C
RK
L-P
E255KCRKL-PCRKL
BCR-ABL stillinhibited byimatinib mesylate
CRKL-P in Resistant Patients

Methods to detect and quantify BCR-ABL mutations
Specificity Sensitivity
Sequencing non specific ~10%
Restriction digest analysis specific ~2-5%
D-HPLC non specific 0.1-1%
Allele specific PCR specific 0.01%
Sequencing of clones non specific 1-5%

50%
10%
1%
0.1%
normal BaF3BCR-ABL
100%
*
*
*
*
*
mutant BaF3T315I *
Sensitivity ofD-HPLC
0.1-1%
Ernst et al. Haematologica 2008.

D-HPLC: Nested-PCR
Fragment A: BCR (Fragment A: BCR (ExonExon b2 / e1) b2 / e1) –– ABL (ABL (ExonExon 10/11)10/11)
BCRBCR ABL ABL KinaseKinase DomDomääne (AA 235ne (AA 235--509)509)
B (AA 207B (AA 207--324)324)
C (AA 279C (AA 279--414)414)
D (AA 382D (AA 382--517)517)
1.Schritt1.Schritt
2.Schritt2.Schritt
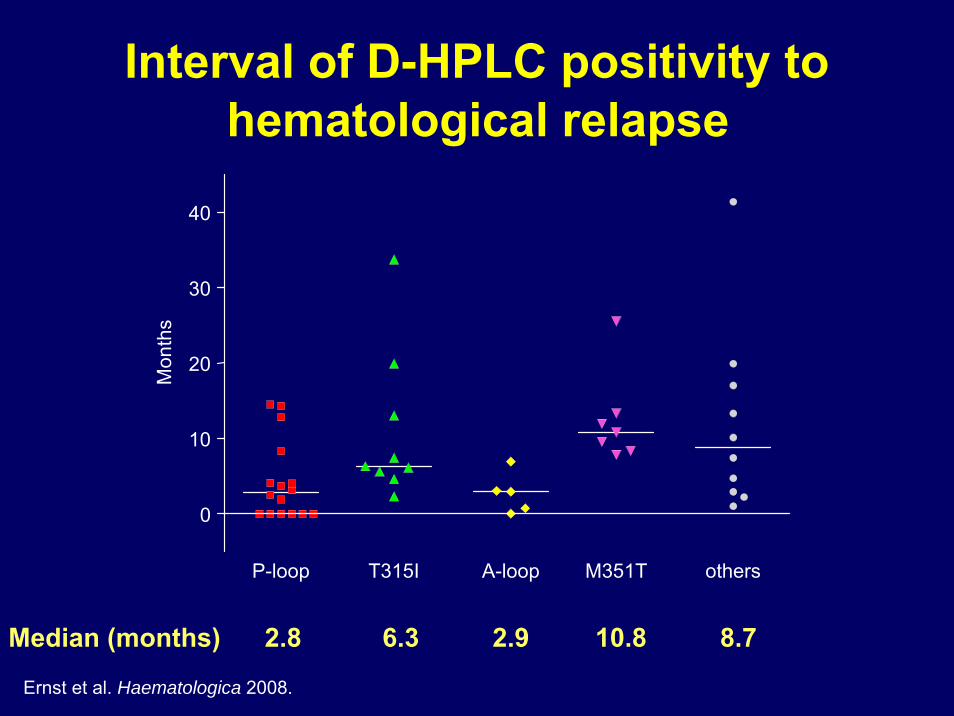
P-loop T315I M351TA-loop others
0
10
20
30
40
Mon
ths
Median (months) 2.8 6.3 2.9 10.8 8.7
Interval of D-HPLC positivity tohematological relapse
Ernst et al. Haematologica 2008.

Comparison of D-HPLC vs. allele-specific PCRsfor 11 key mutations
G250E
Q252H
Y253F
/H
E255K
/V
V299L
T315I
F317L
M351T
F359V
0
10
20
30
40
50
60
70
Tota
l num
ber o
f det
ecte
d m
utat
ions
D-HPLCARMSL-PCR

Dasatinib (BMS-354825)
Imatinib (STI-571) Nilotinib (AMN107)
20,23

Cellular IC50
Dasatinib Imatinib nnM nM
H396P/R 0.6-1.3 850-4200 7
M351T 1.1 930 8
M244V 1.3 2000 8
G250E 1.8 1350-3900 9
Y253F/H 1.3-10 >10000 5
L387M 2 1000 2
F359V 2.2 1200 2
Q252H 3.4 1300-3900 2
E255K/V 5.6-13 4400-8400 6
F317L 7.4-18 810-1500 3
T315I >1000 >10000 3
Complete CyR
Partial CyR
Complete HR
No response
Müller et al., ASH 2006
Response to dasatinib is associated with cellular IC50of post-imatinib mutation (CP-CML)
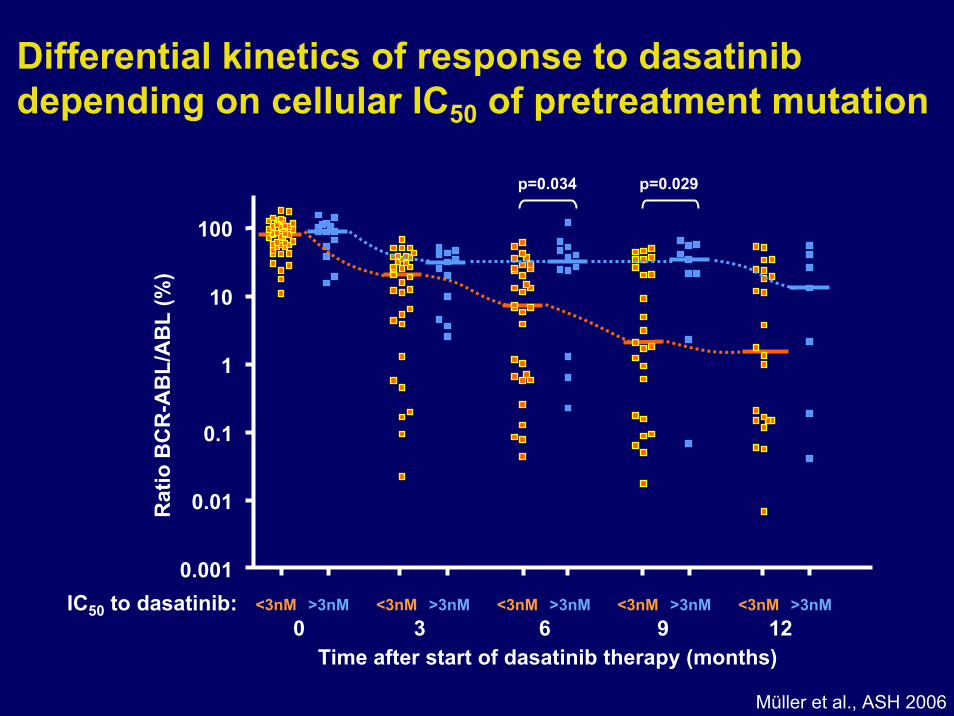
0.001
0.01
0.1
1
10
100
<3nM0
>3nM <3nM >3nM <3nM >3nM <3nM >3nM <3nM >3nM
Time after start of dasatinib therapy (months)3 6 9 12
Rat
io B
CR
-AB
L/A
BL
(%)
p=0.034 p=0.029
IC50 to dasatinib:
Differential kinetics of response to dasatinibdepending on cellular IC50 of pretreatment mutation
Müller et al., ASH 2006
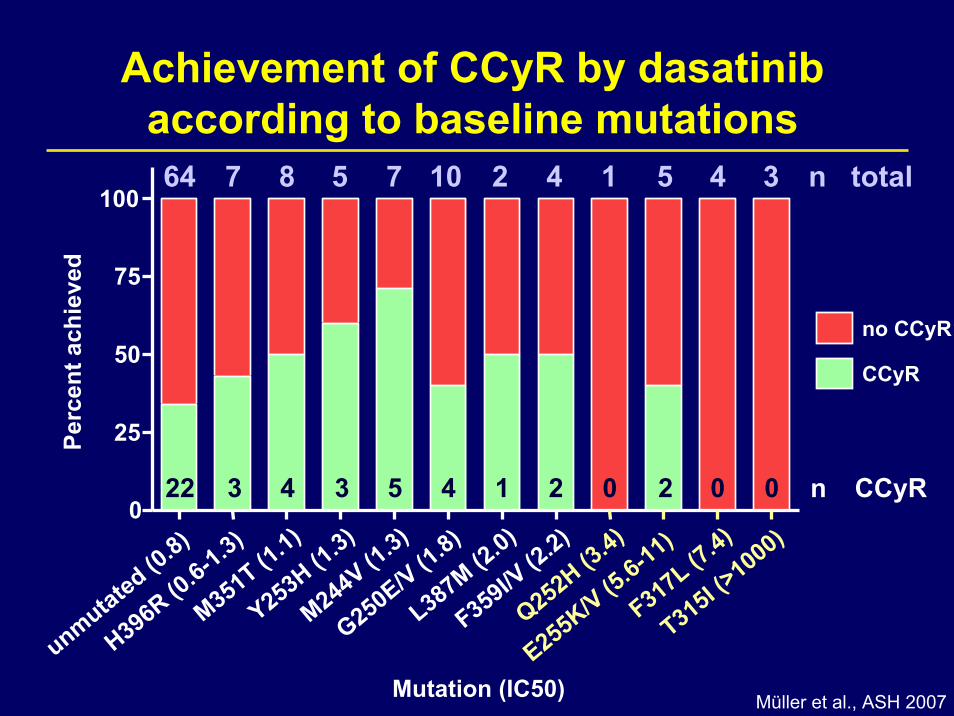
unmutated (0.8)
H396R (0.6-1.3)
M351T (1.1)
Y253H (1.3)
M244V (1.3)
G250E/V (1.8)
L387M (2.0)
F359I/V (2
.2)
Q252H (3.4)
E255K/V (5.6-11)
F317L (7.4)
T315I (>1000)
0
25
50
75
100
Perc
ent a
chie
ved
Mutation (IC50)
64 7 8 5 7 10 2 4 1 5 4 3 n total
22 3 4 3 5 4 1 2 0 2 0 0
no CCyR
CCyR
Achievement of CCyR by dasatinibaccording to baseline mutations
n CCyR
Müller et al., ASH 2007

Achievement of MMR (<0.1% BCR-ABLIS) after 24 months by dasatinib according to
baseline mutations64 7 8 5 7 10 2 4 1 5 4 3
unmutated (0.8)
H396R (0.6-1.3)
M351T (1.1)
Y253H (1.3)
M244V (1.3)
G250E/V (1.8)
L387M (2.0)
F359I/V (2
.2)
Q252H (3.4)
E255K/V (5.6-11)
F317L (7.4)
T315I (>1000)
0
25
50
75
100
Perc
ent a
chie
ved
Mutation (IC50)
n total
no MMR
MMR
n MMR9 0 2 1 2 0 1 1 0 1 0 0
Müller et al., ASH 2007

100
10
1
0.1
0.01
0.001
0.0001
Negative
100
50
0
Rat
io B
CR
-AB
L/G
US
(%) M
utated BC
R-A
BL (%
)
G250E (%)
Total BCR-ABL
Course of mutated and unmutated BCR-ABL– 3 patterns –
Pattern 1: n=30Baseline mutation disappeared AND BCR-ABL decreased
Müller et al., ASH 2007

Pattern 2: n=23Baseline mutation disappeared AND BCR-ABL persisted
– new mutations evolved in n=12 patients(T315I n=3; F317L n=7; M351T n=2; Y320C n=1)
100
10
1
0.1
0.01
0.001
0.0001
Total BCR-ABL
Negative
100
50
0
Rat
io B
CR
-AB
L/G
US
(%)
Mutated B
CR
-AB
L (%)
H396R (%)
F317L (%)
Course of mutated and unmutated BCR-ABL– 3 patterns –
Müller et al., ASH 2007
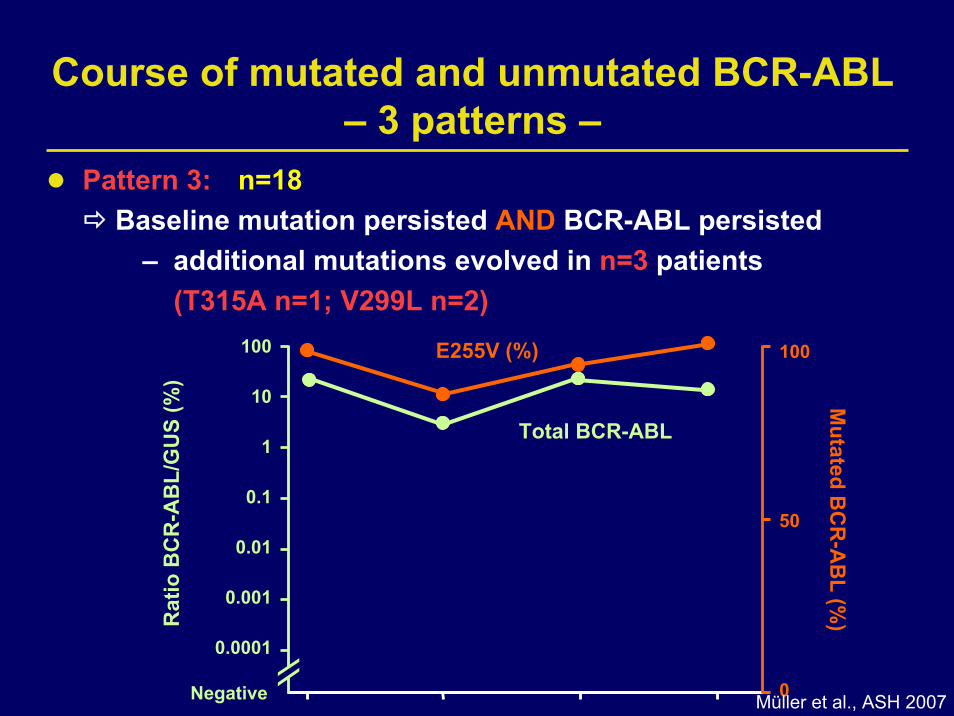
Pattern 3: n=18Baseline mutation persisted AND BCR-ABL persisted
– additional mutations evolved in n=3 patients(T315A n=1; V299L n=2)
Course of mutated and unmutated BCR-ABL– 3 patterns –
100
10
1
0.1
0.01
0.001
0.0001
Negative
100
50
0
Mutated B
CR
-AB
L (%)
Total BCR-ABL
E255V (%)
Rat
io B
CR
-AB
L/G
US
(%)
Müller et al., ASH 2007

Nilotinib sensitivity of cells expressing imatinib-resistant BCR-ABL with point mutations
F317C
G250V
M388L
E255D
S348L
F317V
E275K
M237I
E355A
M351T
L387F
E355G
E281K
E255R
K285N
G250A
Q252H
M244V
F486S
D276G
E292K
F317L
L248V
G250E
F311V
F359V
A380S
F359C
E255K
Y253H
E255V
T315I
0
500
1,000
1,500
10,000
IC50
Cel
l Pro
lifer
atio
n (n
M)
Nilotinib sensitive:Range 19–791 nM
Nilotinib resistant:>10,000 nM
Trough levels at 400 mg nilotinib BID (1,700 nM)exceed IC50 for 32/33 mutations.
H396R
Manley PW, et al. Proc Am Assoc Cancer Res. 2005

Best Responses to Nilotinib in Imatinib-Resistant Patients with and without Baseline Mutations by 12 Months
• Clinical efficacy of nilotinib demonstrated in both mutant and non-mutant group
6050
2125
42
81
32
71
0
20
40
60
80
100
CHR MCyR CCyR MMR
Res
pond
er%
No mutationAny mutation*
* patients with T315I were excluded
N=42 N=79 N=83 N=99 N=83 N=99 N=72 N=84

CML-CP: Best response within 6 monthsby cellular IC50 to nilotinib
Baseline CellularMutation IC50 (nM)
T315I >10,000
Y253H 700
E255K 548
F359C 161
F317L 91
D276G 77
M244V 67
E355G 47
H396R 41
M351T 38
IC50 >10,000 nM:4 no response
IC50 >100 nM:2 PCyR2 CHR5 no response
IC50 <100 nM:
8 CCyR2 PCyR7 CHR1 no response
ASH 2006

Slide 67
Best Responses to Nilotinib by 12 Months in Imatinib-Resistant Patients with Different Mutant Types
• Patients with mutations of IC50 ≤150 nM achieved comparable responses to the non-mutant group
• Less favorable responses seen in patients with Y253H, E255K/V, and F359C/V.
CHR MCyR CCyR MMR
n/N (%) n/N (%) n/N (%) n/N (%)
No Mutation 34/42 (81) 50/83 (60) 35/83 (42) 18/72 (25)
Y253H 700 0/6 (0) 1/8 (13) 0/8 (0) 0/7 (0)
F359C/V 258/161 2/9 (22) 1/10 (10) 0/10 (0) 0/9 (0)
Others 14/17 (82) 19/38 (50) 14/38 (37) 5/28 (18)
IC50 ≤150 nM 31/38 (82) 28/49 (57) 18/49 (37) 12/44 (27)
IC50 >150 nM
E255K/V 548/791 5/8 (63) 3/8 (38) 0/8 (0) 1/7 (14)
Mutation IC50 (nM)
* patients with T315I were excluded
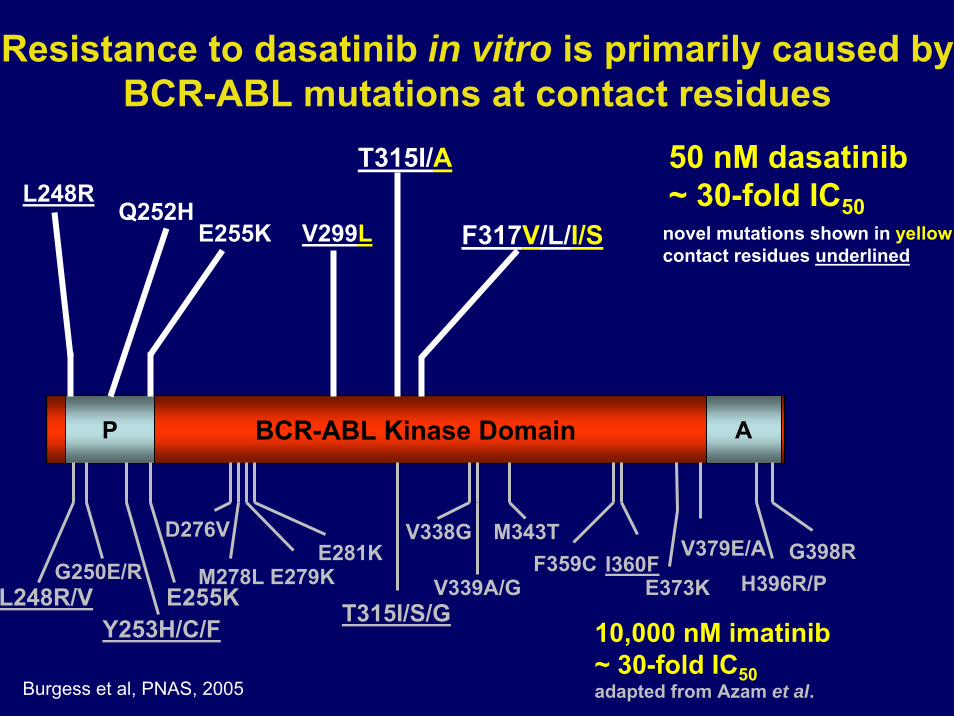
BCR-ABL Kinase DomainP A
T315I/A
V299LL248R
E255KQ252H
50 nM dasatinib~ 30-fold IC50
Y253H/C/FE255K T315I/S/GL248R/V
M278LG250E/R F359CH396R/P
M343T
E373KE279KE281K
V338G
V339A/GI360F
V379E/A G398RD276V
10,000 nM imatinib ~ 30-fold IC50adapted from Azam et al.
F317V/L/I/S novel mutations shown in yellowcontact residues underlined
Resistance to dasatinib in vitro is primarily caused by BCR-ABL mutations at contact residues
Burgess et al, PNAS, 2005

Distinct mechanisms of resistance to imatinib and dasatinib
IC50 for growth (nM)BaF3 Clone
Imatinib DasatinibUnmut. BCR-ABL <1000 <5T315I >10000 >500T315A 1000 100F317L 2000 10F317V <1000 60V299L 1000 20L248R >10000 20
Burgess et al, ASH 2004

Y253H/C/FE255K T315I/S/GL248R/V
BCR-ABL Kinase DomainP A
M278LG250E/R F359CH396R/P
M343T
E373KE279KE281K
V338G
V339A/GI360F
V379E/A G398RD276V
T315I 50 nM dasatinib+ 10 µM Imatinib
contact residues underlined
Combination of imatinib and dasatinib further reduces the range of resistant clones
E255K
10,000 nM imatinib ~ 30-fold IC50adapted from Azam et al., Cell 112:831-843Burgess et al, PNAS, 2005

P C SH2 A
E255D/K/R/VY253F/H
Q252HG250E
F359C/VL248VM244V D276G F311V
T315IF317L D325N E355A A380S
M388LM237I
K285NE281K
E275K
M351LS348L
Q252H
F359I
Y253HE255K/V
F311IT315I
S349L*
* Q252H/S349L Double mutant von Bubnoff et al. Blood 2006
Nilotinib produces a limited number of resistance mutations
Nilotinib
Imatinib

Spectrum and frequency of BCR-ABL KD mutations recovered after TKI therapy
• T315I and F359V recovered after treatment with Bosutinib
0
5
10
15
20
G250E Y253F/H E255G/K V299L F311I/L T315I F317L/V M351T E355G/A F359C/V H396P/R
BCR/ABL Mutation
%
ImatinibDasatinibNilotinib
Jabbour et al., ASH 2006

Emerging BCR-ABL mutations on DasatinibNew mutations: n=22
F317L n=7; T315I n=3; V299L n=2; T315A n=1; M351T n=2; Y320C n=1; L248V n=1; G250E n=1; Y232H n=1; K271R n=1; A344V n=1; E507G n=1
Incidence: 22 cases in 288 yrs pt. exposure in 201 pts7.6%/patient-year
Time to detection: 11 months (median, range 3–23)
Baseline mutation: in 17 of 22 (77%) patients
Post CCyR: 8/22 pts risk to develop new mutations afterachievement of CCyR 8/55 = 14.5%
Post MMR: 4/22 pts risk to develop new mutations afterachievement of MMR 4/30 = 13.3%
Müller et al., ASH 2007

All Resistant Intolerant
With Baseline Mutations 30/113 (27) 29/104 (28) 1/9 (11)
Without Baseline Mutations 13/162 (8) 11/83 (13) 2/79 (3)
n/N (%) n/N (%) n/N(16) 3/88(21)40/187
(%)All Emerging Mutations 43/275 (3)
Newly Detectable Mutations DuringNilotinib Therapy
• Patients with baseline mutation had higher incidence of emerging mutation compared to patients without baseline mutation
• Of 187 resistant patients, E255K/V was newly detected in 10 (5%)patients; T315I in 9 (5%); G250E in 7 (4%), and Y253H in 5 (3%)patients
• 57% of resistant patients with newly detectable mutation progressed
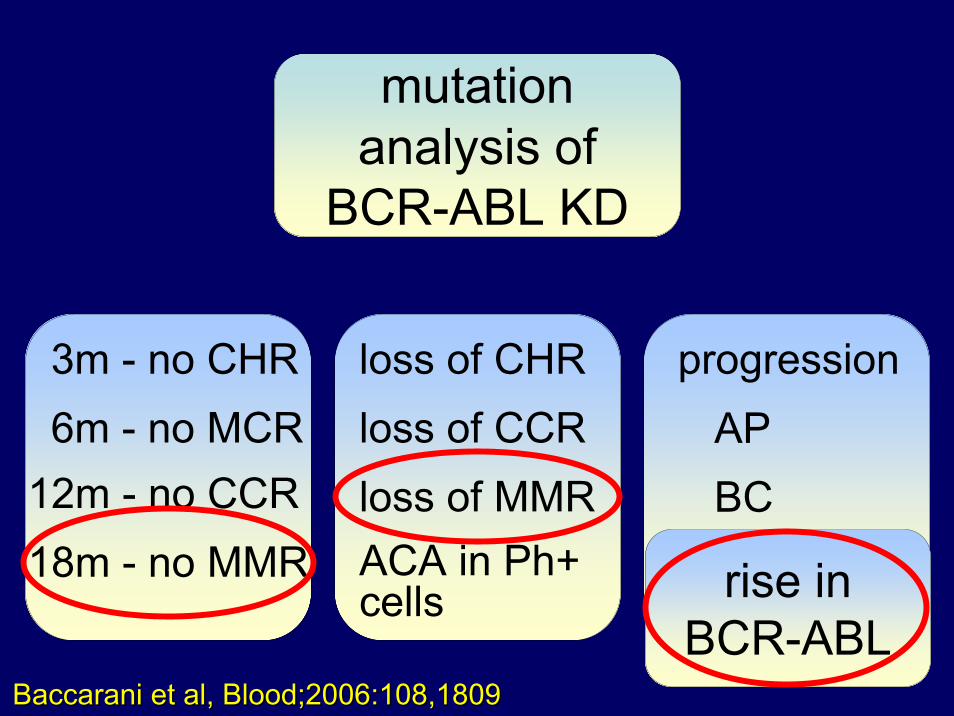
mutationanalysis of
BCR-ABL KD
BaccaraniBaccarani et al, Blood;2006:108,1809et al, Blood;2006:108,1809
loss of CHRloss of CCRloss of MMRACA in Ph+ cells
12m - no CCR18m - no MMR
3m - no CHR6m - no MCR
progressionAPBC
rise in BCR-ABL
mutation


133 centersin 24 countries
92 national leukemia study groups
87 interdisciplinary partner groups
1000 physicians and scientists in
Caring for ten thousands of patients