Monitoring CML patients by quantitative real time PCR on ... · Monitoring CML patients by...
57
Monitoring CML patients by quantitative Monitoring CML patients by quantitative real time PCR on the International Scale real time PCR on the International Scale Nick Cross University of Southampton, UK
Transcript of Monitoring CML patients by quantitative real time PCR on ... · Monitoring CML patients by...
Monitoring CML patients by quantitative Monitoring CML patients by quantitative real time PCR on the International Scalereal time PCR on the International Scale
Nick Cross
University of Southampton, UK

Methods to specifically detect CML cellsMethods to specifically detect CML cells
BCRrearrangement
BCR-ABLprotein
BCR/ABLjuxtaposition
BCR-ABLmRNA

Routine methods to specifically detect CML cellsRoutine methods to specifically detect CML cells
Cytogenetics BM
Method Target
Ph-chromosome 1 - 10
Tissue Sensitivity (%)
FISH
RQ-PCR
PB/BM
PB/BM
Juxtaposition of BCR & ABL
BCR-ABL mRNA
0.2 - 5
Up to 0.001
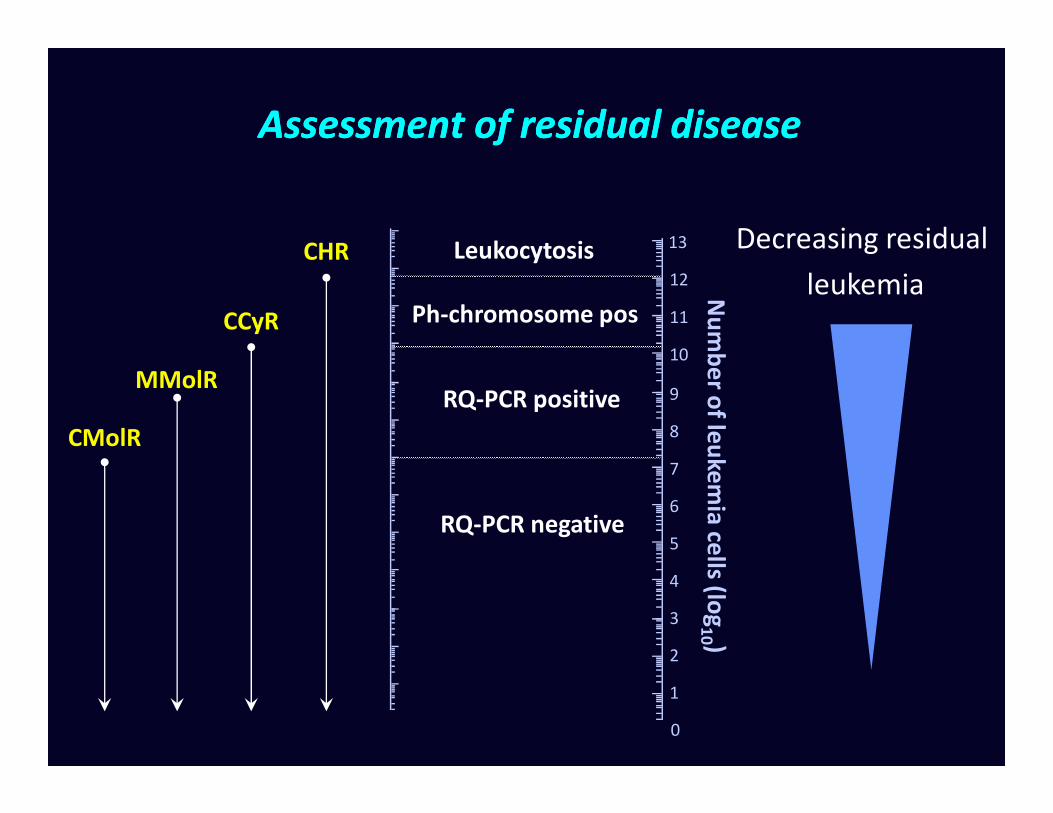
Assessment of residual diseaseAssessment of residual disease
Nu
mb
er o
f leu
kem
ia ce
lls (log
9
10
11
12
13LeukocytosisCHR
Ph-chromosome posCCyR
Decreasing residual
leukemia
RQ-PCR positiveMMolR
Nu
mb
er o
f leu
kem
ia ce
lls (log
10 )
0
1
2
3
4
5
6
7
8
RQ-PCR positive
CMolR
RQ-PCR negative

Why is it important to monitor molecular Why is it important to monitor molecular response to BCRresponse to BCR--ABL inhibitors?ABL inhibitors?
• The degree to which the bulk of disease is reduced is an important prognostic indicator
• Poor primary response or relapse after initial • Poor primary response or relapse after initial response both suggest the need to change therapy
• Molecular monitoring by RQ-PCR provides:
– A deeper assessment of response
– The means to detect relapse earlier than other methods
Hughes T, et al. Blood 2006;108:28-37.Cross NCP. Best Pract Res Clin Haematol 2009;22:355-365.

RQRQ--PCR: strengths and weaknessesPCR: strengths and weaknesses
• Strengths
– Only technique that can gauge molecular therapeutic milestones: major molecular response (MMR) and complete molecular response (CMR)
– Routinely performed on peripheral blood– Routinely performed on peripheral blood
• Weaknesses
– Technically challenging
– Issues concerning comparability of results between centres
– Several different methods / units of measurement

• History of molecular monitoring in CML
• The International Scale for BCR-ABL
• Ongoing efforts to standardize BCR-ABL testing
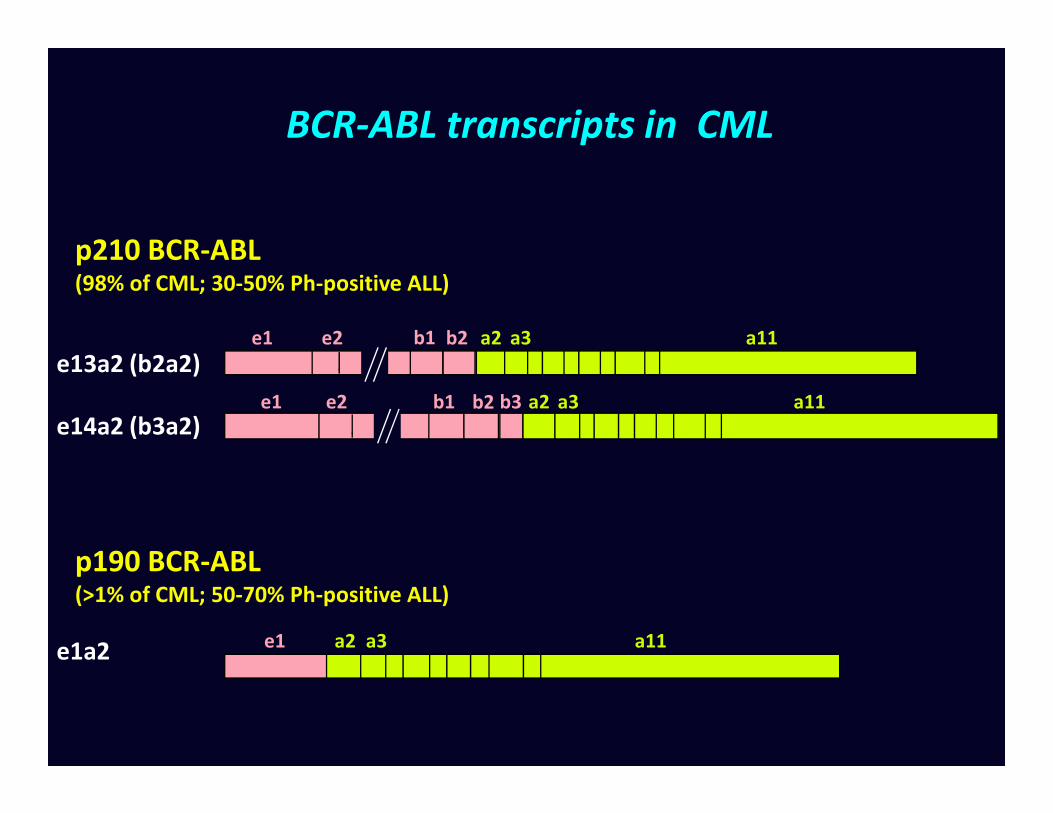
BCR-ABL transcripts in CML
p210 BCR-ABL (98% of CML; 30-50% Ph-positive ALL)
e13a2 (b2a2)e1 e2 a2 a3 a11b1 b2
b1e1 e2 b2 a2 a3b3 a11
e1a2 a11a2 a3e1
e14a2 (b3a2)b1e1 e2 b2 a2 a3b3 a11
p190 BCR-ABL (>1% of CML; 50-70% Ph-positive ALL)

Minor BCR-ABL mRNA variants in CML detected by multiplex RT-PCR
M e6a2 e14a3 e14a2 e13a2 Ph-CML
Healthy
control
e1a2 Neg.-
control
BCR
BCR-ABL
SD1 K562 BV173Cell lines
• 98%: e13a2 or e14a2 (~10% express both e13a2 and e14a2)
• 1%: e13a3 or e14a3
• 1%: e1a2, e6a2, e8a2, e19a2, others
BCR-ABL
Cross et al. Leukemia 1994;8(1):186-9
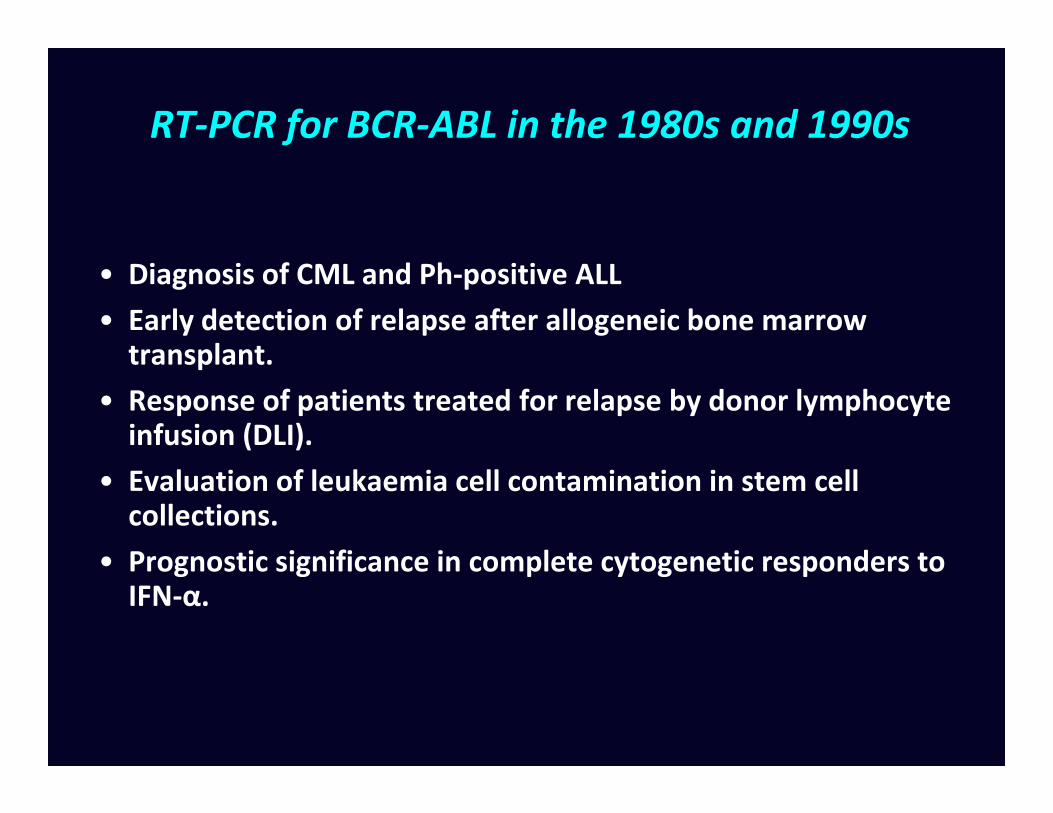
RT-PCR for BCR-ABL in the 1980s and 1990s
• Diagnosis of CML and Ph-positive ALL
• Early detection of relapse after allogeneic bone marrow transplant.
• Response of patients treated for relapse by donor lymphocyte • Response of patients treated for relapse by donor lymphocyte infusion (DLI).
• Evaluation of leukaemia cell contamination in stem cell collections.
• Prognostic significance in complete cytogenetic responders to IFN-α.

Early uses of RT-PCR to detect BCR-ABL mRNA

Detection of BCR-ABL mRNA by nested RT-PCR
BCR-ABL ABL
1 2 3 4 5 B M5 B 1 2 3 4 5 B M5 B
b3a2b2a2
b1 b2 b3 a2 a3
1st step BCR-ABL
B2A CA3-2nd step BCR-ABL
NB1+ Abl3-
BCR ABL
A2 CA3-
ABL control
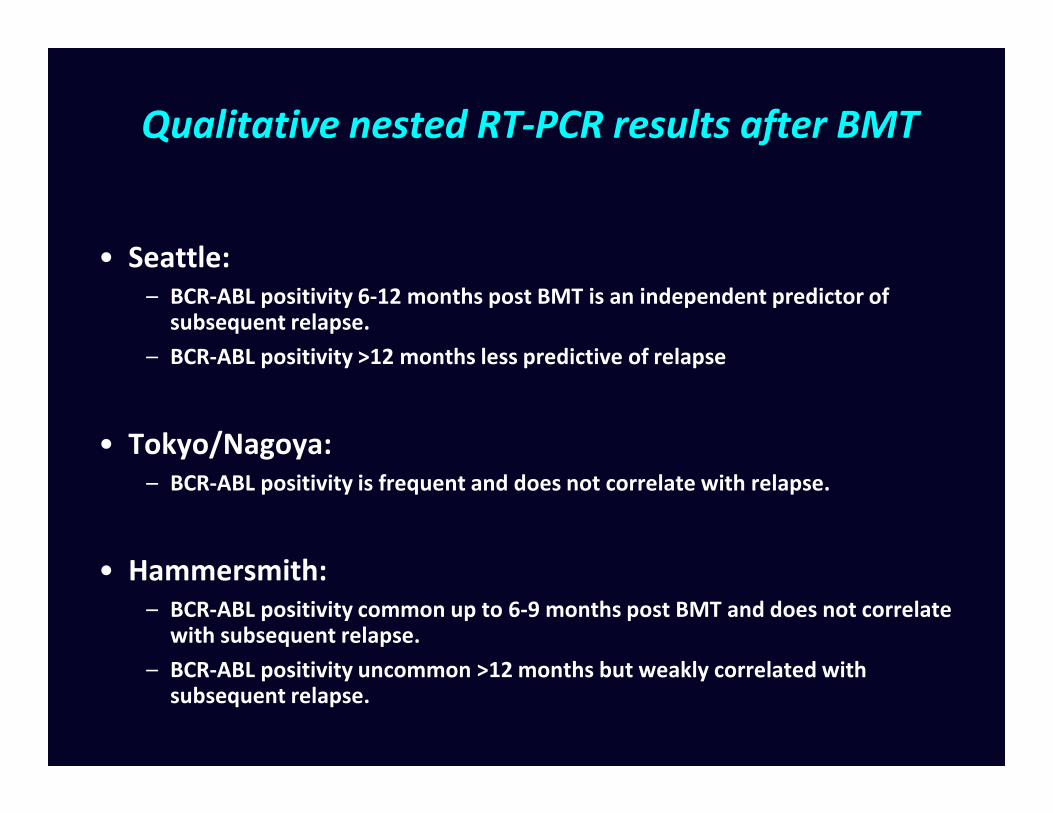
Qualitative nested RT-PCR results after BMT
• Seattle:
– BCR-ABL positivity 6-12 months post BMT is an independent predictor of subsequent relapse.
– BCR-ABL positivity >12 months less predictive of relapse
• Tokyo/Nagoya:
– BCR-ABL positivity is frequent and does not correlate with relapse.
• Hammersmith:
– BCR-ABL positivity common up to 6-9 months post BMT and does not correlate with subsequent relapse.
– BCR-ABL positivity uncommon >12 months but weakly correlated with subsequent relapse.

Competitive RT-PCR to quantify BCR-ABL mRNA
106
104
105
103
105.5
104.5
103.5
competitor
BCR-ABL
b2 b3 a2 a3
CA3-
Abl3-
b1
B2A
NB1+ A2N
a4
A4-
b2 b3 a2 a3INSERTb1 a4
Cross et al. Blood. 1993;82(6):1929-36

Competitive RT-PCR to quantify BCR-ABL mRNA
1 2 3 4 5 B B K BV
BCR
b3a2
1 2 3 4 5 B M5 B M
b3a2b2a2
Multiplex PCR Nested PCR
1 2 3 4 5 B B K BV
BCR
b3a2
1 2 3 4 5 B M5 B M
b3a2b2a2
Multiplex PCR Nested PCR
b3a2b2a2
b3a2b2a2
BCR-ABL competitive PCR #1
2 41
104
103
10105
102
104
103
106
102
BCR-ABL competitive PCR #2
2 41
<102 x 105
6 x 10³
104
103
103.5
105.5
106
105
1030 0
b3a2b2a2
b3a2b2a2
BCR-ABL competitive PCR #1
2 41
104
103
10105
102
104
103
106
102
BCR-ABL competitive PCR #2
2 41
<102 x 105
6 x 10³
104
103
103.5
105.5
106
105
1030 0
Cross et al. Blood. 1993;82(6):1929-36

Patterns of remission post BMT
CytogeneticRelapse
HaematologicRelapse
1
10
100
AB
L/A
BL
rati
o (
%)
0
Months post BMT12 246 18
PCR negative
PCR positive
0.0001
0.001
0.01
0.1
BC
R-A
BL/
AB
L ra
tio
(%
)
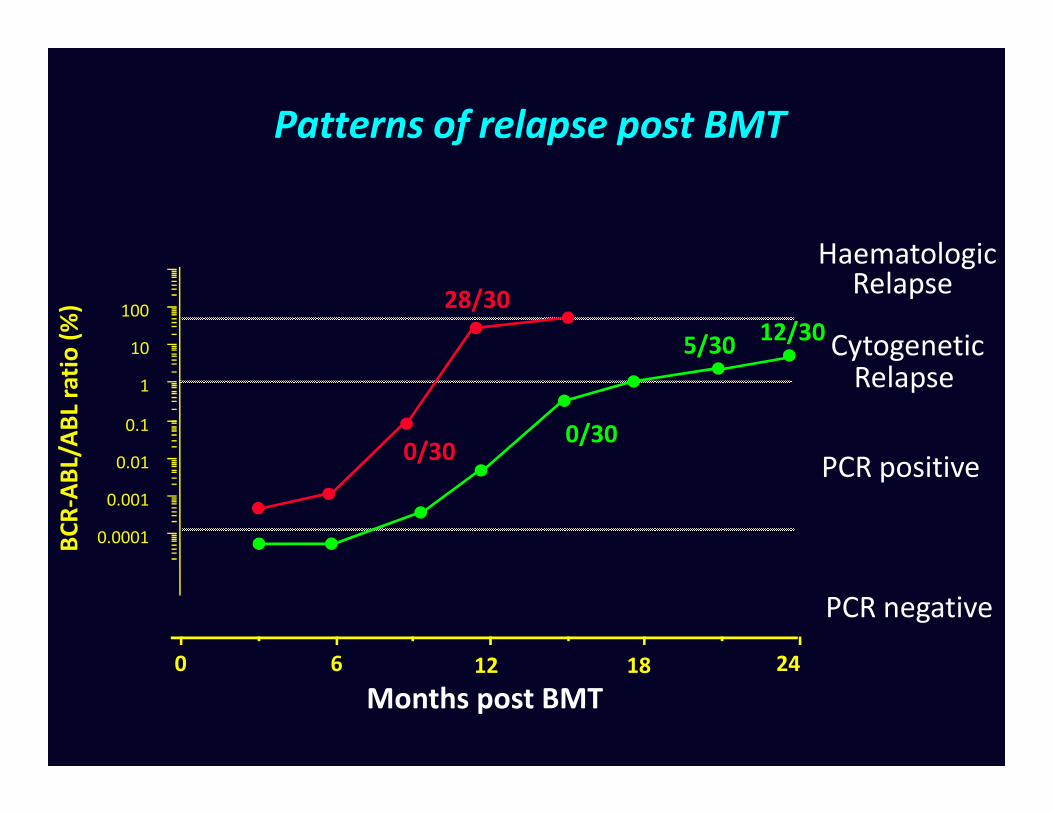
Patterns of relapse post BMT
CytogeneticRelapse
HaematologicRelapse
1
10
100
AB
L/A
BL
rati
o (
%)
5/3012/30
28/30
0
Months post BMT12 246 18
PCR negative
PCR positive
0.0001
0.001
0.01
0.1
BC
R-A
BL/
AB
L ra
tio
(%
)
0/300/30

Sequential quantitative PCR and subsequent relapse post BMT
80
100
n = 113
Pro
ba
bil
ity
of
rela
pse
High or rising BCR-ABL levels (n =33)≥ 0.02% BCR-ABL/ABL
(≥ 100 BCR-ABL/μg RNA)
0 12 24 36 48 60 72 84 96 108 120
Months post BMT
0
20
40
60n = 113
p < 0.0001
Pro
ba
bil
ity
of
rela
pse
Low or falling BCR-ABL levels (n =80)< 0.02% BCR-ABL/ABL
(≥ 100 BCR-ABL/μg RNA)
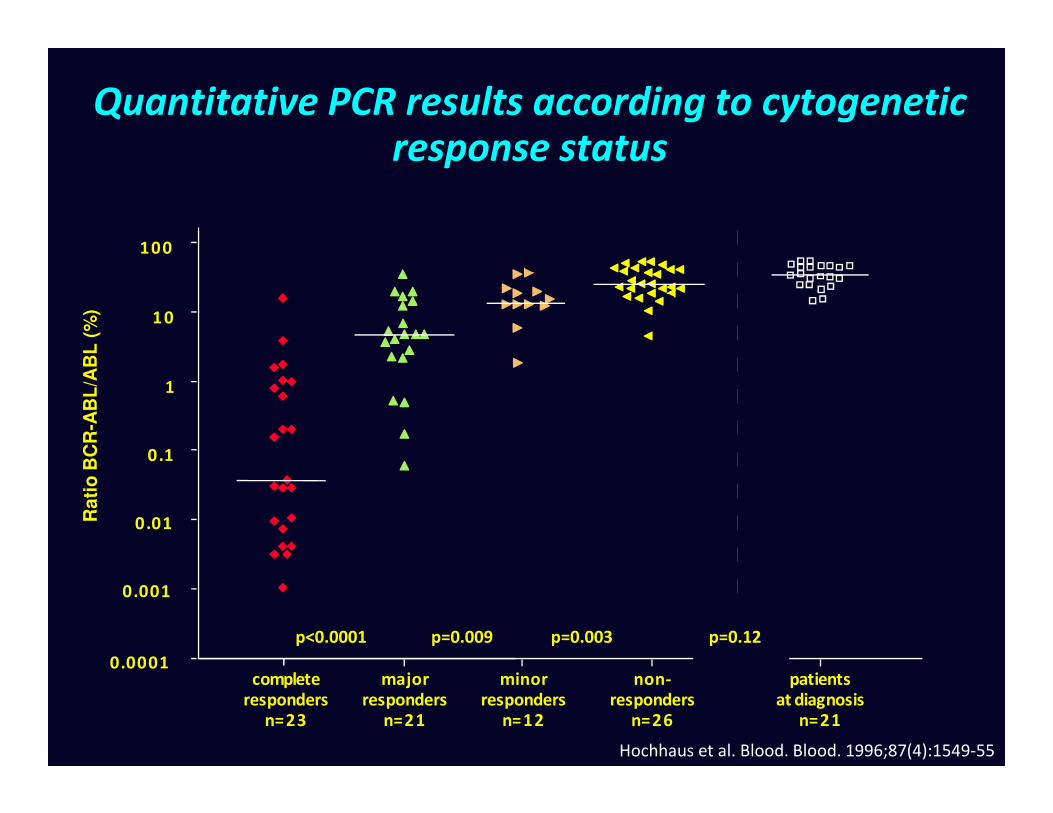
Quantitative PCR results according to cytogenetic response status
100
1 0
1
AB
L/A
BL
(%
)
0patients
at diagnosisn=21
non-responders
n=26
minorresponders
n=12
majorresponders
n=21
completeresponders
n=23
0.1
0.01
0.001
.0001
p=0.12p<0.0001 p=0.009 p=0.003
Rati
o B
CR
-AB
L/A
BL
(%
)
Hochhaus et al. Blood. Blood. 1996;87(4):1549-55

Complete cytogenetic responders on IFN-therapy:Relapse free survival according to residual BCR-ABL
transcripts
Pro
ba
bil
ity
of
rela
pse
(%
)
100
80
60
Pro
ba
bil
ity
of
rela
pse
(%
)
Ratio BCR-ABL/ABL < 0.045%, n=27
Ratio BCR-ABL/ABL > 0.045%, n=27
0 1 2 3 4 5 6
60
40
20
0
p < 0.0001
Years after first complete cytogenetic remission
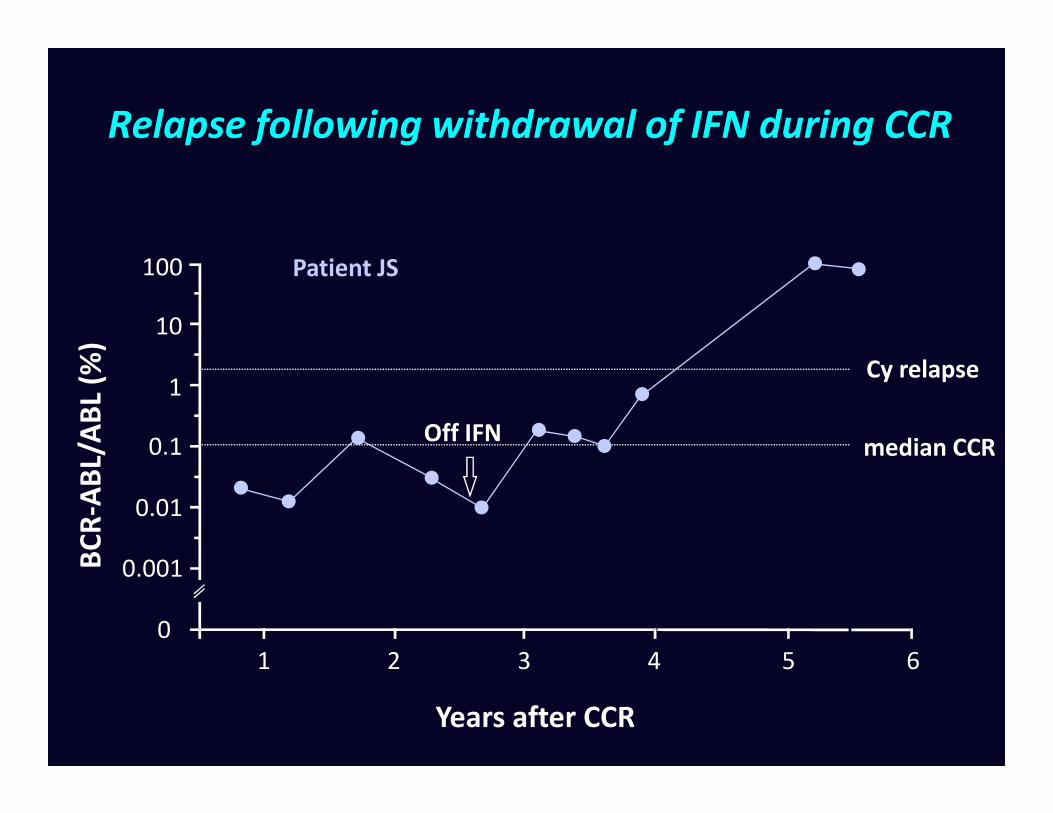
Relapse following withdrawal of IFN during CCR
1
10
100
AB
L/A
BL
(%)
Cy relapse
Patient JS
0.001
0.01
0.1
0
BC
R-A
BL/
AB
L (%
)
Years after CCR
median CCROff IFN
1 2 3 4 5 6

Sustained remission following withdrawal of IFN during CCR
1
10
100
AB
L/A
BL
(%)
Cy relapse
Off IFN
Patient AP
0.001
0.01
0.1
0
BC
R-A
BL/
AB
L (%
)
Years after CCR
median CCR
Off IFN
1 2 3 4 50

Detection of BCR-ABL transcripts by RT-PCR
Diagnosis / Relapse
Partial remission
Conventional108
1010
1012
AB
L p
osi
tiv
e c
ell
s
Se
nsi
tiv
ity
of
PC
R
10-2
BMT
Conventional
RT-PCR positive
'Optimized'
RT-PCR positive
RT-PCR negative
IFN
Healthy
subjects
0
104
106
108
BC
R-A
BL
po
siti
ve
ce
lls
Se
nsi
tiv
ity
of
PC
R
10-6
10-8

1996: imatinib and RQ-PCR
Genome Res. 1996;6: 986-994
Nat Med. 1996;2:561-6

Schematic for BCRSchematic for BCR--ABL RQABL RQ--PCR PCR
Peripheral blood
Extract RNA from total leukocytes
Reverse transcribe to cDNA
Positive specimens: Ratio of Positive specimens: Ratio of BCRBCR--ABLABL to control geneto control gene
Negative specimens: No. of control gene transcripts as indicator of Negative specimens: No. of control gene transcripts as indicator of
sensitivitysensitivity
RQ-PCR for BCR-ABL RQ-PCR for control gene
Cross NCP. Best Pract Res Clin Haematol 2009;22:355-365.
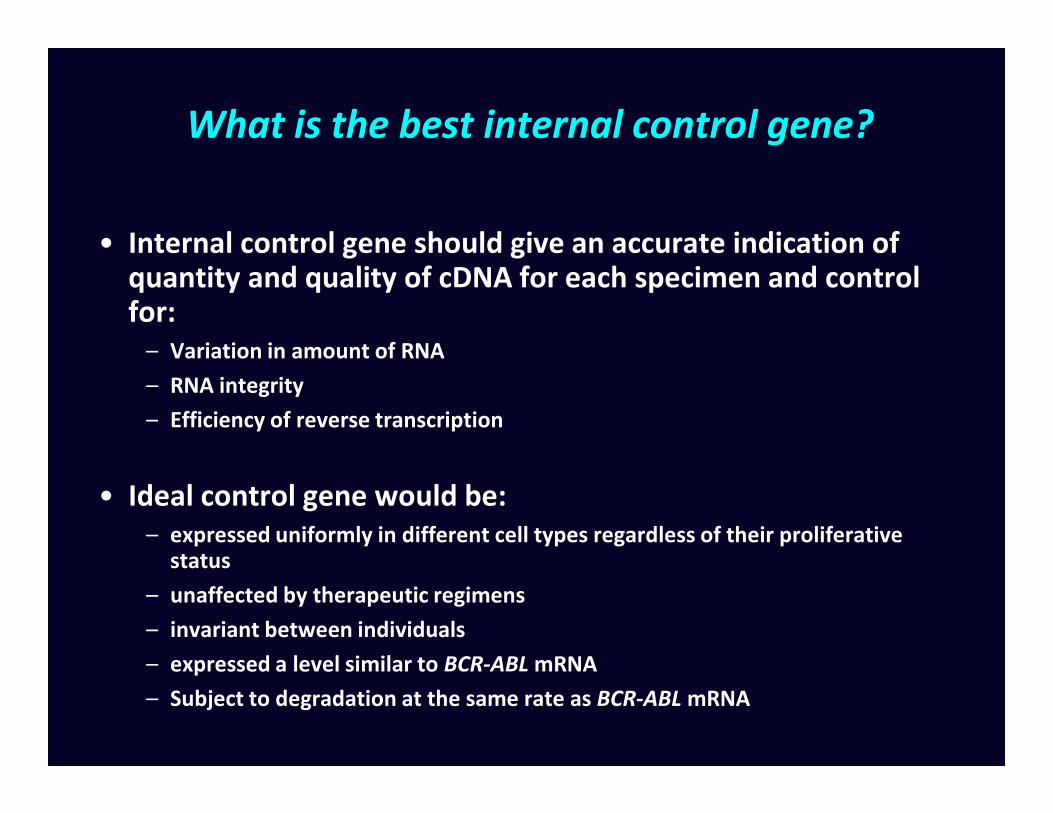
What is the best internal control gene?
• Internal control gene should give an accurate indication of quantity and quality of cDNA for each specimen and control for:
– Variation in amount of RNA
– RNA integrity
– Efficiency of reverse transcription– Efficiency of reverse transcription
• Ideal control gene would be:
– expressed uniformly in different cell types regardless of their proliferative status
– unaffected by therapeutic regimens
– invariant between individuals
– expressed a level similar to BCR-ABL mRNA
– Subject to degradation at the same rate as BCR-ABL mRNA

What is the best internal control gene?
• EAC: recommended ABL, GUSB or β2M
• CML expert group: recommended ABL, GUSB and BCR

IRIS Trial: Standardization by normalisation of results to 30 Shared Baseline Samples
Before normalization After normalization
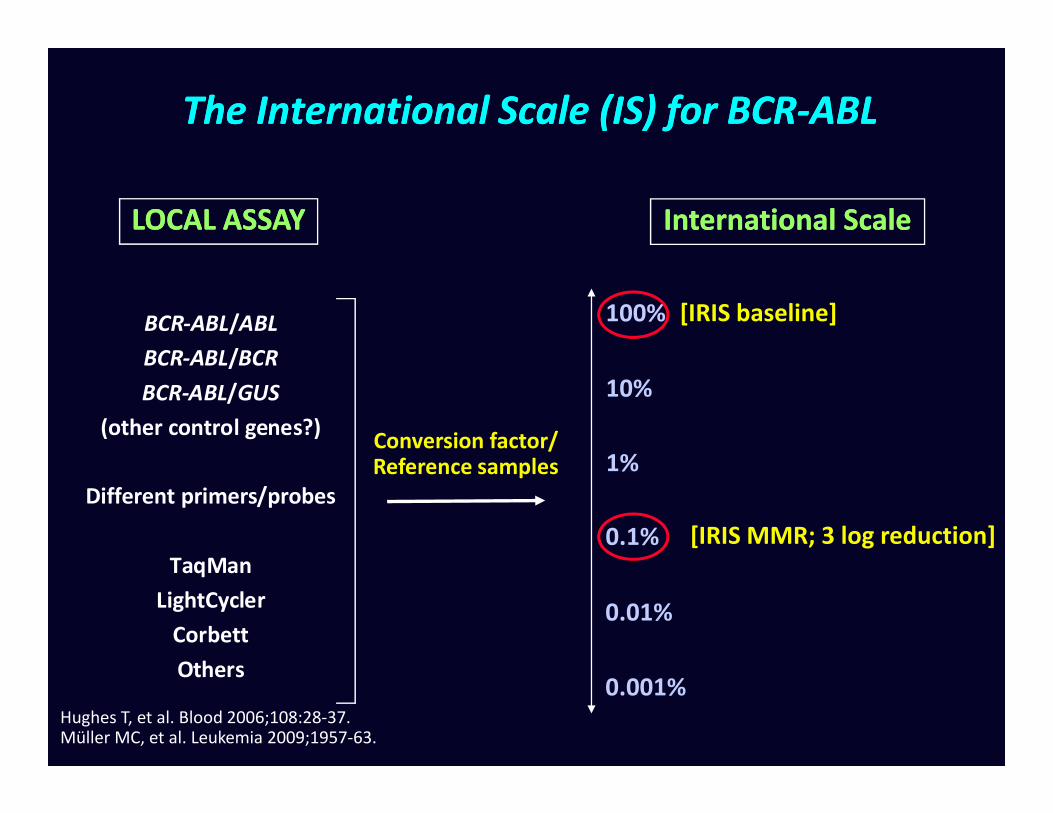
The International Scale (IS) for BCRThe International Scale (IS) for BCR--ABLABL
[IRIS baseline]
10%
100%
International ScaleInternational ScaleLOCAL ASSAYLOCAL ASSAY
BCR-ABL/ABL
BCR-ABL/BCR
BCR-ABL/GUS
[IRIS MMR; 3 log reduction]0.1%
1%
0.01%
0.001%
Conversion factor/Reference samples
(other control genes?)
Different primers/probes
TaqMan
LightCycler
Corbett
Others
Hughes T, et al. Blood 2006;108:28-37.Müller MC, et al. Leukemia 2009;1957-63.

Standardisation of molecular monitoring in CML: Standardisation of molecular monitoring in CML: BackgroundBackground
• Historical (IRIS trial; 2000): The mean BCR-ABL levels of 30 CML patients was defined as 100% in each of the three participating laboratories using BCR as a control gene1
• The value corresponding to MMR in each laboratory was defined as 0.1% (reduction of 3 log from IRIS baseline)
• International Scale (IS) fixed to these key points
1Hughes T, et al. N Engl J Med 2003;349:1423–1432.

Realising the International Scale for BCR-ABL
• Derivation of laboratory specific conversion factors
– Methodology developed by Adelaide laboratory
– Expanded in Europe by European LeukemiaNet / EUTOS
• Development of accredited reference reagents
Branford S, et al. Blood 2008;112(8):3330–3308;
Müller M, et al. Leukemia 2009;23(11):1957–1963;
White H, et al. Blood 2010;116(22):e111–e117.

Identity line Identity line X=YX=Y
--1.51.5
--11
--0.50.5
00
0.50.5
11
1.51.5
22
2.52.5
log
10
Re
fere
nce
La
b I
Slo
g1
0 R
efe
ren
ce L
ab
IS n=16n=16
Realising the International Scale for BCRRealising the International Scale for BCR--ABLABL
--22
--1.51.5
--11
--0.50.5
00
0.50.5
11
1.51.5
log
10
Re
fere
nce
La
b I
Slo
g1
0 R
efe
ren
ce L
ab
IS
Identity line Identity line X=YX=Yn=33n=33
--22
--22 00 22log
10
Re
fere
nce
La
b I
Slo
g1
0 R
efe
ren
ce L
ab
IS
log10 Lab 5log10 Lab 5
--2.52.5
--2.52.5 --1.51.5 --0.50.5 0.50.5 1.51.5log
10
Re
fere
nce
La
b I
Slo
g1
0 R
efe
ren
ce L
ab
IS
log10 Lab 5 ISlog10 Lab 5 IS
Branford et al. Blood. 2008 Oct 15;112(8):3330-8
• Common samples analyzed in test and reference labs
• Results compared; calculation of conversion factor
• Validation of conversion factor by analysis of further samples
• Re-validation at regular intervals??

The International Scale for BCRThe International Scale for BCR--ABL:ABL:Before standardisationBefore standardisation
AB
LA
BL
lev
el
lev
el
0.1
10
1
BC
RB
CR
--AB
LA
BL
0.01
0.1
0.001
0CML cell dilutionCML cell dilution
Lab 1
Lab 2
Lab 3
Lab 4
Lab 5
Hypothetical schematic.
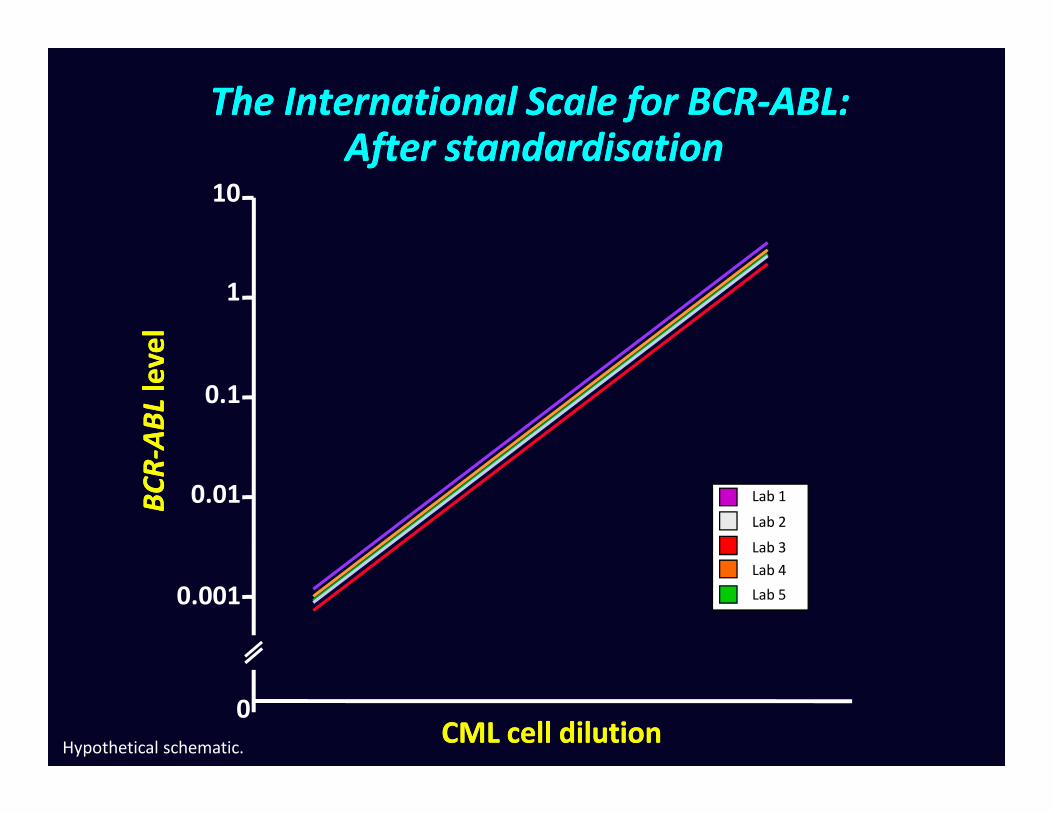
The International Scale for BCRThe International Scale for BCR--ABL:ABL:After standardisationAfter standardisation
AB
LA
BL
lev
el
lev
el
0.1
10
1
BC
RB
CR
--AB
LA
BL
0.01
0.1
0.001
0CML cell dilutionCML cell dilution
Lab 1
Lab 2
Lab 3
Lab 4
Lab 5
Hypothetical schematic.

RQRQ--PCR results at low levels are inevitably more PCR results at low levels are inevitably more variable than those at high levelsvariable than those at high levels
1.01.0
1010
100100
Pa
rtic
ipa
tin
g la
bs
Pa
rtic
ipa
tin
g la
bs BCR
BCR--ABL
ABL%%
ISIS
0.0010.001
0.10.1
1.01.0
0.010.01
0.0010.001 0.10.1 11 10100.010.01 100100
Ref Lab Ref Lab BCRBCR--ABLABL%%ISIS
Pa
rtic
ipa
tin
g la
bs
Pa
rtic
ipa
tin
g la
bs
MMR
Branford S, et al. Blood 2008;112(8):3330–3338.

Conversion factors: current status
• Works well (for many labs), but very labour intensive
• Open to a limited number of labs at any time
• 300-500 labs testing for BCR-ABL by RQ-PCR worldwide?
• Unclear how often conversion factors need be calculated
• Process has highlighted problem of assay instability in some testing labs.
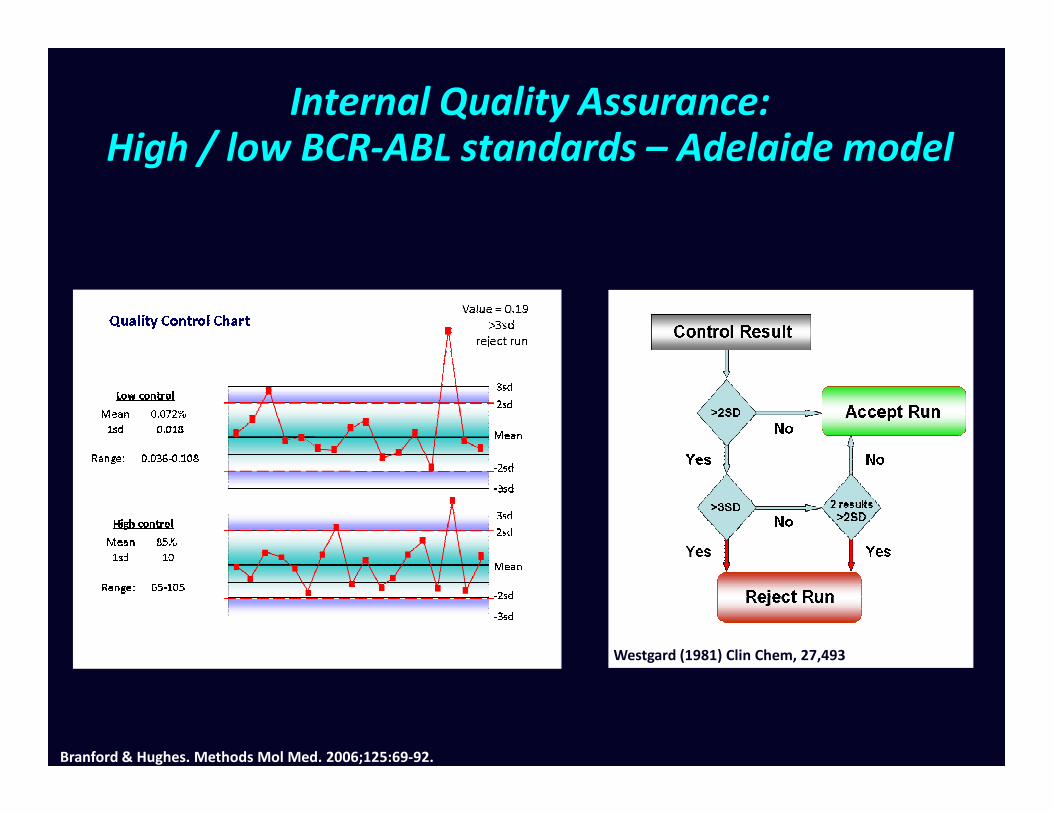
Internal Quality Assurance:High / low BCR-ABL standards – Adelaide model
Westgard (1981) Clin Chem, 27,493
Branford & Hughes. Methods Mol Med. 2006;125:69-92.

Improved comparability using a common calibration plasmid
Local standard Common standard
White and Cross, unpublished
• Problem: no universally accepted reference standards / calibrators

Primary reference standardsWHO definition
• Ideally be as close as possible to real samples.
• Should cover all steps of the process, including RNA extraction.• Should cover all steps of the process, including RNA extraction.
• Must be stable over several years (=freeze dried) and physically possible to prepare batches that last several years.
• Must be applicable to all or most existing methods

Formulation for primary reagents
• [CML cells (primary or K562) diluted in normal leucocytes]
• Cell line mixtures
• K562 is fine for BCR-ABL (b3a2)
• Non BCR-ABL: 30 lines tested: KG1 and HL60 had ratios of • Non BCR-ABL: 30 lines tested: KG1 and HL60 had ratios of ABL:BCR:GUSB closest to that seen in normal leukocytes
– ??500 labs worldwide
– Median 3 runs/week = 78,000 runs pa
– Four dilutions, each containing 106 cells
– Would need 3x10¹¹ cells (>600 litres culture volume) per annum to satisfy world wide demand for reference reagents to be included in each run

Likely use of primary reference reagents
Primary reagents
Secondary reagents
Available to routine testing laboratories

Reference Reagents: full scale production
• Both freeze dried cells combinations performed well in international field trials
• Large scale grow ups of HL60 (40L)
• Mixtures made with K562 to yield approx 10%, 1%, 0.1%, 0.01% BCR-ABLIS.BCR-ABL .
• 3000 vials at each dilution freeze dried by NIBSC
• Initial in house evaluations successful
• International field trial
• Assignment of IS values (ABL, BCR, GUSB)
White et al. Blood. 2010 Nov 25;116(22):e111-7
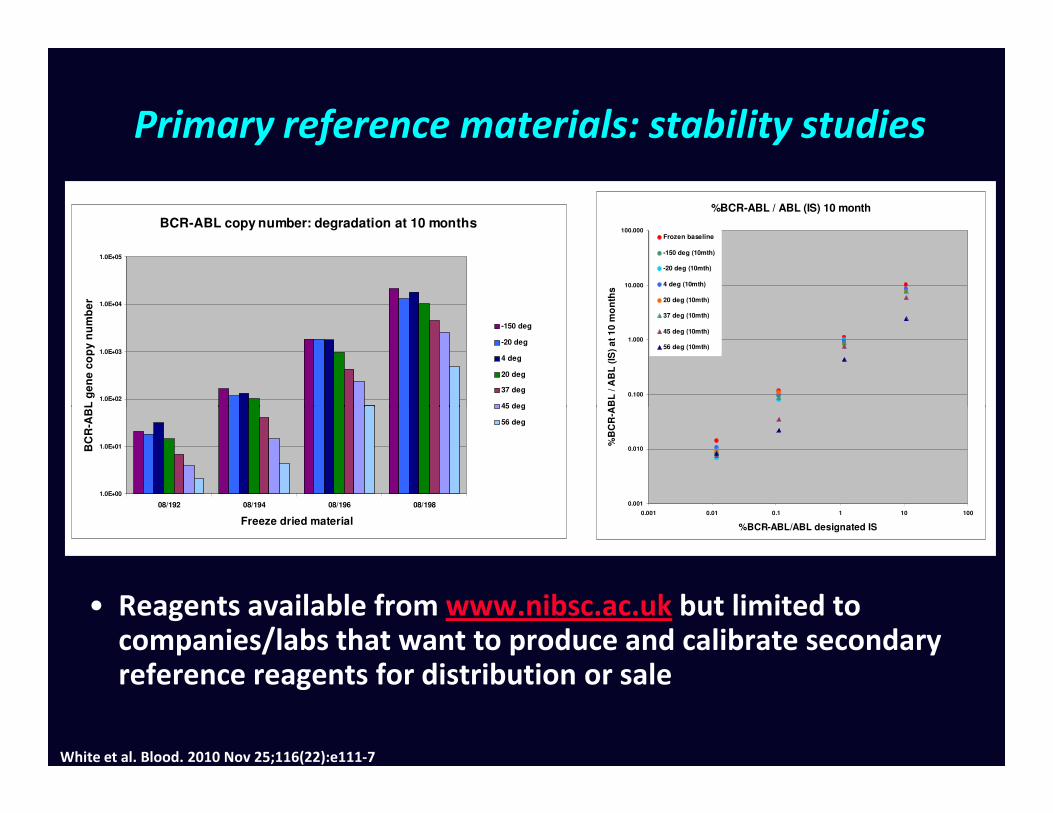
Primary reference materials: stability studies
%BCR-ABL / ABL (IS) 10 month
0.100
1.000
10.000
100.000
%B
CR
-AB
L / A
BL
(IS
) a
t 1
0 m
on
ths
Frozen baseline
-150 deg (10mth)
-20 deg (10mth)
4 deg (10mth)
20 deg (10mth)
37 deg (10mth)
45 deg (10mth)
56 deg (10mth)
BCR-ABL copy number: degradation at 10 months
1.0E+02
1.0E+03
1.0E+04
1.0E+05
BC
R-A
BL
ge
ne
co
py
nu
mb
er
-150 deg
-20 deg
4 deg
20 deg
37 deg
45 deg
0.001
0.010
0.001 0.01 0.1 1 10 100
%BCR-ABL/ABL designated IS
%B
CR
-AB
L / A
BL
(IS
) a
t 1
0 m
on
ths
1.0E+00
1.0E+01
08/192 08/194 08/196 08/198
Freeze dried material
BC
R-A
BL
ge
ne
co
py
nu
mb
er
45 deg
56 deg
White et al. Blood. 2010 Nov 25;116(22):e111-7
• Reagents available from www.nibsc.ac.uk but limited to companies/labs that want to produce and calibrate secondary reference reagents for distribution or sale

What is Armored RNA Quant® (ARQ)?
• A patented and proven technology to manufacture and stabilize RNA for use as:
• Positive/Negative control
• Process control (e.g., spike in non-target RNA)
• Assay calibrator (e.g., standard curves)
• External calibrator (e.g., proficiency panel)
• Nuclease resistant and stable in biological matrices*• Nuclease resistant and stable in biological matrices*
• Precisely quantified using a NIST-traceable reference standard
• Performance well established:
• In clinical molecular virology applications (HIV, HCV…)
• And now in clinical hematology applications
• Manufactured under cGMP to ensure lot-to-lot consistency critical for reagents used in clinical molecular analyses
*Pasloske et al., J Clin Microbiol 1998

ARQ IS Calibrator Panel™ Design
• Two panels, one for e13a2 and one for e14a2, designed to be compatible with most of the common RT-qPCR methods using ABL1 or BCR as endogenous controls
• Each panel consists of 4-level Calibrators (like the WHO primary standard) and one negative control
• Each Calibrator has an assigned nominal IS % ratio determined relatively to the reference values of the WHO primary standard as
Evaluate 4-level
Panel with local
RT-qPCR method
Compare to nominal IS
% ratio and assess
linearity, slope and
analytical sensitivity
Routine
monitoring of
local RT-qPCR
Nominal IS % ratio
from the WHO IS
reference panel
relatively to the reference values of the WHO primary standard as described in White et al., Blood 2010
• Testing with local RT-qPCR methods and comparison to the nominal IS values can be performed either directly (heat-lysis) or after RNA extraction*
*For research use only. Not for use in diagnostic procedures.

• Similar slopes and R2 with or without RNA extraction*
• Good linearity over 3-log dilution for both control genes*
ABL1 BCR
ABL1 BCRAvg % CV
Heat-lysis QIAamp TRIzol Heat-lysis QIAamp TRIzol
e13a2-1 6.6 7.1 5.9 9.4 8.2 6.4 7.3 18.0
e13a2-2 0.62 0.66 0.63 0.98 0.81 0.75 0.74 18.9
e13a2-3 0.066 0.079 0.054 0.115 0.095 0.069 0.080 27.6
e13a2-4 0.0081 0.0093 0.0077 0.0135 0.0121 0.0095 0.0100 22.8
Example of Results – Linearity
ABL1 BCR
*Preliminary research data. The performance characteristics of these reagents have not been established.
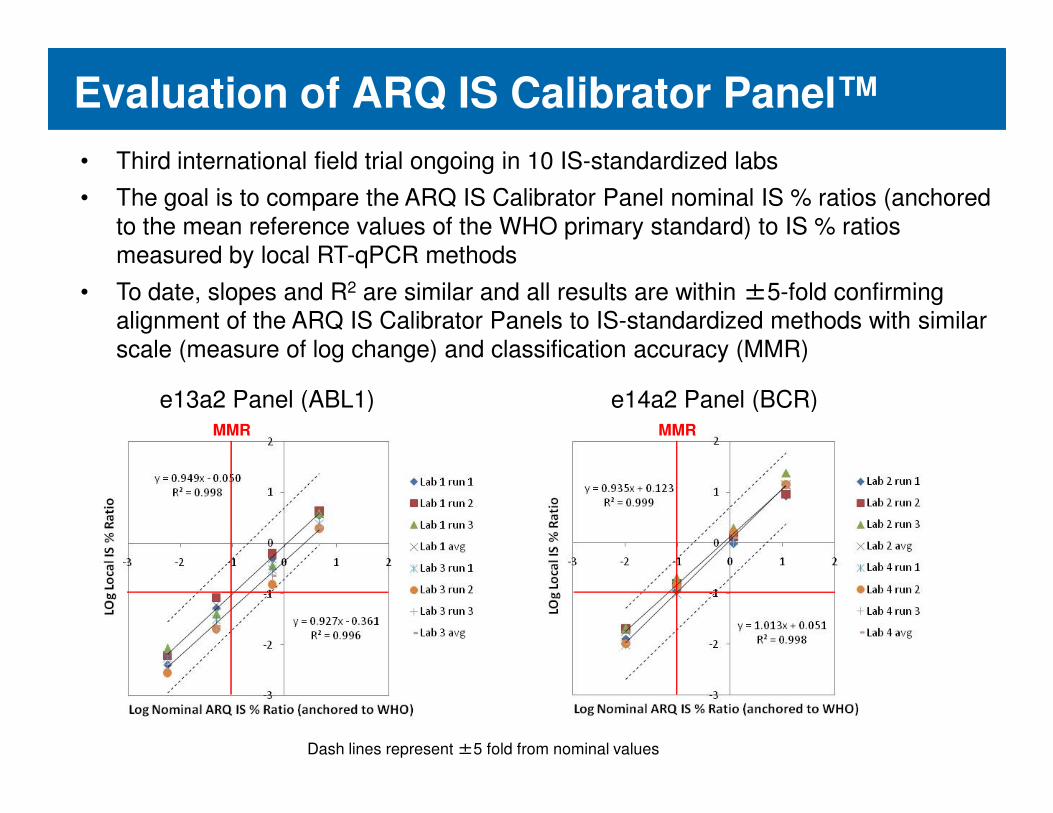
Evaluation of ARQ IS Calibrator Panel™
• Third international field trial ongoing in 10 IS-standardized labs
• The goal is to compare the ARQ IS Calibrator Panel nominal IS % ratios (anchored
to the mean reference values of the WHO primary standard) to IS % ratios
measured by local RT-qPCR methods
• To date, slopes and R2 are similar and all results are within ±5-fold confirming alignment of the ARQ IS Calibrator Panels to IS-standardized methods with similar
scale (measure of log change) and classification accuracy (MMR)
e13a2 Panel (ABL1) e14a2 Panel (BCR)e13a2 Panel (ABL1) e14a2 Panel (BCR)MMR MMR
Dash lines represent ±5 fold from nominal values

Results at WNGRL
e13a2 Panel e14a2 Panel
Calibrator lot 1
February 2011
Calibrator lot 2
August 2011
Dash lines represent ±2.5 fold from nominal values

Potential uses of calibrated secondary reference reagents
• Direct calibration of results to the International Scale
• Quality Control: definition of assay variation / drift• Quality Control: definition of assay variation / drift
• Troubleshooting
• Standardization of ‘Complete Molecular Response’
Should Complete Molecular Response be Should Complete Molecular Response be considered as Optimal Molecular Response?considered as Optimal Molecular Response?
• CMR generally understood to mean undetectable disease
– Depends how hard you look
– Variability of sample quality within centres– Variability of sample quality within centres
– Variability of assay sensitivity between centres
• Need a robust definition of CMR that is reproducible between laboratories, takes into account intrinsic variability and is able to accommodate future technological improvements
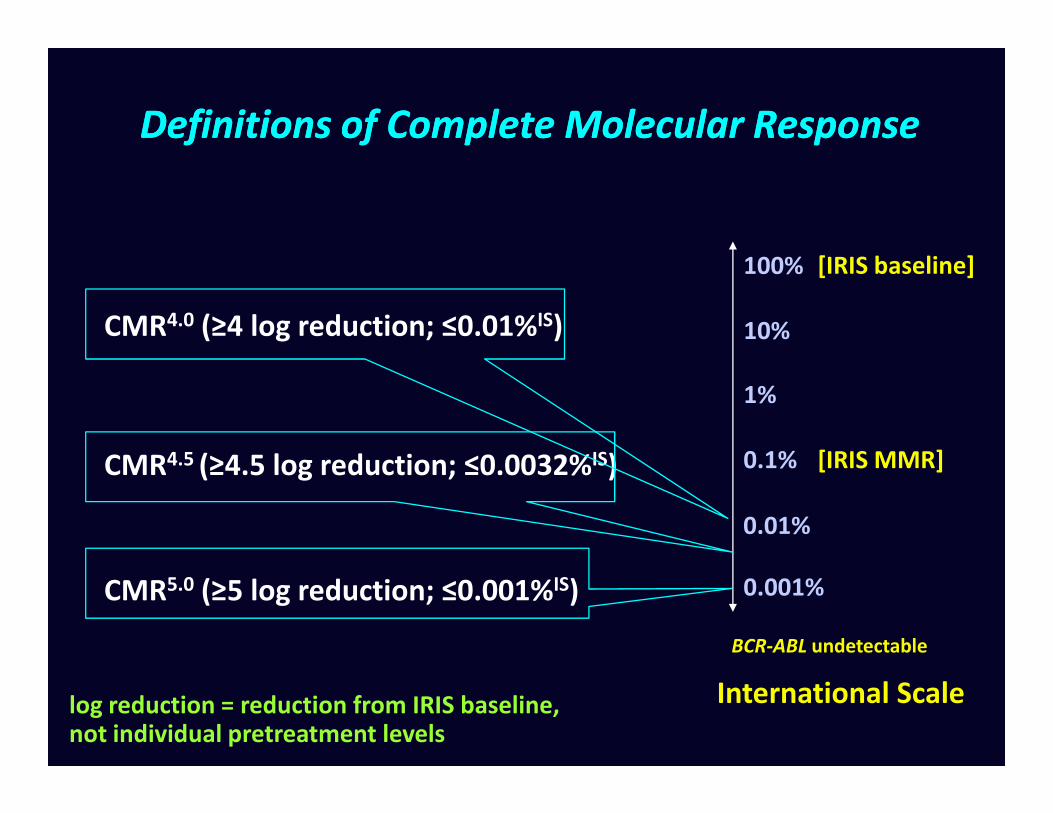
Definitions of Complete Molecular ResponseDefinitions of Complete Molecular Response
[IRIS baseline]
1%
10%
100%
CMR4.0 (≥4 log reduction; ≤0.01%IS)
[IRIS MMR]0.1%
1%
0.001%
CMR4.5 (≥4.5 log reduction; ≤0.0032%IS)
CMR5.0 (≥5 log reduction; ≤0.001%IS)
International Scale
BCR-ABL undetectable
log reduction = reduction from IRIS baseline, not individual pretreatment levels
0.01%

Definitions of Molecular ResponseDefinitions of Molecular Response
[IRIS baseline]
1%
10%
100%
MR4.0 (≥4 log reduction; ≤0.01%IS)
[IRIS MMR]0.1%
1%
0.001%
MR4.5 (≥4.5 log reduction; ≤0.0032%IS)
MR5.0 (≥5 log reduction; ≤0.001%IS)
International Scale
BCR-ABL undetectable
log reduction = reduction from IRIS baseline, not individual pretreatment levels
0.01%
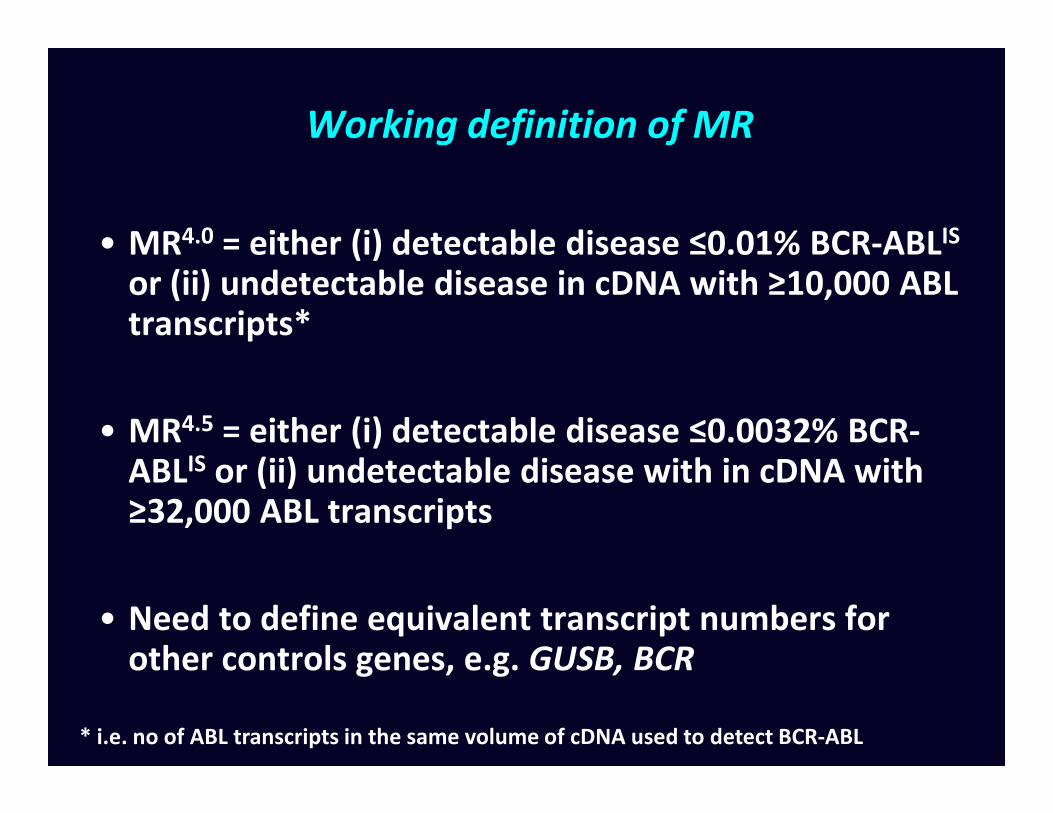
Working definition of MR
• MR4.0 = either (i) detectable disease ≤0.01% BCR-ABLIS
or (ii) undetectable disease in cDNA with ≥10,000 ABL transcripts*
• MR = either (i) detectable disease ≤0.0032% BCR-• MR4.5 = either (i) detectable disease ≤0.0032% BCR-ABLIS or (ii) undetectable disease with in cDNA with ≥32,000 ABL transcripts
• Need to define equivalent transcript numbers for other controls genes, e.g. GUSB, BCR
* i.e. no of ABL transcripts in the same volume of cDNA used to detect BCR-ABL

Can the sensitivity of PCR for BCR-ABL be pushed further?
Genomic DNA cDNA
• PCR from genomic DNA enables more sensitive detection of MRD, e.g. MR5.0
• Expensive: breakpoints need to be identified; patient-specific primer/probe pairs need to be designed and tested
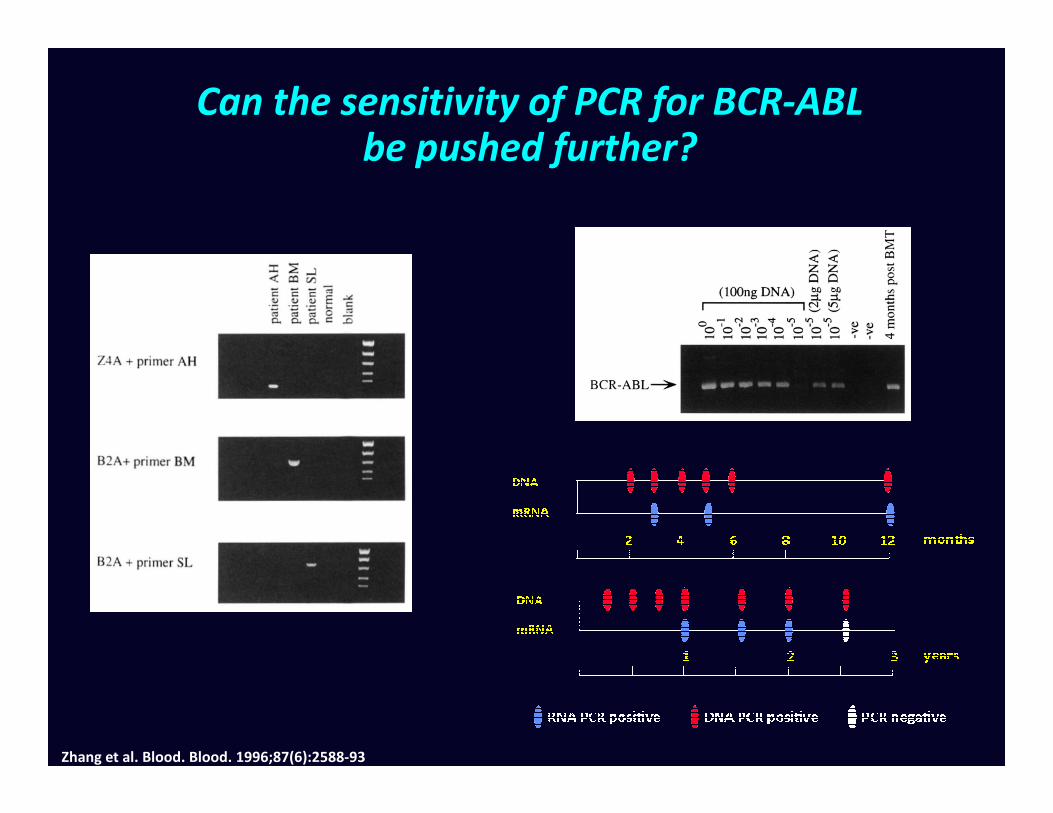
Can the sensitivity of PCR for BCR-ABL be pushed further?
Zhang et al. Blood. Blood. 1996;87(6):2588-93

Can the sensitivity of PCR for BCR-ABL be pushed further?
Patient 1: stopped imatinib,
remained in stable CMR for 2
years but persistently DNA PCR
positive
Patient 2: stopped imatinib,
rapidly became DNA PCR
positive, then RT-PCR positive
Ross, et al. Leukemia. 2010;24(10):1719-24.Sobrinho-Simões et al. Blood. 2010;116(8):1329-35.
Acknowledgements
• Salisbury
– Helen White, Lin Feng
• Adelaide
– Tim Hughes, Sue Branford– Tim Hughes, Sue Branford
• Mannheim
– Andreas Hochhaus, Martin Müller
• National Institute for Biological Standards & Control
– Paul Metcalfe, Paul Matejtschuk
• Hammersmith
– John Goldman, Letizia Foroni, Jaspal Kaeda
• International BCR-ABL Standardization Group