
Monitoring and Evaluation PLAN for Zimbabwe HIV and AIDS ...
72
1 ZIMBABWE Monitoring and Evaluation PLAN for Zimbabwe HIV and AIDS National Strategic Plan (2006 – 2012)
Transcript of Monitoring and Evaluation PLAN for Zimbabwe HIV and AIDS ...

1
ZIMBABWE
Monitoring and Evaluation PLAN for
Zimbabwe HIV and AIDS National Strategic Plan (2006 – 2012)

2
Table of Contents
Acknowledgements
Acronyms
CHAPTER 1: BACKGROUND 1.1 Country Profile at a glance - HIV and AIDS in Zimbabwe
1.2 National response to the HIV & ADIS epidemic
1.3 Summary of the National Monitoring and Evaluation (M&E) Framework
1.4 The “THREE ONES” Principle
1.5 Global and Regional Commitments
CHAPTER 2: INTRODUCTION
2.1 Goal of the plan 2.2 Objectives of the M&E Plan
2.3 Definitions and Concepts
2.4 Components of an M&E plan
2.5 Development of the M&E plan
CHAPTER 3: DATA MANAGEMENT
3.1 Data Collection - Tools and Methods
3.1.1 Data Sources
3.1.2 Registration of implementing Agencies
3.1.3 Data collection from Health Facility Implementers
3.1.4 Data collection from non-Health facility Implementers
3.1.5 Strategies to improve data collection, tools and methods
3.2 Data Storage - Database Management
3.2.1 Strategies to improve data storage and database management
3.3 Data Flow and Transmission
3.3.1 Strategies to improve data flow and transmission
3.4 Data Quality and Assurance
3.4.1 Strategies for improving data quality and assurance
3.5 Data Analysis and use
3.5.1 Strategies to improve analysis and use of data

3
CHAPTER 4: INFORMATION PRODUCTS, DISSEMINATION &
UTILIZATION
4.1 Data Reporting and Data Dissemination
4.2 Strategies to improve reporting and dissemination
4.2.1 Reporting
4.2.2 Dissemination
CHAPTER 5: NATIONAL PERFORMANCE MEASUREMENT 5.1 National Performance Measurement Framework
5.2 Strategies to Improve National Performance Measurement
CHAPTER 6: SURVEYS, SURVEILLANCE, EVALUATION &
RESEARCH 6.1 Current and planned Surveys, Surveillance, Evaluation, and Research
6.2 Strategies on Evaluation, Surveillance and Research
CHAPTER 7: STRATEGIES FOR M&E CAPACITY STRENGTHENING 7.1 M&E Staffing
7.1.1 Strategies to improve M&E staffing levels, knowledge and skills in M&E
7.2 Coordination and Leadership for M&E
7.2.1 Strategies to improve coordination and leadership for M&E
7.3 Equipment and Supplies
7.3.1 Strategies for Equipment and Supplies
8. IMPLEMENTATION OF THE M&E PLAN
8.1 Linkages, coordination and partnerships
8.2 Institutional Roles and responsibilities
8.3 Communication and Dissemination of the M&E Plan
8.4 Plan communication and dissemination
9. References

4
Acknowledgements:
The development of this Monitoring and Evaluation plan was a collaborative effort among NAC
staff, the National Monitoring and Evaluation Advisory Group (NMEAG), national stakeholders at
all levels and development partners. The National AIDS Council would particularly like to thank
members of the NMEAG who provided guidance to the process of developing the plan. Special
appreciation goes to the Joint United Nations Programme on AIDS (UNAIDS) for providing funding
and logistics at various stages in the development process, USAID which provided the funds for
technical assistance through the Global Management Solutions Project and the Centers for Disease
Control (CDC) Zimbabwe for technical advice and support. Our appreciation also goes to all
stakeholders who provided their valuable comments to this document.
5
Acronyms
ART Antiretroviral therapy
AU African Union
BCC Behaviour Change and communication
CDC Centre for Disease Control
CT Counseling and Testing
DA District Administrator
DAAC District AIDS Action committee
DAC District AIDS Coordinator
DBO Data Base Officer
DHE District Health Executive
DHIO District Health Information Officer
DMEAG District Monitoring and Evaluation Advisory Group
EMCOZ Employers Confederation of Zimbabwe
HBC Home-based care
HIV/AIDS Human Immunodeficiency Virus/ Acquired Immunodeficiency Syndrome
ID Identity Card
IP Implementing Partners
M&E Monitoring and Evaluation
MoHCW Ministry of Health and Child Welfare
NAC National AIDS Council
NARF National Activity Reporting Form
NHIS National Health Information System
NMEAG National Monitoring and Evaluation Advisory Group
NHL National Health Levy
ODF Organisational Detail Form
OI Opportunistic infection
OVC Orphans and other vulnerable children
PAAC Provincial AIDS Action Committee
PAC Provincial AIDS Coordinator
PHE Provincial Health Executive
PHIO Provincial Health Information Officer
PLWHIV People living with HIV/AIDS
PMTCT Prevention of Mother to child transmission of HIV
SADC Southern African Development Community
SOP Standard Operational Procedure
STI Sexually-transmitted infection
TB Tuberculosis
UNGASS United Nations General Assembly Special Session on AIDS-Declaration of
commitment
WAAC Ward AIDS Action Committee
WFP Ward Focal Person
ZACH Zimbabwe Association of Church Hospitals
ZAN Zimbabwe AIDS Network
ZBCA Zimbabwe Business Council on AIDS
ZIMA Zimbabwe Medical Association
ZNASP Zimbabwe National AIDS Strategic Plan

6
CHAPTER 1: BACKGROUND
1.1 HIV and AIDS Profile
Zimbabwe has an estimated 1.6 million infected with HIV, the virus that causes AIDS (MoHCW:
2005). With such a number of people living with HIV and AIDS, Zimbabwe is faced with a serious
epidemic that is having a profound social and economic impact on the nation. Women and young
girls constitute about 56% of those infected by HIV. Of the 1.6 million who are infected, about
350,000 need treatment, care and support. An estimated, 3000 people die of AIDS every week,
mainly young adults between the ages of 15 and 49 years and about 1 million children aged 14 years
and below have lost one or both parents to AIDS (MoHCW, 2005).
1.2 National response to HIV & AIDS
The government of Zimbabwe has put together a multi-sectoral response articulated in the
Zimbabwe National HIV and AIDS Strategic Plan (ZNASP) 2006 – 2010. The ZNASP provides
both policy and strategic guidance on all HIV and AIDS interventions carried out by implementing
partners (IPs) and stakeholders in Zimbabwe. The figure below summarizes the national response.
Fig 1: Strategic Components of ZNASP
1.3 Monitoring and Evaluation (M&E) Framework

7
In order to closely monitor and evaluate implementation and progress towards achieving the goals of
the ZNASP, the National AIDS Council (NAC), with support from the multi-sectoral National
Monitoring and Evaluation Advisory Group (NMEAG), developed the national M&E framework for
HIV and AIDS. The M&E framework is to guide maintenance and implementation of the national
M&E system. The M&E framework guides all stakeholders in effective measurement of inputs,
outputs, outcomes, and impact of the ZNASP (2006-2010/2011). The logical progression from the
National M&E Framework is to create a National M&E Plan.
1.4 The “THREE ONES” Principle
The national M&E plan has been developed in accordance with “THE THREE ONES” principle,
which Zimbabwe subscribes to:
One agreed HIV and AIDS action framework that provides the basis for coordinating the
work of all partners and stakeholders
One national AIDS coordinating authority with a broad-based multi-sectoral mandate
One agreed country level M&E system.
The national strategy is in place (ZNASP) and the National AIDS Coordinating Authority (NAC) are
in place and the development of the M&E plan completes the three ones. The plan is informed by the
ZNASP and it enables Zimbabwe to systematically monitor implementation of the strategic plan and
gauge progress towards the achievement of both national targets and international commitments in
the fight against HIV and AIDS.
1.5 Global and Regional Commitments
The republic of Zimbabwe is a signatory to several international global and regional commitments
and declarations on which the nation is supposed to report regularly. These include Millennium
Development Goals (MDGs), the United Nations General Assembly Special Session on AIDS
(UNGASS), Global Fund to Fight AIDS, Tuberculosis and Malaria (GFTAM), SADC and African
Union. The indicators selected in this plan cater for reporting to these global and regional
commitments, in addition to national monitoring and evaluation requirements.

8
CHAPTER 2: INTRODUCTION
2.1 Goal of the National M&E Plan
The National M&E Plan is aligned with the strategic priority areas of the ZNASP. The overall goal
of the national M&E plan is to provide a systematic approach to tracking activities related to the
ZNASP strategic areas. The plan articulates, by program area, details of what information is needed
including: indicators, data sources, data collection methods, data flow, data analysis, data use and
reporting, and feedback as well as the responsibilities of implementing partners and stakeholders. It
outlines strategies for developing M&E capacity in terms of human, material and financial resources.
It also includes a detailed costed Annual Action Plan.
2.2 Objectives of the M&E Plan
The objectives of the plan are to assist NAC, implementing partners, and stakeholders to:
Guide policy and planning of the national response
This will be achieved by providing the data needed to inform policy makers and stakeholders and
facilitate use of information for planning purposes at all levels by program managers
Strengthen coordination of all partners and stakeholders working in the area of HIV and AIDS
This will be achieved by facilitating ongoing technical support to the NAC secretariat, implementing
partners, and stakeholders and assist programme managers in meeting reporting requirements within
the ZNASP strategic areas
Monitor effectiveness of programs
Programme managers will be able to: assess effectiveness of activities and recommend improved,
cost-effective HIV and AIDS related interventions based on the data obtained by the M&E system.
This will also enable Zimbabwe to meet regional (SADC, African Union) and global (UNGASS,
GF) reporting requirements on HIV and AIDS
Facilitate data dissemination among implementing partners and stakeholders
National information needs such as; provision of data on progress toward achievement of targets,
will be met and communities will be informed on the status of the HIV and AIDS epidemic and
response in their area
Guide Resource Mobilization
Essential data will be provided to national, bilateral and multi-lateral funding agencies to assess
results of the financial assistance they provide and identify funding gaps.
2.3 Definitions and Concepts

9
Monitoring and evaluation are complementary processes. Below are some of the key internationally
accepted concepts and definitions in relation to HIV & AIDS program monitoring and evaluation.
(a) Monitoring: Monitoring is the continuous, routine daily and regular assessment of ongoing
activities and/or processes. It aims to provide management and main stakeholders of an
ongoing intervention with early indication (or lack thereof) towards the achievement of
outputs.
(b) Evaluation: Evaluation is the episodic assessment, as systematic and impartial as possible,
of the overall achievements of activities and/or processes. It aims to understand the progress
that has been made towards the achievement of an outcome at a specific point in time. All
evaluations are linked to outcomes (impact) as opposed to only immediate results (outputs).
(c) Indicator: An indicator is a statement that describes the level of performance achieved in
relation to a set of aims and/or objectives. An indicator provides evidence that a certain
condition exists or certain results have or have not been achieved,
(d) Data source: Data sources are tangible sets of information, usually in the form of reports,
survey results, monitoring forms from the field, or official government data sets. Data
sources provide the values of the indicators at a specific point in time.
(e) Information products: An information product is a standard report/document that NAC or
other stakeholders produce at regular intervals after receiving data and analyzing these data.
(f) M&E results chain: There are four levels of indicators (inputs, outputs, outcomes and
impact).
o Inputs: Inputs are the resources that are needed to implement the project and its
activities. Inputs can be expressed in the form of the people, equipment, supplies,
infrastructure, means of transport and other resources needed for a specific project or
activity.
o Outputs: Outputs are the immediate results of the activities conducted. They are usually
expressed in quantities, either in absolute numbers or as a proportion of a population.
Outputs are generally expressed separately for each activity.
o Outcomes: Outcomes are the medium term results of one or several activities. Outcomes
are what the immediate outputs of the activities are expected to lead to. Outcomes are
therefore mostly expressed for a set of activities. They often require separate surveys to
be measured.
o Impact: Impact refers to the highest level of results, to the long-term results expected of
the project. Impact therefore generally refers to the overall goal or goals of a project.
2.4 Components of the M&E plan
The UNAIDS developed, “12 Component Framework for Developing a Functional National M&E
System”, was used as a guide when developing the Zimbabwe national M&E Plan. The twelve
components are summarized below.

10
People, Partnership and Planning
Organizational structure with HIV M&E functions
Human capacity for HIV M&E
Partnerships to plan, coordinate and manage the HIV M&E system
National multi-sectoral HIV M&E
Annual costed national HIV M&E work plan
Advocacy, communications and culture for HIV M&E
Collecting, verifying and analyzing data
Routine HIV programme monitoring
Surveys and surveillance
National and sub-national HIV data bases
Supportive supervision and data auditing
HIV evaluation and research
Using data for decision making
Data dissemination and use
2.5 M&E Plan Development Process
Participatory and qualitative approaches were used in developing this National M&E Plan. The
participatory engagement in the development of the M&E plan was spearheaded by the NAC and the
NMEAG with assistance from the Global Management Solutions (GMS) Project. The plan builds
upon and complements the national M&E framework and is informed by input from the NMEAG
and findings from a situation analysis conducted in twenty (20) districts and stakeholders consulted
at national level

11
CHAPTER 3: THE NATIONAL M&E PLAN
The data required for monitoring and evaluation of the HIV and AIDS programme
comes from program monitoring, project evaluations, research studies, surveys and
surveillance data. This M&E plan proposes how data will be collected from these
activities.
3.1 National M&E System Structure
Within the framework of the Three-Ones Principles the National AIDS Council is charged with a
mandate to coordinate and maintain the one national M&E system. The Public, Private, and Civil
Society Sectors are the three key sectors driving the multi-sectoral response to the HIV and AIDS
epidemic and are collaborating with NAC in the national M&E system. Within NAC, the M&E
system is coordinated through the organization‟s decentralized structures which exist at national,
provincial, district and ward levels. At national, provincial and district levels, NAC has M&E staff
and at ward level, the organization is represented by a Ward Focal Person (WFP) who coordinates
partners‟ activities and facilitates implementer registration and reporting. All implementers register
annually at district level and submit their programme output data to the District AIDS Coordinator
on monthly basis. From the DAC, the data flows upstream through Provincial to National level. At
national level there is a department headed by a Monitoring and Evaluation Director.
3.1.1 National Monitoring and Evaluation Advisory Group (NMEAG) and M&E Task
Forces
NAC is supported at national level by a multi-sectoral and multi-disciplinary National Monitoring
and Advisory Group (MEAG). The NMEAG facilitates participation of all stakeholders
[government, donors, bilateral and non-governmental partners] in national monitoring and evaluation
activities. It also guides NAC on monitoring and evaluation issues as well as facilitates coordination,
quality, and standards in monitoring and evaluation. It also advises on the operational research needs
of the country. NAC is mobilizing M&E task forces in the provinces and districts which will support
provincial and district M&E functions in the same manner as the NMEAG.
3.1.2 Sector Coordination
The different sectors of the national response are coordinated by different players who collect
specific data. These are as follows:
Table 1: Sectors responsible for the national response
Sector Coordinating
body
Functions
Health
sector
Ministry of
Health and
Child Welfare
The Ministry of Health and Child welfare collects
data from all health-facility-based interventions, both
private and public health facilities. The NHIS
department in the Ministry and is responsible for
collecting all health information while HIV and

12
AIDS intervention data is collected by the AIDS and
TB UNIT in the Ministry. The NHIS is represented at
provincial and district level while the ATB unit is at
national level and utilizes the Ministry‟s
administrative structures for data management. With
proper alignment the private medical sector should
report to the national M&E system through the
Ministry.
Civil Society
Sector
Zimbabwe
AIDS Network
Monitoring and Evaluation in the Civil Society sector
is coordinated through the sector‟s umbrella body
known as Zimbabwe AIDS Network (ZAN), which is
represented down to provincial level. However, data
is currently flowing from individual organisations in
the sector directly to NAC.
Private
Sector
EMCOS,
Zimbabwe Business Council on AIDS (ZBCA)
and ZIMA.
There are four key coordinating bodies in the private
sector but for purposes of monitoring and evaluation
of HIV/AIDS interventions, the national M&E
system is coordinated by ZIMA and ZBCA. ZIMA
has been identified as the coordinating structure for
private medical practitioners, while ZBCA will be
collecting data from the non-medical business sector.
These require capacity strengthening for the function.
3.2 Data Management
3.2.1 Data Sources
The data required for monitoring implementation of the ZNASP will come from the various
implementers working in specific program areas. This data is collected at different levels of the
response through a series of data collection tools. The tools will include the following:
Table 2: Data collection tools, purpose and organization responsible
Tool Custodian Purpose
Organizational Details
Form (ODF)
NAC Registration of implementers. The
registration is done annually.
National Activities
Report Forms (NARF)
NAC Completed by implementers on monthly
basis for submission of core output
indicators to the national M&E system.
ART and PMTCT
Registers
MoHCW For ART and PMTCT data capture from
clients by health workers at facility level,
from which data is extracted onto reporting
forms.
Form 1 MoHCW (AIDS
and TB Unit)
For data flow from health facilities through
district to AIDS and TB unit at head office
T-series MoHCW
(NHIS)
For data flow within the NHIS from health
facilities through district to national office.

13
Primary data
collection tools
Implementing
Partners
To be developed by every implementer of
non-health interventions and private medical
health implementers for data collection at
activity level from which they will abstract
data onto national reporting forms (NARF or
MoHCW Form 1).
3.2.2 Registration of Implementing Agencies
To ensure that all activities conducted in a given district are recorded and counted, every
implementing partner operating in the district must register with the District AIDS Coordinator
(DAC) by completing and submitting the Organizational Details Form (ODF). Upon registration,
the implementing partner is issued a computer generated organization ID number. The organization
receives instructions on how to complete the relevant section of the NARF and how to submit
completed monthly forms to the DAC. Reporting guidelines are also provided to implementers at the
time of registration. Registration with the DAC must be renewed every year. It is the responsibility
of the Village AIDS Action Committee (VAAC), Ward AIDS Action Committee (WAAC), District
AIDS Action Committee (DAAC) and Provincial AIDS Action Committee (PAAC) to ensure that
all implementing agencies in their area are registered and have ID numbers.
3.2.3 Data collection from Health Facility Implementers (including public, private, mission, local
authority)
Data collected from health facility implementers include: CT, adherence counseling, PMTCT, STI,
infection control, blood transfusion, OI, ART, laboratory tests, pediatric ART and male circumcision.
Health facility implementers that offer services in these programme areas enter the service provided
and client information on forms and registers supplied to them by the AIDS and TB Unit and the
NHIS MoHCW. Every month, data from the registers is consolidated onto the AIDS and TB Unit
Monthly Return Form 1 and then onto the NAC National Activity Report Form (NARF). At this
stage the above data collection tools and processes are not being used by private practitioners and
some private hospitals and nursing homes.
3.2.4 Data collection from non-Health facility Implementers
Data from non health implementers include: CT, behavior change communication (BCC), condom
promotion and distribution, advocacy, home based care (HBC), youth focused programmes,
PLWHIV, nutrition support, OVC, income generation, and workplace activities. These implementers
collect data on program activities using their own primary data collection tools and every month
they consolidate the data onto organization or project specific consolidation forms. In addition, the
implementers complete the relevant section(s) of the NARF and submit it to the DAC.
The cut off date for data collection for all implementers is the 25th
of each month. At the district
level, the deadline for implementers to submit data to the DAC is the 15th
of the following month
and the deadline for the DAC to submit data to the PAC is the 20th
of the month. The PAC then
sends the data to the NAC HQ by the 31st of the month. Written protocols describing the data
collection process have been established yet protocols are not correctly interpreted by all
implementers in both health and non-health facilities.

14
3.2.5 Strategies to improve data collection, tools and methods
Register all implementing partners in all districts
Renew organizational registration annually
The Department of Social Welfare, the DA‟s office, ZAN and the NAC review and revise the
registration process of AIDS Service Organizations in districts
Include the person responsible for registering NGOs at the DA‟s office in DAC quarterly
review meetings
Review and revise existing NARF data collection tools, clarify cutoff dates and reporting
timeframes and add a component appropriate to the private sector
Formal linkages between NAC and MoHCW put in place to establish clear roles and
responsibilities and strengthen role of NHIS in data collection.
Address the issue of parallel reporting systems and adopt a single harmonized system
Develop a data dictionary to harmonize AIDS and TB, NHIS and NAC indicators
Increase coordination and communication between the DMEAG and DHIO
Develop appropriate curricula for initial and refresher trainings for all staff involved in data
collection
Develop and revise mentoring tools and checklists for continuous support and supervision of
staff responsible for data collection
Develop a district-based training and mentoring program for data collection staff coordinated
and supervised by the DAC and District Health Information Officer (DHIO) with support and
oversight from NAC HQ and PAC
Develop a standard operation procedure (SOP) for data collection for all implementers that
can be applied to their setting. The SOPs will be short and simple (one page) and posted in
the records office
Create a checklist to track and manage availability of all the primary data collection tools
(forms, registers and NARF forms including procedures for ordering and distribution) in
order to avoid stock-outs and improvisation of tools
Provide adequate filing facilities and training in development and maintenance of filing
systems
Develop a strategy and protocol to collect data from private practitioners and private
hospitals
3.3 Data Storage - Database Management
Data storage and management varies from district to district. In some places data is stored manually,
in others it is stored electronically while in others there is a combination of manual and electronic
storage. The NHIS MoHCW maintains an electronic database as does the AIDS and TB Unit. The
NAC is working toward development of a protocol for sharing data collected via the NARF and
other databases managed by the AIDS and TB Unit, NHIS MoHCW, the private sector, OVC, CRIS,
and ZimDat.
3.3.1 Strategies to improve data storage and database management
Conduct of an inventory of existing databases
Standardize the existing manual data storage system and move toward an electronic database in
all districts to manage NARF data

15
Develop a mechanisms for sharing data from different HIV and AIDS related databases and
provide programme managers access to complete disease surveillance and service coverage
information online
Develop a data dictionary to allow data sharing among existing databases (OVC, Private Sector)
and national database at NAC HQ
Establish and maintain district databases in all districts at DAC offices
Establish and maintain provincial databases in all provinces at PAC offices
Develop protocol for data sharing between NAC and NHIS that includes health sector data
collected and managed by NHIS and non health data collected and managed by NAC. This
protocol will include the appropriate role of the CSO
3.4 Data Flow and Transmission
Transmission of data in the right format, at the right time and to the right people is as important as
collection of data. Transport, postal and delivery options at facilities differ from district to district
which affects data flow and transmission. Implementing partners must use the most efficient and
effective transmission means available in their district.
The following figure illustrates the existing flow of data and the proposed flow of data needed to
implement the M&E plan.
Fig 2: Data Flow
3.3.1 Strategies to improve data flow and transmission
In each district the DAAC or District Monitoring and Evaluation Advisory Group (DMEAG)
will develop a data transmission system that flows from implementers to the DAC. All
implementing agencies operating within the district will be informed of the system

16
Multiple options or opportunities for data transmission that allow flexibility and take into
consideration changes that might take place from time to time will be identified. Such
options will include any visit to a health facility for supervision, patient transport, vaccine or
drugs or gas delivery. In addition, transport from other sectors could be used as well as
Expedited Mail Service (EMS)
Issues related to transmission of forms will be discussed and addressed at the quarterly
review meetings with the DAC and DMEAG
Facilitate improvements in e-mail and telephone access from implementing partners to DACs
and DHIOs to enable them to communicate verbally and/or electronically to address any
issues with transmission of forms that might arise
Provide cell phones and other technologies to each DAC and selected M&E focal persons at
the WAAC level
Establish electronic connectivity at every DAC office with the PAC office and NAC HQ to
enable all districts to send reports by email. This will be achieved by accessing the free
Internet connection currently provided by Healthnet in many districts
3.4 Data Quality and Assurance
There is a plan in place for data verification at the district, province and national level. However, due
to lack of resources, it is not routinely implemented.
3.4.1 Strategies for improving data quality and assurance
Provide resources needed to consistently implement the data verification plan at the district,
province and national level
Provide on the job training during data verification at the district, province and national level
Provide ongoing training, supervision and mentoring to all staff involved in data verification
3.5 Data Analysis and use
A standard data analysis and use plan is critical for effective planning, coordination, and
implementation of programme activities. The results of data analysis should inform all implementers
in a timely manner so they can make appropriate changes in program management and resource
allocation.
3.5.1 Strategies to improve analysis and use of data
Develop an analysis plan for all levels of the M&E system that will serve as a guide on how
to use data. The plan will also act as a template for the selection of key indicators for
systematic monitoring at all levels (implementer, health facility, district, province and
national)
Develop standard training curricula for data managers, implementers, M&E staff and HIOs at
all levels on data analysis and use
Presentation of information and data on selected indicators will be a regular agenda item for
quarterly district management meetings

17
Develop simple data monitoring tools to facilitate use of data at all levels. One example is a
flip chart template that includes a selection of the key indicators to tracks trends and progress
over time

18
CHAPTER 4: INFORMATION PRODUCTS, DISSEMINATION &
UTILIZATION
4.1 Data Reporting and Data Dissemination
A critical component of an M&E system is getting information collected back to decision makers,
key stakeholders and implementers in a timely manner so it can be used for planning, management,
supervision, coordination and implementation.
4.2 Strategies to improve reporting and dissemination
4.2.1 Reporting
Reports will include data on selected key indicators by strategic area, baseline and progress
towards achieving targets.
Develop a training curriculum for implementing partners, stakeholders and DACs, and M&E
officers on report writing, presentation of data and the role of dissemination in planning.
Develop and/or strengthen a reporting plan that includes a standard set of regularly generated
summary report templates. These reports will be generated quarterly, bi-annually and annually at
the district, province and national levels
Train DACs to be effective presenters and facilitators in order to improve the quality and utility
of quarterly reports and meetings
Provide on going support and mentoring to DACs enabling them to generate specialized reports
that address the information needs of local implementing partners and stakeholders
Provide equipment such as LCD projectors, laptops and flash drives to DACs to facilitate
presentations at quarterly review meetings
4.2.2 Dissemination
Develop a systematized approach for dissemination at all levels for implementers.
Develop a data dissemination plan to include: which institutions and individuals receive reports,
who sends out reports, the format of the reports and the best approach to get reports to the
various institutions in a timely manner
Establish mechanisms for stakeholders to give feedback to the DAC, PAC and NAC
4.2.3 HIV and AIDS Information Stakeholders
Primary Stakeholders
• AIDS Service Organization
• MOHCW
• Department of Social Welfare
• Other government ministries
• Central Statistical Office
• Academic institutions
• Local NGOs
Secondary Stakeholders

19
• Bilateral organizations
• UN Agencies
Tertiary Stakeholders
• Multilateral organizations (ESP, GFATM, World Bank)
• International NGOs
• SADC
• International reporting commitments
The following table lists priority and standard M&E reports to be prepared at different levels of the
system.
Table 3: Priority and Standard M&E Reports at different levels
Report Responsible Key recipients DAC District Quarterly
Statistical Reports
M&E Officer, DAC WAAC, VAAC, DA, DMO, NAC, PAC &
District level implementers
District Health Information
Quarterly Report
Health Information
Officer/DMO
DAC, PMD, District implementers
NAC National Quarterly
reports
NAC M&E Unit All stakeholders, umbrella organziations,
private sector, DAC, and PAC, MOH and CSO
Quarterly AIDS and TB Unit
report.
AIDS/TB unit
(Director)
MoHCW Dir of Preventive Services, Members
of the planning pool, NHIS, NAC and PMOs
NAC
M & E Bulletin
NAC All stakeholders
NAC Annual
M & E report
NAC M&E Unit
(Director)
All stakeholders, umbrella organizations,
development partners, private sector, DAC,
PAC, Cabinet Committee, Parliamentary
Health Committee
Annual AIDS and TB Unit
report
AIDS and TB Unit
(Director)
All stakeholders, umbrella organizations,
development partners, private sector, DAC,
PAC, Cabinet Committee, Parliamentary
Health Committee
Thematic Reports NAC and
Stakeholders
All stakeholders, umbrella organizations,
development partners, private sector, DAC,
PAC, relevant government departments
Dissemination Mechanisms
NAC website uploaded quarterly
MOH&CW website uploaded quarterly
ZIMDAT website
Printed copies to all key stakeholders
District Stakeholders Coordination meetings
Provincial Stakeholders Coordination meetings
National Partnership Forum
Newsletter

20
CHAPTER 5: NATIONAL PERFORMANCE MEASUREMENT
FRAMEWORK
5.1 National Performance Measurement Framework
This section provides the list of indicators that satisfies national, regional (SADC, AU), and global
(UNAIDS, UNGASS) commitments. The list is organized by the ZNASP strategic areas and
objectives and includes the following information; indicator type, frequency and responsible party
for data collection, data source, baseline data and targets. Although baseline and some targets exist,
they do not cover all program areas. ANNEX 4 shows a list of national indicators and their
definitions.
The list of indicators tracks output, outcome and impact indicators. It should be emphasized that this
approach does not prohibit or even discourage development and use of additional project specific
indicators that are not included on this list. There are many process and output indicators that are
essential for monitoring program activities and implementers are encouraged to collect them but
these types of indicators are not meant to be directly captured by the national M&E system.
The process of developing the list of indicators included review of the following documents:
ZNASP
National M&E Framework
NARF
NAC supporting documents
Program specific strategic plans
SADC, Global Fund, PEPFAR and UNGASS reporting requirements
5.1.1 Strategies to Improve National Performance Measurement Framework
Hold a stakeholders workshop annually to review the national M&E indicators
NAC will spearhead the implementation of results of the above mentioned workshops
NAC will collaborate with NHIS, CSO and stakeholders to establish appropriate and
effective baseline and targets for all ZNASP program areas and at all levels
Develop a data dictionary to assure indicators are harmonized with AIDS and TB Unit and
NHIS MoHCW indicators
NAC will train DACs and M&E officers in target setting
NAC will work with NHL to develop additional indicators to effectively track rollout of ART
services
Review role of lab in national response to HIV and AIDS and develop additional appropriate
lab indicators
Commission a compilation of annual M&E Report on progress of implementation of the plan

21
CHAPTER 6: EVALUATION, SURVEILLANCE & RESEARCH
6.1 Evaluation, Surveillance and Research
Assessment of the extent to which objectives of the strategic plan (ZNASP) are met requires an array
of periodic evaluations. These evaluations are critical to collection of specific outcome and impact
indicators as well as evaluating some fundamental attributes of programs such as efficacy, equity,
relevance, appropriateness etc. In a national program, whereas the monitoring component of
program‟s Monitoring and Evaluation plan can be integrated into implementation plans, evaluation
cannot because of its cost. The Evaluation component therefore has to be strategically planned for
utilizing national surveys and surveillances, project evaluations and other similar researches.
Below are the surveillance systems and national surveys which will be utilized for the evaluation of
the national response to HIV and AIDS in Zimbabwe:
Table 4: Description of Surveillance systems and national surveys
Survey
Surveillance
Evaluation
Study
Description
1. ANC sentinel
surveillance
The target group of this study is pregnant women. Its objective is to “establish
HIV and Syphilis prevalence among antenatal clinic clients.” This serves to
monitor the HIV and AIDS epidemic and to inform HIV and AIDS prevention
and control interventions in Zimbabwe” (ANC Protocol 2009). The survey is
conducted in 19 sentinel sites around the country as an anonymous, unlinked
sero-survey. It is done every two years. It is coordinated by the Ministry of
Health and Child Welfare with support from partners.
2. Zimbabwe
Demographic
Health
Survey
(ZDHS)
The ZDHS is a national population based survey conducted every five years. It
is conducted by the Central Statistical Office (CSO). It collects information on
fertility, nuptiality, sexual and reproductive health, family planning, nutrition of
infants and mothers, maternal and child health, awareness and behaviour
regarding HIV and AIDS. The 2005 – 2006 DHS also collected data on malaria
prevention and treatment, domestic violence, Orphans and Vulnerable Children
(OVC) and population based prevalence estimates for anaemia among men,
women and children and HIV among men ages 15 to 49 years and women ages
15 to 59 years.
3. Young Adult
Reproductive
Health and
HIV and
AIDS Survey
(YAS)
This survey is conducted by the Zimbabwe National Family Planning Council
(ZNFPC). Its objective of this survey is “to generate a nationally representative
population based estimate of HIV prevalence among young adults aged 15 – 29
years and to provide baseline data on reproductive health behaviours, coverage
of AIDS care and prevention programs and quality and barriers to their use”
(YAS report). The last survey conducted in 2001-2002 collected biological
specimen for anonymous HIV testing to obtain estimates of HIV prevalence in
the target group. Plans were to repeat the survey every three to five years, which
has not been possible due to funding constraints.

22
4. Early
Warning
Indicator
(EWI) survey
The EWI survey is conducted by the MOHCW and it assesses the Zimbabwe
ART program so as to optimize prevention of HIV Drug Resistance. It is meant
to be done yearly, in all sites providing ART for at least one year. However the
first survey conducted in October 2008 included only 41 sites. Indicators
collected through this survey are: percentage of individuals starting ART who
are prescribed a standard regimen as described in the National Treatment
Guideline (Target 100%), percentage of patients starting first line ART, lost to
follow-up at 12 months of ART (Target <20%), percentage of persons starting
first-line ART during a selected calendar month who are still on first-line ART
12 months later (Target >80%) and number of quarters in a year when patients
did not go home without a prescription because drugs were not available in the
dispensing pharmacy (Drug supply continuity) (Target 100%).
5. HIV DR
Threshold
survey
The Threshold Survey for transmitted HIVDR is a minimum-resource
methodology based survey protocol which evaluates the extent of transmitted
HIVDR in specified geographic areas of a country where ART has been scaled
up and therefore has been widely available to the treatment-eligible population
for at least 3 years2, 6
. The threshold survey classifies DR prevalence (for each
drug or drug class) according to thresholds: < 5% low; 5 -15% medium; > 15%
high. If prevalence is classified as < 5% to all relevant drugs, the HIVDR TS
should be repeated two years later. If prevalence is classified in the high
categories, additional surveys or more resource-intensive surveillance may be
required, as well as additional public health actions. The first survey in
Zimbabwe has done during the ANC Survey 2009 and samples of HIV positive
specimens women (=< 25yrs) collected for genotyping. Geographic sites should
have a minimum number of samples of 38 for analysis of the results.
6. HIV drug
resistance
monitoring
HIVDR prevention surveys support and builds upon EWI collection and
includes viral load and HIVDR testing. This is a prospective survey to be
conducted in Zimbabwe, which assesses success of ART in preventing HIVDR
during first year of treatment. It identifies factors associated with the
emergence of HIVDR which can be successfully addressed at the level of the
ART site and program. Zimbabwe will begin with a pilot of 3 sites. Samples
will be sent to WHO accredited laboratories for genotyping because Zimbabwe
does not have the requisite equipment for the tests.
7. Midterm and
Terminal
Evaluation of
ZNASP
The Zimbabwe National HIV/AIDS Strategic Plan (ZNASP) is a 5 year (2006-
2010) national strategic plan developed to coordinate, monitor and strengthen
implementation of the multi-sectoral response to HIV and AIDS. The National
AIDS Council and partners has to conduct mid-term and terminal evaluations of
the ZNASP. These evaluations will assess program achievements, impact and
appropriateness of strategies, objectives and review targets. The MTR is
scheduled for mid 2009.
8. National
AIDS
Spending
Assessment
(NASA)
The NASA is a resource tracking survey that collects data on actual
expenditures for HIV and AIDS from private, public and external sources. The
survey also collects actual expenditure by programme area and category of
beneficiaries. Zimbabwe is conducting its first NASA in 2009 and has
institutionalized it at district level. Plans are to make this an annual assessment
which will provide the country with information on the distribution of HIV and
AIDS expenditure, which when compared with beneficiary outputs, gives
indication of effectiveness of the programmes in the national response.

23
9. Measurement
of Access and
Performance
survey (MAP
survey)
This survey is conducted in the sexual and reproductive health sector. It seeks to
monitor the performance of product delivery systems and the resultant product
availability, cost-effectiveness, coverage, quality, and equity of access to
products. The survey is conducted by Population Services International (PSI) in
Zimbabwe. Future rounds of this survey will serve as evaluations of progress in
programme quality improvement following findings from the first round.
10. Tracking
Surveys /
Project TRAC
This is a national population based survey that is conducted annually. Project
TRAC collects information on behavioural indicators in HIV prevention but
additionally uses „segmentation‟ analyses on at-risk populations to determine
those with desired behaviors, and those not. This exercise enables program
managers and communications specialists to identify the opportunity, ability
and motivation factors that influence or correlate with desired behaviors in HIV
prevention.
11. Multi-
indicator
cluster survey
This survey is part of an international initiative developed to measure progress
toward an agreed set of goals that emerged from the 1990 World Summit for
Children. It collects data on the situation of women, children and other
vulnerable groups in the country. Zimbabwe is conducting MICS3 in 2009,
which is expected to provide an update on key developmental indicators,
including the MDGs on women and children. The Central Statistical Office is
the coordinates this survey with support from UNICEF and other partners. The
MICS is supposed to be conducted every 3 to 5 years subject to availability of
funding from partners.
12. Behavioral
Surveillance
Survey
(BSS+)
The BSS is an international population-based survey designed to study HIV
trends and patterns in at risk populations. It enables a country to establish the
estimated population of its sexual minorities and their characteristics such as
MSM; WSW; and bisexuals. And the estimated prevalence of HIV within each
sub-group. It also characterizes knowledge and personal risk perceptions of HIV
among the sub-groups as well as assessing factors that determine vulnerabilities
to HIV and risk-increasing sexual behaviors. It also assesses services provided
to each sub-group and their access to prevention and treatment (including HIV
testing, counseling and ARV treatment). Zimbabwe has plans to conduct the
BSS in 2010 and thereafter conduct this survey every 2-3 years.
13. Operations
Research in
ZNASP
At this time, Zimbabwe does not have an OR plan in place and does not have a
resourcing mechanism for such research. However, the recently instituted
SADC initiative is expected to stimulate and strengthen research among
National AIDS Councils within the region, including Zimbabwe. When this
starts in Zimbabwe, the country is expected to set up an operations research
agenda which will fill the gaps identified in research on the national response.
14. MIPA
baseline study
Zimbabwe conducted the first MIPA baseline in 2008. This mapped where
Zimbabwe was in the extent, levels and forms of participation of PLHIV in
structures and programmes of the national response to HIV and AIDS. The plan
is for Zimbabwe to conduct MIPA evaluations bi-annually.
15. HBC
Evaluation
This evaluation provides a mapping of organisations in HBC, ascertain number
of people on HBC, map strategies and approaches, and evaluate quality and
effectiveness of programme services. The first evaluation was conducted in
2006. Plans are to do the evaluation every 2-3 years, resources permitting.

24
16. Know Your
Epidemic
Study
This survey assists a country to determine the type of epidemic the country has,
whether generalized or concentrated. It also determines the modes of
transmission of HIV in the epidemic. Zimbabwe has plans to conduct the first
survey in 2010. The survey has an added advantage over other surveys that
estimate HIV prevalence in that the study covers More-at-risk populations
(MARPS) and determines HIV prevalence among them.
17. Operations
for the NAP
for OVC
Program
An operations research agenda was developed for the NAP for OVC
programme. Currently four studies are under way under this agenda up to 2010.
The studies are expected to inform programming strategies for children
orphaned and made vulnerable by HIV and AIDS.
6.1.1 Strategies on Evaluation, Surveillance and Research
Operationalize the Research Advisory Committee and M&E task forces at all levels
Develop a database of national evaluations and researches underway (from SADC, MRCZ,
Colleges and Universities)
Facilitate periodic research meetings for sharing of findings at all levels
Develop a national research agenda and evaluation plan
Build research capacity in HIV and AIDS by providing fellowship for masters and PhD
programs
Build operations research capacity at all levels through the District Research Initiative (DRI)
Facilitate integration of key outcome and impact indicators in national surveys
Improve PMTCT data in preparation for transition from use of ANC surveillance data to use
of PMTCT data to estimate prevalence among pregnant women
Develop and carry out an evaluation of the M&E system to coincide with the ZNASP mid-
term evaluation. The focus of the evaluation will be to assess the M&E approach to tracking
the multi-sectoral response to HIV and AIDS
Establish an HIV and AIDS research bulletin
Conduct annual HIV and AIDS conference
Develop a financial monitoring system to track M&E financial inputs and outputs

25
CHAPTER 7: STRATEGIES FOR M&E CAPACITY STRENGTHENING
7.1 M&E Staffing
Implementation of the M&E plan requires the establishment of an appropriate staff complement in
NAC. Currently, the organization is suffering from high staff turnover because of low remuneration.
The number of M&E staff positions is not adequate at national level. In addition, there are capacity
gaps among the M&E staff.
7.1.1 Strategies to improve M&E staffing levels, knowledge and skills in M&E
Conduct a skills and manpower audit and job evaluation among M&E staff in NAC, AIDS
and TB Unit, NHIS and implementing partners,
Develop a national training curriculum for M&E staff for both initial training and refresher
training
Hire and train additional staff to carry out M&E activities to fill identified gaps in staffing
Develop annual province and district-based training plans for M&E personnel
Conduct trainings skills building training as per plans
Develop on the job continuous education and mentoring tools for use by M&E supervisory
staff
Introduce annual performance based rewards for well performing districts
Review remuneration in order to retain staff
7.2 Coordination and Leadership for M&E
NAC has the mandate to coordinate the monitoring and evaluation of all HIV & AIDS interventions
in Zimbabwe. To execute this mandate, NAC has established an M&E Unit with staff at HQ,
province (PAAC) and district level (DAAC). See Annex 3 for TOR of NMEAG. There is no
designated M&E staff at the sub-district (WAAC and VAAC) level. In addition, NAC has also
established the Monitoring and Evaluation Advisory Group (MEAG). Composed of representatives
from Zimbabwean National AIDS Council (NAC), Ministry of Health and Child Welfare,
Development partners, Academic and Research Institutions, key implementing organizations,
MEAG serves as a technical advice-giving and consultative group to the National AIDS Council of
Zimbabwe. Plans are underway to establish similar M&E advisory groups at provincial and district
levels. Technical Working Groups (TWGs) are created from member volunteers for specific tasks
for a defined time period.
7.2.1 Strategies to improve coordination and leadership for M&E
Develop terms of reference (TOR) for the TWGs of the NMEAG
Develop TOR for provincial MEAG (PMEAG) and district MEAG (DMEAG)
Develop operational guidelines for PMEAGs and DMEAGs
Hold quarterly meetings of PMEAGs and DMEAGs
Presentations on HIV and AIDS by the DAC and PAC will be done at the quarterly district
and provincial Health Management Team meetings respectively
Conduct regularly scheduled six monthly supervisory visits to implementing agencies,
districts and provinces by members of the DMEAG, PMEAG and NMEAG (respectively)

26
Hold quarterly meetings of the Minister of Health with Principal Medical Director of Disease
Prevention, Permanent Secretary, Director AIDS and TB Unit, and NAC CEO
Annual presentation on HIV and AIDS to the Cabinet Committee of Social Services and to
the Parliamentary Portfolio Committee on Health will be done by NAC Appoint a member of the WAAC as an M&E focal person
Strengthen PMEAGS and DMEAGs in each province and district
7.3 Equipment and Supplies
A minimum package of office furniture and equipment for all M&E units at national, provincial and
district level has been determined and includes the following:
Office space
Office furniture (desk, 2 chairs, filing cabinet)
Desk top computer with appropriate software for data processing and management
One high capacity printer
One photocopier
Telephone, fax, emails
Vehicle
Binding machine
7.3.1 Strategies for Equipment and Supplies
Develop policy to address how, when and to whom computers are supplied and distributed at
each level
Conduct an in depth inventory of the following:
o Equipment at the all levels
o Office space and leasing options
o Consumables like printing paper, printer cartridges and writing material and establish
a system of ordering and supplying these items
Based on findings of the inventory assessment, conduct resource mobilization with
development partners
Network computers to facilitate horizontal sharing of information at all levels of the system
including implementing partners and stakeholders
Conduct relevant training in use of electronic technologies and equipment
Establish IT support systems by training existing staff (DBOs), contracting, or hiring IT
support staff
Provide funding for vehicle repairs, maintenance, and fuel
Explore and pilot alternative technologies such as, mobile/cellular transmission services
powered by either solar or battery to alleviate problems caused by power outages

27
CHAPTER 8: IMPLEMENTATION OF THE M&E PLAN
8.1 Linkages, Integration and Partnerships
The National M&E Plan for HIV and AIDS is linked to other important policies and initiatives
already under implementation. The success of the strategies of the plan therefore, depends on
deliberate efforts to promote strong partnership among all the stakeholders. The implementation
strategy is aimed at supporting M&E stakeholders at all levels to successfully operationalize the
National M&E Plan. Similarly, the institutional framework is designed to facilitate effective
coordination of M&E activities at all levels. The implementation strategy will target high priority
areas of the M&E plan that need to be addressed for the plan to be quickly operationalized and
efficiently implemented. The following categories of interventions will be prioritised for immediate
implementation and gradual expansion:
Human resources
Equipment and supplies
Data management and
Leadership and coordination
8.2 Institutional Arrangements and roles and responsibilities
The NAC Board is responsible for implementing the multi-sectoral response to HIV and AIDS in
Zimbabwe and so it has the mandate for overall plan supervision. At the National and sub-national
levels, appropriate institutional arrangements and capacities will be created and resources provided
to facilitate participation in M&E at all levels. Table 1 summarizes the institutional framework and
roles and responsibilities for operationalising the M&E plan.
Table 6 M&E Institutional and Functional Linkages Framework and Roles and Responsibilities
Institution/Person Responsibility
Political Oversight and support
Cabinet Committee on Social Services. Review Annual Report on ZNASP implementation.
Review Policy direction based on report.
Ensure adequate funding for national response.
Parliamentary Committee on HIV and
AIDS.
Receive
NAC Management Committee Enforcing accountability in the implementation of the
National M&E Plan, including policy and program
implementation.
Policy/Technical Coordination
M&E Unit of NAC housed at NAC HQ Provides overall day-to-day management of the
implementation process of the M&E plan. Provides secretarial
support services to the MEAG.
NMEAG Provide technical oversight in the implementation of the
National M&E Plan.
Provide technical guidance on the implementation of the
National M&E Plan.

28
Provide technical advice to the Parliamentary Committee on
HIV and AIDS, the Cabinet Committee on HIV and AIDS,
NAC Board.
Minister, Secretary for Health,
Principal Medical Director for
Epidemiology, CEO/ NAC, Director
AIDS and TB Unit
Quarterly review meetings to monitor progress in
implementing ZNASP and achievement of national targets
and regional and global commitments.
Present Annual Report on implementation of ZNASP to the
Cabinet Committee on Social Services.
Government Departments Ensure active integration of M&E into their HIV & AIDS
sector and support implementation efforts at the national,
provincial and district levels.
Planning and budgeting of M&E activities into their
department budgets.
Prepare program and financial reports and submit to NAC for
monitoring purposes.
Civil Society Organizations and Private
Sector Umbrella bodies (ZAN, ZBCA).
Ensure that M&E is mainstreamed in all their HIV and AIDS
activities.
Monitor and evaluate their HIV and AIDS activities and
report to NAC M&E Department.
Align their M&E programs in support of the National M&E
Plan for HIV and AIDS. Provide program and financial
reports. Conform to standards and norms set by the NAC
M&E Department.
Development Partners Provide requisite technical support.
Assist the NAC M&E department in mobilizing needed
resources. Support analytical work to inform policy
implementation and M&E. Adhere to the agreed M&E plan,
work plan and reporting requirements. Align their M&E
initiatives to National M&E Plan for HIV and AIDS.
Operational level
Health Facility record/data clerks Order and maintain adequate stocks of data collection
tools/forms.
Distribution of tools/forms to all departments or units where
they are needed within the health facility.
Proper filing or storage of completed forms.
Monthly consolidation of data/statistics.
Preparation of analytical summaries based on templates.
Timely presentation of consolidated statistics to senior facility
managers.
Health facility senior management
(RHC, polyclinic, hospital senior
management)
Support and supervision to data clerks.
Review facility statistics for accuracy and completeness.
Review analytical templates and take appropriate action.
Approve consolidated monthly statistics for submission to

29
district level.
District Health Information Officer
(DHIO)
Collect and collate data from all health facilities in the
district. Support and supervise records clerks in health
facilities. Fill data analysis templates for presentation to
DHE. Timely submission of data to PHIO and to DAC.
Training and mentoring of data clerks.
Provincial Health Information Officer
(PHIO)
Collect and collate health data from all the districts in the
province. Support and supervise records DHIOs. Fill data
analysis templates for presentation to PHE. Timely
submission of data to NHIS HQ. Training and mentoring of
DHIOs.
DHE/PHE
Non-health facility implementing
agency M&E Focal Person.
Order and maintain adequate stocks of data collection
tools/forms.
Proper filing or storage of completed forms.
Monthly consolidation of data/statistics.
Preparation of analytical summaries based on templates.
Timely presentation of consolidated statistics to senior facility
managers.
VAAC and WAAC
Ensure that all implementing agencies operating in their area
are registered.
Appoint an M&E focal person in the VAAC/WAAC.
Receive and review statistics from their area and take
appropriate action.
DAC/M&E Officers at district
level/DBOs
Supervise, support and mentor M&E focal persons at
implementing agencies.
Collection and collation of data and statistics from all the IAs
in the district.
Coordinate training for M&E in the district.
Management of the district data base.
Timely submission of reports.
PAC/M&E officers
Collection and collation of data and statistics from all the
districts in the province.
Supervision and support of M&E Officers level/DBOs at
district level.
Coordinate training for M&E in the province
DMEAG/PMEAG (These are
subcommittees of the PAAC and
DAAC that will focus on M&E).
Ensure that M&E is actively mainstreamed into HIV and
AIDS activities in all provinces and districts
Ensure that the M&E plan is being implemented according to
plan.
8.3 Communication and Dissemination of the M&E Plan
Launching of the plan

30
In view of the importance of the National M&E Plan for HIV and AIDS as one of the three central
pillars of the nation‟s response to the HIV epidemic, the plan shall be officially launched at a high
level to be attended by representatives of all national stakeholders from all levels as well as
development partners.
Dissemination of the plan
It is important for all stakeholders contributing to the implementation of the ZNASP to be aware of
and familiar with the M&E plan so that they are clear about their role and responsibility in ensuring
effective tracking of activities to prevent the transmission of HIV and to treat and care for those
living with or affected by HIV and AIDS. The plan will be distributed widely electronically and
hard copies to umbrella/coordinating bodies of key stakeholders, individual implementing agencies
and health facilities, development partners.
8.4 Technical Assistance to facilitate implementation of the plan
The NAC M&E department will be responsible for ensuring that the M&E plan is implemented in a
timely manner. The NMEAG will provide necessary technical advice to the department. However,
in view of the fact that members of the NMEAG are full time employees of their respective
organizations, there will be need for outside Technical Assistance to support the M&E department in
performing the tasks needed to ensure effective and timely implementation of activities in the plan.
There will be need to build capacity in not only M&E but in leadership and management in general
among elected leaders, policy makers, programme/project managers and health facility managers at
all levels District and Provincial Health Executives as well as the national level managers. There is
need to build a culture and skills in use of information, data and statistics for decision making and
monitoring progress in achieving set national, regional and global targets.

31
Table 6: M&E Framework and Targets
HIV AND AIDS NATIONAL MONITORING AND EVALUATION PLAN 2006 – 2010
STRATEGIC AREA: PREVENTION
TARGET PROGRAMME
AREA INDICATOR INDICAT
OR TYPE
(N/R/G)
INDICAT
OR
FREQ SOURCES OF
DATA
BASE-
LINE
2010
2011
2012
COMMENT
ZNASP Objective: To reduce the number of new HIV infections in both vulnerable groups and general population
HIV
Prevalence
1.1.1 HIV Prevalence among adult men and
women (15-49 yrs)
Impact National 2 yrs HIV and AIDS Estimates
13.7%
[2009]
13.5% 13.3% 13.1% Past trends
showing declining
rate of decrease.
1.1.2 HIV Prevalence among women aged 15-24 attending ANC
Impact National
2 yrs ANC Survey [MOHCW]
11.6% [2009]
11.0% 10.0% 8.6%
Targets set for MDG & Universal
Access reports
1.1.3 Percentage of young women and men aged 15-24 who are HIV infected Impact
UNGAS
S 22
2 yrs HIV and AIDS
Estimates
7.5%1 [2009]
6.5% 5.5% 4.5%2 Rate of decrease expected to
decline
1.1.4 Percent of more-at-risk population who
are HIV infected
Impact UNGAS
S 23
2 yrs Special Study
[UNAIDS]
Not known3 - - - MARPS are not
well-defined and legalized hence
never research in
Zimbabwe. Country hopes to
get funding to
conduct a special study on MARPS.
1.1.5 Percentage of HIV infected infants born
to HIV infected mothers who are infected
Impact UNGAS
S 25
Annual Program Data,
[MOHCW]
Not Known4 - - - MoHCW currently
not collecting this indicator because
of challenges in
testing babies but expected to start in
2010.
PMTCT To increase the uptake of PMTCT services among ANC women from 42 % to 90% by 2010
1 National HIV Estimates 2009
2 Current trends – 19.9% (2002), 17.4% (2004), 13.1% (2006), 7.5% (2009), declining by 2n% (n=1, 2, 3…) every two years, 3 Zimbabwe failed to report on this indicator in the last two UNGASS reports because of non-availability of data. MARPs are not well-defined in Zimbabwe. Research has also not been possible in this area because some of the
activities involving these groups are deemed illegal in the country. 4 Zimbabwe has not been collecting this indicator. The MoHCW has promised to start collecting the indicator in 2010 and the 2010 figure shall be the baseline.

32
PMTCT
1.2.1 Percent of health institutions with ANC
facilities offering basic PMTCT services
Output National Annual Program Data
[MOHCW]
96%
[2009]
96% 96% 96% Some health facilities cannot
be improved because of setup hence no further improvement
expected
1.2.2 Percent of health institutions with ANC
facilities offering comprehensive PMTCT services (HIV testing and
ARVs)
Output GF Annual Program Data
[MOHCW]
59% [2009] 64% 69%% 75% facilities with comprehensive
PMTCT
D - all health facilities
1.2.3 Percent of pregnant women with known HIV status [N-number of women with
HIV results; D-all women attending
ANC]
Outcome National Annual Program Data [MOHCW]
78% [2008]
80% 82% 84% Rapid testing roll-out in progress. Increase expected
1.2.4 Percent of infants born to HIV infected
women tested for HIV within 12 months
Output PEPFAR
Annual Program Data [MOHCW]
4% [2008] 8% 12% 20% Early infant diagnosis being rolled out, increase expected
1.2.5 Percent of infants born to HIV infected
women receiving any prophylaxis for
PMTCT
Output National Annual Program Data
[MOHCW]
34%
[2008]
65% 75% 100% Based on women attending
ANC
1.2.6 Percentage of HIV infected pregnant
women who receive anti-retroviral to
reduce the risk of Mother to Child
Transmission
Outcome UNGASS 5
Annual Program Data [MOHCW]
49% [2008]
60% 65% 75% Increase expected as MER roll-out continues
1.2.7 Percentage of HIV infected pregnant
women who received ART for their own
health
Outcome National Annual Program Data [MOHCW]
5% [2008]
8% 12% 15% MER roll-out in progress
CT ZNASP Objective: To increase the number of adults (15-49years) accessing C&T services from 15% to 75% in 2010
Counseling
and testing
1.4.1 Percent of adults (15-49 years) that are
counseled and tested for HIV in the past 12 months who know their results (by
age and gender)
Outcome UNGAS
S 7/GF
5 yrs ZDHS 6%
[2006]
10% 15% 20% ZDHS 2005/6 presented male
and female figures 15-24 years old, but data available.
Baseline is average of the two
figures.
1.4.2 Percent of most-at-risk populations that
are counseled and tested for HIV in the
past 12 months who know their results (by age group and gender)
Outcome UNGASS 8
2 yrs Special Study [UNAIDS]
Not known _ _ _ MARPS are not well-defined and legalized hence never
research in Zimbabwe.
Country hopes to get funding to conduct a special study on
MARPS
1.4.3 Number of people counseled and tested
for HIV in the past 12 months (by age
and gender)
Output PEPFA
R, GF
Annual Program Data
[PSI/MOHCW]
650,000
[2009]
700,000 800,000 900,000 Increase expected if CT
outreaches continue and
through scaling up of PITC
1.4.4 Number of people testing HIV-positive
(by age and gender)
Output PEPFA
R
Annual Program Data
[MOHCW/PSI]
190,000 200,000 210,000 230,000 Increasing last three years due
to increase in access to T&C but rate of increase expected
to decline as incidence
declines.

33
Condoms To promote consistent condom use among most-at-risk populations
1.5.1 Percent of adults (15-49 years) who had
sexual intercourse with more than one partner in the last 12 months who
reported using a condom during their
last sexual act
Outcome UNGAS
S 7 GF
5 yrs ZDHS
M-68.6%
F-46.3% [2005/6]
M-67%
F-45%
M-66%
F-44%
M-64%
F-43%
Expected to decline due to
behavior change intervention being rolled out country-wide
through GF round 8 but
marginal.
1.5.2 Percent of young people aged 15-24
reporting the consistent use of a condom
with non-regular sexual partners in the last year
Outcome GF 5 yrs ZDHS
F -42.2%
M-68%
[2005/6]
F - 45%
M-70%
F - 48%
M-73%
F - 50%
M-75%
Expected to increase due to
behavior change intervention
being rolled out by GF Round 8
1.5.3 Number of male/female condoms
distributed
Output National Annual Program Data
[MOHCW/PSI]
F: 5,276,705
M:95,463,49
0 [2008]
6,000,000
100,000,000
7,000,000
105,000,000
8,000,000
110,000,0
00
Condom promotion
continuing and male condom
uptake expected to increase more because of less cultural
barriers
Most-at-risk
populations ZNASP Objective: To increase coverage of all groups and sites from 10% to 50 % by 2010
1.6.1 Number of most-at-risk populations reached by an HIV prevention
intervention
Output National Annual Program Data [NAC]
300,000 350,000 400,000 500,000 Marginal increase expected because of absence of
intervention for MARPS of
national nature
1.6.2 Percent of female and male sex workers
reporting the use of a condom with their
most recent client
Outcome UNGASS 18
5 yrs ZDHS
74% [2005/6)]
76% 78% 80% There no clear interventions for SW in Zimbabwe which
can limit impact
1.6.3 Percent of injected drug users reporting the use of a condom the last time they
had sexual intercourse
Outcome PEPFAR 3 yrs Special Study [UNAIDS]
Not Known - - -
There is no information about this and IDUs are believed to
be a minority if present in
Zimbabwe. The country would need funding to
conduct a special MOT study
to identify this.
1.6.4 Percent of males reporting the use of a
condom the last time they had anal sex
with another man
Outcome UNGASS
19
5 yrs Special Study
[UNAIDS]
Not Known - - -
There is no information on
this and MSM relationships
are not legalized in Zimbabwe. The country
needs funding to conduct a
special study on this.
BC ZNASP OBJECTIVE: Increased adoption of safer sexual behavior and reduction in risk behavior among men and women
1.7.1 Percent of men and women (15-49) reached through mass media BCC (by
age )
Output National 5 yrs KAP Survey (PSI)
M-67% W-73%
M-72% W-78%
M-77% W-83%
M-77% W-83%
Targets will increase due to BC programme but reach
limit based on media
accessibility
1.7.2 Number of people reached through
community outreach programs
promoting HIV prevention including interpersonal communication
Output National Annual Program Data
[NAC]
Not Known 2,700,000 4,400,000 4,400,00
0
Indicator currently not being
collected but to be collected
from 2010. Targets provided in the GF Round 8 PF.

34
1.7.1 Percentage of young women and men
who have had sexual intercourse before the age of 15
Outcome UNGASS
15
5 yrs ZDHS 5 %
[2005/6]
5 % 4.5% 4% Comprehensive effort being
done to reduce age at first sex.
1.7.2 Number of people who have completed
training on the national community BC
course (Love & Respect or comparable).
Output National Annual Program data
[NAC]
100,000 [
2009 ]
255,000 435,000 615,000 Targets are cumulative.
1.7.3 Percent of married women and men
reporting more than one sexual partner
in the past 12 months
Outcome National 2 yrs NBCS [2008] M- 28.1 %
W- 6.2 %
M-26%
F-5.2%
M-24%
F- 5.2%
M-22%
F-4.2%
The study is conducted every
2 years and we expect the
targets to go down.
1.7.4 Percent of never married men and women reporting sex with more than
one partner in the past 12 months
Outcome National 2 yrs NBCS5 [2008]
M-27.3 % W-10.5 %
M-25% W-9.5%
M: 23% F: 9.0%
M-21% F-8.5%
BC campaign impact expected to cause decrease in
this indicator
1.7.5 Percent of men and women 18-49 who
had concurrent sexual relationships in
the past 12 months
Outcome National 2 yrs NBCS [2008]
M- 9.6 %, W-2.5 %
M-9.0% W-2.4%
M-8.3% ; W-2.2%
M-7.7% F-2.1%
BC campaign impact expected to cause decrease in
this indicator
Youth ZNASP OBJECTIVE: TO PROMOTE, STRENGTHEN, SUPPORT AND COORDINATE THE YOUTH PROGRAMME IN THE NATIONAL RESPONSE TO HIV AND AIDS.
1.8.1 Percent of young people aged 15-24
who had sex with more than one partner
in the last 12 months
Outcome GF 5 yrs YAS, ZDHS W-1.8%; M-19.8%
W-1.7% M-19.8%
W-1.6% M-18.8%
W-1.5% M-17.8%
BC programme impact expected to cause decline
1.8.2 Number of youth in school exposed to
HIV&AIDS education Output GF Annual
Program Data
[NAC]
2,859,173
MESAC 3,380,955 3,380,955
3,380,95
5
The targets for 2010 to 2012
are the number of pupils in school from the MOESC
1.8.3 Number of youth out-of-school exposed
to HIV&AIDS education Output National Annual
Program Data
[NAC]
113,481
MESAC 150,000 180,000 200,000
Increasing support to the
programme area expected increase coverage
1.8.4 Number of youth in tertiary institutions
exposed to HIV&AIDS education Output National Annual
Program Data [NAC]
Not Known
45,000 50,000 60,000
There were no indicators to
collect data from tertiary institutions up to end of 2009.
Data will be collected from
2010 but targets based on enrollment and gradual
programme scale-up.
1.8.5 Percent of school teachers trained in life
skill-based HIV education. Output National Annual
Program Data
[NAC]
17%
MESAC 25% 35% 50%
There is a programme being
rolled out which will increase targets.
Male
Circumcisio
n
To increase the number of males that
undergo circumcision Baseline 2010 2011 2012
1.9.1 Percent of men circumcised (15-29) Outcome National 5 yrs ZDHS
[2006] 10% 10.8% 11.7% 12.8%
Based on baseline and
number added annually over
men 15-29 population (ICDS 2008)
5 NBCS – National Behaviour Change Survey, an impact assessment survey for the behaviour change intervention in Zimbabwe. The baseline survey was
conducted in 2008.

35
1.9.2 Percent of men willing to be
circumcised (15-29) Outcome National 5 yrs
ZDHS
Not Known
- - -
ZDHS for 2010 to provide a
Baseline. MC strategic planning to be done soon will
provide targets.
1.9.3 Number of public institutions offering
safe MC Output National Annual
Program Data
[MOHCW]
5
[2009] - - -
MC strategic plan to decide
strategic approach and targets
1.9.4 Number of males circumcised (by age) Output PEPFAR/
N Annual
Program Data
[MOHCW]
2,500
[2009] 30,000 60,000 100,0000
Increase expected due to MC
roll out
STI To reduce the incidence of STI by 40% by 2010
1.10.1 Percent of adults (15-49years) that
had an STI in the last 12 months (by age and gender)
Outcome National 5 yrs
ZDHS W- 4%
M-3%
W-4%
M-3%
W-3.9%
M-2.9%
W-3.8%
M-2.8%
2009 ANC and programme data showed increase in STI
prevalence, hence minimal
decline expected
1.10.2 Prevalence of STI among sex
workers Impact National 2 yrs Special study [UNAIDS]
Not Known
- - -
Zimbabwe has not done such study before. MOT study
expected to provide baseline
1.10.3 Prevalence of syphilis among antenatal care attendees
Impact National 2 yrs ANC 0.6% [2009]
0.6% 0.59% 0.58%
Minimal decline expected
because recent increase in
2009
To ensure effective treatment of the STI by 2010
Blood
Safety
To screen all donated blood for HIV
1.11.1 Percent of donated blood units
screened for HIV Outcome
UNGASS
3
Annual Program Data
[NBTS] 100% 100% 100% 100%
Blood screening has been at
100% for some years now.
1.11.2 Percent of donated blood units tested
HIV positive Outcome National
Annual
Program Data [NBTS]
0.5% 0.5% 0.48% 0.47%
Mostly school children donating blood and decline
is expected continuing
prevention interventions in schools
Infection
control
To reduce HIV infection from occupational
exposure in health workers
1.11.3 Number of health workers reporting
exposure Output PEPFAR
Annual Program Data
[MOHCW]
85
[2009] 75 60 50
Efforts continuing to reduce
exposure risks for health
workers
1.11.4 Number of health workers receiving
PEP Output National
Annual Program Data
[MOHCW]
41
[2009] 40 32 27
Average percentage
receiving PEP 2007-9 used
in the projections
TREATMENT AND CARE
ART/OI To rapidly increase the number of patients on treatment

36
2.1.1 Percent of adults and children with advanced HIV infection receiving anti-
retroviral drugs (ARVs)
Outcome UNGASS 4 2 yrs
Program
Data
[MOHCW]
A- 178,001
52%
C- 19,018
54%
[2009]
A- 260,000
76%
C- 25,000
(71%)
A- 310,000
90%
C- 30,000
(85%)
-
2010-11 targets based on
ART strategy targets. 2012
targets expected from next ART strategic plan
2.1.2 Number of people (children and adults) receiving ART through the private
sector initiative
Output National Annual
Program
Data
[ZBCA/EMCOZ]
Not
Known - - -
Private sector data currently not consolidated. Expected
to be available from 2010.
2.1.3 Percent of HIV positive incident TB
cases that received treatment for HIV
and TB
Outcome UNGASS 6 Annual
Program
Data
[MOHCW]
- - - - Targets aligned with round 8
performance framework
2.1.4 Percent of HIV infected children and adults known to be on treatment 12
months
Outcome UNGASS 24 Annual Program Data
[MOHCW]
75%
[2009] 86% 87% 88%
2010-11 targets based on
ART strategy targets. 2012
targets expected from next ART strategic plan
2.1.5 Percent of HIV infected children and
adults known to be on treatment 24 months after initiation of ARVs
Outcome National Annual
Programme
Data [MOHCW]
65.7%
68% 70% 72%
Gradual increase expected
due to improvement in patient tracking
2.1.6 Number of HIV-positive persons
receiving cotrimoxazole prophylaxis Output National
Annual Program Data
[MOHCW]
398,546
[2009] 500,000 600,000 -
2010-11 targets based on
ART strategy targets. 2012
targets expected from next ART strategic plan
2.1.7 Number of health facilities initiating
ART Outcome National, GF
Annual Program
Data
[MOHCW]
117
[2009] 125 130 -
2010-11 targets based on
ART strategy targets. 2012
targets expected from next
ART strategic plan
2.1.8 Number of health facilities providing
ART follow-up services
187 220 240 -
2010-11 targets based on ART strategy targets. 2012
targets expected from next
ART strategic plan
2.1.9. Percent of health facilities dispensing
ARVs which have experienced a stock
out of at least one required ARV in the
last 12 months.
Outcome National Annual
EWI / LMIS
[MOHCW]
0% 0% 0% 0% Based current state of resource availability and
commodity distribution no
stock outs expected
Laboratory
Servicies To strengthen basic laboratory services nation-wide to allow for a rapid ART roll-out
2.2.1 Percent of ART sites with capacity to
perform clinical laboratory tests Output National Annual
Program
Data
[MOHCW]
68% [2009]
89% 94% 98%
Cites with functional CD 4
count machines to all ART
initiating sites. Objective to reach 100% but 100%
functionality difficult to
attain

37
2.2.1 Percent of laboratories that are
accredited according to national or
international standards
HBC To increase access to effective HBC services for infected people by 75% by 2010
2.3.1 Percent of clients accessing
minimum standard CHBC services
in the last 12 months (by gender)
Outcome National 2 yrs
HBC
evaluation
[NAC]
48% 52% 55% 58%
Increased coverage
expected in line with new
strategic plan
2.3.2 Percent of HIV positive clients
reporting an improvement in quality of life following enrollment
into an HBC programme
Impact National 2 yrs
HBC
evaluation
[NAC]
Not Known
60% 70% 80%
Currently not being
collected but to be collected from 2010.
2.3.3 Number of HIV positive clients on
home based care Output National Annual
Program
Data [NAC]
165,244
[2009] 165,500 165,500 165,500
No increase expected
because of ART programme
2.3.5 Number of caregivers working in the HBC programme
Output National Annual
Program
Data
[NAC]
40,349 40,300 40,300 40,300
No increase expected
because not much increase is expected in number of
patients on HBC
MITIGATION
PLHHIV
3.1.1 Number of PLHIV receiving
standardized food package Output National
Annual Program
Data [NAC]
104,154
[2009] 105,000 105,000 105,000
Not expected to increase
basing on current trends
3.1.2 Number of PLHIV receiving
medical assistance
Output National
Annual Program
Data
[NAC]
20,000 [2009]
20,000 20,000 20,000
Not expected to increase
basing on current trends
3.1.3 Number of PLHIV receiving
psycho-social support
Output National
Annual Program
Data
[NAC]
56,600 60,000 65,000 75,000
Expected increase in line
with strategy
3.1.4 Percent of PLHIV participating in
(a) coordination structures (b)
programme activities of the response (by age and gender)
Outcome National
Annual
MIPA
SURVEY
Not
Known - - -
To be collected by MIPA
survey
3.1.5 Percent of support groups for
people living with HIV with institutional capacity
Outcome National
Annual
GF R8 Not
Known 100 300 -
2012 target to be informed
by MIPA survey
3.1.6 Percentage of men and women
expressing specific acceptance
attitudes towards PLHIV
Output National
Annual
ZDHS
M-11%, W-17%
[2005/6]
M-15%,
W-20%
M-20%,
W-25%
M-25%
W-30%
Gradual increase expected
through continuing
HIV/AIDS education
OVC To provide free basic support in caring for at least 50% to 80% of OVCs

38
3.2.1 Percent of OVC (under 18 years of
age) living in households that have received basic external support in
caring for the child (by age and
gender)
Outcome UNGASS 10
5 yrs ZDHS
21% (MIMS
2009)
22% 24% 25%
Increase expected in line
with strategic plan targets (NAP for OVC targets)
3.2.2 Number of children under 18 that have a chronically ill parent, live in
a household where an adult aged
18-59 died in the past year or live in a household with an adult aged
15-59 who has been chronically in
the past year
Outcome WFFC 76
5 yrs ZDHS
6%
[2005/6] 5% 4% 3.5%
Decrease expected with decline in HIV prevalence
3.2.4 Proportion of OVC aged 15-17
years that had sex before age 15, Outcome WFFC 80
5 yrs
ZDHS M-7%,
W-6%
[2005/6]
M-6.8%,
W-6.5%
M-6.5%,
W-6.0%
M-6.0%
W-5.8%
Decrease expected due to
school related prevention
programmes
3.2.5 Percent of children aged 0-5 years
who have birth certificates Outcome WFFC 62
5 yrs ZDHS 37%
(MIMS) 40% 45% 50%
Increase expected through increasing support to
registry department
3.2.6 Percent of OVC provided with
food/nutritional assistance Output National
Annual Program
Data [MLSW]
30% (COI) 30% 30% 30%
No increase expected due to
seasonal fluctuations
3.2.7 Percent of OVC provided with
psycho-social support Output National
Annual Program
Data [MLSW]
10% (COI) 12% 15% 18%
Marginal increase expected
based on current trends
3.2.8 Percent of OVC receiving school-related assistance
Output National
Annual Program
Data
[MLSW]
20% (COI) 35% 40% 50%
Increase expected due to
revival of BEAM
programme
Gender
3.3.1 Percent of women and girls who
report being able to access and
consistently use female and male condoms
Outcome National
Annual ZDHS
40% 45% 55% 60%
Increase expected from
continuing condom
promotion programme
3.3.4 Percent of sexually abused women
and girls provided with post-exposure prophylaxis (PEP)
Output National
Annual Program
Data [MJPA]
Not
Known 5% 5% 6%
Data not collected currently
but expected from 2010.
Water and
Sanitation To increase access to safe water and sanitation by 60% to PLWHIV and OVC by 2010
3.3.1 .Percent of PLWHIV that have
access to safe water and sanitation Outcome
National Annual MIPA Survey
Not Known
- - - MIPA survey to collect baseline
MONITORING AND EVALUATION
To provide a comprehensive tracking system to collect, enter, analyze and share information on HIV and AIDS in all provinces by 2010
4.1.1 National M&E calendar developed
and implemented Output
National Annual
Program Data
[NAC]
Not
Available 1 1 1 To be developed from 2010

39
4.1.2 Percent of implementers with a
designated and functioning M&E focal person
Output
National Annual Program
Data [NAC]
58% 85% 90% 95%
Expected to increase as
implementers appreciate the importance of M&E
4.1.3 Percent of implementers regularly
reporting to the national M&E
system
Output
National Annual Program
Data
[NAC]
85% 90% 95% 98%
Expected to increase with
support for partner visits at
district level
4.1.4 Number of functional district and
provincial M&E task forces Output
National Annual
Program
Data [NAC]
85 85 85 85
All currently holding
quarterly meetings and
trend to continue depending availability of coordination
resources
4.1.5 Number of research projects,
special studies and impact evaluations commissioned
Output
National Annual Program
Data [NAC]
9 10 10 12
Expected to increase
depending on resource availability
4.1.5 Number of M&E feed-back reports
disseminated at district, provincial and national levels
Output
National Annual Program
Data [NAC]
96 96 96 96
All levels producing
reports, only need to increase circulation
4.1.6 Number of implementers provided
with technical support in monitoring and evaluation
Output
National Annual
Program
Data [NAC]
500 500 500 500
Targets are not cumulative
but based on estimated
number of implementers in each province and this is a
prevalence indicator
because has to be continuous for many
implementers
To effectively coordinate all national HIV programmes and strategies and ensure high quality and full funding
4.1.7 Number of organizations (private
sector, public sector, civil society)
with HIV policies in place
Output
National Annual Workplace
Baseline
Survey
939 1020 1101 1200 To increase as workplace
programme improves
Resource Mobilization National
4.1.8 Percent of funds allocated to M&E
in national HIV and AIDS
programmes (ESP, GF, NATF, NAP for OVC, AIDS & TB)
Output
National Annual Program Data
[ALL]
10% 10% 10% 10% Minimum expected by
international guidelines

40

41
Annex I: Indicator Definitions
STRATEGIC AREA 1: PREVENTION
Programme Area 1: HIV Prevalence
Indicator 1.1.1 HIV Prevalence among adult men and women (15-49 yrs)
Purpose To assess progress towards reducing HIV infection
Source Demographic Health Survey, HIV Estimates
Numerator Number of persons (15-49 years) who tested positive for HIV
Denominator Number of persons (15-49 years) tested for their HIV infection status
Interpretation The impact indicator gives a fairly good picture of relatively recent trends in HIV
infection in locations where the epidemic is heterosexually driven. Both DHS and
HIV Estimates are used as data source to ensure that the country is kept abreast of
the HIV prevalence.
Indicator 1.1.2 HIV Prevalence among women aged 15-24 attending ANC
Purpose To assess progress towards reducing HIV infection
Source ANC Surveillance
Numerator Number of antenatal clinic attendees (15-24 years) tested whose HIV test results
are positive
Denominator Number of antenatal clinic attendees (15-24 years) tested for their HIV infection
status
Interpretation This indicator (using data from antenatal clinics) gives a fairly good estimate of
relatively recent trends in HIV infection in locations where the epidemic is
heterosexually driven. To supplement data from antenatal clinics, an increasing
number of countries have included HIV testing in population based surveys. If a
country has produced HIV prevalence estimates from survey data these estimates
should be included in the comments box for this indicator to allow for
comparisons between multiple surveys.
Indicator 1.1.3 Percentage of young women and men aged 15-24 who are HIV infected
Purpose To assess progress towards reducing HIV infection
Source HIV Sentinel Surveillance
Numerator Number of antenatal clinic attendees (15-24 years) tested whose HIV test results
are positive
Denominator Number of antenatal clinic attendees (15-24 years) tested for their HIV infection
status
Interpretation This indicator (using data from antenatal clinics) gives a fairly good estimate of
relatively recent trends in HIV infection in locations where the epidemic is

42
heterosexually driven. To supplement data from antenatal clinics, an increasing
number of countries have included HIV testing in population based surveys. If a
country has produced HIV prevalence estimates from survey data these estimates
should be included in the comments box for this indicator to allow for
comparisons between multiple surveys.
Indicator 1.1.4 Percent of more-at-risk population who are HIV infected
Purpose To assess progress on reducing HIV prevalence among most at risk populations
Source Behavioural surveillance or other special surveys
Numerator Number of members of the most at risk population who test positive for HIV
Denominator Number of members of the most at risk population tested for HIV
Interpretation Due to difficulties in accessing MARPs, biases in serosurveillance data are likely
to be far more significant than in data from a more general population such as
women attending antenatal clinics. Such concerns, if any, should be reflected in
the interpretation.
Indicator 1.1.5 Percentage of infants born to HIV infected mothers who are infected
Purpose To assess progress towards eliminating mother-to-child HIV transmission
Source PMTCT Cohort reports
Numerator Number of infants born to HIV infected mothers who are infected
Denominator Number of infants born to HIV infected mothers
Interpretation This indicator focuses on PMTCT of HIV through increased provision of ART
medicines. The Spectrum HIV estimation modeling software takes into
consideration the type of ARV regimen as well as additional factors that influence
HIV transmission rates such as infant feeding practices.
Programme Area 2: Prevention of Mother to Child Transmission- PMTCT
Indicator 1.2.1 Percent of health institutions with ANC facilities offering basic PMTCT
services
Purpose To assess progress in increasing the provision of PMTCT services
Source PMTCT progress reports
Numerator Number of health institutions with ANC facilities offering basic PMTCT services
Denominator Number of health institutions with ANC facilities
Interpretation This indicator focuses on PMTCT through the provision of basic PMTCT services
by health institutions with ANC facilities. Basic or minimum services can include
counseling and usually the facilities refer clients to other centres offering
comprehensive services
Indicator 1.2.2 Percent of health institutions with ANC facilities offering
comprehensive PMTCT services (HIV testing and ARVs)
Purpose To assess progress in increasing the provision of PMTCT services
Source PMTCT progress reports
Numerator Number of health institutions with ANC facilities offering comprehensive PMTCT
services

43
Denominator Number of health institutions with ANC facilities
Interpretation This indicator focuses on PMTCT through the provision of comprehensive
PMTCT services by health institutions with ANC facilities. Comprehensive
services cover all aspects of PMTCT, from counseling to provision of ART
services
Indicator 1.2.3 Percent of pregnant women with known HIV status
Purpose To assess progress towards eliminating mother-to-child HIV transmission
Source ANC Surveillance
Numerator Number of ANC women with HIV results
Denominator Number of ANC attendees
Interpretation In order to protect themselves and yet to be born babies, it is important for the
pregnant to know their HIV status.
Indicator 1.2.4 Percent of infants born to HIV infected women tested for HIV within 12
months
Purpose To assess progress in preventing new infections and treatment of those infected
Source PMTCT Records/Reports
Numerator Number of infants born to HIV infected women who receive an HIV test
Denominator Number of infants born to HIV infected women
Interpretation The total number of infants born to HIV infected women who are tested for HIV to establish their serological status through a PMTCT program. This indicator reflects one goal of PMTCT, which is to prevent new infections to exposed infants and treat those who are infected.
Indicator 1.2.5 Percent of infants born to HIV infected women receiving any
prophylaxis for PMTCT
Purpose To assess progress in preventing new infections and treatment of those infected
Source PMTCT Records/Reports
Numerator Number of infants born to HIV infected women receiving any prophylaxis
Denominator Number of infants born to HIV infected women
Interpretation The total number of infants born to HIV infected women who are receiving any prophylaxis through a PMTCT program. This indicator reflects one goal of PMTCT, which is to prevent new infections to exposed infants and treat those who are infected.
Indicator 1.2.6 Percentage of HIV infected pregnant women who receive anti-retroviral
to reduce the risk of Mother to Child Transmission
Purpose To assess progress in preventing mother-to-child transmission of HIV
Source Numerator: Patient registers & summary reporting forms Denominator: Antenatal
clinic surveillance surveys in combination with demographic data or estimation
models such as spectrum
Numerator Number of HIV infected pregnant women who received antiretroviral medicines to
reduce the risk of mother to child transmission in the last 12 months
Denominator Estimated number of HIV infected pregnant women in the last 12 months

44
Interpretation Countries are encouraged to track and report on the actual or estimated %
distribution of the various regimens provided in order to monitor trends in regimen
use, and so that the impact of antiretroviral drugs on mother to child transmission
can be modeled based on the efficacy of corresponding regimens.
Indicator 1.2.7 Percentage of HIV infected pregnant women who received ART for
their own health
Purpose To assess progress in increasing the provision of ART services to infected
pregnant women
Source PMTCT progress reports
Numerator Number of HIV infected pregnant women who received ART
Denominator Number of HIV infected pregnant women
Interpretation The indicator monitors (over and above the extent of preventing mother-to-child
transmission) how the PMTCT programme is ensuring that the infected pregnant
women are accessing ART for the purpose of their own health.
Programme Area 3: Testing and Counselling- T&C
Indicator 1.3.1 Percent of adults (15-49 years) that are counseled and tested for HIV in
the past 12 months who know their results (by age and gender)
Purpose To assess progress in implementing HIV testing and counseling
Source Population-based surveys (Demographic Health Survey, AIDS Indicator Survey,
Multiple Indicator Monitoring Survey)
Numerator Number of respondents aged 15-49 who have been tested for HIV during the last
12 months and who know their results
Denominator Number of respondents aged 15-49. The indicator must be presented as
percentages for males and females and should be disaggregated by the age groups
15-19, 20-24 and 25-49. The denominator includes respondents who have never
heard of HIV or AIDS
Interpretation In order to protect themselves and to prevent infecting others, it is important for
individuals to know their HIV status. Knowledge of one‟s status is also a critical
factor in the decision to seek treatment.
Indicator 1.3.2 Percent of most-at-risk populations that are counseled and tested for
HIV in the past 12 months who know their results (by age group and gender)
Purpose To assess progress in implementing HIV testing and counseling among most-at-
risk populations
Source Behavioural surveillance or other special surveys
Numerator Number of most-at-risk population respondents who have been tested for HIV
during the last 12 months and who know the results
Denominator Number of most-at-risk population included in the sample.
Interpretation Accessing and/or surveying MARPs can be challenging. Consequently, data
obtained may not be based on a representative sample of the national most-at-risk
population being surveyed. Such concerns if found should be reflected in the
interpretation of the survey data. Where different sources of data exist, the best
available estimate should be used. Tracking MARPs over time to measure

45
progress may also be difficult due to mobility and the hard to reach nature of these
populations with many of them being hidden populations. Information about the
nature of the sample should therefore be reported in the narrative to facilitate
interpretation and analysis over time. To maximize the utility of these data, it is
recommended that the sample used for the calculation of this indicator be used for
the calculation of other indicators related to these populations.
Indicator 1.3.3 Number of people counseled and tested for HIV in the past 12 months
(by age and gender)
Purpose To assess progress towards increased provision and uptake of T&C services
Source MOHCW Programme Data
Numerator Number of people counseled and tested for HIV
Denominator N/A
Interpretation The indicator seeks to report on the total number of people counseled and tested in
one year.
Indicator 1.3.4 Number of people testing HIV-positive (by age and gender)
Purpose To assess progress in implementing counseling and testing programme
Source MOHCW Programme Data
Numerator Number of people testing HIV positive
Denominator N/A
Interpretation Out of the total number of people counseled and tested in one year, this indicator
now seeks to report the number found to be HIV positive, i.e. positivity rate in a
year
Programme Area 4: CONDOMS
Indicator 1.4.1 Percent of adults (15-49 years) who had sexual intercourse with more
than one partner in the last 12 months who reported using a condom during
their last sexual act
Purpose To assess progress towards preventing exposure to HIV through unprotected sex
with non regular partners
Source Population-based surveys (Demographic Health Survey, AIDS Indicator Survey,
Multiple Indicator Monitoring Survey)
Numerator Number of respondents (15-49 years) who reported having had sexual intercourse
with more than one partner in the last 12 months who reported using a condom
during their last sexual act
Denominator Number of respondents (15-49) who reported having had sexual intercourse with
more than one partner in the last 12 months
Interpretation This indicator shows the extent to which condoms are used by people who are
likely to have higher risk sex (i.e. change partners regularly). The current indicator
does not provide the level of consistent condom use.
Indicator 1.4.2 Percent of young people aged 15-24 reporting the consistent use of a
condom with non-regular sexual partners in the last year
Purpose To assess progress in preventing the sexual transmission of HIV among young

46
people
Source Demographic Health Survey
Numerator Number of respondents reporting the consistent use of a condom with non regular
sexual partners in the last year
Denominator Number of respondents who reported have sex with non regular sexual partners
Interpretation Condoms are most effective when their use is consistent rather than occasional.
The current indicator will provide an overestimate of the level of consistent
condom use.
Indicator 1.4.3 Number of male/female condoms distributed
Purpose To assess progress in preventing HIV infections
Source Programme Data
Numerator Number of male and female condoms distributed
Denominator N/A
Interpretation This indicator requires that reporting be done separately for male and female
condoms. The indicator can also be used as a proxy measure for condom use.
Programme Area 5: Most-at-Risk Populations (MARPs)
Indicator 1.5.1 Number of most-at-risk populations reached by an HIV prevention
intervention
Purpose To assess progress in implementing basic elements of HIV prevention
programmes for MARPs
Source Behavioural Surveillance or other special surveys
Numerator Number of MARPs respondents who replied “yes” to both (all three for injected
drug users) questions. Questions: 1. Do you know where you can go if you wish
to receive an HIV test? 2. In the last 12 months, have you been given condoms
e.g. through an outreach service, drop in centre or sexual health clinic? 3. For
injecting drug users: In the last 12 months, have you been given sterile needles
and syringes e.g. by an outreach worker, peer educator or from a needle exchange
programme
Denominator Total number of respondents surveyed
Interpretation Accessing and/or surveying MARPs can be challenging. Consequently, data
obtained may not be based on a representative sample of the national most-at-risk
population being surveyed. Such concerns if found should be reflected in the
interpretation of the survey data. Where different sources of data exist, the best
available estimate should be used. Tracking MARPs over time to measure
progress may also be difficult due to mobility and the hard to reach nature of
these populations with many of them being hidden populations. Information
about the nature of the sample should therefore be reported in the narrative to
facilitate interpretation and analysis over time. To maximize the utility of these
data, it is recommended that the sample used for the calculation of this indicator
be used for the calculation of other indicators related to these populations.
Indicator 1.5.2 Percent of female and male sex workers reporting the use of a condom
with their most recent client

47
Purpose To assess progress in preventing exposure to HIV among sex workers through
unprotected sex with clients
Source Behavioural Surveillance Survey for sex workers
Numerator Number of respondents who reported that a condom was used with their last
client
Denominator Number of respondents who reported having commercial sex in the last 12
months
Interpretation Condoms are most effective when their use is consistent rather than occasional.
The current indicator will provide an overestimate of the level of consistent
condom use. The trend in condom use in the most recent sexual act will generally
reflect the trend in consistent condom use. If data available is for less than 12
months, this should be included in the comments section of the reporting tool.
Indicator 1.5.3 Percent of injected drug users reporting the use of a condom the last
time they had sexual intercourse
Purpose To assess progress in preventing sexual transmission of HIV
Source Behavioural Surveillance Survey
Numerator Number of respondents who reported that a condom was used the last time they
had sex
Denominator Number of respondents who report having injected drugs and having had sexual
intercourse in the last month
Interpretation Data obtained may not be based on a representative sample of the national
injecting drug user population being surveyed. This should be reflected in the
interpretation of the survey data.
Indicator 1.5.4 Percent of males reporting the use of a condom the last time they had
anal sex with another man
Purpose To assess progress in preventing exposure to HIV among men who have
unprotected anal sex with a male partner.
Source Behavioural Surveillance Survey
Numerator Number of respondents who reported that a condom was used the last time they
had anal sex
Denominator Number of respondents who reported having had anal sex with a male partner in
the last six months
Interpretation For men who have sex with men, condom use at last anal sex with any partner
gives a good indication of overall levels and trends of protected and unprotected
sex in this population. The indicator does not give any idea of risk behavior in sex
with women among men who have sex with both women and men.
Indicator 1.5.5 Percent of most-at-risk populations who both correctly identify ways of
preventing the sexual transmission of HIV and who reject major
misconceptions about HIV transmission.
Purpose To assess progress in building knowledge of the essential facts about HIV
transmission among MARPs
Source Special behavioural surveys
Numerator Number of most-at-risk population respondents who gave the correct answer to

48
all five questions:
1. Can the risk of HIV transmission be reduced by having sex with only one
uninfected partner who has no other partners?
2. Can a person reduce the risk of getting HIV by using a condom every time
they have sex?
3. Can a healthy looking person have HIV?
4. Can a person get HIV from mosquito bites?
5. Can a person get HIV by sharing food with someone who is infected?
Denominator Number of most-at-risk population respondents who gave answers including
“don‟t know” to all five questions
Interpretation The belief that a health looking person cannot be infected with HIV is a common
misconception that can result in unprotected sexual intercourse with infected
partners. Rejecting major misconceptions about modes of HIV transmission is as
important as correct knowledge of true modes of transmission. The indicator is
useful in countries where knowledge about HIV and AIDS is poor because it
permits easy measurement of incremental improvements over time. Surveying
MARPS can be challenging such that data obtained may not be based on
representative sample. This should come out in the interpretation of data.
Programme Area 6: Behaviour Change (BC)
Indicator 1.6.1 Percent of men and women (15-49) reached through mass media BCC
(by age )
Purpose To assess progress in scaling up the BCC to the communities as prevention a
programme
Source KAP Survey
Numerator Number of people reached through BCC mass media
Denominator Number of people reached through all BCC programmes
Interpretation BCC Media is defined as any effort to effect change through newspapers,
magazines, radio, television etc
Indicator 1.6.2 Number of people reached through community outreach programs
promoting HIV prevention including interpersonal communication
Purpose To assess progress in scaling up the dissemination of BCC messages to the
communities
Source Programme Reports
Numerator Individuals reached
Denominator N/A
Interpretation Community outreach is defined as any effort to effect change that might include
peer education, classroom, small group and/or one-on-one information,
education, communication (IEC) or behavior change communication (BCC) to
promote strategies for prevention of HIV.
Some programs have clear messages designed to reach a specific audience
(i.e., abstinence messages to youth, use of condom, being faithful to one
partner, delay sex debut, promote a HIV test etc,) which are fairly easy to

49
classify in this category. Remember that this may include a combination
of approaches to reach the message to the target population.
Indicator 1.6.3 Percentage of young women and men aged 15-24 who have had sexual
intercourse before the age of 15
Purpose To assess progress in increasing the age at which young women and men aged
15-24 first have sex.
Source Population based surveys-DHS, AIDS Indicator Survey, MIMs
Numerator Number of respondents aged 15-24 who report the age at which they first had
sexual intercourse as under 15 years
Denominator Number of all respondents aged 15-24 years
Interpretation In countries where HIV prevention programmes encourage virginity or delaying
of first sex, young people‟s responses to survey questions on this issue may be
biased, including a deliberate misreporting of age at which they first had sex
Indicator 1.6.4 Number of people who have completed training on the national
community BC course (Love & Respect or comparable).
Purpose To assess progress in increasing the capacity of people as regards BC
Source Programme Data
Numerator Number of people who have completed training on the national community BC
course (Love & Respect)
Denominator N/A
Interpretation This indicator requires reporting on trainings conducted by recognized
institutions in the country
Indicator 1.6.8 Percent of women and men aged 15-49 who have had sexual intercourse
with more than one partner in the last 12 months
Purpose To assess progress in reducing the % of people who have higher-risk sex
Source Population-based surveys (Demographic Health Survey, AIDS Indicator Survey,
Multiple Indicator Monitoring Survey)
Numerator Number of respondents aged 15-49 who have had sexual intercourse with more
than one partner in the last 12 months
Denominator Number of all respondents aged 15-49
Interpretation This indicator gives a picture of levels of higher-risk sex. If people have only one
sexual partner, the change will be captured by changes in this indicator. However,
if people simply decrease the number of sexual partners they have, the indicator
will not reflect a change, even though potentially this may have a significant
impact on the epidemic spread of HIV and may be counted a programme success.
Additional indicators may need to be selected to capture the reduction in multiple
sexual partners in general.
Programme Area 7: YOUTH
Indicator 1.7.1 Percent of young people aged 15-24 who had sex with more than one
partner in the last 12 months

50
Purpose To assess progress in reducing the percentage of young people who have higher-
risk sex
Source Population based surveys (DHS, AIS, MIMS)
Numerator Number of respondents aged 15-24 who had sex with more than one partner in
the last 12 months
Denominator Number of all respondents aged 15-24
Interpretation This indicator gives a picture of levels of higher risk sex. If people have only one
sexual partner, the change will be captured by changes in this indicator. However,
if people simply decrease the number of sexual partners they have, the indicator
will not reflect a change, even though potentially this may have a significant
impact on the epidemic spread of HIV and may be counted a programme success.
Additional indicators may need to be selected to capture the reduction in multiple
sexual partners in general.
Indicator 1.7.2 Number of youth in school exposed to HIV&AIDS education
Purpose To assess progress in increasing knowledge among youth in school on
HIV&AIDS
Source Programme Data
Numerator Number of youth in school exposed
Denominator N/A
Interpretation The indicator provides useful information on trends in the coverage of life skills
based HIV education within schools. Reporting should be based preciously on the
students who would have attended the lessons on HIV and AIDS. Double
reporting should be avoided as much as possible. There should be separate
reports for Secondary and Primary schools
Indicator 1.7.3 Number of youth out-of-school exposed to HIV&AIDS education
Purpose To assess progress in increasing knowledge among youth out of school on
HIV&AIDS
Source Programme Data
Numerator Number of youth out of school exposed
Denominator N/A
Interpretation The indicator provides useful information on trends in the coverage of life skills
based HIV education for youth out of school.Depending on the type of activities,
organizations reporting on this indicator should avoid as much as possible double
reporting.
Indicator 1.7.4 NUMBER OF YOUTH IN TERTIARY INSTITUTIONS EXPOSED TO
HIV&AIDS EDUCATION
Purpose To assess progress in increasing knowledge among youth in tertiary institutions
on HIV&AIDS
Source Programme Data
Numerator Number of youth in tertiary institutions exposed
Denominator N/A
Interpretation The indicator provides useful information on trends in the coverage of life skills

51
based HIV education within tertiary institutions
Indicator 1.7.5 Percent of school teachers trained in life skill-based HIV education.
Purpose To assess progress towards implementation of life skills based HIV education in
all schools
Source Programme Data
Numerator Number of school teachers trained
Denominator Number of school teachers that responded
Interpretation Indicator scores are required for all school teachers combined and for primary
and secondary school teachers separately. The indicator provides useful
information on trends in the coverage of life skills based HIV education within
schools. However, substantial variations in the levels of school enrolment must
be taken into account when interpreting this indicator.
Indicator 1.7.6 Percent of schools that provided life skills-based HIV education in the
last academic year.
Purpose To assess progress towards implementation of life skills based HIV education in
all schools
Source School survey or education programme review
Numerator Number of schools that provided life-skills based HIV education in the last
academic year
Denominator Number of schools surveyed
Interpretation Indicator scores are required for all schools combined and for primary and
secondary schools separately. The indicator provides useful information on trends
in the coverage of life skills based HIV education within schools. However,
substantial variations in the levels of school enrolment must be taken into account
when interpreting this indicator.
Indicator 1.7.7 Percent of young people aged 15-24 who both correctly identify ways of
preventing the sexual transmission of HIV and who reject major
misconceptions about HIV transmission.
Purpose To assess progress towards universal knowledge of the essential facts about HIV
transmission
Source Population-based surveys (Demographic Health Survey, AIDS Indicator Survey,
Multiple Indicator Monitoring Survey)
Numerator Number of respondents aged 15-24 years who gave the correct answer to all five
questions:
6. Can the risk of HIV transmission be reduced by having sex with only one
uninfected partner who has no other partners?
7. Can a person reduce the risk of getting HIV by using a condom every time
they have sex?
8. Can a healthy looking person have HIV?
9. Can a person get HIV from mosquito bites?
10. Can a person get HIV by sharing food with someone who is infected?
Denominator Number of all respondents aged 15-24
Interpretation The belief that a health looking person cannot be infected with HIV is a common

52
misconception that can result in unprotected sexual intercourse with infected
partners. Rejecting major misconceptions about modes of HIV transmission is as
important as correct knowledge of true modes of transmission. The indicator is
useful in countries where knowledge about HIV and AIDS is poor because it
permits easy measurement of incremental improvements over time
Programme Area 8: MALE CIRCUMCISION
Indicator 1.8.1 Percent of men circumcised (15-29)
Purpose To assess progress in the prevention of HIV infections
Source Population based survey-DHS
Numerator Number of men circumcised
Denominator Number of men who responded
Interpretation The indicator gives a picture of the extent to which the male circumcision
programme is faring and how this could be contributing to the reduction of new
infections in the country
Indicator 1.8.2 Percent of men willing to be circumcised (15-29)
Purpose To assess progress in the prevention HIV infections
Source Population based survey-DHS
Numerator Number of men showing willingness
Denominator Number of men who responded
Interpretation The indicator gives a picture of how the male circumcision programme is being
accepted by men and its prospects of reducing of new infections in the country
Indicator 1.8.3 Number of public institutions offering safe MC
Purpose To assess progress in scaling up the provision of safe MC
Source MOHCW Programme Data
Numerator Number of public institutions offering safe MC
Denominator N/A
Interpretation The indicator simply requires reporting on recognized / public institutions
offering safe MC
Indicator 1.8.4 Number of males circumcised (by age)
Purpose To assess progress in preventing HIV infections
Source Programme Data
Numerator Number of males circumcised
Denominator N/A
Interpretation The indicator gives a picture of the extent to which the male circumcision
programme is faring and how this could be contributing to the reduction of new
infections in the country
Programme Area 9: Sexually Transmitted Diseases (STIs)

53
Indicator 1.9.1 Percent of adults (15-49years) that had an STI in the last 12 months
(by age and gender)
Purpose To assess progress in the prevention of HIV infections
Source DHS
Numerator Number of adults that reporting having had STI in the last 12 months
Denominator Number of respondents aged 15-49
Interpretation In order to protect themselves and to prevent infecting others, it is important for
individuals know whether they have not contracted STI after unprotected sex.
Knowledge of one‟s status is also a critical factor in the decision to seek
treatment.
Indicator 1.9.2 Prevalence of STI among sex workers
Purpose To assess progress towards the reduction of new infections
Source DHS
Numerator Number of sex workers that contracted STI
Denominator Number of respondents (sex workers)
Interpretation Surveying sex workers can be challenging. Consequently, data obtained may not
be based on a representative sample of the national population. This should be
reflected in the interpretation of the survey data.
Indicator 1.9.3 Prevalence of syphilis among antenatal care attendees
Purpose To assess progress towards reducing HIV infection
Source ANC Surveillance
Numerator Number of antenatal clinic attendees tested positive for syphilis
Denominator Number of antenatal clinic attendees tested for any disease
Interpretation This indicator (using data from antenatal clinics) gives a fairly good estimate of
relatively recent trends in syphilis.
Programme Area: BLOOD SAFETY
Indicator 1.10.1 Percent of donated blood units screened for HIV
Purpose To assess progress in screening of blood donations
Source NBTS Programme Data
Numerator Number of blood units screened for HIV
Denominator Total number of blood units donated
Interpretation If the blood screening laboratory follows documented and
standardized procedures for the screening of blood, this implies a
certain level of uniformity, reliability and consistency of
performance by staff trained to use the standard operating
procedures
Indicator 1.10.2 Percent of donated blood units tested HIV positive
Purpose To assess progress in screening of blood donations and their status
Source NBTS Programme Data
Numerator Number of blood units tested HIV positive

54
Denominator Total number of blood units tested for HIV
Interpretation If the blood screening laboratory follows documented and
standardized procedures for the screening of blood, this implies a
certain level of uniformity, reliability and consistency of
performance by staff trained to use the standard operating
procedures.
Programme Area 11: INFECTION CONTROL
Indicator 1.11.1 Number of health workers reporting exposure
Purpose To assess progress in the protection of health workers against
infections whilst on duty
Source MOHCW Programme Data
Numerator Number of health workers reporting exposure
Denominator N/A
Interpretation Health workers play an important role in curbing the spread of
infections through the treatment of patients. It is unfortunate that in
the process of doing that, they also become vulnerable and therefore
become a source of the infections. It is therefore important that they
immediately report whenever they are exposed.
Indicator 1.11.2 Number of health workers receiving PEP
Purpose To assess progress in the protection of health workers against
infections whilst on duty
Source MOHCW Programme Data
Numerator Number of health workers receiving PEP
Denominator N/A
Interpretation The indicator requires reporting on whether the health workers are
receiving immediate treatment once they are exposed to infections.
STRATEGIC AREA 2: TREATMENT AND CARE
Programme Area 1: OI/ART
Indicator 2.1.1 Percent of adults and children with advanced HIV infection
receiving Anti-Retroviral drugs (UNGASS 4)
Purpose To assess progress towards providing antiretroviral combination therapy to
all people with advanced HIV infection (adults and children)
Source National ART programme data
Numerator Number of adults and children with advanced HIV infection who are
currently receiving antiretroviral combination therapy. The numerator is
generated by counting the number of adults and children who received
antiretroviral combination therapy at the end of the reporting period.
Denominator Estimated number of adults and children with advanced HIV infection. The
denominator is generated by estimating the number of people with

55
advanced HIV infection requiring (in need of/eligible for) antiretroviral
therapy. The denominator estimate will come from sentinel surveillance
and HIV modelling data such as HIV and AIDS estimates.
Interpretation The indicator will monitor trends in ART coverage without attempting to
distinguish between different forms of antiretroviral therapy, cost, quality
or effectiveness of the treatment provided. The proportion of people
needing antiretroviral therapy differs between adults and children. Access
to antiretroviral therapy will also depend on factors such as cost of drugs
service delivery infrastructure required and availability and uptake of
voluntary counselling and testing services. The indicator should thus be
disaggregated by sex and age (<15, 15+)
Indicator 2.1.3 Number of people (children and adults) receiving ART
through the private sector initiative
Purpose To assess the coverage of antiretroviral combination therapy to people with
advanced HIV infection (adults and children) through the private sector
initiative i.e. to know the number of people accessing ART in the private
sector at any given time
Source Private Sector ART programme data (private health practitioners and
companies)
Numerator Number of adults and children with advanced HIV infection who are
currently receiving antiretroviral combination therapy from the private
sector (private medical practitioners, private medical institutions and
private companies). The number is generated by counting the number of
adults and children who received antiretroviral combination therapy from
this sector at the end of the reporting period.
Denominator Not Applicable
Interpretation The indicator will monitor the numbers accessing ART through the private
sector initiative without attempting to distinguish between different forms
of antiretroviral therapy, cost, quality or effectiveness of the treatment
provided. The proportion of people needing antiretroviral therapy differs by
age and gender because of the financial resources required to access ART
in the private. Women and children do not have equal access to such
financial resources as men. Access to antiretroviral therapy through private
sector also depends on ability to access private service delivery and
voluntary counselling and testing services. The indicator should thus be
disaggregated by sex and age (<15, 15+)
Indicator 2.1.4 Percent of HIV positive incident TB cases that received
treatment for HIV and TB
Purpose To assess progress towards providing antiretroviral combination therapy
and TB treatment to all people with advanced HIV and TB co-infection
(adults and children)
Source National ART programme data
Numerator Number of adults and children with advanced HIV infection who are
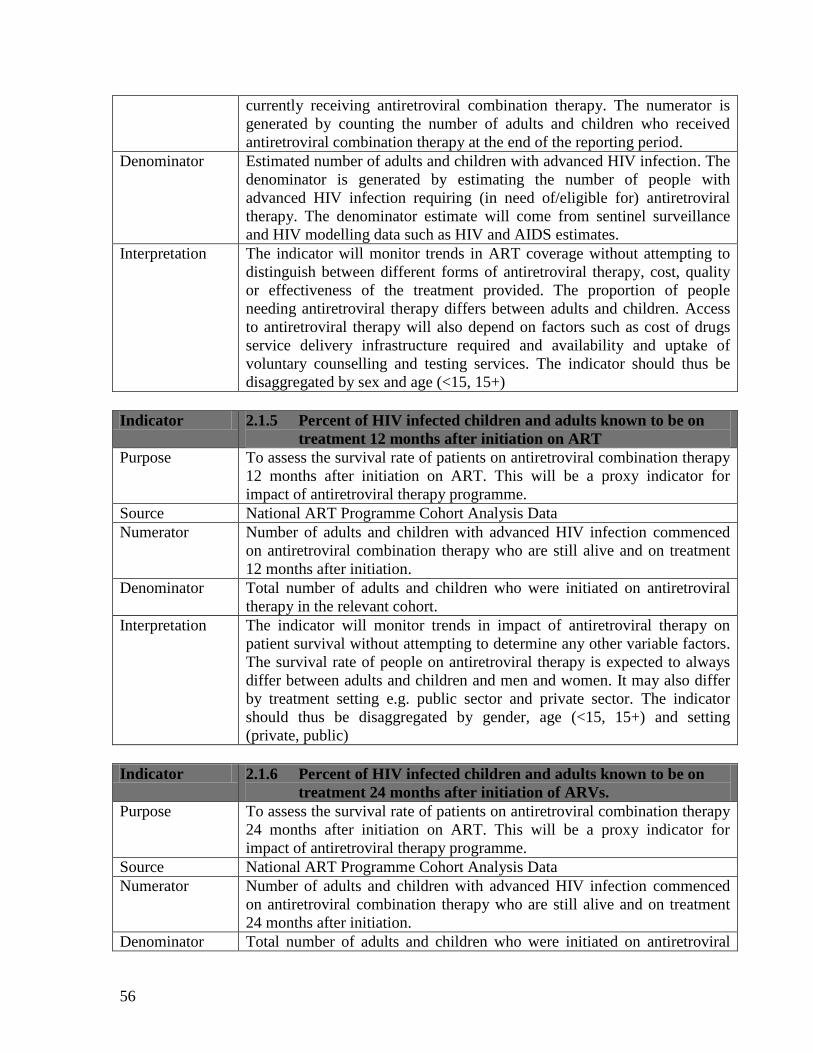
56
currently receiving antiretroviral combination therapy. The numerator is
generated by counting the number of adults and children who received
antiretroviral combination therapy at the end of the reporting period.
Denominator Estimated number of adults and children with advanced HIV infection. The
denominator is generated by estimating the number of people with
advanced HIV infection requiring (in need of/eligible for) antiretroviral
therapy. The denominator estimate will come from sentinel surveillance
and HIV modelling data such as HIV and AIDS estimates.
Interpretation The indicator will monitor trends in ART coverage without attempting to
distinguish between different forms of antiretroviral therapy, cost, quality
or effectiveness of the treatment provided. The proportion of people
needing antiretroviral therapy differs between adults and children. Access
to antiretroviral therapy will also depend on factors such as cost of drugs
service delivery infrastructure required and availability and uptake of
voluntary counselling and testing services. The indicator should thus be
disaggregated by sex and age (<15, 15+)
Indicator 2.1.5 Percent of HIV infected children and adults known to be on
treatment 12 months after initiation on ART
Purpose To assess the survival rate of patients on antiretroviral combination therapy
12 months after initiation on ART. This will be a proxy indicator for
impact of antiretroviral therapy programme.
Source National ART Programme Cohort Analysis Data
Numerator Number of adults and children with advanced HIV infection commenced
on antiretroviral combination therapy who are still alive and on treatment
12 months after initiation.
Denominator Total number of adults and children who were initiated on antiretroviral
therapy in the relevant cohort.
Interpretation The indicator will monitor trends in impact of antiretroviral therapy on
patient survival without attempting to determine any other variable factors.
The survival rate of people on antiretroviral therapy is expected to always
differ between adults and children and men and women. It may also differ
by treatment setting e.g. public sector and private sector. The indicator
should thus be disaggregated by gender, age (<15, 15+) and setting
(private, public)
Indicator 2.1.6 Percent of HIV infected children and adults known to be on
treatment 24 months after initiation of ARVs.
Purpose To assess the survival rate of patients on antiretroviral combination therapy
24 months after initiation on ART. This will be a proxy indicator for
impact of antiretroviral therapy programme.
Source National ART Programme Cohort Analysis Data
Numerator Number of adults and children with advanced HIV infection commenced
on antiretroviral combination therapy who are still alive and on treatment
24 months after initiation.
Denominator Total number of adults and children who were initiated on antiretroviral

57
therapy in the relevant cohort.
Interpretation The indicator will monitor trends in impact of antiretroviral therapy on
patient survival without attempting to determine any other variable factors.
The survival rate of people on antiretroviral therapy is expected to always
differ between adults and children and men and women. It may also differ
by treatment setting e.g. public sector and private sector. The indicator
should thus be disaggregated by gender, age (<15, 15+) and setting
(private, public)
Indicator 2.1.7 Number of HIV-positive persons receiving cotrimoxazole
prophylaxis
Purpose To assess scale-up and coverage of cotrimoxazole prophylaxis to people
with HIV infection (adults and children) by determining the number of
people accessing cotrimoxazole at any given time and to identify gaps in
drug supply to patients.
Source ART Programme Data
Numerator Number of HIV infected adults and children who are currently receiving
cotrimoxazole prophylaxis. The figure is obtained by counting the number
HIV positive persons receiving cotrimoxazole prophylaxis at the end of the
reporting period without cumulating this number.
Denominator Not Applicable
Interpretation The indicator will monitor coverage and need for cotrimoxazole.
Cotrimoxazole prophylaxis reduces the risk of opportunistic infections to
HIV positive children and adults including pregnant women, infected
children and exposed infants. Determining need for cotrimoxazole
prophylaxis will assist in planning for commodity procurement and supply.
The indicator should be disaggregated by sex and age (<15, 15+).
Individuals are considered to be receiving cotrimoxazole if they have been
prescribed and dispensed with the drug.
Indicator 2.1.8 Number of health facilities initiating ART
Purpose To assess progress of decentralisation of ART service provision so as to
determine accessibility of service to the general population
Source National ART Programme Data
Numerator Number of health facilities initiating HIV infected persons on antiretroviral
therapy.
Denominator Not Applicable
Interpretation Accessibility of ART services to people living with HIV is affected by
accessibility to ART initiating facilities. Efforts to decentralise services are
meant to increase access and reduce access costs. The geographical
distribution of sites will also be of interest. The indicator can thus be
disaggregated by province and district.
Indicator 2.1.9 Number of health facilities providing ART follow-up services
Purpose To assess progress of decentralisation of ART service provision so as to
determine accessibility of service to the general population

58
Source National ART Programme Data
Numerator Number of health facilities providing follow-up services to HIV infected
persons on antiretroviral therapy. The figure is obtained by counting the
total number of sites providing follow-up services to ART patients at the
end of the reporting period
Denominator Not Applicable
Interpretation Decentralisation of ART patients to follow-up sites decongests the ART
initiating sites and reduces transport costs for patients to access services. It
has potential to reduce patient defaulting as patients will start to find it
easier to attend their appointments. It will also increase opportunities for
patient follow-up by health providers as distances over which patients have
to followed up will be reduced. The geographical distribution of sites will
be important. The indicator can be disaggregated by province and district.
Indicator 2.1.10. Percent of health facilities dispensing ARVs which have
experienced a stock out of at least one required ARV in the last 12
months.
Purpose To monitor the drug supply and distribution situation in the country
Source National ART Programme Data
Numerator Number of health facilities dispensing ARVs which have experienced a
stock out of at least one required ARV in the last 12 months.
Denominator Total number of health facilities dispensing ARVs in the country during the
reporting period
Interpretation A drug stock out is a situation where a particular drug is out of supply and
patients are not receiving the drug for a week or longer period. Drug
stockout is a contributing programme factor to development of drug
resistance among ART patients and is one of the early warning indicators
monitored in drug resistance monitoring. Occurrence of stockouts may
indicate existence of gaps in drug supply in the country or drug distribution
in the country.
Programme Area 2: Laboratory Services
Indicator 2.2.1 Percent of ART sites with capacity to perform clinical
laboratory tests
Purpose To asses the availability and coverage of clinical laboratory testing services
for ART in the country for ART initiation and patient monitoring. The
indicator will also serve as a proxy measure of ART programme quality of
service monitoring.
Source National ART Programme Data
Numerator Number of ART sites (initiating and follow-up sites combined) providing
clinical laboratory test services to people living with HIV on site.
Denominator Total number of ART sites (initiating and follow-up sites) in the country at
the time of reporting.
Interpretation Country ART programmes are encouraged to provide clinical laboratory
testing services to HIV infected adults and children to determine eligibility

59
for commencement on ART and to monitor effectiveness of treatment or
emergence of complications in treatment. ART follow-up and initiating
sites should therefore have capacity to perform the relevant tests such as
CD4 count, liver function tests, hematology, serology, microbiology,
chemistry tests and others. Capacity is in terms of equipment availability
and functionality and availability of personnel to operate machines as well
as consumables such as reagents. The indicator can be disaggregated by
type of test and type of site (initiating and follow-up site)
Indicator 2.2.2 Percent of laboratories accredited according to national or
international standards
Purpose To measure progress towards attainment of quality standards by
laboratories in the country. The indicator will also be a proxy measure of
the extent of laboratory capacity, quality and sustainability in the country.
Source National ART Programme Data
Numerator Number of laboratories in ART sites (initiating and follow-up) accredited
according to national or international standards
Denominator Total number of laboratories in ART sites (initiating and follow-up sites) in
the country at the time of reporting.
Interpretation Country ART programmes are encouraged to provide clinical laboratory
testing services to HIV infected adults and children to determine eligibility
for commencement on ART and to monitor effectiveness of treatment or
emergence of complications in treatment. ART follow-up and initiating
sites should therefore have capacity to perform the relevant tests such as
CD4 count, liver function tests, hematology, serology, microbiology,
chemistry tests and others. Capacity is in terms of equipment availability
and functionality and availability of personnel to operate machines as well
as consumables such as reagents. The indicator can be disaggregated by
type of test and type of site (initiating and follow-up site)
Programme Area 3: Community and Home Based Care
Indicator 2.3.1 Percent of clients accessing standard CHBC services in the last
12 months (by gender)
Purpose To monitor coverage of standard CHBC services among people infected
and living with HIV and AIDS in the country.
Source CHBC Evaluation
Numerator Number of clients accessing CHBC services who report receiving a
package of services that meets national CHBC standards. This numerator
will be generated by counting the number of individuals who report
receiving CHBC services that meet the national standards from
organisations providing community and home based care services in a
national or population based survey or other equivalent survey
Denominator Number of people living with HIV who report to have been receiving
CHBC services. This denominator will be generated by enumerating of
individuals who are receiving CHBC services from organisations providing

60
community and home based care services in the national or population
based survey or other equivalent survey
Interpretation Individuals infected by HIV come to a point of being affected to require
care from the community or home. This support can be social and clinical.
The social services include psychological, spiritual, preventive and material
assistance. The minimum standard package will include clinical,
psychosocial, and material (food, clothing, shelter and financial as may be
required by patients)
Indicator 2.3.2 Percent of HIV positive clients reporting an improvement in
quality of life following enrollment into an HBC programme
Purpose To assess the impact of HBC on quality of life HIV infected CHBC clients.
Source CHBC Programme Evaluation
Numerator Number of people living with HIV on community and home based care in
the past 12 months whose quality of life improved for instance from being
bed-ridden to home bound or returning to work.
Denominator Number of people living with HIV who report having been on community
and home based care in the past 12 months before the survey
Interpretation The purpose of community and home based care programme is to provide a
continuum of care for chronically ill people including people living with
HIV in their community and home environments. CHBC has also
developed critical linkages with other HIV interventions like antiretroviral
therapy, testing and counselling and care for orphans and vulnerable
children. However, quality of CHBC services is threatened by availability
of resources to caregivers and caregiver motivation. There is always need
to see whether CHBC is making a difference to justify resource
requirements and investment in the intervention. Monitoring the number
moving on the gradation of quality of life will also help in planning for
future burdens. The indicator can disaggregated by gender and age (<15,
15+)
Indicator 2.3.3 Number of HIV positive clients on home based care
Purpose To routinely monitor the coverage of CHBC services among people
infected and living with HIV and AIDS in the country.
Source National Programme Data (NAC)
Numerator Number of clients accessing CHBC services at the reporting period. This
value is generated by counting the number of individuals who are receiving
the CHBC services from organisations providing the community and home
based care services
Denominator Not Applicable
Interpretation Individuals infected by HIV come to a point of being affected to require
care from the community or home. This support can be social and clinical.
The social services include psychological, spiritual, preventive and material
assistance. The minimum standard package will include clinical,
psychosocial, and material (food, clothing, shelter and financial as may be
required by patients)

61
Indicator 2.3.4 Number of caregivers working in the HBC programme
Purpose To assess the caregiver-patient ratio in CHBC
Source Program Data
Numerator Number of secondary caregivers for clients on CHBC who are active in the
programme at the reporting period. This data will be provided by the
organisations supporting CHBC services who will be working with the
caregivers.
Denominator Not Applicable
Interpretation CHBC programmes are affected by numerous factors at caregiver level
including caregiver motivation and fatigue due to burden of patients, lack
of incentives, shortage of caregiver kits and skill gaps. These factors must
be monitored routinely to identify emerging gaps. The issue of male
involvement in care-giving has been of concern for some time and a subject
for advocacy which need continuous monitoring. There is also the
involvement of children in care-giving for their parents and relatives which
occurs whenever there are no community caregivers to take over the
responsibilities. The indicator can hence be disaggregated by gender and
age (<15, 15+).
STRATEGIC AREA 3: MITIGATION AND SUPPORT
Programme Area 1: PLHIV
Indicator 3.1.1 Number of PLHIV receiving standardized food package
Purpose To assess the coverage of food and nutrition assistance among people
living with HIV and AIDS who are in need of food assistance.
Source Program Data (NAC)
Numerator Number of PLHIV who were provided with standardized food package
according to national standards. The data will be collected from
organisations that are supporting people living with HIV by providing food
assistance them. The indicator will be obtained by counting the number that
received food assistance at the end of the reporting period
Denominator Not applicable
Interpretation Food assistance is one of the needs for some of the people living with HIV.
Nutrition is a part of antiretroviral therapy whilst consistent food supply
food is a requirement for people that are on ART. However access to food
assistance may depend on availability and distribution of the food. Need for
food assistance can also vary with season. The data will be disaggregated
by gender and age (15, 15+) to monitor trends in access by each group.

62
Indicator 3.1.2 Number of PLHIV receiving medical assistance
Purpose To assess the access to medical assistance by people living with HIV and
AIDS when needed.
Source Program Data (NAC)
Numerator Number of PLHIV who were provided with medical assistance by
organisations supporting people living with HIV. The data will be collected
from organisations that are supporting people living with HIV. The
indicator will be obtained by counting the number that received food
assistance at the end of the reporting period
Denominator Not applicable
Interpretation Food assistance is one of the needs for some of the people living with HIV.
Nutrition is a part of antiretroviral therapy whilst consistent food supply
food is a requirement for people that are on ART. However access to food
assistance may depend on availability and distribution of the food. Need for
food assistance can also vary with season. The data will be disaggregated
by gender and age (15, 15+) to monitor trends in access by each group.
Indicator 3.1.3 Number of PLHIV receiving psycho-social support
Purpose To assess the coverage of psychosocial support among people living with
HIV and AIDS.
Source Program Data (NAC)
Numerator Number of PLHIV who were provided with psychosocial support. The data
will be collected from organisations that are supporting people living with
HIV by providing psychosocial support them. The indicator will be
obtained by counting the number that received psychosocial support at the
end of the reporting period
Denominator Not applicable
Interpretation Psychosocial support is one of the needs for some of the people living with
HIV. PSS complements counseling and testing and antiretroviral therapy
for those who are on ART. However availability of psychosocial support to
PLHIV may depend on availability of interventions in the community.
Access by the people living with HIV may be affected by low uptake when
beneficiaries are not educated about the benefits and where the
environment is not supportive for open living. Uptake may differ by gender
and age. The data can be disaggregated by gender and age (15, 15+) to
monitor trends in access by each group.
Indicator 3.1.4 Percent of PLHIV participating in (a) coordination structures
(b) programme activities of the response (by age and gender)
Purpose To assess involvement and meaningfulness of involvement of people living
with HIV in HIV and AIDS programmes
Source MIPA Survey
Numerator Number of PLHIV who report participating in coordination structures and
programme activities for HIV and AIDS. The numerator will be obtained
by counting the number that report participation at in least one of the two

63
levels.
Denominator Number of people living with HIV in the country. The denominator will be
obtained from national estimates.
Interpretation The MIPA principle recognizes six hierarchical levels of involvement for
PLHIV which are target audience, contributor, speakers, implementers,
experts and decision-makers. The goal of MIPA is to increase the number
of people living with HIV participating in the response and to raise the
level of participation on the hierarchy of participation. Participation levels
would vary among people of different characteristics; gender, age,
educational level, etc. the indicator can be disaggregated by thee factors.
Indicator 3.1.5 Percent of support groups for people living with HIV with
institutional capacity
Purpose To monitor progress towards institutional capacity development of support
groups for PLHIV.
Source MIPA Survey
Numerator Number of support groups for PHIV that will report having institutional
capacity according to a defined national standard. The numerator will be
obtained by counting the support groups that report having capacity in at
least one of defined areas.
Denominator Number of support groups identified in the survey
Interpretation Support groups are a vehicle for provision of essential services for PLHIV
like psychosocial support and for facilitating meaningful involvement.
Ability of support groups to survive through turbulent times in resource
availability and leadership challenges depends on presence of institutional
capacity.
Indicator 3.1.6 Percentage of men and women expressing specific acceptance
attitudes towards PLHIV
Purpose To assess levels of stigma and discrimination against people living with
HIV in the population
Source Population based survey
Numerator Number of men and women who report an acceptance attitude on all four
of the questions: (a) If a member of your family became sick with the
AIDS virus; would you be willing to care for him or her in your household?
(b) If you knew that a shopkeeper or food seller had the AIDS virus, would
you buy fresh vegetables for him /her?, (c) If a female teacher has the
AIDS virus but is not sick, should she be allowed to continue teaching in
school?, (d) If a member of your family became infected with the AIDS
virus, would you want it to remain a secret?
Denominator All respondents who report having heard about HIV and AIDS before in
the survey
Interpretation Stigma and discrimination are barriers to HIV testing and counseling and
uptake and adherence to ART. Reduction of stigma and discrimination
among men and women by cultivating acceptance attitudes among the

64
people towards people with HIV will also promote open living by HIV
infected persons which is a positive factor in HIV prevention. Attitudes
will vary among men and women and children and adults. The indicator
can be disaggregated by age and gender.
Programme Area 2: OVC
Indicator 3.2.1 Percent of OVC (under 18 years of age) living in households
that have received basic external support in caring for the
child (UNGASS 10)
Purpose To assess progress in providing support to households that are caring
for orphaned and vulnerable children aged 0–17
Source Population-based surveys like ZDHS or MIMS. After all orphaned and
vulnerable children aged 0–17 in the house have been identified, the
household heads are asked four questions about the types and frequency of
support received, and the primary source of the help for each orphaned and
vulnerable child.
Numerator Number of orphaned and vulnerable children who live in households that
received at least one of four types of support: medical, education,
psychosocial and other social or socio-economic support like food,
clothing, shelter, financial or instrumental help like household work,
training for caregivers, childcare, legal service etc.
Denominator Total number of orphaned and vulnerable children aged 0–17, where an
orphan is defined as a child below the age of 18 and has lost one or both
parents and vulnerable child is one that (i) has lost one or both parents; or
(ii) has a chronically ill parent (regardless of whether the parent lives in the
same household as the child); or (iii) lives in a household where, in the last
12 months, at least one adult died and was sick for three of the four months
before he or she died; or (iv) lives in a household where at least one adult
was seriously ill for at least three of the past 12 months.
Interpretation External support is defined as free help coming from a source other than
friends, family or neighbours unless they are working for a community-
based group or organization. The indicator is recommended in all country
settings with high HIV prevalence (5% or greater). It does not measure the
needs of the household or the orphans and vulnerable children. Additional
questions could be asked to measure expressed needs of families caring for
orphans. The indicator implicitly assumes that all households with orphans
and vulnerable children need external support and would overlook the fact
that orphans and vulnerable children have equal need for external support.
Therefore, it is important to disaggregate the information by other markers
of vulnerability such as socioeconomic status of the household, dependency
ratio, head of the household, etc. If sample sizes permit, it may be useful
for programmatic purposes to investigate differences between values for
this indicator for orphans versus other vulnerable children. It may also be –
useful to look at data disaggregated by age and duration of orphanhood, as
both play a key role in determining the type of support needed. For

65
example, an orphan whose parent(s) died 10 years ago will need support of
a different kind from one whose parent(s) died within the past year. When
considering the four types of support separately, data for school-related
assistance should be limited to children aged 5–17.
Indicator 3.2.2 Number of children under 18 that have a chronically ill parent,
live in a household where an adult aged 18-59 died in the past
year or live in a household with an adult aged 15-59 who has
been chronically ill in the past 12 months
Purpose To assess level of vulnerability among children 0-17 years of age
Source Population Based Survey
Numerator Number of children aged 0-17 that are reported having a chronically ill
parent or living in a household where an adult aged 18-59 died in the past
year or live in a household with an adult aged 15-59 who has been
chronically ill in the past 12 months in the survey.
Denominator Not Applicable
Interpretation Death or chronic illness of a parent or adult household member usually
culminates in the eroding of family resources to leave the household unable
to meet the basic needs of children. In the context of HIV and AIDS, this is
a major cause of vulnerability among children aged 0-17.
Indicator 3.2.3 Proportion of OVC aged 15-17 years that had sex before age
15,
Purpose To assess exposure risk to HIV for children through early sexual debut
Source Population Based Survey
Numerator Number of children aged 15-17 years who report having had sex before the
age of 15 years in the survey.
Denominator All children aged 15-17 years of age who respond to the question whether
they had had sex before the age of 15 years
Interpretation Teenage orphans and other vulnerable children are at the risk of engaging
in early sexual activity because of lack of parental guidance and control.
They are also likely to be unable to protect themselves and this exposes
them to HIV. Risk levels may vary among boys and girls and children in
and out of school. The indicator can be disaggregated by gender and school
attendance.
Indicator 3.2.4 Percent of children aged 0-5 years who have birth certificates
Purpose To assess the coverage of birth registration
Source Population Based Survey
Numerator Number of children aged 0-5 reported to have birth certificates in the
household survey
Denominator Number of children aged 0-5 in the population. The denominator will come
from population census on projection based on age distribution from
population based survey
Interpretation Acquisition of birth a certificate is an instrumental right which enables
children to access other rights like education. Orphaned and vulnerable

66
children commonly face problems in acquiring birth certificates in the
absence of adults who can assist them. The indicator can be disaggregated
by gender.
Indicator 3.2.5 Percent of OVC provided with food/nutritional assistance
Purpose To assess coverage of food assistance to orphaned and vulnerable children
Source Programme Data
Numerator Number of OVC reported to have received food assistance by organisations
assisting OVC with food and nutrition. The figure will be obtained by
counting the number of children reported as receiving food assistance at the
reporting period without cumulating number reported monthly
Denominator Estimated number of OVC in the country from national estimates or
population based surveys. The denominator will be used on the assumption
that majority of OVC will require food assistance whenever available.
Interpretation Food assistance is one of the main needs of orphaned and vulnerable
children which mitigation programmes have to target. Availability of food
in communities varies from region to region and seasonally. Access may
also vary by gender. The indicator can be disaggregated by gender and
geographical area. Because of the assumption of generalized need among
all OVC, the indicator should be interpreted against national targets which
will be based on timely needs assessments.
Indicator 3.2.6 Percent of OVC provided with psycho-social support
Purpose To assess the coverage of psychosocial support to orphaned and vulnerable
children especially those who are affected by HIV and AIDS.
Source Program Data (NAC)
Numerator Number of OVC who were provided with psychosocial support. The data
will be collected from organisations that are supporting OVC by providing
psychosocial support to them. The indicator will be obtained by counting
the number that received psychosocial support at the end of the reporting
period
Denominator Estimated number of OVC in the country from national estimates or
population based surveys. The denominator will be used on the assumption
that all OVC require psychosocial support.
Interpretation Psychosocial support is an integral intervention for OVC. PSS
complements efforts to provide material needs, school attendance and
antiretroviral therapy for those who are on ART. Access to PSS by children
may be affected by availability of interventions in the community and low
uptake when communities are not well educated about the importance and
potential benefits of PSS for children. Uptake of PSS by children may
differ by gender and age. The data can be disaggregated by gender and age
(<5, 6-10, 10-15, 15-18) to monitor trends in access by each age group.
Because of the assumption of generalized need among all OVC, the
indicator should be interpreted against national targets which will be based
on timely needs assessments.
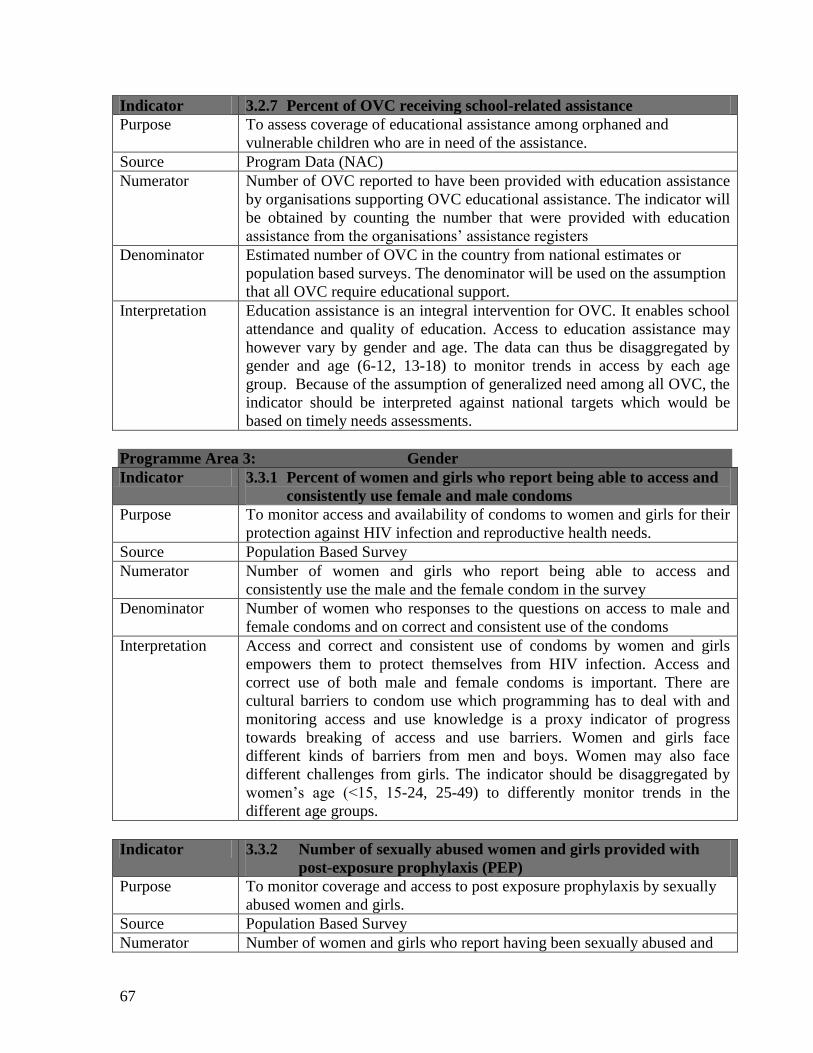
67
Indicator 3.2.7 Percent of OVC receiving school-related assistance
Purpose To assess coverage of educational assistance among orphaned and
vulnerable children who are in need of the assistance.
Source Program Data (NAC)
Numerator Number of OVC reported to have been provided with education assistance
by organisations supporting OVC educational assistance. The indicator will
be obtained by counting the number that were provided with education
assistance from the organisations‟ assistance registers
Denominator Estimated number of OVC in the country from national estimates or
population based surveys. The denominator will be used on the assumption
that all OVC require educational support.
Interpretation Education assistance is an integral intervention for OVC. It enables school
attendance and quality of education. Access to education assistance may
however vary by gender and age. The data can thus be disaggregated by
gender and age (6-12, 13-18) to monitor trends in access by each age
group. Because of the assumption of generalized need among all OVC, the
indicator should be interpreted against national targets which would be
based on timely needs assessments.
Programme Area 3: Gender
Indicator 3.3.1 Percent of women and girls who report being able to access and
consistently use female and male condoms
Purpose To monitor access and availability of condoms to women and girls for their
protection against HIV infection and reproductive health needs.
Source Population Based Survey
Numerator Number of women and girls who report being able to access and
consistently use the male and the female condom in the survey
Denominator Number of women who responses to the questions on access to male and
female condoms and on correct and consistent use of the condoms
Interpretation Access and correct and consistent use of condoms by women and girls
empowers them to protect themselves from HIV infection. Access and
correct use of both male and female condoms is important. There are
cultural barriers to condom use which programming has to deal with and
monitoring access and use knowledge is a proxy indicator of progress
towards breaking of access and use barriers. Women and girls face
different kinds of barriers from men and boys. Women may also face
different challenges from girls. The indicator should be disaggregated by
women‟s age (<15, 15-24, 25-49) to differently monitor trends in the
different age groups.
Indicator 3.3.2 Number of sexually abused women and girls provided with
post-exposure prophylaxis (PEP)
Purpose To monitor coverage and access to post exposure prophylaxis by sexually
abused women and girls.
Source Population Based Survey
Numerator Number of women and girls who report having been sexually abused and

68
received post exposure prophylaxis in the past 12 months in the survey
Denominator Not Applicable
Interpretation HIV-PEP must be part of comprehensive HIV prevention, occupational
health, and post-rape care service policies. Availability of PEP addresses
concerns in multiple program areas. The data collected through this
indicator provides information relevant to prevention, program quality,
gender. The indicator does not intend to capture the type and quality of
PEP services provided. PEP services may include first AID, counselling,
testing, provision of ARVs, medical care, trauma counselling, linkages
with police, and other follow-up and support. Simple monitoring of PEP
availability through program records does not ensure that all PEP-related
services are adequately provided to those who need them. Access to PEP
for sexual violence victims is anticipated to remain low due to presence of
barriers to access and low reporting of sexual violence. Challenges may
also be faced in reporting of this data in the absence of strategies to
mobilize the relevant sources for this data to capture and report the data.
Programme Area 4: Water and Sanitation
Indicator 3.4.1 Percent of PLWHIV that have access to safe water and
sanitation
Purpose To measure how well community-based programs are reaching PLHIV
with a water and sanitation services to protect the health of the infected
persons and reduce the risk for PLHIV to contract water borne diseases and
other diseases transmitted through unsafe sanitary conditions.
Source National Survey
Numerator Number of PLHIV with access to safe water and sanitation
Denominator Number of PLHIV. The denominator will be obtained from national HIV
and AIDS estimates or population based survey for PLHIV.
Interpretation The indicator identifies gaps that may exist in access to water and
sanitation by PLHIV. The information can be used to plan and make
decisions on how PLHIV can be reached or provided with water and
sanitation services. If a small percentage of the PLHIV is being reached,
then it would be recommended that activities be scaled up to improve
reach. If a large percentage is being reached, then programmers would
want to take the lessons learned and replicate the strategy elsewhere. The
data will not reflect the quality of the program unless the survey
specifically collects this data.
STRATEGIC AREA 4: MONITORING AND EVALUATION, RESEARCH AND
SURVEILLANCE
Programme Area 1: Monitoring and Evaluation
Indicator 4.1.1 National M&E calendar developed and implemented
Purpose To monitor the development of a calendar for M&E activities which should
be used to guide planning and implementation of monitoring and

69
evaluation activities
Source National Reports
Numerator National M&E calendar has been developed, is available and is in use
Denominator Not Applicable
Interpretation The development of an M&E calendar facilitates planning and
implementation of M&E activities. The indicator is based on assumption
that once a calendar is developed it will be followed and all planned
activities will be implemented. The indicator does not report on the
accomplishment of each planned activity.
Indicator 4.1.2 Percent of implementers with a designated and functioning
M&E focal person
Purpose To assess progress in development of M&E capacity among implementers
of all categories including health sector, civil society and business sector.
Source Special Survey
Numerator Number of implementers with a designated and functional M&E focal
point. The numerator can be disaggregated by category of implementers
since not all implementers will be expected to progress in designation of
M&E focal points at the same pace.
Denominator Number of implementers identified in each category.
Interpretation The presence of focal points strengthens capacity of implementers to
collect and report on data and also to analyze and utilize the data that they
collect. These are critical requirements of monitoring and evaluation. The
indicator does not measure availability of M&E resources to support the
focal points or skill levels and technical capacity of focal points. It assumes
once present focal points have capacity and support for functionality and
productivity
Indicator 4.1.3 Percent of implementers regularly reporting to the national
M&E system
Purpose To monitor reporting rate so as to validate representativeness and
comprehensiveness of the data collected in the national M&E system
Source NAC Programme Data
Numerator Number of implementers reporting at each reporting period
Denominator Number of implementers registered with the National AIDS Council and
expected to report at the reporting period
Interpretation Reporting rate is important to assess completeness of data. Late and none-
reporting by implementers is a data quality weakness in monitoring and
evaluation. With low reporting rates, the data cannot present national
picture. Programmers would also go without information about the state of
the programmes and achievements in the missing geographical areas. The
indicator does not measure other aspects of data quality like accuracy,
integrity and precision.
Indicator 4.1.4 Number of functional district and provincial M&E task forces
Purpose To monitor the existence and functionality of M&E task forces at sub-

70
national levels in Zimbabwe.
Source NAC Programme Reports
Numerator Number of M&E task forces that held at least one monitoring and
evaluation task force meeting per quarter and has evidence of minutes of
the meeting.
Denominator Not Applicable
Interpretation A defined oversight structure in the form of an M&E task force is
recommended in a multi-sectoral response like the one being implemented
in Zimbabwe. It assists in collective monitoring of the national response
programme, in peer-reviewing of individual implementers and in the
enforcement of policies and strategies. The indicator will monitor
functionality of M&E task forces but will not measure quality of
discussions and deliverables from task forces. It will also not measure
overall capacity of task forces.
Indicator 4.1.5 Number of research projects, special studies and impact
evaluations completed
Purpose To check whether research is going on in the field of HIV and AIDS as
planned on the monitoring and evaluation calendar and M&E action plan
Source NAC programme Reports
Numerator Number of research studies, special studies and evaluations commissioned
in the country which have been completed and have results. The numerator
is obtained by counting the researches that have been completed.
Denominator Not Applicable
Interpretation Research is important. It forms the evaluation component of monitoring
and evaluation. Outcome and impact indicators are collected through
researches and evaluations. The indicator will monitor the implementation
of all research studies, surveillances and evaluations planned for in the
M&E plan. It will measure those that have been completed and not those
that are underway to avoid double counting. The indicator will not measure
the quality of findings and dissemination of the studies. It assumes that
once completed, all studies will be disseminated.
Indicator 4.1.6 Number of M&E feed-back reports disseminated at district,
provincial and national levels
Purpose To assess whether the M&E data being collected is analysed and
disseminated at national and sub-national levels
Source Programme Report
Numerator Number of monitoring and evaluation feedback reports produced and
disseminated at district, provincial and national level. These will be reports
produced by the National AIDS Council on the data collected in the
national M&E system.
Denominator Not Applicable
Interpretation Dissemination of M&E information and reporting back to implementers
from which data is collected is a pre-requisite for M&E. implementers are
able so see the progress made in the response through feedback from M&E.

71
Implementation gaps can also be identified which will inform planning.
Feedback reports should be available to all stakeholders. Facilities such as
website may be used for dissemination in addition to hard copies.
Indicator 4.1.7 Number of implementers with HIV and AIDS policies in place
Purpose To assess progress in the development and implementation of national-level HIV/AIDS policies and strategies
Source Special Survey
Numerator Number of implementers with existing HIV policy or strategy documents
and evidence of implementing the policy or strategy
Denominator Not Applicable
Interpretation It is important for all organisations; public, non-governmental and business
sector to have HIV and AIDS policies or strategic plans which guides their
programmes including workplace programmes. Policies and strategies spell
out the targets to be achieved which monitoring and evaluation will assess.
In counting organisations with policies in place, enumerators must confirm
implementation. However, the indicator will not measure degree of
implementation and quality of programmes deriving from the strategy or
policy.
Indicator 4.1.8 Number of implementers provided with technical support in
monitoring and evaluation
Purpose The intention of the indicator is to monitor extent to which technical capacity is being built among local organizations to collect, analyze, disseminate and use HIV and AIDS data.
Source NAC Programme Reports
Numerator Number of implementers provided with technical support at the end of the
reporting period
Denominator Not Applicable
Interpretation Technical support is intended to assist in capacity development for
monitoring and evaluation among implementers. It should include involve
regular through a combination of strategic approaches including
individualized on-site training and support and training workshops on
standardized curricula. The support may be for data verification and
validation and training on M&E system development, methods and tools
for data collection, data analysis and dissemination and data utilization.
The indicator does not capture the quality of the technical support
provided, nor does it capture changes in the capacity of the
organization/agency in collecting, analyzing, disseminating and using HIV
and AIDS data.
Indicator 4.1.9 Percent of funds allocated to M&E in national HIV and AIDS
programmes (ESP, GF, NATF, NAP for OVC, AIDS & TB)
Purpose To collect data on amounts of funds that are allocated and spent of HIV and
AIDS monitoring and evaluation in the country.

72
Source NASA Survey
Numerator Total amount of funds allocated to M&E in different organisations. This
will be obtained by summing the amounts reported by different
organisations.
Denominator Total amount of funds received or deployed to HIV and AIDS in the
country including what is spend I other programme areas like prevention,
treatment and care, mitigation and coordination or programme management
Interpretation The data must be actual expenditures, not budgets or commitments. They
must include M&E expenditures that were made as part of broader systems
development. For example, expenditures of trainings attended, equipment
donations and capacity building support and supervisory visits. Some
expenditure will require detailed estimation to calculate actual
expenditures, which is provided in NASA. The M&E expenditure might
occur outside the M&E function given the nature of organisational
structures. Assessing M&E expenditure will provide a more detailed
picture of the situation at country level, which is useful for both national
and global decision-making.
Annex II: Work Plan and Budget (attached)