
Monitor Electrical Network with Alarming on Power System ...
14
se.com/ww/ecostruxure-power Monitor Electrical Network with Alarming on Power System Events Electrical Distribution Monitoring & Alarming Extract of the Digital Applications IEC Design Guide for Large Buildings & Critical Facilities 02/2021
Transcript of Monitor Electrical Network with Alarming on Power System ...
se.com/ww/ecostruxure-power
Monitor Electrical Network with Alarming on Power System Events
Electrical Distribution Monitoring & Alarming
Extract of the Digital Applications IEC Design Guide for Large Buildings & Critical Facilities
02/2021
2 Extract of the Digital Applications IEC Design Guide for Large Buildings & Critical Facilities
www.se.comMonitor Electrical Network with Alarming on Power System Events
ELECTRICAL DISTRIBUTION MONITORING & ALARMING
Introduction (1/2)
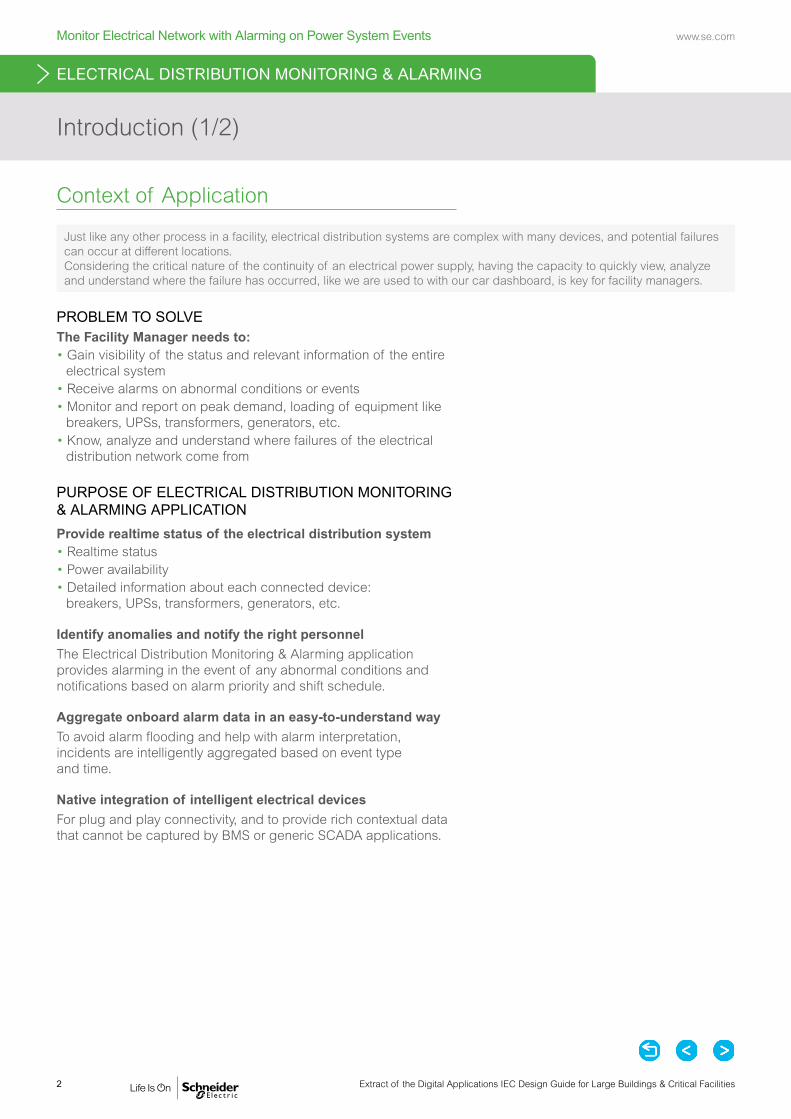
Just like any other process in a facility, electrical distribution systems are complex with many devices, and potential failures can occur at different locations. Considering the critical nature of the continuity of an electrical power supply, having the capacity to quickly view, analyze and understand where the failure has occurred, like we are used to with our car dashboard, is key for facility managers.
PROBLEM TO SOLVEThe Facility Manager needs to:• Gain visibility of the status and relevant information of the entire
electrical system• Receive alarms on abnormal conditions or events• Monitor and report on peak demand, loading of equipment like
breakers, UPSs, transformers, generators, etc.• Know, analyze and understand where failures of the electrical
distribution network come from
PURPOSE OF ELECTRICAL DISTRIBUTION MONITORING & ALARMING APPLICATION
Provide realtime status of the electrical distribution system• Realtime status• Power availability• Detailed information about each connected device:
breakers, UPSs, transformers, generators, etc.
Identify anomalies and notify the right personnelThe Electrical Distribution Monitoring & Alarming application provides alarming in the event of any abnormal conditions and notifications based on alarm priority and shift schedule.
Aggregate onboard alarm data in an easy-to-understand wayTo avoid alarm flooding and help with alarm interpretation, incidents are intelligently aggregated based on event type and time.
Native integration of intelligent electrical devicesFor plug and play connectivity, and to provide rich contextual data that cannot be captured by BMS or generic SCADA applications.
Context of Application
3Extract of the Digital Applications IEC Design Guide for Large Buildings & Critical Facilities
www.se.com Monitor Electrical Network with Alarming on Power System Events
ELECTRICAL DISTRIBUTION MONITORING & ALARMING
Introduction (2/2)
Application OutcomesLive data display• Native support for a wide range of devices and communication
protocols• Electrical network Single-Line Diagram (SLD)• Single-Line Diagram color animation to distinguish energized /
deenergized sections• Elevation drawings• Realtime data values of each connected device, such as
electrical parameters, device settings and status information…
Events & alarms• Chronological display of events and alarms with sorting and
filtering capabilities• Intelligent alarm grouping into summary incidents
Trends• Realtime and historical data can be viewed on a trend viewer
Dashboards• Configurable dashboards for visualizing historical power
system data
Reports• Historical data reporting
Notifications• SMS notifications can be sent for fast analysis and action• Email notifications are also available to send reports and
non-critical information
Analysis Tools Electrical Distribution Monitoring and Alarming provides an incident timeline with advanced functions:• Alarm and event data according to their date and time• Detailed breakdown and sequence of alarms, waveforms
and trends involved in the incident• Disturbance direction detection to indicate upstream /
downstream root cause of an incident
Cloud-Based Analytics & ServicesAs an option, EcoStruxure™ Power Advisor connected service can perform cloud-based analytics for electrical network health, with recommendations from expert service engineers.
BMS IntegrationEcoStruxure Power enables integration of electrical data and alarms at the Edge Control layer with BMS software such as EcoStruxure Building Operation.
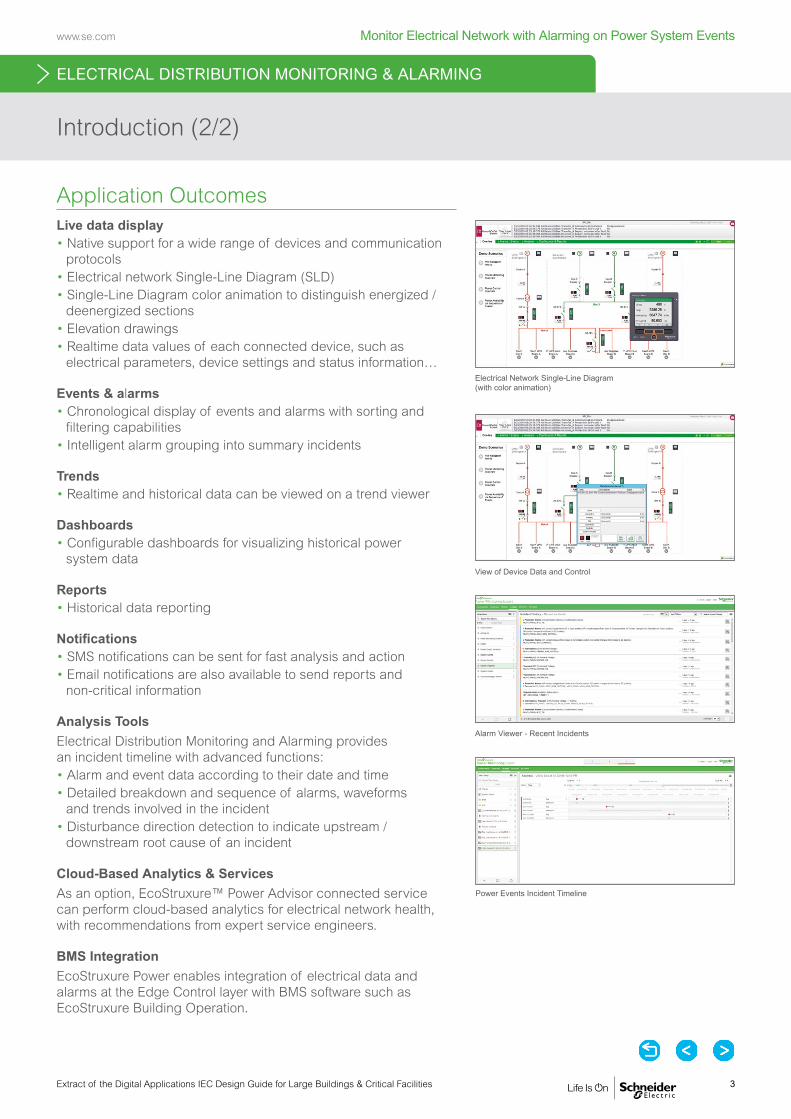
Electrical Network Single-Line Diagram (with color animation)
View of Device Data and Control
Alarm Viewer - Recent Incidents
Power Events Incident Timeline

4 Extract of the Digital Applications IEC Design Guide for Large Buildings & Critical Facilities
www.se.comMonitor Electrical Network with Alarming on Power System Events
Easergy P3
Easergy P5
PowerLogic PM5000
MasterPact MTZ
PowerLogic PowerTag
Easergy T300
Accusine PCS+/PCSn/PFV+
VarSet Smart VarPlus Logic
PowerLogic ION9000
Galaxy VX/VM/VS
PowerLogic PM8000
PowerLogic HDPM6000
Acti9 iEM3000
Acti9 Active
ComPacT NSX & auxiliary contact
ELECTRICAL DISTRIBUTION MONITORING & ALARMING
System Description (1/6)
OUTPUTS
Data Flow
Status information and control actions
Other physical measurements• E.g., environmental conditions
(temperature, humidity)
User input• Alarm recipient information
and schedule
Data recording and timestamping
Time-synchronization
Live data display
Events & alarms
Trends
Dashboards
Reports
Notifications
Analysis tools
Cloud-Based analytics & services
BMS integration
Data processing
The Electrical Distribution Monitoring and Alarming application can be broken down as follows:
INPUTS
Data Flow in Detail
INPUTSThe Electrical Distribution Monitoring & Alarming application collects data from connected products to provide on-site access to consolidated views of electrical measurements, status information and individual device details. It also monitors remote control actions.Electrical measurements and status information can be acquired from:• Power meters (PowerLogic ION9000, PM8000, PM5000,
HDPM6000, PowerTag, Acti9 iEM3000, etc.)• Protection devices such as Easergy P5 or P3, MasterPact MTZ,
ComPacT NSX (including its wireless auxiliary contact), Acti9 Active
• or other equipment such as UPS (Galaxy VX/VM/VS), ATS controller (Easergy T300), Power Correction equipment (AccuSine PCS+/PCSn/PFV+, VarSet Smart with VarPlus Logic controller)
• Other equipment (see comment below)
Comment: EcoStruxure™ Power Monitoring Expert and Power Operation offer native support for a wide range of connected products as well as support for open protocols for communication with third-party equipment.
Electrical measurements
5Extract of the Digital Applications IEC Design Guide for Large Buildings & Critical Facilities
www.se.com Monitor Electrical Network with Alarming on Power System Events
EcoStruxure™ Power Monitoring Expert
EcoStruxure™ Power Operation with Advanced Reporting & Dashboards
System Description (2/6)
Data Flow in Detail (cont.)
INPUTS (cont.)
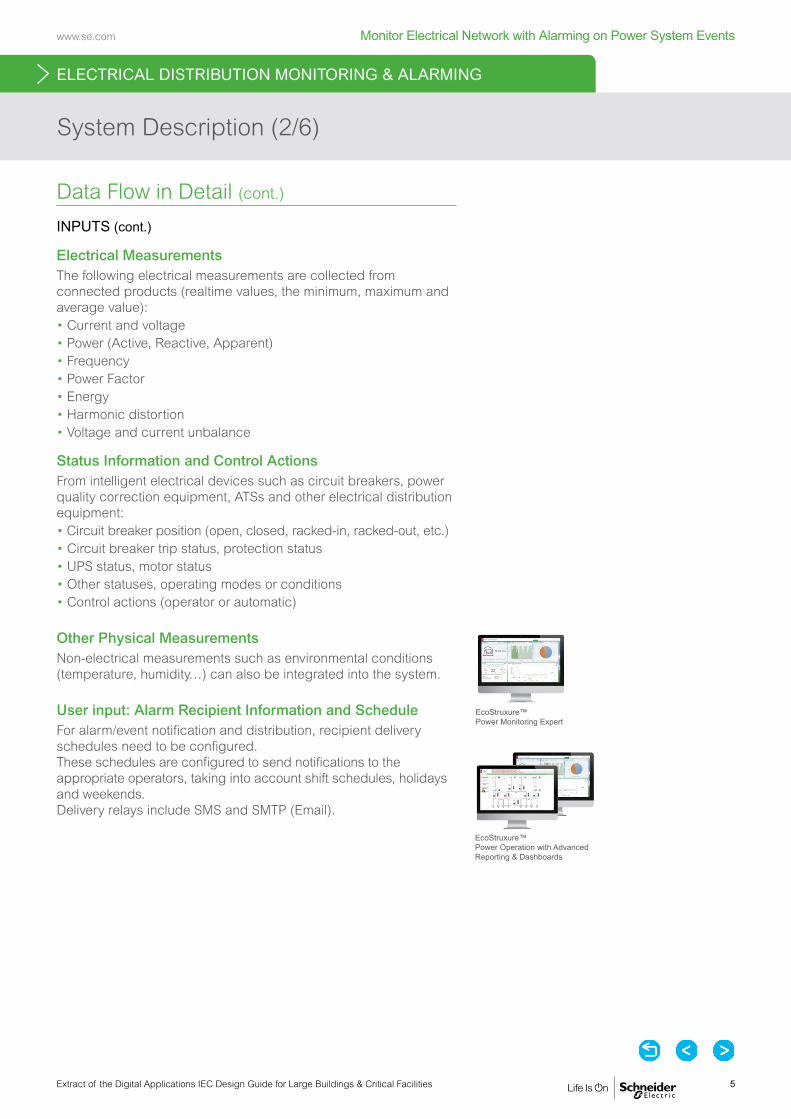
Electrical MeasurementsThe following electrical measurements are collected from connected products (realtime values, the minimum, maximum and average value):• Current and voltage• Power (Active, Reactive, Apparent)• Frequency• Power Factor• Energy• Harmonic distortion• Voltage and current unbalance
Status Information and Control ActionsFrom intelligent electrical devices such as circuit breakers, power quality correction equipment, ATSs and other electrical distribution equipment:• Circuit breaker position (open, closed, racked-in, racked-out, etc.)• Circuit breaker trip status, protection status• UPS status, motor status• Other statuses, operating modes or conditions• Control actions (operator or automatic)
Other Physical MeasurementsNon-electrical measurements such as environmental conditions (temperature, humidity…) can also be integrated into the system.
User input: Alarm Recipient Information and ScheduleFor alarm/event notification and distribution, recipient delivery schedules need to be configured. These schedules are configured to send notifications to the appropriate operators, taking into account shift schedules, holidays and weekends. Delivery relays include SMS and SMTP (Email).
ELECTRICAL DISTRIBUTION MONITORING & ALARMING

6 Extract of the Digital Applications IEC Design Guide for Large Buildings & Critical Facilities
www.se.comMonitor Electrical Network with Alarming on Power System Events
TimeSync Clock
PowerLogic ION9000
PowerLogic PM8000
Easergy P3
MasterPact MTZ
Cyber Sciences SER 3200 / 2408
Easergy P5
ELECTRICAL DISTRIBUTION MONITORING & ALARMING
System Description (3/6)
Data Flow in Detail (cont.)
DATA RECORDING AND TIMESTAMPINGFor the Electrical Distribution Monitoring & Alarming application, data recording can occur at various levels. Connected products, depending on the level of sophistication, can record data as follows:• Analog and event data recorded and timestamped onboard: PowerLogic ION9000,
PM8000 and some PowerLogic PM5000 models (PM53xx and PM55xx)• Event data recorded and timestamped on board: Easergy P5, Easergy P3,
MasterPact MTZ, ComPacT NSX• No onboard recording, realtime data only. Recording and timestamping is done by
a data logger (Cyber Sciences SER 3200/2408) or software (EcoStruxure™ Power Monitoring Expert or Power Operation): entry-level PowerLogic PM5000 models, Acti9 Active, Acti9 iEM3000, PowerTag, UPS, AccuSine PCS+/PCSn/PFV+, VarSet Smart with VarPlus Logic controller and other equipment (including third party)
For the Electrical Distribution Monitoring & Alarming application, a time accuracy of ±10 ms is recommended, in particular for highly critical applications. For less critical applications, 1 s is acceptable.
TIME-SYNCHRONIZATIONFor systemwide electrical distribution monitoring & alarming, it is important to have consistent timestamping. The date and time should be accurately distributed to connected products and other systems.Time-synchronization can be performed through various technologies (PTP, NTP, SNTP etc.). An external master clock is required and may be connected to a GPS antenna to reach the expected time precision.For a comprehensive overview of device recording and timestamping capabilities, refer to our Technical Guide "How to Optimize Time-Synchronization and Data Recording for EcoStruxure™ Power Digital Applications".
DATA PROCESSINGFor the Electrical Distribution Monitoring & Alarming application, data processing is multi-faceted: it includes alarm evaluation, mathematical manipulation, converting status data from devices without onboard logging to alarms and events, etc.Data processing is performed by EcoStruxure™ Power Monitoring Expert or Power Operation, or on board some sophisticated devices.

7Extract of the Digital Applications IEC Design Guide for Large Buildings & Critical Facilities
www.se.com Monitor Electrical Network with Alarming on Power System Events
Animated Single-Line Diagram with dynamic colorization in EcoStruxure™ Power Operation
Device Diagram in EcoStruxure™ Power Monitoring Expert
Alarm Log viewer in EcoStruxure™ Power Monitoring Expert
Events Log viewer in EcoStruxure™ Power Operation
Data Flow in Detail (cont.)
OUTPUTS
Live Data Display
Single-line diagramsThe live status of the electrical distribution can be represented in the Edge Control software (EcoStruxure™ Power Monitoring Expert or Power Operation) in various forms such as:• Digital single-line diagrams, with realtime animation of the status
of the electrical network• Realtime electrical data and equipment status
Detailed Diagrams• Custom data tables• Default device diagrams (pre-configured along with native
device drivers)• Or realtime data in custom graphics (floor plans, elevation
drawings)
Events & Alarms
Event Log ViewersAlarms and events are uploaded from devices or generated by the Edge Control software (EcoStruxure™ Power Monitoring Expert or Power Operation) and displayed in native alarm and event viewers.Chronological views include:• All alarms and events, acknowledged or unacknowledged
alarms, summary alarms or incidents• High speed and high precision sequence of events to quickly
locate the source of a power outage• Traceability of user control actions with operator name and
timestamp
Smart AlarmingAlarm or events can be intelligently grouped to be displayed as incidents and reduce the overall number of alarms in the viewer. Further analysis can be done through drill down into specific events (refer to Power Events Analysis Application in the EcoStruxure Power Design Guide).In EcoStruxure™ Power Monitoring Expert and Power Operation, Smart Alarm categories include:• Asset Monitoring• Power Quality• System health (diagnostics)• Etc.
ELECTRICAL DISTRIBUTION MONITORING & ALARMING
System Description (4/6)

8 Extract of the Digital Applications IEC Design Guide for Large Buildings & Critical Facilities
www.se.comMonitor Electrical Network with Alarming on Power System Events
RealTime trending in EcoStruxure™ Power Monitoring Expert
Load Profile Report
Alarm Notifications
Dashboards
Event History Report
ELECTRICAL DISTRIBUTION MONITORING & ALARMING
Data Flow in Detail (cont.)
OUTPUTS (cont.)
TrendsHistorical and realtime electrical and other measured data can be displayed as trends in Edge Control software. Multiple measurements from selected devices can be viewed with dynamic scaling on a configurable time range. Additionally, target lines can be applied to trended data. Trended data can also be exported in .CSV format.
DashboardsIn addition to specialized dashboards, any historical data from the system can be displayed in graphical dashboard gadgets in EcoStruxure™ Power Monitoring Expert or Power Operation with Advanced Reporting & Dashboards:• Bar chart• Trend chart• Grid (table)• Pie chart• Period over periodAdditionally, information from the web (e.g., weather feed) can be viewed as a dashboard.
ReportsIn addition to specialized reports, numerous general reports are available by default in Power Monitoring Expert or with the Advanced Reporting & Dashboards Module of Power Operation based on historical electrical values or event data. These reports can be generated on-demand or automatically, and sent via e-mail to configured recipients. General Reports include, among others:• Trend / Multiple Trend Report• Single / Multiple Equipment Operation Report• Tabular Report• Load Profile Report• Event History ReportData can also be exported into common file formats such as .CSV to import into other enterprise systems.
NotificationsAlarm notifications available with the optional Event Notification Module for EcoStruxure™ Power Monitoring Expert and Power Operation can be automatically sent via SMS or e-mail to configured recipients on user-defined schedules.Alarm notifications can be configured to delay sending notifications during a user-defined amount of time and send a single notification for multiple events. This prevents ‘flooding’ of notifications.
System Description (5/6)

9Extract of the Digital Applications IEC Design Guide for Large Buildings & Critical Facilities
www.se.com Monitor Electrical Network with Alarming on Power System Events
Power Events Incident Timeline
Waveform Viewer
EcoStruxure™ Power Advisor
EcoStruxure™ Building Operation
Data Flow in Detail (cont.)
OUTPUTS (cont.)
Analysis Tools
Power Events Incident TimelineThis feature of EcoStruxure™ Power Monitoring Expert and Power Operation intelligently groups individual alarms and events as single comprehensive incidents during a given time period. It helps highlight the root cause and the consequences of an incident.For more information, see the Power Events Analysis Application in the EcoStruxure Power Design Guide
Waveform viewerElectrical signal waveforms can be displayed with a native waveform viewer in both EcoStruxure™ Power Monitoring Expert and Power Operation with Advanced Reporting & Dashboards.These viewers allow for the following:• Toggle on/off voltage/current channels• RMS calculation, zoom, pan, export to CSV• Interactive phasor and harmonic (voltage and current) diagrams• Multiple waveforms to be compared to each other
Cloud-Based Analytics & ServicesAs an option, EcoStruxure™ Power Advisor connected service can perform analytics based on historical data to provide insights and decision support. Issues and recommendations are shared with the user by a Schneider Electric service engineer on a periodic basis. Some of these analytics and recommendations include:• Analyze Edge Control historical alarms according to guidelines
in ISA 18.2 / IEC 62682• Identify patterns and recommend actions to remove, repair or
resolve alarms• Analyze and recommend actions for transformer overcapacity• Identify excessive voltage and current harmonics and
recommend mitigation• Measure and recommend improvements of poor power factor
BMS IntegrationEcoStruxure™ Energy Expert, a module of EcoStruxure™ Building Operation, enables realtime and historical electrical data visualization, dashboards and reporting.This integration is done through use of: • an EcoStruxure Web Services (EWS) interface• an Extract, Transform and Load (ETL) utility• an HMTL web page interface
ELECTRICAL DISTRIBUTION MONITORING & ALARMING
System Description (6/6)

10 Extract of the Digital Applications IEC Design Guide for Large Buildings & Critical Facilities
www.se.comMonitor Electrical Network with Alarming on Power System Events
Busway
Main MV switchgear
Utility 1 Utility 2 (Backup)
MV loopswitchgear
MV loopswitchgear
MV loopswitchgear
MV/LVtransformers
Main LVswitchboard
Main LVswitchboard
Main buildingDSB**
Alternate LV sources
switchboard
FinalDSB**
FinalDSB**
FinalDSB**
FinalDSB**
FinalDSB**
FinalDSB**
Criticalloads
Criticalloads
Essentialloads
Essentialloads
Criticalloads
SecondaryDSB**
SecondaryDSB**
Centralized UPS
MV genset switchgear
Noncriticalloads
Noncriticalloads
LVactivefilters
LVcapacitor
banks
SecondaryDSB**
Genset, PV,
wind turbine
FinalDSB**
LocalUPS
MV Loop (optional)
MV
MV/LV
LVMain LV
Secondary LV
Final LV
Loads
ELECTRICAL DISTRIBUTION MONITORING & ALARMING
Electrical Architecture
The following diagram details the areas of the architecture where the connected products should be installed in order to implement the the Electrical Distribution Monitoring & Alarming application:
ION9000 Easergy P5 (or P3)*
Easergy P5 (or P3)*
PM5000PM5000
PM5000
PM5000
PM5000
PM8000
PM8000
and/or
and/or
and/or
or or
or
or or
Galaxy AccuSine PCS+/PCSn/PFV+
Varset Smart capacitor bank with VarPlus Logic controller
* Or legacy offers** DSB = Distribution Switchboard
MasterPact MTZ*
Powertag Rope
PowerTag F160/M250/ M630
PowerTag M63/P63/ F63
iEM3000
Acti9 Active
or
oror
HDPM6000
MasterPact MTZ*
ComPacT NSX & auxiliary contact

11Extract of the Digital Applications IEC Design Guide for Large Buildings & Critical Facilities
www.se.com Monitor Electrical Network with Alarming on Power System Events
Digital Architecture
Apps, Analytics & Services
Edge Control
ConnectedProducts
EcoStruxure™ Power Advisor (Optional)
MasterPact MTZ Circuit breaker
PowerLogic ION9000 Power quality meter
Easergy P5 Protection relay
Wireless & Modbus serial to Modbus TCP gateway
Serial devices
Ethernet devices Other devices
EcoStruxure™ Building devices
EcoStruxure™ Plant devices
Third-party devices
Acti9 iEM3000 Energy meter
PowerLogic Powertag Rope Energy sensor
PowerLogic PM8000 Power meter
PowerLogic Powertag F160 Energy sensor
PowerLogic Powertag M63/P63/F63 Energy sensor
PowerLogic Powertag M250/M630 Energy sensor
Acti9 Active All-in-one final distribution protection device
PowerLogic PM5000 Power meter
PowerLogic PM5000 Power meter
TimeSync Clock
The digital architecture of the Electrical Distribution Monitoring & Alarming application involves collecting the input data from the different products, either directly over Ethernet or via gateways. This data is then used by the Edge Control (EcoStruxure™ Power Monitoring Expert or Power Operation) for on-premise visualization analysis and reporting.Optionally, as part of a connected service, they can be utilized for analytics services with EcoStruxure™ Power Advisor for consultative recommendations from Schneider Electric service engineer.Below is the recommended digital architecture for the Electrical Distribution Monitoring & Alarming application:
Galaxy VX/VM/VS UPS
Acti9 Smartlink modbus Interface
EcoStruxure™ Power Monitoring Expert
OR
EcoStruxure™ Power Operation with Advanced Reporting & Dashboards
EcoStruxure™ Building Operation (Optional)
VarSet Smart VarPlus Logic Power factor correction controller
AccuSine PCS+/PCSn/PFV+ Harmonic Filters
Wireless devices
ELECTRICAL DISTRIBUTION MONITORING & ALARMING
PowerLogic HDPM6000 Multi-circuit power meter
ComPacT NSX/NS wireless auxiliary contact
EcoStruxure Universal Panel Server (Modbus + wireless) Gateway
EcoStruxure Entry Panel Server (wireless only) Gateway
Ethernet - public LAN/WANEthernet - technical LANEWS / ETL / HTMLSerialWireless
ComPacT NSX Circuit breaker

12 Extract of the Digital Applications IEC Design Guide for Large Buildings & Critical Facilities
www.se.comMonitor Electrical Network with Alarming on Power System Events
Useful Documentation
Technical Guides
How to Optimize Time-Synchronization and Data Recording for EcoStruxure™ Power Digital Applications
This technical guide details how to define the digital architecture to implement proper timestamping of the collected data depending on the selected digital applications. It provides a special focus on the various methods used to time synchronize the internal clocks of advanced devices such as power meters, trip units, protective relays, PLCs, UPS controllers, harmonic filters, etc.
Technical Guide Ref: ESXP2TG001EN 11/2019https://www.se.com/ww/en/download/document/ESXP2TG001EN/
How to Improve Building Energy Efficiency with IEC 60364-8-1 and EcoStruxure Power
This document provides information and support with regards to the 2019 update of the IEC 60364-8-1 standard, and explains how EcoStruxure by Schneider Electric can help with compliance. Section 1 introduces the standard and its scope, and describes the methodology to define a building’s energy efficiency class by assessing the rating of all the possible energy efficiency measures. Section 2 provides details about assessing measures, expert advice, and proposes solutions, based on EcoStruxureTM digital applications, to improve the rating for these measures and, as a result, the efficiency class of the building.
Technical Guide Ref: ESXP2TG002EN 04/2020https://www.se.com/ww/en/download/document/ESXP2TG002EN/
Design GuideDigital Applications for Large Buildings and Critical Facilities
The Digital Applications Design Guide provides comprehensive details on the building blocks of EcoStruxure Power: the IoT applications are driven by a software layer to control the traditional electrical distribution infrastructure. Developed to help engineering consultants and designers, this guide is an invaluable resource for specifying, designing and prescribing EcoStruxure Power architectures capable of performing one or more of the business-driven applications described within.
IEC EcoStruxure™ Power Design Guide Ref: ESXP2G001EN 12/2019https://go.schneider-electric.com/WW_202004_Digital-Applications-for-Large-Buildings-and-Critical-Facilities_EA-LP.html
2021 version of this design guide will include the updated application presented in the current paper

The Implementation Arms of EcoStruxure™ all over the World
5-star recognition in CRN’s 2020 Partner Program Guide
Who Are the EcoXperts?An EcoXpert™ is a Schneider Electric partner company that is trained and certified on EcoStruxure™, our open, interoperable, IoT-enabled system architecture and platform.
A worldwide certified network delivering local support More than 4,000 EcoXpert partners in 74 countries
Cross-expertise knowledge11 competency certifications (badges) available, distributed in:• Building & Residential Automation (5 badges)• Power Distribution & Management (5 badges)• Services (1 badge)
Why Call On an EcoXpert Partner?• Reduce the risks and costs of your projects thanks to
segment specialized partners
• Receive lifetime support for your products and projects (design, engineering, installation and maintenance phases)
Discover our EcoXpert program
Find the right partner to support your project
One Program. One Network. Endless Opportunities.
EcoXpert™ Partner Program

02/2021 ESXP2GE001EN, Extract of ESXP2G001EN
©2021 Schneider Electric. All Rights Reserved. Life Is On Schneider Electric is a trademark and the property of Schneider Electric SE, its subsidiaries and affiliated companies. All other trademarks are the property of their respective owners.
This document has no contractual value and Schneider Electric cannot be held liable for its content.
Schneider Electric Industries SAS35, rue Joseph MonierCS 3032392506 Rueil Malmaison CedexFranceRCS Nanterre 954 503 439Share capital 928 298 512 €www.schneider-electric.com
As standards, specifications, and designs change from time to time, please ask for confirmation of the information given in this publication.


![[Cover page]€¦ · digital inputs (DI) provide pulse counting from water, electricity and gas meter, and monitor switch status; relay outputs (RO) react upon alarming conditions.](https://static.fdocuments.net/doc/165x107/604f028f8944650c4d57592b/cover-page-digital-inputs-di-provide-pulse-counting-from-water-electricity.jpg)

