Monday, May 18 Objective: Students will be able to compare linear and exponential growth....
23
-
Upload
marshall-shields -
Category
Documents
-
view
219 -
download
4
Transcript of Monday, May 18 Objective: Students will be able to compare linear and exponential growth....


Monday, May 18
Objective:
Students will be able to compare linear and exponential growth.
Bellringer:
Name 2 limiting factors.

4 MINUTES REMAINING…

Monday, May 18
Objective: Students will be able to
compare linear and exponential growth.
Bellringer: Name 2 limiting factors.

3 MINUTES REMAINING…

Monday, May 18
Objective: Students will be able to
compare linear and exponential growth.
Bellringer: Name 2 limiting factors.

2 MINUTES REMAINING…
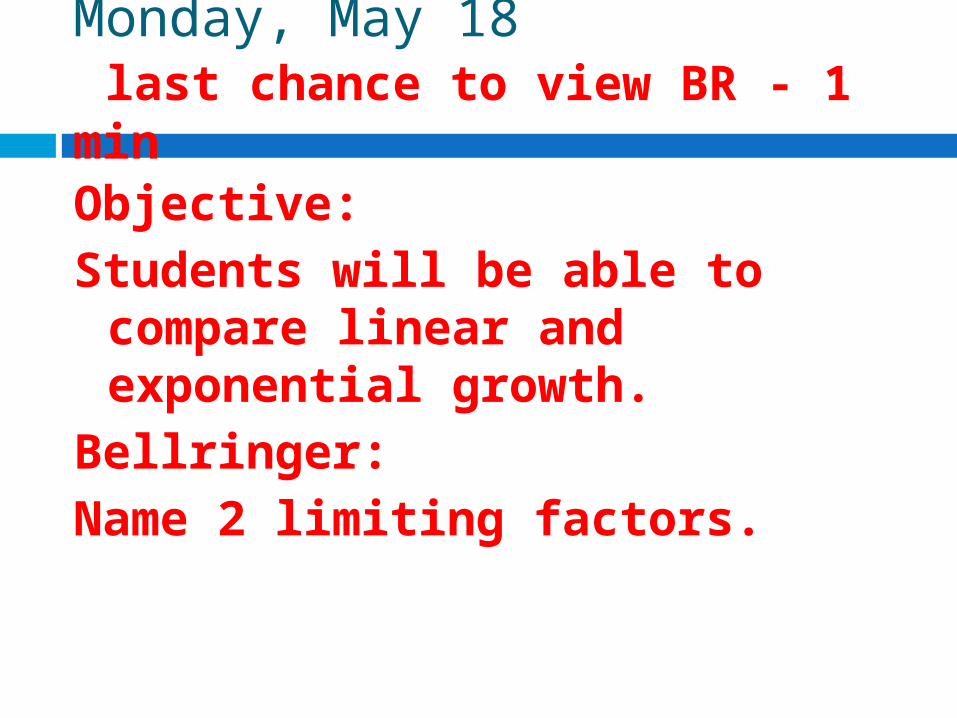
Monday, May 18 last chance to view BR - 1 min
Objective: Students will be able to
compare linear and exponential growth.
Bellringer: Name 2 limiting factors.

30 Seconds Remaining…

10 Seconds Remaining…

TURN IN YOUR BELLRINGER!

May 18, 2009AGENDA:1 – Bellringer
2 – Powerpoint: Population Graphs
3 – Activity: Analyze the graph
HOMEWORK1.Finish graph
analysis (1 Page Minimum)

Linear Graph Example

Exponential Growth
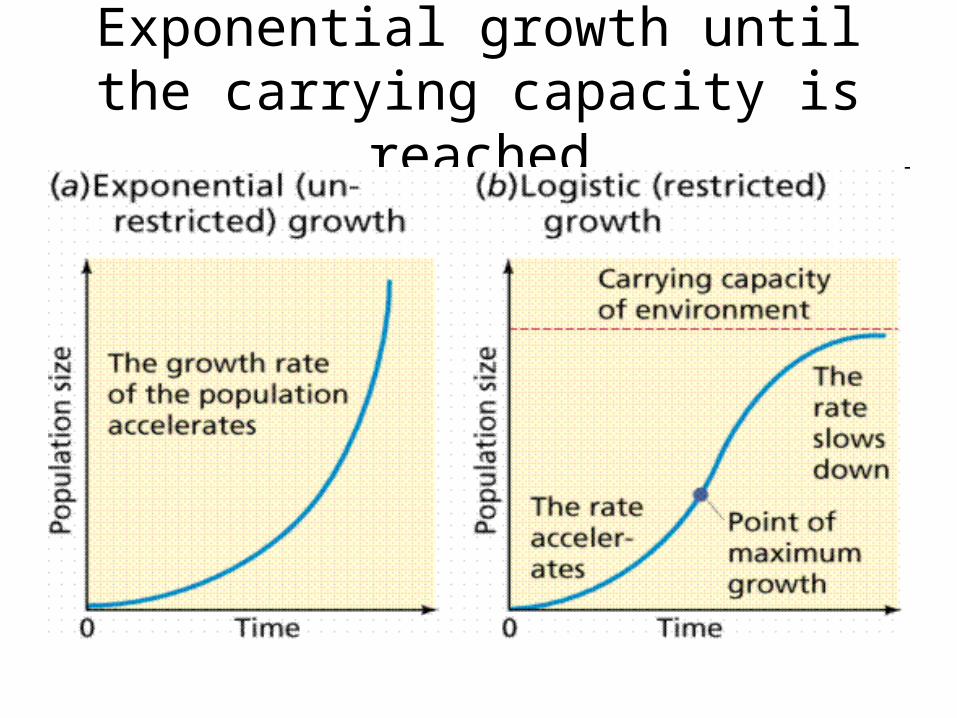
Exponential growth until the carrying capacity is reached

New Vocabulary
• Carrying Capacity
• Density-dependent factor
• Density-independent factor
• Exponential Growth
• Life-history pattern

Carrying Capacity:

Density Dependent vs Density Independent Factors
• Space• Water • Nutrients/food• Shelter• Competition• Predation• Disease• Parasitism
• Natural Disaster• Temperature• Sunlight• Human
Activities• Physical
characteristics• Behaviors
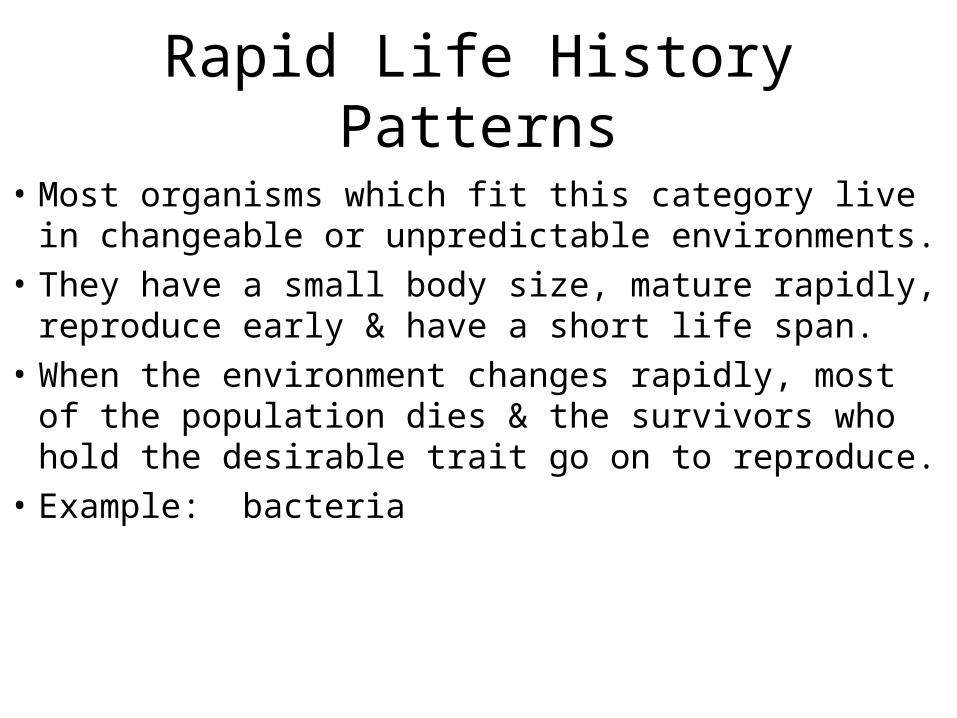
Rapid Life History Patterns
• Most organisms which fit this category live in changeable or unpredictable environments.
• They have a small body size, mature rapidly, reproduce early & have a short life span.
• When the environment changes rapidly, most of the population dies & the survivors who hold the desirable trait go on to reproduce.
• Example: bacteria

Slow Life-History Pattern
• Usually large species that live in more stable environments.
• Example: bears, elephants, etc…

Activity Description (write this down!):
• Analyze graph (look at ALL details)Write 1 page describing1. Pattern of graph (linear, J-curve or S-
curve), organism(s) described, who would find this useful?
2. Separate the factors listed into either density dependent or density independent factors.
3. Summarize the graph in one paragraph.

Activity:

May 18, 2009AGENDA:1 – Bellringer
2 – Powerpoint: Population Graphs
3 – Activity: Analyze the graph
HOMEWORK1.Finish graph
analysis (1 Page Minimum)