Characterisation of Molten Salts for Application in Molten ...
MOLECULAR-DYNAMICS SIMULATIONS OF MOLTEN NI-BASED SUPERALLOYS Christopher Woodward1, James Lill2, Mark Asta3, Dallas R. Trinkle4
1Materials and Manufacturing Directorate, Air Force Research Laboratory, Wright Patterson AFB, OH, 45433-7817, USA
2High Performance Technologies Inc., Wright Patterson AFB, OH, 45433-7817, USA 3Department of Materials Science and Engineering, University of California, Berkeley, CA, 94720, USA
4Department of Materials Science and Engineering, University of Illinois, Urbana-Champaign, Urbana, IL, 61801, USA
Density Functional Theory, Liquid metal, Density, Molar volume, Diffusion
Abstract Fundamental parameters of liquid metal alloys are calculated using a first principles approach, based on Density Functional Theory (DFT), with the goal of informing models of defect formation during solidification processing. Ab-initio molecular dynamic simulations (AIMD) are applied to liquid metal alloys ranging from simple metals to Rene-N4 and CMSX-4 to predict molar volumes (density), diffusion rates and local ordering. These include elemental Ni, Ni-5.4X, Ni-20X, and Ni-10Al-2.8X (X= W, Re, and Ta) (at%) alloys at 1750 and 1830 K. Calculated kinetics and the atomic distribution in the liquids indicate that simulations of 500 atoms run for approximately 7 ps converge the time-averaged properties, including molar volume. Overall diffusion rates and molar volumes are in good agreement with available experimental measurements, though the AIMD predictions appear to systematically underestimate thermal expansion. The method is then used to predict density inversion in three additional alloys, Ni-14Al-3W, CMSX-4 and Rene-N4 for temperatures and compositions expected in the mushy zone during directional solidification. Density inversion is predicted for these three alloys based on density and density contrast in the mushy zone, the prediction and ranking of the effect is consistent with previous studies. Predictions for molar volume are compared with the recent parameterization of molar volumes using extensive measurements of binary alloys. AIMD calculations validate the underlying assumptions of these models and illustrate the bounds in alloy chemistry for applying such techniques.
Introduction With the increasing complexity in alloy chemistry and airfoil geometry over succeeding generations of turbine engines the probability of forming processing defects (freckles) during directional solidification has increased. These calculations offer a new approach for determining the fundamental parameters required for modeling aspects of this processing path. Convective instabilities responsible for freckle defects are produced by variations in liquid-metal density with composition and temperature across the solidification zone. A systems design leading to optimal material and component performance requires a quantitative model for predicting processing regimes for defect free castings over the widest range of refractory metal compositions. Models of thermo-chemical convection in the mushy zone have shown that such instabilities occur when a Rayleigh number exceeds a critical value [1]. The Rayleigh number, R, is a measure of the ratio of the buoyancy force to the retarding frictional force: R=(Δρ/ρ)gKh/αν (1)
Where h is the height of the mushy zone, K is the average permeabihity, g the acceleration of gravity, α is the thermal
diffusivity, ν is the kinematic shear viscosity of the fluid, and Δρ/ρ is the density contrast. The last term is the variation in mass density between the liquid metal near the solid-liquid dendrite interface and the cooler melt at the bottom and sides walls of the mold. Verifying models of freckle formation for a specific alloy system requires accurate values for the parameters that describe this Rayleigh number. Many of these constants, such as the viscosity, permeability and density, are difficult to measure and are not well documented for the superalloys. Recently, Mukai and coworkers have developed a multi-component parameterization for molar volumes [V(c,T)] in superalloys based on extensive experimental measurements of the densities of binary liquid Ni alloys, and a few representative ternaries [2]. The current simulations offer a new way of determining such densities and an independent test of the accuracy of the model for Mukai's parameterization of ρ(c,T). Assuming that other parameters for the Rayleigh criteria are constant across the mushy zone, the signature for freckle formation is reduced to the condition of density inversion. This occurs when the liquid metal at higher temperature has a greater density than at lower temperatures. The density contrast depends on casting temperature gradients as well as the variations in solute concentration produced by the equilibrium partitioning between solid and liquid phases. The more complex alloys, such as Rene-N4 and CMSX4, pose additional challenges for the AIMD simulations. For these alloys it is first necessary to demonstrated that the 500 atom cell AIMD simulations can give precise and reproducible densities for simulations running for less than ~10 ps. The rest of this manuscript is organized in the following manner. First we describe how the AIMD method is applied. This includes details of the electronic structure calculations, molecular dynamics and analysis of the time averaged properties. This is followed by a results and discussion section, where each derived property is reviewed in turn. First the local atomic structure and kinetics found in the simple, binary and ternary Ni alloys are reviewed in order to validate the convergence of the methodology. Next, the predicted molar volumes are considered and compared with available experimental data and parametric fits to experimental data. The last part of this section is where the predictions for density inversion are presented and discussed. Finally the work is reviewed in a brief summary.
Method The properties of molten Ni-based alloys were calculated using ab-initio molecular dynamic simulations. The time evolution was based on inter-atomic forces (i.e. the Hellmann-Feynman forces) computed directly using Density Functional Theory and the commercial software VASP (Vienna ab-initio simulation
537

package) developed at the Institut für Materialphysik of the Univerität Wien) [3]. Ionic positions were evolved in time using classical Nosé-Hoover dynamics for both a fixed-number, volume, and temperature (NVT) and fixed-number, pressure and temperature (NPT) ensembles. A self-consistent charge density is calculated at each time step in order to integrate the ionic trajectories in relatively small simulation cells (500 atoms) with total simulation times ranging from 5-10 ps. Correlation times were found in the range of 40-60 fs, which is taken into account for all reported thermal average quantities and error estimates. For simulations of this size a single k point, at the gamma point, was adequate to perform the reciprocal space integrations. Partial occupancy of the electronic bands was accomplished using Fermi broadening, with an electronic temperature equivalent to that of the ionic system. All calculations used a generalized gradient approximation (PW91) with a plane-wave basis cutoff of 270 eV [4]. Initial calculations on simple, binary and ternary alloys employed ultrasoft pseudopotentials [5,6]. Time steps (∆t) for the MD simulations were chosen at or below ∆t =0.003 ps to reduce possible drift in the conserved energy of the Nosé-Hoover dynamics. Initial configurations for Ni and Ni-Al were taken from snapshots of classical molecular dynamics simulations on classical interatomic potentials [7]. The initial configurations for simulations of other chemistries were obtained by replacing Ni or Al atoms, selected at random, with the correct target atomics species. In this manuscript the number of each atomic species gives the nomenclature for the composition of an AIMD supercell. Thus for a 500 atom cell the composition Ni-20Al (at%) takes the form: Ni400Al100. Initial calculations, designed to sample and test the accuracy of the Mukai parameterization, were performed on Ni, Al, Ni-20X, Ni-5.4X, and Ni-10Al-2.8X (X= W, Re, Ta) alloys (at %) at 1750 and 1830 K. These include alloy chemistries containing refractory metal additions (i.e. Re) where experimental measurements are currently unavailable. The Nosé-Hoover equations of motion were integrated using thermostat temperatures of T=1830 and T=1750 K for compositions including: Al500, Ni500, Ni400Al100, Ni473W27, Ni400W100, Ni473Re27, Ni400Re100, Ni473Ta27, Ni400Ta100, Ni436Al50W14, Ni436Al50Re14 and Ni436Al50Ta14. Three, or more, NVT simulations at each composition and temperature were
performed over a range of volumes within 5% (above and below) the equilibrium volume. Fitting the points to an equation of state yields the equilibrium volume. Further calculations were undertaken to document possible density inversions in Ni-Al-W, Rene-N4 and CMSX4. These calculations pose additional challenges in terms of sampling a sufficiently large configurational space and simulation times to produce a reasonably accurate estimate of the liquid metal densities. To address these issues VASP (4.6.31 and more recently 5.2) was modified to integrate the molecular dynamics equations appropriate for a fixed number, pressure and temperature (nPT) ensemble. This significantly decreases the computational effort required to calculate equilibrium volumes, liquid metal diffusion rates and viscosities. Also, these calculations employed Projected Augmented Wave pseudopotentials in order to obtain a more accurate representation of the complex chemistries found in the superalloys [6,8]. In order to explore the accuracy and reproducibility of AIMD predictions on more complex alloys, a preliminary set of calculations were run on two representative compositions of Rene-N4.
Results and Discussion The AIMD calculations yield a variety of time-averaged quantities that provide insights to the kinetics, ordering and density in the melt. The first quantity can be used to show that the simulations are of long enough duration to produce significant interdiffusion, so that the calculated thermal averages are not biased by the choice of the initial atomic configuration. Further, in order to produce a statistically realistic liquid the cell volume must be large enough so that atomic correlations decay sufficiently over the scale of the simulation cell. These convergence conditions are considered first, before reviewing the AIMD predictions for liquid metal density. Local Ordering The radial distribution function, gαβ(r), for each pair of species (α,β) in pure Ni and binary Ni400X100 (X=Al, W, and Re) melts are shown in Figure 1. The distribution functions converge to the uncorrelated limit (e.g. unity) in less then half the diagonal distance across the simulation cell. This illustrates that the
Figure 1. Radial distribution functions for Ni and Ni-20X (X=Al, W, Re) alloys at 1830 K for the lowest pressure NVT simulations at these
chemistries. From left to right, the three plots show solvent-solvent (Ni-Ni), solvent-solute (Ni-X), and solute-solute (X-X) pairs.
538
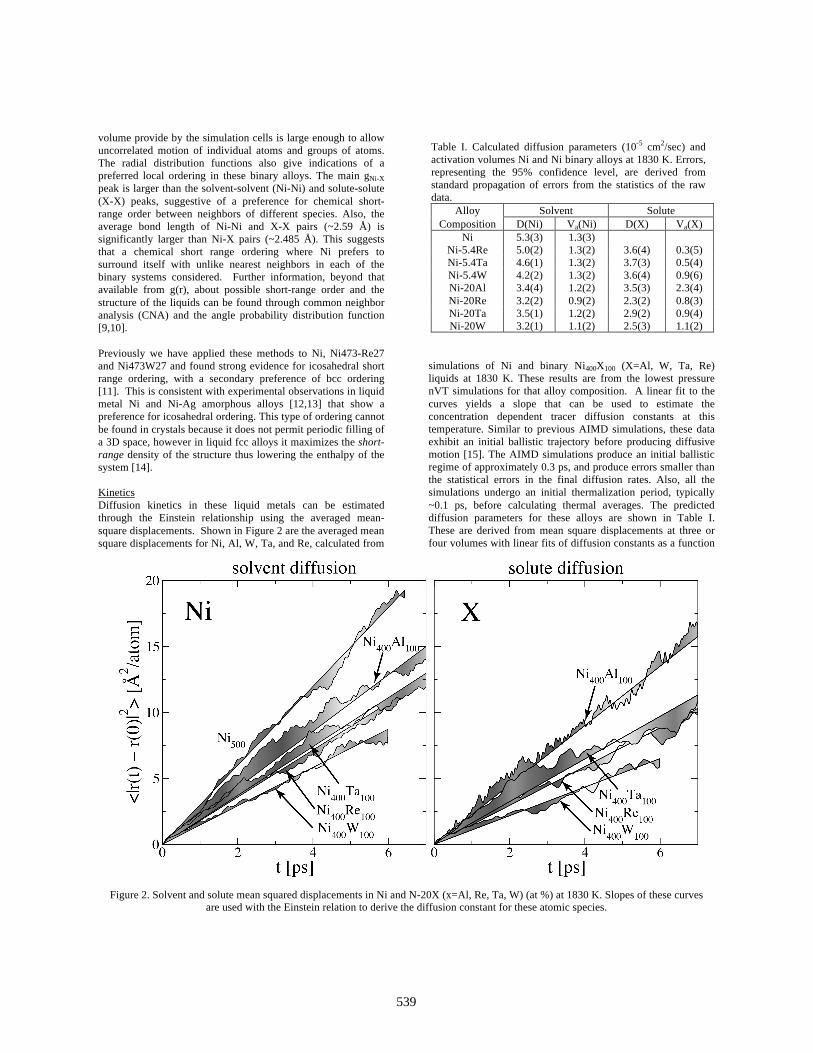
volume provide by the simulation cells is large enough to allow uncorrelated motion of individual atoms and groups of atoms. The radial distribution functions also give indications of a preferred local ordering in these binary alloys. The main gNi-X peak is larger than the solvent-solvent (Ni-Ni) and solute-solute (X-X) peaks, suggestive of a preference for chemical short-range order between neighbors of different species. Also, the average bond length of Ni-Ni and X-X pairs (~2.59 Å) is significantly larger than Ni-X pairs (~2.485 Å). This suggests that a chemical short range ordering where Ni prefers to surround itself with unlike nearest neighbors in each of the binary systems considered. Further information, beyond that available from g(r), about possible short-range order and the structure of the liquids can be found through common neighbor analysis (CNA) and the angle probability distribution function [9,10]. Previously we have applied these methods to Ni, Ni473-Re27 and Ni473W27 and found strong evidence for icosahedral short range ordering, with a secondary preference of bcc ordering [11]. This is consistent with experimental observations in liquid metal Ni and Ni-Ag amorphous alloys [12,13] that show a preference for icosahedral ordering. This type of ordering cannot be found in crystals because it does not permit periodic filling of a 3D space, however in liquid fcc alloys it maximizes the short-range density of the structure thus lowering the enthalpy of the system [14]. Kinetics Diffusion kinetics in these liquid metals can be estimated through the Einstein relationship using the averaged mean-square displacements. Shown in Figure 2 are the averaged mean square displacements for Ni, Al, W, Ta, and Re, calculated from
simulations of Ni and binary Ni400X100 (X=Al, W, Ta, Re) liquids at 1830 K. These results are from the lowest pressure nVT simulations for that alloy composition. A linear fit to the curves yields a slope that can be used to estimate the concentration dependent tracer diffusion constants at this temperature. Similar to previous AIMD simulations, these data exhibit an initial ballistic trajectory before producing diffusive motion [15]. The AIMD simulations produce an initial ballistic regime of approximately 0.3 ps, and produce errors smaller than the statistical errors in the final diffusion rates. Also, all the simulations undergo an initial thermalization period, typically ~0.1 ps, before calculating thermal averages. The predicted diffusion parameters for these alloys are shown in Table I. These are derived from mean square displacements at three or four volumes with linear fits of diffusion constants as a function
Figure 2. Solvent and solute mean squared displacements in Ni and N-20X (x=Al, Re, Ta, W) (at %) at 1830 K. Slopes of these curves are used with the Einstein relation to derive the diffusion constant for these atomic species.
Table I. Calculated diffusion parameters (10-5 cm2/sec) and activation volumes Ni and Ni binary alloys at 1830 K. Errors, representing the 95% confidence level, are derived from standard propagation of errors from the statistics of the raw data.
Alloy Solvent Solute Composition D(Ni) Va(Ni) D(X) Va(X)
Ni 5.3(3) 1.3(3) Ni-5.4Re 5.0(2) 1.3(2) 3.6(4) 0.3(5) Ni-5.4Ta 4.6(1) 1.3(2) 3.7(3) 0.5(4) Ni-5.4W 4.2(2) 1.3(2) 3.6(4) 0.9(6) Ni-20Al 3.4(4) 1.2(2) 3.5(3) 2.3(4) Ni-20Re 3.2(2) 0.9(2) 2.3(2) 0.8(3) Ni-20Ta 3.5(1) 1.2(2) 2.9(2) 0.9(4) Ni-20W 3.2(1) 1.1(2) 2.5(3) 1.1(2)
539

of volume to derive the zero pressure diffusion rates. Slopes of these curves are also used to derive the activation volume at the equilibrium volume using the definition: Va=-kBTd(lnD)/dP (2) Diffusion results for Ni are in good agreement with previous AIMD simulations of Jask and co-workers who reported self diffusion of 4.4X10⁻⁵ cm2/sec at 1850 K [16]. Current results predict Re and Ta as the slowest solute diffusion species, a result consistent with their atomic mass and size. Ni diffusion is slower in the binary melts, an effect that increases with solute concentration. From this limited data this effect appears roughly linear with solute concentration, even though the average atomic volume is increasing. This is consistent with strong solvent-solute interactions, as found in the previous section. Due to the lack of radio isotopes for Ni classical measurements of self-diffusion are problematic. However there have been some recent inelastic neutron scattering experiments on Al rich Ni-Al melts. Using these methods for alloys at 1995 K Chathoth and coworkers measured the self-diffusion of Ni at 3.8X10⁻⁵ cm2/sec and for Ni-25Al (at%) a self-diffusion of 3.9X10⁻⁵ cm2/sec [17, 18]. This is in excellent agreement with our calculated values for Ni self-diffusion for simple metal Ni and Ni-20Al at 1830 K, 5.3(3)X10-5 cm2/sec and 3.4(4)X10-5 cm2/sec respectively. Also there are some limited solute tracer diffusion measurements in Ni-2W (at%), which observed a diffusion coefficient of 2.4(2) X10-5 cm2/sec for W in the temperature range of 1755-2022 K [18]. Again this is in good agreement with our results for Ni-5.4W (at%) at 1830 K where we find solute diffusion rate of 3.6(4) X10-5 cm2/sec. The good statistics for the diffusion constants, and Figure 2, illustrate that significant interdiffusion in occurring over the timescales of these molecular dynamic simulations. These results show that AIMD simulations run for approximately 7 ps have evolved over a sufficiently long period of time to produce reasonable estimates of the equilibrium molar volumes. Molar Volumes in Ni, binary and ternary alloys: Initial analysis of the molar volumes centers on documenting the accuracy and precision of the AIMD method as applied to simple, binary and ternary Ni alloy liquid-metal-densities. With this established, attention then turned to predicting density inversion in ternary and Ni-base alloys. The first nVT dynamics calculations of molar volumes focused on simple metal, binary and ternary Ni alloys. Here a series of constant volume calculations were used to find the pressure as a function of volume. The time average pressures were then fit to a second order polynomial to derive an equation of state. The equation of state yields the equilibrium volume (V0), bulk modulus [B=-V0(dP/dV)], and its pressure derivative. Table II shows the predicted molar volumes, with expected error, with the corresponding parametric result from Mukai and coworkers, produced from fits to experimental measurement [2]. Errors are estimated using standard error propagation and correlation times
of 50 fs [19]. A more detailed description of this analysis, numerical results for B, and B’, and how these results can be used to estimate other quantities can be found in the literature [11]. The calculated molar volumes are in good agreement sessile drop experiments, for elemental Ni at these temperatures the error is 1.6% and 0.8% for 1750 K and 1830 K, respectively [2]. When the (modified) sessile drop and (modified) pycnometric measurements of Mukai and coworkers are used to interpolate densities for Ni-19.7Al and Ni-5.83W (at. %) we find average errors in the AIMD results to be below 1.8%. There are also several other recent measurements of liquid Ni alloy densities. For example, Feng et al. measured the density of elemental Ni and dilute solutions of W in Ni using a sessile drop method [20]. The AIMD predictions are within 1.4% of these elemental Ni results. Since Ni at these temperatures is chemically reactive it is also worth considering non-contact methods, where the liquid metal is not in contact with a physical plate or containment vessel. One such noncontact technique, developed by Plevachuk and co-workers, uses electromagnetic levitation and optical dilatometry to measure the high temperature liquid metal densities [21]. The AIMD predictions for Ni-25Al are within 0.6% of values measured using these methods. In order to illustrate the trend in the molar volume data the AIMD and Mukai results are plotted in Figure 3. For compositions inside the range of Mukai's experimental database the agreement between the two methods is within 2%, as indicated by the dotted lines. However, when the model needs to extrapolate to the AIMD sampled compositions errors can be quite large (i.e. Ni400W100, Ni473Ta27, and Ni400Re100). Also for the case of Ni400Ta100, not shown in Fig. 3, the Mukai parameterization diverges from the AIMD result by at least 7 cm3/mole. There is also a systematic increase in the difference between the fitted and AIMD results with decreasing temperature; this is an indication that the two methods produce different coefficients of thermal expansion.
Table II. Calculated atomic volumes (cm3/mole) from current AIMD simulations and the Mukai parameterization based on extensive experiments on binary alloys [2]. T=1750 K T=1830 K Composition AIMD Mukai AIMD Mukai Al 12.80(2) 12.91(3) Ni 7.57(1) 7.460 7.62(1) 7.572 Ni-‐20Al 7.88(1) 7.763 7.94(1) 7.849 N-‐5.4W 7.66(1) 7.553 7.70(1) 7.652 Ni-‐20W 7.94(1) 6.519 7.98(1) 7.329 Ni-‐5.4Re 7.65(1) 7.494 7.69(1) 7.650 Ni-‐20Re 7.91(1) 7.587 7.93(1) 7.859 Ni-‐5.4Ta 7.70(1) 7.331 7.75(1) 7.505 Ni-‐20Ta 8.14(1) --- 8.18(1) --- Ni-‐10Al-‐2.8W 7.77(1) 7.692 7.80(1) 7.766 Ni-‐10Al-‐2.8Re 7.75(1) 7.629 7.80(1) 7.751 Ni-‐10Al-‐2.8Ta 7.79(1) 7.691 7.80(1) 7.751
540

Figure 3. Comparison of molar volumes calculated with AIMD simulations and estimated using the Mukai parameterization [2]. Data in perfect agreement would fall on the line representing a slope of one, the dashed line indicates where the two results differ by 2%.
The outliers are compositions that fall outside the composition ranges included in the fit of the Mukai model.
The ternary alloy compositions, in table II, were chosen in part to assess the accuracy of interpolating the molar volumes in complex alloys based on measured values in binary alloys. For example the Mukai parameterization implicitly assumes that the complex alloy molar volume can be approximated by the sum of partial molar volumes of non-interacting chemical species. Figure 4 illustrates a path in the ternary triangle using the available compositions in table II. The ternary alloys, Ni436Al50X14, can be expressed as the average of the molar volumes fro Ni400Al100 and Ni473X27, where X= W, Re, or Ta. Deviations from linearity, in Figure 4, would indicate a breakdown in the assumption of expressing the complex molar volume as a linear combination of binary molar volumes. Only in the case of Ni473Ta27, using the Mukai parameterization is the deviation from linearity significant (~3%). This is most likely a reflection of forcing the method to extrapolate the molar volume outside of the range of reference binary compositions (e.g extrapolation). In most cases the deviation from linearity is less than 0.4% using the Mukai model validating the underlying assumptions. The temperature dependence of the molar volumes can be calculated from the AIMD results in several ways. Liquid density measurements in these alloys show linear temperature dependence, so finite difference should be a reasonable approximation. An alternative method that uses the liquid bulk modulus and the ensemble averaged pressure is reviewed in the literature [11]. Figure 5 shows representative AIMD predications for the thermal expansion coefficient in Ni and Ni-5.4W (at%) for the temperature range 1750-1950 K. Here both NVT and NPT dynamics were used to assess the molar volume
as a function of temperature yielding volumetric expansion coefficients of 8.5X10⁻⁵K-1 and 6.7X10⁻⁵K-1 for Ni-5.4W and Ni respectively. Comparing directly to the work of Mukai we find that the AIMD predictions are consistently lower than the sessile drop and pycnometric measurements. For the alloys shown in Table II agreement is at best within a factor of two. A wider variety of methods have been used to measure β in Ni, producing results ranging from 1.0-1.5X10⁻⁴ K-1 [22, 23]. Most of these techniques are contact methods, using a plate or accurately machined crucible. In sessile drop experiments a drop of liquid metal is in contact with a solid surface and the shape of the drop is used to estimate the liquid metal density. Other methods may be preferred for the Ni alloys, where surface tension may be influenced by possible liquid contamination from the substrate or crucible. One earlier study, based on gamma ray attenuation, sidesteps possible bias in the surface tension and found a coefficient of thermal expansion for elemental liquid Ni of 9.42X10⁻⁵ K−1 [24]. The only noncontact method density measurement technique that has been applied to the Ni alloys is the very recent work of Plevachuk et al. where using electromagnetic levitation and optical dilatometry they find a coefficient of thermal expansion of 1.2X10⁻⁴ K−1 for Ni–25Al (at.%) [22]. Mukai’s most recent work in Ni–Al alloys, using a modified sessile drop method, estimates β of this alloy to be 1.3X 10⁴ K−1 [25]. In general the AIMD results are in better agreement with experiments that avoid possible bias in surface tension produced by chemical contamination from a crucible or substrate. These include the gamma ray attenuation and electromagnetic levitation/optical dilatometry techniques. However, even these show the AIMD computational method
541

Figure 4. Comparison of molar volumes at 1750 K for Ni-Al-X (X=W, Re, and Ta) in the ternary triangle. With the exception of Ni473Ta27, deviations from linearity for most of the AIMD and Mukai [2] results are less than 0.8 and 0.4% respectively.
Figure 5. Variation in molar volume with temperature for
elemental Ni and Ni473W27 calculated using both nVT and nPT dynamics. The predicted coefficient of thermal expansion, β, is
shown for both alloys.
underestimates liquid metal coefficient of thermal expansion by approximately 25% for elemental Ni. Calculations for Density Inversion Three alloys are considered for possible density inversion, Ni-Al-W, CMSX-4, and Rene-N4. For the more complicated alloys it is first necessary to demonstrated that the 500 atom cell AIMD simulations can give accurate and reproducible densities for simulations running for less than ~10 ps. To demonstrate this four instantiations of Rene-N4, based on different random initial atomic distributions, were run at the solidus and liquidus temperatures for compositions determined from the Scheil solidification path, estimated using CalPhad (Pandat®) methods. The predicted compositions are Ni62.2-Cr11.0-Co5.2Mo1.3-W1.9-Al10.-Ti5.8-Ta2.3-Nb0.5 and Ni63.0-Cr11.2-Co7.6-Mo0.9-W1.9-Al9.2-Ti4.3-Ta1.6-Nb0.3 at 1,635K and 1,582K respectively. The very dilute Nb additions were removed from the calculations with the balance in composition being spread proportionally overall the remaining species yielding the 500 atom cell compositions: Ni315Cr56Co38Mo5W10Al46Ti22Ta8 and Ni312Cr55Co26Mo6W10Al50Ti29Ta12 for 1,635K and 1,582K respectively. These chemistries were then used to construct 500 atom cells with random distributions of the appropriate elements. The different instantiations at each temperature were run in order to assess the influence of configurational entropy on the molar volume or alloy density. After 8 ps the derived time averaged densities of the four cases at each temperature were found to be within statistical error, illustrating the efficacy of this approach. For this range of compositions and temperatures we conclude that a random configuration is a reasonable approximation of the melt and will give reproducible liquid metal densities. For the model Ni-Al-W alloy we adopted a nominal composition of Ni-14Al-3W (at%) and evaluated the equilibrium liquid
compositions and temperatures for 0.5 and 1.0 liquid fraction (wt%) using the Scheil model. This alloy was chosen because it has been demonstrated to produce freckle defects in conventional Bridgeman directional solidification. The predicted liquid compositions at 1711 and 1720 K are shown in Table III. The AIMD calculations predict a 2% increase in the density going from 1,711 to 1,720K, reflecting a relatively strong density inversion. The Scheil model predicts a change in composition that favors an increase in density at the higher temperature. However for this system there is a decrease in the molar volume with increasing temperature, from 7.782(5) to 7.767(8) cm3/mole, so density inversion is predicted even when the increase in elemental mass is not taken into account. When applied to this model alloy, the Mukai parameterization produces a large density inversion at these temperatures and chemistries (Table III). The estimated molar volumes are 7.7367 and 7.7302 for 1711 and 1720 K respectively, which in consistent with a small density inversion based on just volumetric effects within the Mukai parameterization. Temperatures and compositions were also assessed from Sheil calculations for 0.6 and 1.0 liquid fraction (wt%) for Rene-N4 and CMSX-4. Compositions for these temperatures and alloys
Table III. Predicted liquid metal densities for the Ni-Al-W model system. Here fL is the fraction liquid (wt%) and the numbers in parenthesis indicate the 95% confidence level in the last digit.
Composition Density (g/cm3) fL T (K) Atomic (/500) AIMD Mukai
1.0 1720 Ni415Al70W15 7.46(2) 7.5040 0.5 1711 Ni410Al78W12 7.29(1) 7.3352
542

Table IV. The compositions used in the AIMD calculations for Rene-N4 and CMSX-4 at 0.6 and 1.0 liquid fraction (wt%). Both the atomic percent and the number of atoms in the simulation cell are given for each atomic species.
Alloy Liquid fraction Conc. Ni Co Cr Mo W Re Al Ta Ti
at% 62.5 7.2 11.3 1.0 1.7 0.0 9.4 2.0 4.9 0.6 fL T=1604 K # 312 36 57 5 8 0 47 10 25
at% 63.3 7.5 11.2 0.9 1.9 0.0 9.2 1.6 4.3 Rene-N4 1 fL T=1622 K # 316 37 56 5 10 0 46 8 22
at% 63.2 8.8 7.7 0.4 1.8 0.7 13.2 2.8 1.4 0.6 fL T=1635 K # 316 44 38 2 9 4 66 14 7
at% 63.8 9.3 7.6 0.4 2.0 1.0 12.6 2.2 1.3 CMSX-4 1 fL T=1654 K # 319 46 38 2 10 5 63 11 6
are shown in Table IV. Results for all these calculations are shown in Figure 6. AIMD predictions for both Rene-N4 and CMSX-4 suggest density inversions under these conditions, though they are smaller than that seen in Ni-Al-W. Note that two instantiations were run for each temperature-compositions for these superalloys. Also, the increase in density for CMSX-4 is approaching the statistical error of the predictions. The Mukai parameterization does not predict a density inversion for CMSX-4 these compositions and temperatures. However, the DFT predictions and the Mukai parameterization for the Ni-Al-W alloys are very similar in both absolute size and in the degree of density inversion. Finally, both methods predict a density inversion for Rene-N4 at these temperatures and compositions. For Rene-N4 the molar volume also reflects a density inversion for both the AIMD and Mukai parameterization. Given the different results for CMSX-4, and the shallow gradient found in the AIMD calculations for this alloy, further calculations were undertaken to better describe the change in density in the mushy zone. A series of calculations were
performed for liquid volume fractions ranging from the expected liquidus and solidus. These results, shown in Figure 7, illustrate the expected trends in liquid metal density during solidification. The additional data points suggest that within statistical error CMSX-4 is predicted to sample density inversion between 0.4 and 1.0 liquid fraction in the melt. The other two alloys also shown in Figure 7 to illustrate the relative strength of the density inversion. Finally, as shown in Eq. 1, another measure of the influence of the density inversion is the density contrast over the mushy zone. This is the dimensionless quantity Δρ/ρ which we define as (ρ0 -ρ(h))/ρ0, where ρ0 is the density at the liquidus and ρ(h) is the density at a specific height in the mushy zone. In this case we use the values of the density at 0.6 liquid fraction (wt%) for ρ(h). Results for the three alloys are shown in Table V. While the AIMD predictions for the density contrast of CMSX-4 have the opposite sign of the Mukai predictions (consistent with a density inversion) the rank ordering of density contrast is consistent between the two methods. Also, it is worth noting that the rank ordering of the density contrast is in agreement with the predictions of Reed and coworkers, based on
Figure 6. Density as a function of temperature for Ni-Al-W, Rene-N4 and CMSX-4 for 0.6 and 1.0 liquid fraction (wt%).
Figure 7. Calculated liquid metal densities for CMSX-4, Rene-N4 and a model Ni-Al-W alloy for a range of liquid fraction (wt%).
543

ThermoCalc predictions (for chemistry) across the height of the mushy zone [26].
Summary AIMD simulations have been performed to derive the time-averaged properties of liquid metals for alloys ranging from simple metals to Ni-based superalloys such as Rene-N4 and CMSX-4. For the simpler alloys diffusion rates are in good agreement with available experimental measurements, and the radial distribution functions show signs of short range ordering consistent with Ni being surrounded by unlike neighbors. Results show that the AIMD method is sampling an adequate volume and time domain. Predicted molar volumes for elemental, binary and ternary Ni alloys are typically within ~2% of measured values and but underestimate the coefficients of thermal expansion as compared to experimental measurements using contact methods. The calculations confirm the assumption that the molar volumes of complex alloys can be described using a linear combination of results from simpler binary alloys. Densities of three freckle prone alloys, Ni-Al-W, Rene-N4 and CMSX-4, were studied for compositions and temperatures expected in the mushy zone. Calculations for the model ternary Ni-Al-W alloy predict a 2% density inversion, consistent with convective instabilities that produce freckle defects. Simulations of reference Rene-N4 alloys, based on random distributions of atomic species, were used to illustrate the precision and reproducibility of molar volume predictions using a 500 atom cell. Calculations for Rene-N4 and CMSX-4 also produce density inversions, though smaller than that found for the model Ni-Al-W alloy. The Mukai parameterization produced the same ranking in terms of the size of density contrast for these three alloys. However, CMSX-4 is not predicted to have a density inversion in contrast with the AIMD results. Overall, these results suggest that even for highly complex chemistries moderately sized AIMD simulations can produce reliable results. With proper validation this approach could be used to assess convection instabilities in a wide range of materials. Similar methods can be used to predict other parameters used in the Rayleigh-number criteria, such as the shear viscosity, that are difficult to measure and are not well known for complex alloys.
Acknowledgements This research was supported in part by a grant of computer time from the DoD High Performance Computing Modernization Program at the Air Force Research Laboratory DoD Supercomputing Research Center AFRL-DSRC. MA and DRT were supported in part with a grant from the Air Force Office of Scientific Research under the Materials Engineering for Affordable New Systems (MEANS-II) program. The authors gratefully acknowledge insightful discussions with T. Pollock, P. Voorhees, J. Miller, O. Senkov, and S.H. Davis, and the
technical assistance provided by S. Kajihara at the AFRL-DSRC.
References
[1] C. Beckermann, J.P. Gu, and W.J. Boettinger, “Development
of a freckle predictor via Rayleigh number method for single-crystal Nickel-base superalloy castings”, Met. Trans. A, 31A (2000) 2545.
[2] K. Mukai, Z.S. Li, and K.C. Mills, “Prediction of the
densities of liquid Ni-based superalloys”, Met. Mater. Trans. B, 36 (2005) 255.
[3] G. Kresse, and J. Hafner, “Efficiency of ab-initio total
energy calculations for metals and semiconductors using a plane-wave basis set”, Phys. Rev. B, 49 (1994) 14251; Kresse, G. and J. Furthmüller, J. Computat. Mater. Sci., 6 (1996) 15.
[4] J. P. Perdew and Y. Wang, “Accurate and simple analytic
representation of the electron-gas correlation energy”, Phys. Rev. B, 45 (1992) 13244.
[5] D. Vanderbilt, “Soft self-consistent pseudopotentials in a
generalized eigenvalue formalism”, Phys. Rev. B, 41 (1990) 7892.
[6] G. Kresse and D. Joubert, “From ultrasoft pseudopotentials
to the projector augmented-wave method”, Phys. Rev. B 59 (1999) 1758.
[7] M. Asta, D. Morgan, J. J. Hoyt, B. Sadigh, J. D. Altho , D.
de Fontaine, and S. M. Foiles, “Embedded-atom-method study of structural, thermodynamic, and atomic-transport properties of liquid Ni-Al alloys”, Phys. Rev. B, 59 (1999) 14271.
[8] P.E. Blochl, “Projector augmented-wave method”, Phys.
Rev. B, 50 (1994) 17953. [9] S. K. Das, J. Horbach, M. M. Koza, S. M. Chatoth, and A.
Meyer, “Influence of chemical short-range order on atomic diffusion in Al-Ni melts”, Appl. Phys. Lett., 86 (2005) 011918.
[10] L. Rosso, P. Minary, Z. Zhu, and M.E. Tuckerman, “On the
use of the adiabatic molecular dynamics technique in the calculation of free energy profiles”, J. Chem. Phys., 116 (2002) 4389.
[11] C. Woodward, M. Asta, D.R. Trinkle, J. Lill, and S.
Angioletti-Uberti, “Ab-initio simulations of molten Ni alloys”, J. App. Phys., 107 (2010), 113522.
[12] G. W. Lee, A. K. Gangopadhyay, K. F. Kelton, R. W.
Hyers, T. J. Rathz, J. R. Rogers, and D. S. Robinson, “Difference in icosahedral short-range order in early and late transition metal liquids”, Phys. Rev. Lett., 93 (2004) 037802.
Table V. Predicted density contrast (Δρ/ρ), based on the liquidus and 0.6 liquid fraction (wt%) densities.
Method CMSX-4 Rene-N4 Ni-Al-W AIMD 0.00373 0.01085 0.02355
Mukai [2] -0.00245 0.00609 0.02251
544
[13] W. K. Luo, H. W. Sheng, F. M. Alamgir, J. M. Bai, J. H. He, and E. Ma, “Icosahedral short-range order in amorphous alloys”, Phys. Rev. Lett., 92 (2004) 145502.
[14] F. Frank, “Supercooling of Liquids”, Proc. R. Soc. London,
Ser., A215 (1952) 43. . [15] X. Han, M. Chen, and Y. Lü, “A molecular dynamics study
for the thermphysical properties of liquid Ti-Al alloys”, Int. J. Thermophys., 29 (2008) 1408.
[16] N. Jakse, J. F. Wax, and A. Pasturel, “Transport properties
of liquid nickel near the melting point: an ab-initio molecular dynamics study”, J. Chem. Phys., 126 (2007) 234508.
[17] S. M. Chathoth, A. Meyer, M. M. Koza, and F. Juranyi,
“Atomic diffusion in liquid Ni, NiP, PdNiP, and PdNiCuP alloys”, Appl. Phys. Lett., 85 (2004) 4881.
[18] J. P. Leonard, T. J. Renk, M. O. Thompson, and M. J. Aziz,
“Solute diffusion in liquid nickel measured by pulsed ion beam melting”, Metall. Mater.Trans. A, 35 (2004) 2803.
[19] M.P Allen and D. J. Tildesley, “Computer Simulation of
Liquids”, (Oxford Science Publications, Clarendon Press, Oxford UK 1987).
[20] X. Feng, Y. Ren-Hui, F. Liang, L. Lan-Xiao, and Z. Hong-
Kai, “Densities of molten Ni-(Cr, Co, W) superalloys”, Trans Nonferrous Met. Soc. China, 18 (2008) 24.
[21] Y. Plevachuk, I. Egry, J. Brillo, D. Holland-Moritz, and I.
Kaban, “Density and atomic volume in liquid Al-Fe and Al-Ni binary alloys”, Int. J. Mater. Res., 98 (2007) 107.
[22] T. Iida and R. Guthrie, “The Physical Properties of Liquid
Metals”, (Clarendon Press, Oxford UK, 1988). [23] A. F. Crawley, “Densities of liquid metals and alloys”, Int.
Metall. Rev., 19 (1974) 32. [24] W. D. Drotning, in Thermal Expansion 7, edited by D. C.
Larson, (Plenum, New York, 1988) , 17–28. [25] L. Fang, S. F. Zhang, F. Xiao, R. H. Yang, and K. Mukai,
“Measurement and analysis of liquid density of Ni-Al binary alloys”, J. Alloys Compd. 493 (2010) 465.
[26] R.C. Reed, T. Tao, and N. Warnken, “Alloys by design:
Application to nickel-based single crystal superalloys”, Acta Mat., 57, (2009) 5898 -5913.
545