Molecular Biology-Based Analysis of the Interactive E ect ...
32
sustainability Article Molecular Biology-Based Analysis of the Interactive Effect of Nickel and Xanthates on Soil Bacterial Community Diversity and Structure Prudence Bararunyeretse 1,2, *, Yan Zhang 1 and Hongbing Ji 1, * 1 Beijing Key Laboratory of Resource-oriented Treatment of Industrial Pollution, School of Energy and Environmental Engineering, University of Science and Technology Beijing, 30 Xueyuan Road, Beijing 100083, China 2 Biology Department, Faculty of Sciences, University of Burundi, Bujumbura 1550, Burundi * Correspondence: [email protected] (P.B.); [email protected] (H.J.) Received: 20 May 2019; Accepted: 24 June 2019; Published: 17 July 2019 Abstract: Metals and mineral flotation collector’s toxicity to the soil living system greatly compromise the sustainability of mining and ore processing. Their effects on the soil microbial community, the most active soil component, remain less understood and addressed particularly with regards to xanthates and their combination with metals. This study analyzed the interactive effects of Ni and xanthates, potassium ethyl xanthate and sodium isopropyl xanthate, on the soil bacterial community through an efficient molecular biology-based technique, the Miseq (Illumina). Both soil microbial community diversity and structure were more affected by xanthates than by Ni. The five most dominant phyla, representing 96.31% of the whole bacterial community, comprised Proteobacteria (54.16%), Firmicutes (17.51%), Actinobacteria (15.59%), Acidobacteria (4.87%), and Chloroflexi (4.16%). Different soil treatments exhibited greater difference in the species abundance/dominance than in the species numbers. Proteobacteria was the most dominant in the presence of xanthates, individually or in mixtures with nickel, while Firmicutes exhibited its highest proportion in the Ni/xanthate-treated samples. The most abundant and proportionally different bacterial species between different treatments were presented. The most abundant bacterial strains identified should be explored more for their potential application in biomining and for the prediction and biologically-based treatment and remediation of Ni and xanthate-contaminated systems. Keywords: mining; xanthates; nickel; soil bacteria; interactive effect; molecular technique 1. Introduction Wastes discharged from mining and ore processing contain various pollutants, including heavy metals (e.g., nickel) and flotation reagents (e.g., xanthates). The associated soil contamination has become of great ecological and health concern [1], compromising the sustainability of these activities. Soil microorganisms could be the most affected organisms as they constitute the most active soil component [2], which mediates about 80–90% of the various biochemical processes within the soil [2,3], including soil formation and aggregation [3,4], soil decontamination, detoxification and restoration [1], soil organic matter decomposition, soil nutrient cycling, etc. [5]. In addition to Ni mining and processing which are the main anthropogenic sources of Ni pollution, Ni is released into the environment from various anthropogenic sources, including transportation, oil combustion, and municipal and industrial wastes [6]. High Ni concentrations in the soil, more than 300 μg·g -1 soil [6–8], were reported in the soils from various sites, including rural areas of various countries. This is well above the permissible limit (less than 50 μg·g -1 soil for agricultural and Sustainability 2019, 11, 3888; doi:10.3390/su11143888 www.mdpi.com/journal/sustainability
Transcript of Molecular Biology-Based Analysis of the Interactive E ect ...

sustainability
Article
Molecular Biology-Based Analysis of the InteractiveEffect of Nickel and Xanthates on Soil BacterialCommunity Diversity and Structure
Prudence Bararunyeretse 1,2,*, Yan Zhang 1 and Hongbing Ji 1,*1 Beijing Key Laboratory of Resource-oriented Treatment of Industrial Pollution, School of Energy and
Environmental Engineering, University of Science and Technology Beijing, 30 Xueyuan Road,Beijing 100083, China
2 Biology Department, Faculty of Sciences, University of Burundi, Bujumbura 1550, Burundi* Correspondence: [email protected] (P.B.); [email protected] (H.J.)
Received: 20 May 2019; Accepted: 24 June 2019; Published: 17 July 2019�����������������
Abstract: Metals and mineral flotation collector’s toxicity to the soil living system greatly compromisethe sustainability of mining and ore processing. Their effects on the soil microbial community,the most active soil component, remain less understood and addressed particularly with regards toxanthates and their combination with metals. This study analyzed the interactive effects of Ni andxanthates, potassium ethyl xanthate and sodium isopropyl xanthate, on the soil bacterial communitythrough an efficient molecular biology-based technique, the Miseq (Illumina). Both soil microbialcommunity diversity and structure were more affected by xanthates than by Ni. The five mostdominant phyla, representing 96.31% of the whole bacterial community, comprised Proteobacteria(54.16%), Firmicutes (17.51%), Actinobacteria (15.59%), Acidobacteria (4.87%), and Chloroflexi (4.16%).Different soil treatments exhibited greater difference in the species abundance/dominance than in thespecies numbers. Proteobacteria was the most dominant in the presence of xanthates, individually orin mixtures with nickel, while Firmicutes exhibited its highest proportion in the Ni/xanthate-treatedsamples. The most abundant and proportionally different bacterial species between differenttreatments were presented. The most abundant bacterial strains identified should be explored morefor their potential application in biomining and for the prediction and biologically-based treatmentand remediation of Ni and xanthate-contaminated systems.
Keywords: mining; xanthates; nickel; soil bacteria; interactive effect; molecular technique
1. Introduction
Wastes discharged from mining and ore processing contain various pollutants, including heavymetals (e.g., nickel) and flotation reagents (e.g., xanthates). The associated soil contamination hasbecome of great ecological and health concern [1], compromising the sustainability of these activities.Soil microorganisms could be the most affected organisms as they constitute the most active soilcomponent [2], which mediates about 80–90% of the various biochemical processes within the soil [2,3],including soil formation and aggregation [3,4], soil decontamination, detoxification and restoration [1],soil organic matter decomposition, soil nutrient cycling, etc. [5].
In addition to Ni mining and processing which are the main anthropogenic sources of Ni pollution,Ni is released into the environment from various anthropogenic sources, including transportation,oil combustion, and municipal and industrial wastes [6]. High Ni concentrations in the soil, more than300 µg·g−1 soil [6–8], were reported in the soils from various sites, including rural areas of variouscountries. This is well above the permissible limit (less than 50 µg·g−1 soil for agricultural and
Sustainability 2019, 11, 3888; doi:10.3390/su11143888 www.mdpi.com/journal/sustainability
Sustainability 2019, 11, 3888 2 of 32
non-industrialized soil and less than 100 µg·g−1 soil for commercial and industrial lands) [9]. On theother hand, the mining industry relies heavily on the use of flotation reagents to extract valuableminerals from the rest of the gangue by flotation [10].
Xanthates (ROCS2− Na+/K+) are man-made organic chemicals that not only have high mineral
selectivity, but are also cost-effective and are the compounds commonly used as sulfide minerals’flotation collectors [11]. Sodium isopropyl xanthate (SIPX) and potassium ethyl xanthate (PEX) arethe most frequently used for Ni flotation and recovery. Of the input reagents’ quantity, 10 g to morethan 400 g/ton ore [10], only half is effectively consumed during the flotation [11]. The remaining partand the unrecovered metals are discharged into the environment, with no treatment in general [12].In addition, the reported increase in Ni demand [6] and the gradual depletion of high-grade ore reservesleads to the exploitation of complex and low-grade ore [13]. This results in an increased amount of oreprocessed and xanthates consumed, by 2–3% per year [12], leading to higher Ni and xanthates releasedinto the environment. Xanthates are also released into the environment from their use in the agriculturesector (e.g., pesticides), rubber sector (i.e., vulcanizing agents), and in metallurgy, etc., and can reachthe soil from their manufacturing, transportation (e.g., accidental spills), and improper disposal [14].Both Ni and xanthates are also spread into the environment from mine tailings [15], the main miningwaste dumping sites, from which they are dispersed to surface and ground waters by leaching andinfiltration and can also reach long distances by wind, run-off and erosion, plant uptake [1], and transfervia the food web [16].
Toxicologically, Ni was reported as an allergenic and carcinogenic metal that can damage varioustissues, organs, and systems in humans [17–20]. Excessive soil Ni concentration also has deleteriouseffects on plants [8,21]. Regarding xanthates, human and animal exposure leads to multisided effects(e.g., oral and dermal acute toxicity, damage of the eye, liver, kidneys, spleen, and respiratory andnervous systems [14]. Xanthates were reported as tremendously toxic to aquatic organisms, with ahigh sensitivity to less than 1 mg/L [22].
To survive under the above described adverse conditions, some microbes have developed toleranceand resistance abilities. The identification and application of such specific microbial strains could servefor the remediation of Ni and xanthate-associated pollution. However, Ni [23] and more particularlyxanthate- related studies [14] are still scarce. Moreover, pollution and health risk assessment studieshave mostly focused on single substances while the exposure to multiple chemical agents can result ineither additive actions, synergistic interactions or antagonistic interactions [24]. Metals, being mosttoxic in their free ionic forms (e.g., Ni2+), also combine with xanthates, the interaction between Niand xanthates becoming toxicologically relevant. Exposure to structurally and ecologically differentchemicals is of great technological and pharmaceutical interest [25,26]. Analyzing the response ofsoil microorganisms to metals and flotation reagents, individually and as mixtures, can serve for agreater understanding of the associated pollution impacts and for their prediction and management.The majority of studies have focused on the application of different traditional techniques at thecommunity level [27,28] which cannot provide enough information on the spectrum of taxa in theexposed microbial community [28]. Previous to the present study, a microcalorimetric-based analysiswas conducted to analyze the individual and interactive effect chemicals used here on the soil microbialactivity [29]. The obtained results have raised great scientific interest. However, the limitation ofthe study was the lack of information on which microbes are the most affected and those that areless sensitive or adapted to the applied pollutants and are, thus, most responsible for the observedactivity level. The analyses based on the molecular biology approach used here are the best way toovercome this limitation [30]. The sequencing and analysis of the 16S ribosomal RNA (rRNA) genes inprokaryotes is one of the most useful advanced techniques for the characterization of the bacterialcommunity [31,32].
Two main hypotheses led to conducting the present study. Firstly, the affinity between metals andtheir respective flotation collectors can affect the bioavailability of both chemicals and their interactionwith the exposed organisms. Secondly, different soil microbial strains may variably respond to Ni

Sustainability 2019, 11, 3888 3 of 32
and xanthates, individually and in the mixtures. Accordingly, this study analyzed the toxicity ofsingle and combined Ni (NiCl2·6H2O) and xanthates, SIPX (C3H7OCS2Na) and PEX (C2H5OCS2K),on the bacterial community diversity and structure. The analysis included direct soil DNA extraction,16S rRNA amplification, Illumina high-throughput sequencing, and related data analysis. The studyhas a two-fold advantage: (1) To provide basic information on the effect of the studied chemicals onsoil bacterial community and (2) to give an insight of the sensitivity of different soil bacterial species tothe studied chemicals that will enable better identification and analysis of the resistance capability ofspecific bacterial strains.
2. Material and Methods
2.1. Sample Preparation
The study was conducted on duplicated soil samples collected from Beijing (39◦59′ N, 116◦21′ E)in July 2017. The uppermost surface soil layer was removed and soil samples were obtained from the5–15 cm soil layer, the most heavily populated soil section by microorganisms [33]. Large particles,such as plant roots and plant debris, grit, and earthworms, were removed and then soils were placedin sterile polyethylene bags and transported to the laboratory. They were then air-dried at roomtemperature, homogenized, sieved (2 mm mesh), and kept at 4 ◦C before use. A pH meter (Beckmanu690) was used to determine the pH of the soil. The measurement of the soil organic matter (OM) wasprocessed through an outer heating method by potassium dichromate oxidation based on GB7857-87(2002). The nitrogen (N) content was evaluated by element analyzer (VARIO EL3, Germany). Potassium(K) content and soluble phosphate (P) content were determined by extracting a percolated fraction of5.0 g of soil with 50.0 mL solution comprised of 0.2 mol·L−1 ethanoic acid (CH3COOH), 0.25 mol·L−1
ammonium nitrate (NH4NO3), 0.015 mol·L−1 ammonium fluoride (NH4F), 0.013 mol·L−1 (HNO3),and 0.001 mol·L−1 ethylene diamine tetraacetic acid (EDTA), pH = 2.5). Flame photometry andphotometry allowed determining the K and P, respectively. The following were the obtained values:soil pH 7.28; 17.21g OM·kg−1 soil, 75.8 mg N·kg−1 soil, 78.1 mg P·kg−1 soil, and 145.3 mg K·kg−1 soil.
Xanthates, PEX and SIPX, were obtained in solid and analytical grade from the Beijing GeneralResearch Institute of Mining and Metallurgy (Beijing, China). Distilled water was used to makechemical stock solutions. As done in previous studies [29,34–36], each sample was supplementedwith a 200 mL nutrient solution made of glucose (500 mg) and ammonium sulfate (500 mg) in a 1:1proportion. The latter has demonstrated its efficacy in providing nitrogen and sulfur that are neededfor the amino acids’ microbial synthesis and in stimulating microbial growth and activity [37,38].At the same time, except for the control sample which consisted of a non-amended sample, the soilsamples were spiked with either a single dose of Ni (300 µg·g−1 soil), SIPX and PEX (50 and 100 µg·g−1
soil), or a mixture dose of Ni (300 µg·g−1 soil) and xanthates (50 or 100 µg·g−1 soil) (Table 1). Prior toDNA extraction, soil samples were incubated for a period time of six days at 36 ◦C.
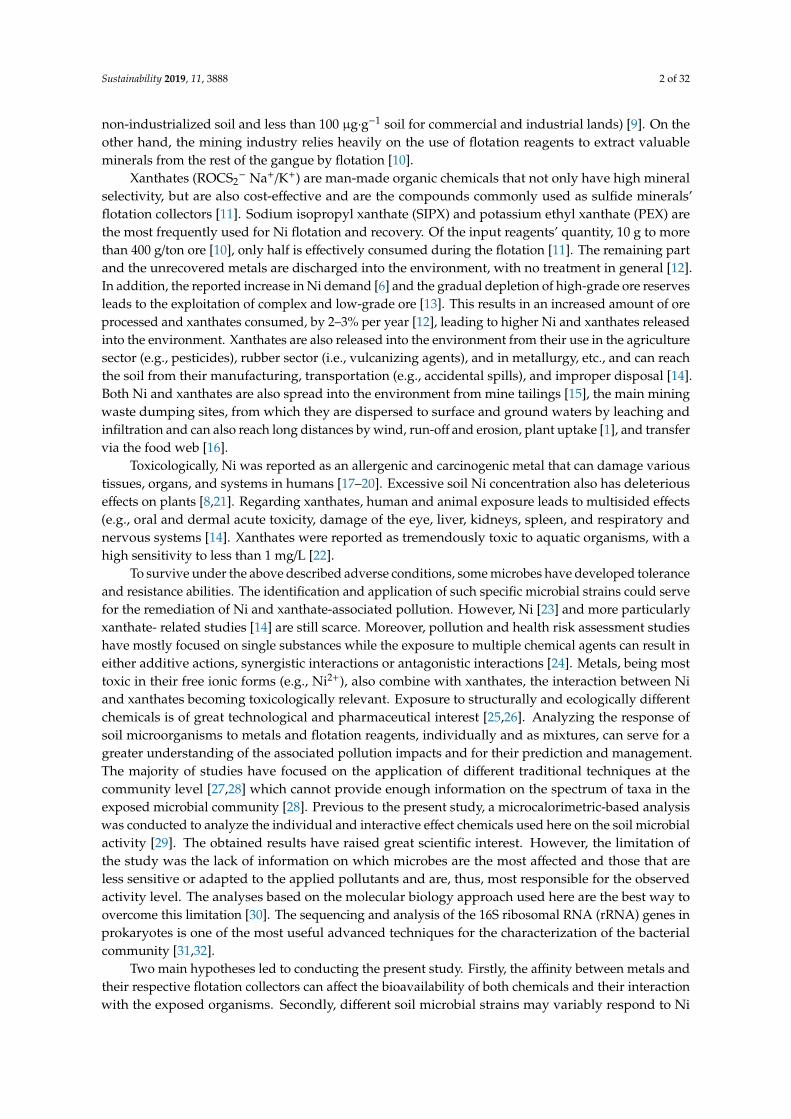
Table 1. Pollutant concentration for each treatment.
ControlSample
Single Chemical Treatments Mixed-Chemical Treatments (Ni + Xanthates)
Ni + PEX Ni + SIPX
Samples Code CS Ni PEXa PEXb SIPXa SIPXb M1a M1b M2a M2b
Dose (µg·g−1 soil) 0 300 50 100 50 100 300 + 50 300 + 100 300 + 50 300 + 100
CS = Control sample; Ni = Nickel; PEX = potassium ethyl xanthate; SIPX = sodium isopropyl xanthate; M = Mixture(M1a = Ni + PEXa, M1b = Ni + PEXb, M2a = Ni + SIPXa, and M2b = Ni + SIPXb).
2.2. DNA Extraction and PCR Amplification
Soil DNA extraction and PCR amplification were performed as recently processed [39,40]. Total soilDNA was successfully extracted using the E.Z.N.A.® Soil DNA Kit (Omega Bio-Tek, Norcross, GA, USA)and protocol. The concentration and purification of the final DNA were assessed spectrophotometrically
Sustainability 2019, 11, 3888 4 of 32
using a NanoDrop 2000 UV–VIS spectrophotometer (Thermo Scientific, Wilmington, NC, USA)following the instructions of the Majorbio Bio-Pharm Technology Co. Ltd. (Shanghai, China) andas recently done in other similar studies [40–42]. The agarose gel (1%) electrophoresis was usedto determine the quality of DNA extracts. Further, polymerase chain reaction (PCR) amplificationof the V3-V4 hypervariable regions of the 16S ribosomal ribonucleic acid (16S rRNA) genes wasperformed using a GeneAmp 9700 thermocycler PCR system (Applied Biosystems, 850 Lincoln CentreDrive, Foster City, CA 94404, USA) with primers 338F (5′-ACTCCTACGGGAGGCAGCAG-3′) and806R (5′-GGACTACHVGGGTWTCTAAT-3′). 5–7 bp barcodes were added during the process. Then,adapters were added to the amplification products by deoxyribonucleic acid ligase following theprotocol from Illumina (San Diego, CA, USA). The amplification was processed as follows: (1) aninitial denaturation at 95 ◦C (3 min) followed by a final denaturation by 27 cycles at 95 ◦C (30 s);(2) annealing at 55 ◦C (30 s); (3) elongation at 72 ◦C (45 s), and (4) final extension at 72 ◦C (10 min) [43].Negative controls without DNA were run in all amplifications. Reactions were conducted in a triplicate20 µL mixture made of 4 µL of 5 × FastPfu Buffer, 2 µL of 2.5 mM deoxyribonucleoside triphosphate(dNTPs), 0.8 µL of each primer (5 µM), 0.4 µL of FastPfu Polymerase, and 10 ng of template DNA [44].PCR products were extracted from a 2% agarose gel then purified using the AxyPrep DNA GelExtraction Kit (Axygen Biosciences, Union City, CA, USA), followed by quantification using theQuantiFluor™-ST (Promega, Madison, WI, USA), as recommended by the manufacturer [40].
2.3. Illumina Sequencing and Data Processing
The purified amplicons were effectively pooled in equimolar ratio to build the sequencing libraryand paired-end sequenced (2 × 300) on a MiSeq (Illumina) platform, following the standard protocol ofMajorbio Bio-Pharm Technology Co. Ltd. (Shanghai, China) [40]. The raw reads were deposited intothe NCBI Sequence Read Archive (SRA) database (accession number: PRJNA514197).
After being demultiplexed, raw fastq files were quality-filtered by trimmomatic and were mergedby fast length adjustment of short reads, FLASH, as follows: (1) reads were all truncated at sites withan average quality score of 20 or less over a 50 bp sliding window; (2) primers were matched fornucleotides mismatching, and all reads with ambiguous bases were detached; (3) sequences with morethan 10 bp overlap were merged based on the overlap sequence. Operational taxonomic units (OTUs)(sequences that have 97% similarity) were clustered with 3% dissimilarity cut-off using the UPARSEalgorithm (version 7.1) [28]. To obtain high-quality OTU sequences [45], all chimeric sequenceswere detected and removed using UCHIME [44]. As it was done for the DNA extraction and PCRamplification, the gene sequencing and data processing were performed with the technical assistanceof the laboratory team of the Majorbio Bio-Pharm Technology Co. Ltd.
As previously done in other similar studies [39,40], data analysis was performed using the i-Sangerplatform (http://www.i-sanger.com/) of the Majorbio Bio-PharmTechnology Co. Ltd. (Shanghai,China) and using the rarefied data. The microbial community alpha diversity was estimatedthrough the following different indices, calculated by the Mothur program (version v.1.30.1 [46].The community richness was evaluated using Chao1 and Ace estimators. Shannon diversity indexand the abundance-based coverage estimator (refers to the coverage rate of each sample library) werecalculated to estimate the community diversity [28]. Venn diagram analysis, using R language toolsstatistics and mapping [47] allowed evaluating the similarities and differences between samples basedon the number of shared and unique OTUs [40]. To obtain the species classification informationcorresponding to each OTU sequence, the taxonomic analysis was performed using the RibosomalDatabase Project (RDP) Classifier Bayesian algorithm [48] against the Silva (SSU128) 16S rRNA databaseat a confidence threshold of 70% [49]. Bacterial community composition and species abundance analysisat different taxonomic levels (e.g., phylum, class, family, genus, and species) and principal coordinateanalysis (PCoA) was performed based on the Bray–Curtis distance algorithm. A comparison betweensamples was made based on the relative taxa or species abundance/dominance. For the statisticalanalysis, samples treated with the same dose of xanthates were grouped together (no remarkable
Sustainability 2019, 11, 3888 5 of 32
difference was observed between the same dose of PEX and SIPX). This made four replicates foreach category of the compared treatments (single xanthate-treated samples and their correspondingNi/xanthate-treated samples). The xanthate-treated samples were compared to their correspondingmixture treatments by grouping together the samples treated with the same dose of PEX and SIPX,individually and in the mixtures. Student’s t-test, at a 95% significance level, was performed for thiscomparison. The most proportionally different bacterial species between these two types of sampletreatments were presented.
3. Results and Discussion
3.1. Bacterial Community Richness and Diversity
Of the total number of 918,762 high-quality sequences, 682,554 16S rRNA effective gene sequencereads were obtained across all samples (Table 2).
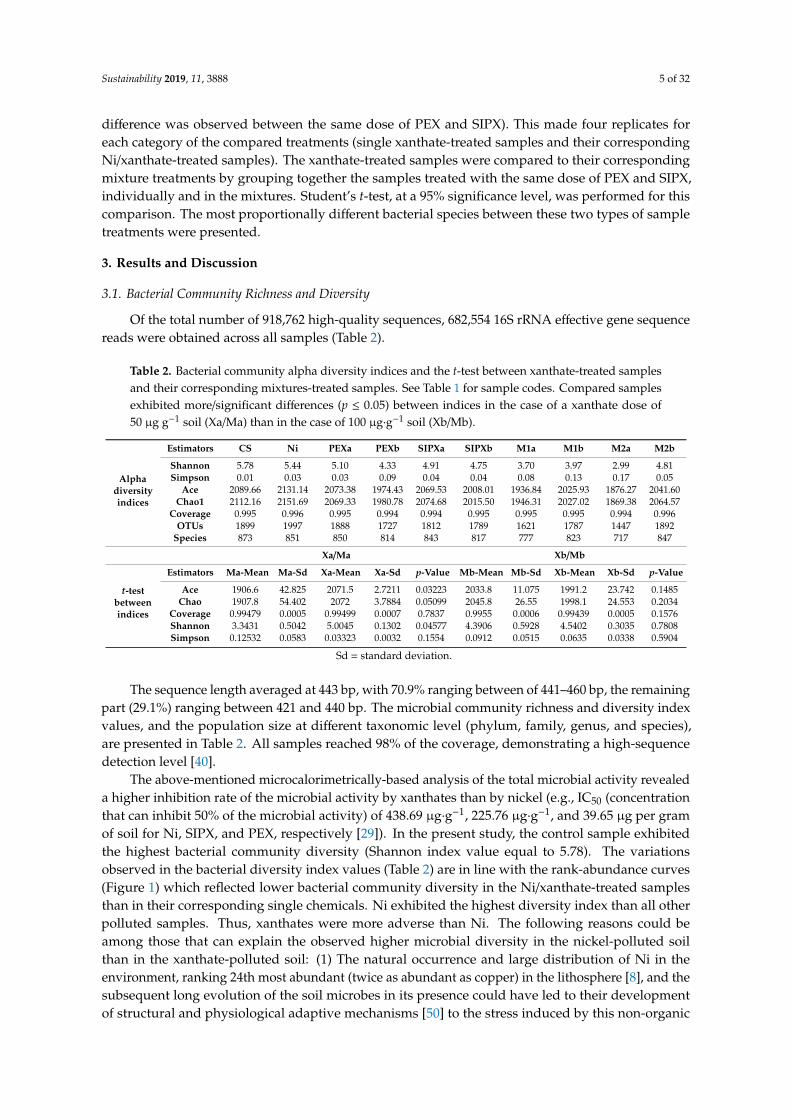
Table 2. Bacterial community alpha diversity indices and the t-test between xanthate-treated samplesand their corresponding mixtures-treated samples. See Table 1 for sample codes. Compared samplesexhibited more/significant differences (p ≤ 0.05) between indices in the case of a xanthate dose of50 µg g−1 soil (Xa/Ma) than in the case of 100 µg·g−1 soil (Xb/Mb).
Alphadiversityindices
Estimators CS Ni PEXa PEXb SIPXa SIPXb M1a M1b M2a M2b
Shannon 5.78 5.44 5.10 4.33 4.91 4.75 3.70 3.97 2.99 4.81Simpson 0.01 0.03 0.03 0.09 0.04 0.04 0.08 0.13 0.17 0.05
Ace 2089.66 2131.14 2073.38 1974.43 2069.53 2008.01 1936.84 2025.93 1876.27 2041.60Chao1 2112.16 2151.69 2069.33 1980.78 2074.68 2015.50 1946.31 2027.02 1869.38 2064.57
Coverage 0.995 0.996 0.995 0.994 0.994 0.995 0.995 0.995 0.994 0.996OTUs 1899 1997 1888 1727 1812 1789 1621 1787 1447 1892
Species 873 851 850 814 843 817 777 823 717 847
Xa/Ma Xb/Mb
t-testbetweenindices
Estimators Ma-Mean Ma-Sd Xa-Mean Xa-Sd p-Value Mb-Mean Mb-Sd Xb-Mean Xb-Sd p-Value
Ace 1906.6 42.825 2071.5 2.7211 0.03223 2033.8 11.075 1991.2 23.742 0.1485Chao 1907.8 54.402 2072 3.7884 0.05099 2045.8 26.55 1998.1 24.553 0.2034
Coverage 0.99479 0.0005 0.99499 0.0007 0.7837 0.9955 0.0006 0.99439 0.0005 0.1576Shannon 3.3431 0.5042 5.0045 0.1302 0.04577 4.3906 0.5928 4.5402 0.3035 0.7808Simpson 0.12532 0.0583 0.03323 0.0032 0.1554 0.0912 0.0515 0.0635 0.0338 0.5904
Sd = standard deviation.
The sequence length averaged at 443 bp, with 70.9% ranging between of 441–460 bp, the remainingpart (29.1%) ranging between 421 and 440 bp. The microbial community richness and diversity indexvalues, and the population size at different taxonomic level (phylum, family, genus, and species),are presented in Table 2. All samples reached 98% of the coverage, demonstrating a high-sequencedetection level [40].
The above-mentioned microcalorimetrically-based analysis of the total microbial activity revealeda higher inhibition rate of the microbial activity by xanthates than by nickel (e.g., IC50 (concentrationthat can inhibit 50% of the microbial activity) of 438.69 µg·g−1, 225.76 µg·g−1, and 39.65 µg per gramof soil for Ni, SIPX, and PEX, respectively [29]). In the present study, the control sample exhibitedthe highest bacterial community diversity (Shannon index value equal to 5.78). The variationsobserved in the bacterial diversity index values (Table 2) are in line with the rank-abundance curves(Figure 1) which reflected lower bacterial community diversity in the Ni/xanthate-treated samplesthan in their corresponding single chemicals. Ni exhibited the highest diversity index than all otherpolluted samples. Thus, xanthates were more adverse than Ni. The following reasons could beamong those that can explain the observed higher microbial diversity in the nickel-polluted soilthan in the xanthate-polluted soil: (1) The natural occurrence and large distribution of Ni in theenvironment, ranking 24th most abundant (twice as abundant as copper) in the lithosphere [8], and thesubsequent long evolution of the soil microbes in its presence could have led to their developmentof structural and physiological adaptive mechanisms [50] to the stress induced by this non-organic

Sustainability 2019, 11, 3888 6 of 32
element [51]. Ni-containing proteins were reported as a part of Ni homeostatic mechanisms withinthe soil microorganisms [52]. In contrast, xanthates, which are man-made organic chemicals, werefirstly produced in the early 1900s. They are essentially used for mineral flotation from which they aremainly released into the environment [10–12]. Therefore, microbial resistance mechanisms to xanthatesmay still relatively lower than that for metals. (2) Ni is a micronutrient, essentially involved in themetabolism of nitrogen, hydrogen, and other physiologically important elements. It is involved as acomponent or cofactor of several metalloenzymes, including acireductone dioxygenase, Ni-superoxidedismutase, methyl coenzyme M reductase, acetyl-CoA synthetase/decarboxylase, carbon monoxidedehydrogenase, and urease [6,51,53]. However, above a certain concentration limit, metals becomedeleterious, with different toxic mechanisms, including inhibiting cell division, enzyme activity andtranscription, denaturing proteins, disrupting the cell membrane [8,54], etc., which result in thereduction of the diversity and size of a given exposed microbial population. Similarly, xanthatesmay severely interact with the exposed organisms, resulting in their relatively high toxicity which isperceived at both cellular and community level.Sustainability 2019, 11, x FOR PEER REVIEW 7 of 37
Figure 1. Rank abundance curves of bacterial communities under different soil treatments: Control samples (CS), soil treated with 300 µg Ni·g−1 (Ni), 50 µg PEX g−1 (PEXa), 100 µg PEX g−1 (PEXb), 50 µg SIPX g−1 (SIPXa), 100 µg SIPX g−1 (SIPXb), and soil treated with binary mixtures of 300 µg Ni g−1 and 50 µg PEX g−1 (M1a), 100 µg PEX g−1 (M1b), 50 µg SIPX g−1 (M2a), and 100 µg SIPX g−1 (M2b). In the horizontal direction, the abundance of the species is reflected by the width of the curve. The larger the curve is on the horizontal axis, the higher the species abundance. The shape of the curve (smoothness) reflects the uniformity of the species in the sample, the curve. The more gradual, the more uniform the distribution of the species.
3.2. Similarity and Differences
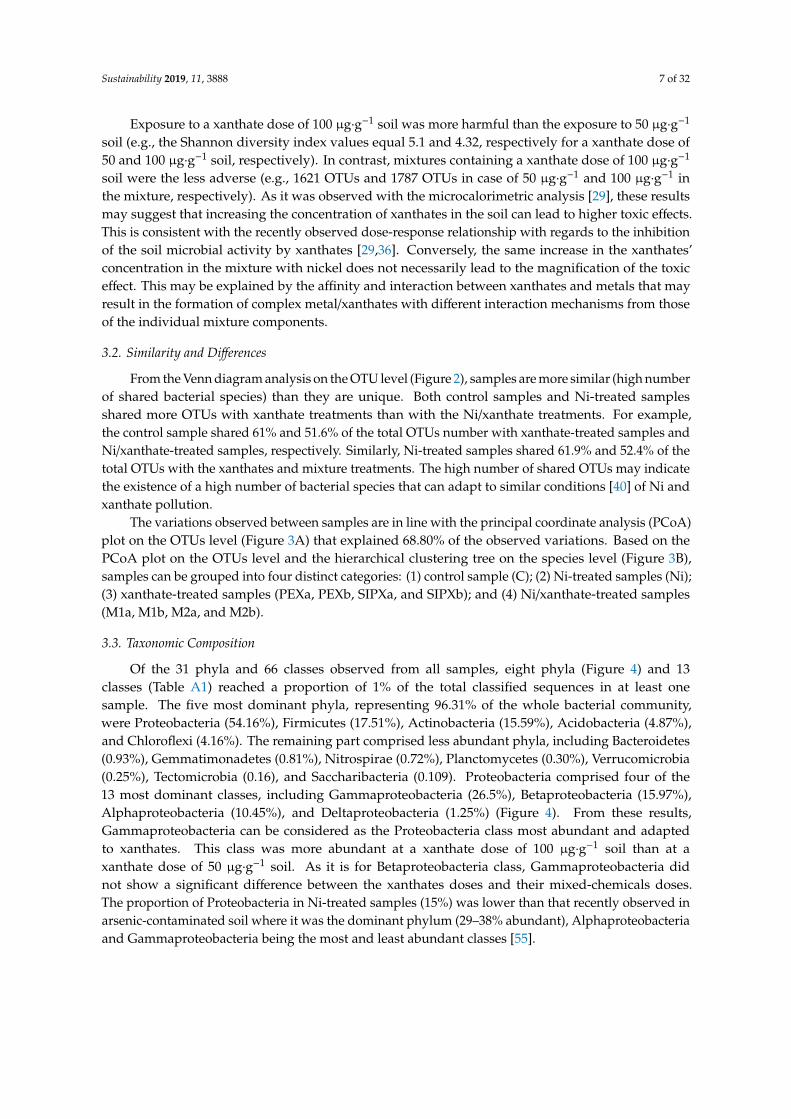
From the Venn diagram analysis on the OTU level (Figure 2), samples are more similar (high number of shared bacterial species) than they are unique. Both control samples and Ni-treated samples shared more OTUs with xanthate treatments than with the Ni/xanthate treatments. For example, the control sample shared 61% and 51.6% of the total OTUs number with xanthate-treated samples and Ni/xanthate-treated samples, respectively. Similarly, Ni-treated samples shared 61.9% and 52.4% of the total OTUs with the xanthates and mixture treatments. The high number of shared OTUs may indicate the existence of a high number of bacterial species that can adapt to similar conditions [40] of Ni and xanthate pollution.
Figure 1. Rank abundance curves of bacterial communities under different soil treatments:Control samples (CS), soil treated with 300µg Ni·g−1 (Ni), 50µg PEX g−1 (PEXa), 100 µg PEX g−1 (PEXb),50 µg SIPX g−1 (SIPXa), 100 µg SIPX g−1 (SIPXb), and soil treated with binary mixtures of 300 µg Ni g−1
and 50 µg PEX g−1 (M1a), 100 µg PEX g−1 (M1b), 50 µg SIPX g−1 (M2a), and 100 µg SIPX g−1 (M2b).In the horizontal direction, the abundance of the species is reflected by the width of the curve. The largerthe curve is on the horizontal axis, the higher the species abundance. The shape of the curve (smoothness)reflects the uniformity of the species in the sample, the curve. The more gradual, the more uniform thedistribution of the species.
Sustainability 2019, 11, 3888 7 of 32
Exposure to a xanthate dose of 100 µg·g−1 soil was more harmful than the exposure to 50 µg·g−1
soil (e.g., the Shannon diversity index values equal 5.1 and 4.32, respectively for a xanthate dose of50 and 100 µg·g−1 soil, respectively). In contrast, mixtures containing a xanthate dose of 100 µg·g−1
soil were the less adverse (e.g., 1621 OTUs and 1787 OTUs in case of 50 µg·g−1 and 100 µg·g−1 inthe mixture, respectively). As it was observed with the microcalorimetric analysis [29], these resultsmay suggest that increasing the concentration of xanthates in the soil can lead to higher toxic effects.This is consistent with the recently observed dose-response relationship with regards to the inhibitionof the soil microbial activity by xanthates [29,36]. Conversely, the same increase in the xanthates’concentration in the mixture with nickel does not necessarily lead to the magnification of the toxiceffect. This may be explained by the affinity and interaction between xanthates and metals that mayresult in the formation of complex metal/xanthates with different interaction mechanisms from thoseof the individual mixture components.
3.2. Similarity and Differences
From the Venn diagram analysis on the OTU level (Figure 2), samples are more similar (high numberof shared bacterial species) than they are unique. Both control samples and Ni-treated samplesshared more OTUs with xanthate treatments than with the Ni/xanthate treatments. For example,the control sample shared 61% and 51.6% of the total OTUs number with xanthate-treated samples andNi/xanthate-treated samples, respectively. Similarly, Ni-treated samples shared 61.9% and 52.4% of thetotal OTUs with the xanthates and mixture treatments. The high number of shared OTUs may indicatethe existence of a high number of bacterial species that can adapt to similar conditions [40] of Ni andxanthate pollution.
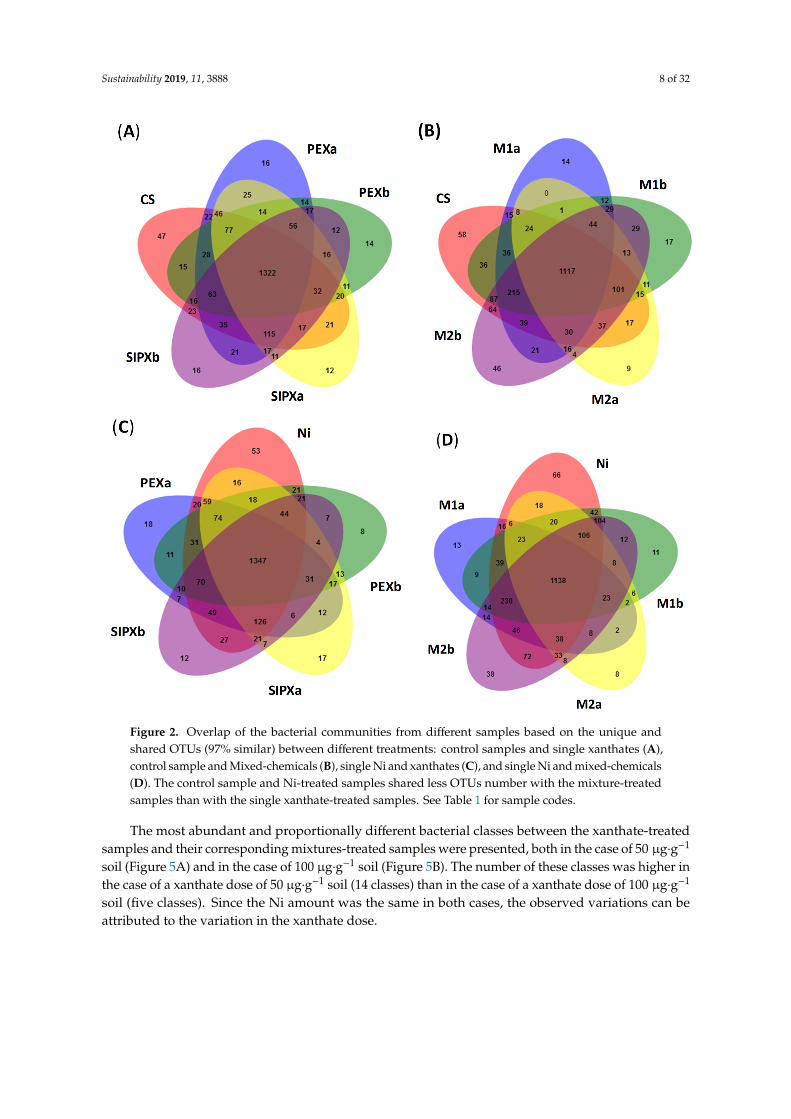
The variations observed between samples are in line with the principal coordinate analysis (PCoA)plot on the OTUs level (Figure 3A) that explained 68.80% of the observed variations. Based on thePCoA plot on the OTUs level and the hierarchical clustering tree on the species level (Figure 3B),samples can be grouped into four distinct categories: (1) control sample (C); (2) Ni-treated samples (Ni);(3) xanthate-treated samples (PEXa, PEXb, SIPXa, and SIPXb); and (4) Ni/xanthate-treated samples(M1a, M1b, M2a, and M2b).
3.3. Taxonomic Composition
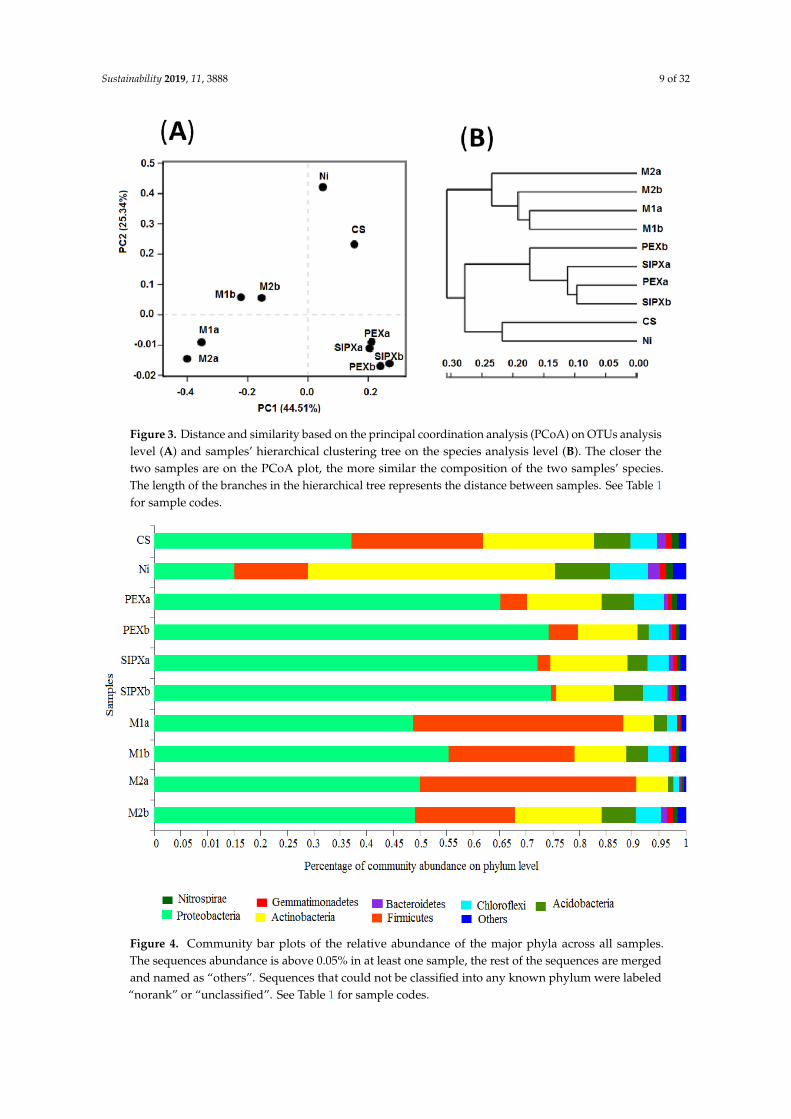
Of the 31 phyla and 66 classes observed from all samples, eight phyla (Figure 4) and 13classes (Table A1) reached a proportion of 1% of the total classified sequences in at least onesample. The five most dominant phyla, representing 96.31% of the whole bacterial community,were Proteobacteria (54.16%), Firmicutes (17.51%), Actinobacteria (15.59%), Acidobacteria (4.87%),and Chloroflexi (4.16%). The remaining part comprised less abundant phyla, including Bacteroidetes(0.93%), Gemmatimonadetes (0.81%), Nitrospirae (0.72%), Planctomycetes (0.30%), Verrucomicrobia(0.25%), Tectomicrobia (0.16), and Saccharibacteria (0.109). Proteobacteria comprised four of the13 most dominant classes, including Gammaproteobacteria (26.5%), Betaproteobacteria (15.97%),Alphaproteobacteria (10.45%), and Deltaproteobacteria (1.25%) (Figure 4). From these results,Gammaproteobacteria can be considered as the Proteobacteria class most abundant and adaptedto xanthates. This class was more abundant at a xanthate dose of 100 µg·g−1 soil than at axanthate dose of 50 µg·g−1 soil. As it is for Betaproteobacteria class, Gammaproteobacteria didnot show a significant difference between the xanthates doses and their mixed-chemicals doses.The proportion of Proteobacteria in Ni-treated samples (15%) was lower than that recently observed inarsenic-contaminated soil where it was the dominant phylum (29–38% abundant), Alphaproteobacteriaand Gammaproteobacteria being the most and least abundant classes [55].
Sustainability 2019, 11, 3888 8 of 32
Sustainability 2019, 11, x FOR PEER REVIEW 8 of 37
Figure 2. Overlap of the bacterial communities from different samples based on the unique and shared OTUs (97% similar) between different treatments: control samples and single xanthates (A), control sample and Mixed-chemicals (B), single Ni and xanthates (C), and single Ni and mixed-chemicals (D). The control sample and Ni-treated samples shared less OTUs number with the mixture-treated samples than with the single xanthate-treated samples. See Table 1 for sample codes.
The variations observed between samples are in line with the principal coordinate analysis (PCoA) plot on the OTUs level (Figure 3A) that explained 68.80% of the observed variations. Based on the PCoA plot on the OTUs level and the hierarchical clustering tree on the species level (Figure 3B), samples can be grouped into four distinct categories: (1) control sample (C); (2) Ni-treated samples (Ni); (3) xanthate-treated samples (PEXa, PEXb, SIPXa, and SIPXb); and (4) Ni/xanthate-treated samples (M1a, M1b, M2a, and M2b).
Figure 2. Overlap of the bacterial communities from different samples based on the unique andshared OTUs (97% similar) between different treatments: control samples and single xanthates (A),control sample and Mixed-chemicals (B), single Ni and xanthates (C), and single Ni and mixed-chemicals(D). The control sample and Ni-treated samples shared less OTUs number with the mixture-treatedsamples than with the single xanthate-treated samples. See Table 1 for sample codes.
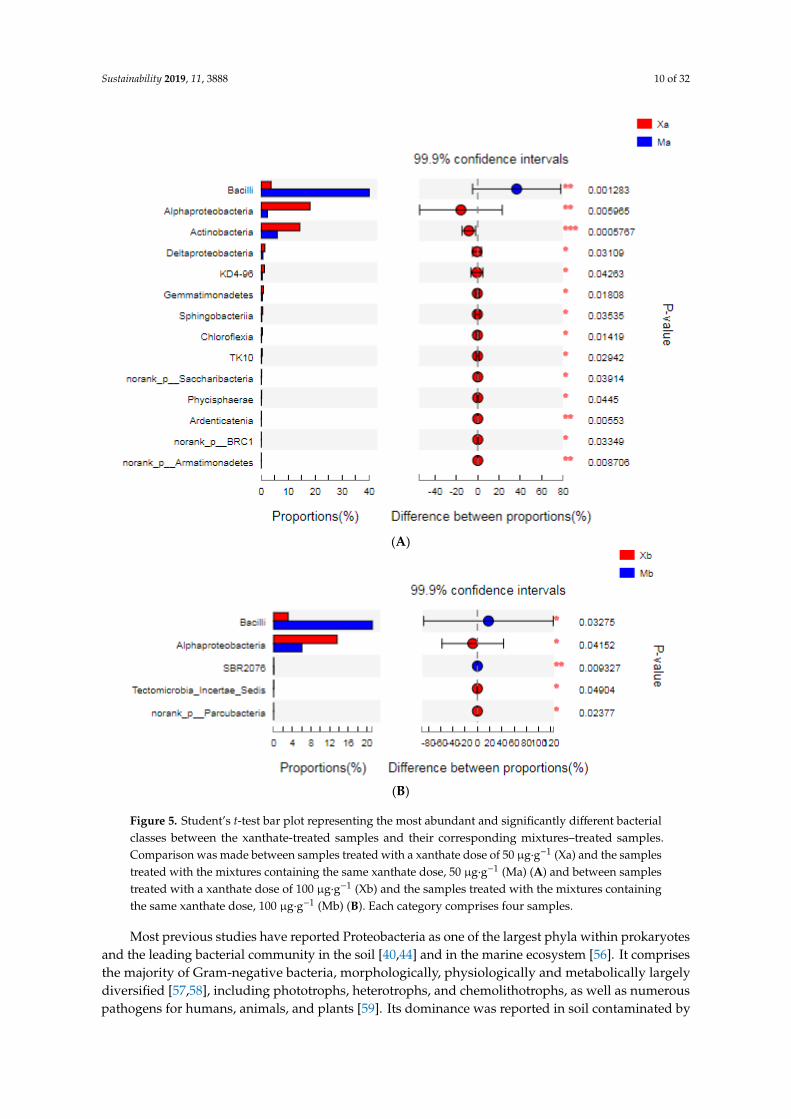
The most abundant and proportionally different bacterial classes between the xanthate-treatedsamples and their corresponding mixtures-treated samples were presented, both in the case of 50 µg·g−1
soil (Figure 5A) and in the case of 100 µg·g−1 soil (Figure 5B). The number of these classes was higher inthe case of a xanthate dose of 50 µg·g−1 soil (14 classes) than in the case of a xanthate dose of 100 µg·g−1
soil (five classes). Since the Ni amount was the same in both cases, the observed variations can beattributed to the variation in the xanthate dose.
Sustainability 2019, 11, 3888 9 of 32Sustainability 2019, 11, x FOR PEER REVIEW 9 of 37
Figure 3. Distance and similarity based on the principal coordination analysis (PCoA) on OTUs analysis level (A) and samples’ hierarchical clustering tree on the species analysis level (B). The closer the two samples are on the PCoA plot, the more similar the composition of the two samples’ species. The length of the branches in the hierarchical tree represents the distance between samples. See Table 1 for sample codes.
3.3. Taxonomic Composition
Of the 31 phyla and 66 classes observed from all samples, eight phyla (Figure 4) and 13 classes (Table A1) reached a proportion of 1% of the total classified sequences in at least one sample. The five most dominant phyla, representing 96.31% of the whole bacterial community, were Proteobacteria (54.16%), Firmicutes (17.51%), Actinobacteria (15.59%), Acidobacteria (4.87%), and Chloroflexi (4.16%). The remaining part comprised less abundant phyla, including Bacteroidetes (0.93%), Gemmatimonadetes (0.81%), Nitrospirae (0.72%), Planctomycetes (0.30%), Verrucomicrobia (0.25%), Tectomicrobia (0.16), and Saccharibacteria (0.109). Proteobacteria comprised four of the 13 most dominant classes, including Gammaproteobacteria (26.5%), Betaproteobacteria (15.97%), Alphaproteobacteria (10.45%), and Deltaproteobacteria (1.25%) (Figure 4). From these results, Gammaproteobacteria can be considered as the Proteobacteria class most abundant and adapted to xanthates. This class was more abundant at a xanthate dose of 100 µg·g−1 soil than at a xanthate dose of 50 µg·g−1 soil. As it is for Betaproteobacteria class, Gammaproteobacteria did not show a significant difference between the xanthates doses and their mixed-chemicals doses. The proportion of Proteobacteria in Ni-treated samples (15%) was lower than that recently observed in arsenic-contaminated soil where it was the dominant phylum (29–38% abundant), Alphaproteobacteria and Gammaproteobacteria being the most and least abundant classes [55].
Figure 3. Distance and similarity based on the principal coordination analysis (PCoA) on OTUs analysislevel (A) and samples’ hierarchical clustering tree on the species analysis level (B). The closer thetwo samples are on the PCoA plot, the more similar the composition of the two samples’ species.The length of the branches in the hierarchical tree represents the distance between samples. See Table 1for sample codes.Sustainability 2019, 11, x FOR PEER REVIEW 10 of 37
Figure 4. Community bar plots of the relative abundance of the major phyla across all samples. The sequences abundance is above 0.05% in at least one sample, the rest of the sequences are merged and named as “others”. Sequences that could not be classified into any known phylum were labeled “norank” or “unclassified”. See Table 1 for sample codes.
The most abundant and proportionally different bacterial classes between the xanthate-treated samples and their corresponding mixtures-treated samples were presented, both in the case of 50 µg·g−1 soil (Figure 5A) and in the case of 100 µg·g−1 soil (Figure 5B). The number of these classes was higher in the case of a xanthate dose of 50 µg·g−1 soil (14 classes) than in the case of a xanthate dose of 100 µg·g−1 soil (five classes). Since the Ni amount was the same in both cases, the observed variations can be attributed to the variation in the xanthate dose.
Most previous studies have reported Proteobacteria as one of the largest phyla within prokaryotes and the leading bacterial community in the soil [40,44] and in the marine ecosystem [56]. It comprises the majority of Gram-negative bacteria, morphologically, physiologically and metabolically largely diversified [57,58], including phototrophs, heterotrophs, and chemolithotrophs, as well as numerous pathogens for humans, animals, and plants [59]. Its dominance was reported in soil contaminated by polyaromatic hydrocarbons (PAHs) [60,61] and oil [59]. In this study, its low abundance (15.06%) was observed in Ni-treated samples. It is well known that organic compounds are subject to various biotic and abiotic decomposition processes, the main one being attributed to the microbial mediation [62–65].
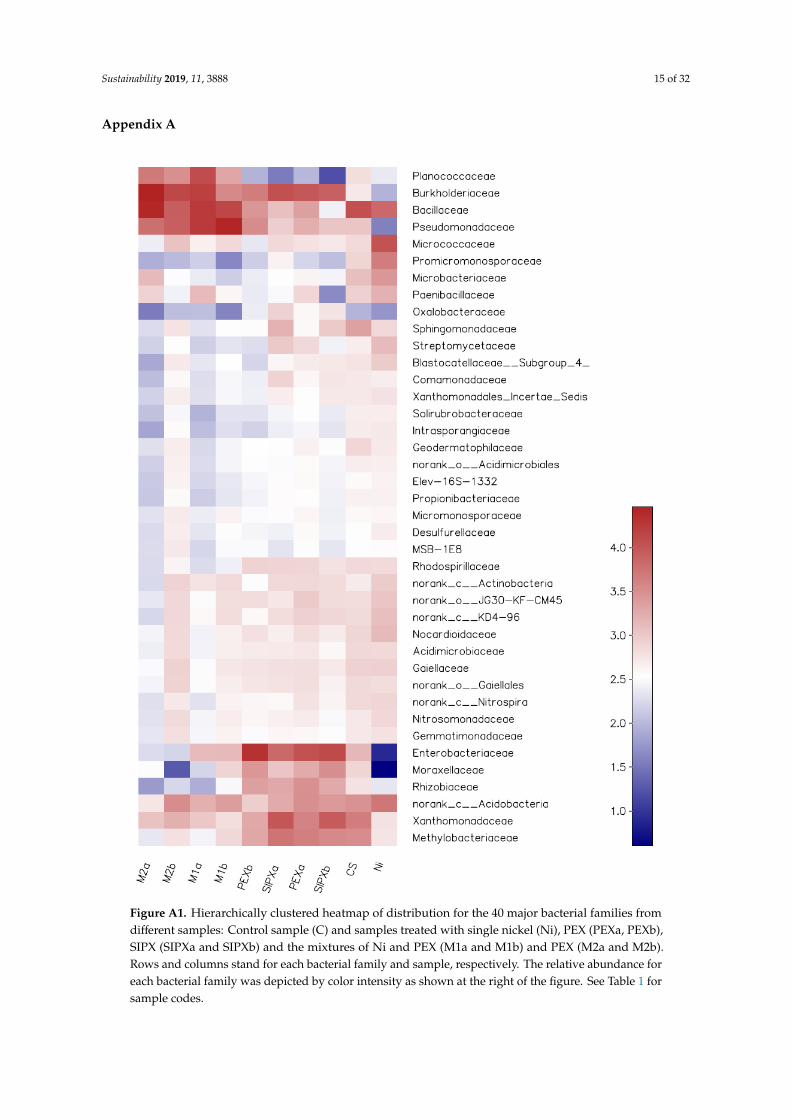
Proteobacteria members have been reported to be among the bacteria which are able to decompose chemical compounds that can serve as a source of energy and metabolites [66]. Such capability may explain the predominance of Proteobacteria in xanthate-treated samples. The families Enterobacteriaceae, Burkholderiaceae, Methylobacteriaceae, Moraxellaceae, and Rhizobiaceaae were found more abundant in xanthate-treated samples than in Ni-treated samples, while the families Pseudomonadaceae and Xanthomonadaceae exhibited higher proportion the Ni/xanthate-treated soil (Figure A1).
Figure 4. Community bar plots of the relative abundance of the major phyla across all samples.The sequences abundance is above 0.05% in at least one sample, the rest of the sequences are mergedand named as “others”. Sequences that could not be classified into any known phylum were labeled“norank” or “unclassified”. See Table 1 for sample codes.
Sustainability 2019, 11, 3888 10 of 32Sustainability 2019, 11, x FOR PEER REVIEW 11 of 37
(A)
(B)
Figure 5. Student’s t-test bar plot representing the most abundant and significantly different bacterial classes between the xanthate-treated samples and their corresponding mixtures–treated samples. Comparison was made between samples treated with a xanthate dose of 50 µg·g−1 (Xa) and the samples treated with the mixtures containing the same xanthate dose, 50 µg·g−1 (Ma) (A) and between samples treated with a xanthate dose of 100 µg·g−1 (Xb) and the samples treated with the mixtures containing the same xanthate dose, 100 µg·g−1 (Mb) (B). Each category comprises four samples.
With regard to the Firmicutes phylum, it comprised two of the 13 most dominant classes, Bacilli (17.24%) and Clostridia (0.28%). Its highest and lowest proportions in the amended samples were observed in Ni/xanthate-treated samples (18.85–40.72%) and in xanthate-treated samples (0.81–5.5%), respectively. The Firmicutes phylum constitutes a rarely dominant group in the natural environment [67,68], and comprises the majority of gram-positive and endospore-forming bacteria [64]. Some of its members may take advantage of their secondary produced metabolites to cope with
Figure 5. Student’s t-test bar plot representing the most abundant and significantly different bacterialclasses between the xanthate-treated samples and their corresponding mixtures–treated samples.Comparison was made between samples treated with a xanthate dose of 50 µg·g−1 (Xa) and the samplestreated with the mixtures containing the same xanthate dose, 50 µg·g−1 (Ma) (A) and between samplestreated with a xanthate dose of 100 µg·g−1 (Xb) and the samples treated with the mixtures containingthe same xanthate dose, 100 µg·g−1 (Mb) (B). Each category comprises four samples.
Most previous studies have reported Proteobacteria as one of the largest phyla within prokaryotesand the leading bacterial community in the soil [40,44] and in the marine ecosystem [56]. It comprisesthe majority of Gram-negative bacteria, morphologically, physiologically and metabolically largelydiversified [57,58], including phototrophs, heterotrophs, and chemolithotrophs, as well as numerouspathogens for humans, animals, and plants [59]. Its dominance was reported in soil contaminated by

Sustainability 2019, 11, 3888 11 of 32
polyaromatic hydrocarbons (PAHs) [60,61] and oil [59]. In this study, its low abundance (15.06%) wasobserved in Ni-treated samples. It is well known that organic compounds are subject to various bioticand abiotic decomposition processes, the main one being attributed to the microbial mediation [62–65].
Proteobacteria members have been reported to be among the bacteria which are able to decomposechemical compounds that can serve as a source of energy and metabolites [66]. Such capabilitymay explain the predominance of Proteobacteria in xanthate-treated samples. The familiesEnterobacteriaceae, Burkholderiaceae, Methylobacteriaceae, Moraxellaceae, and Rhizobiaceaae werefound more abundant in xanthate-treated samples than in Ni-treated samples, while the familiesPseudomonadaceae and Xanthomonadaceae exhibited higher proportion the Ni/xanthate-treated soil(Figure A1).
With regard to the Firmicutes phylum, it comprised two of the 13 most dominant classes,Bacilli (17.24%) and Clostridia (0.28%). Its highest and lowest proportions in the amended sampleswere observed in Ni/xanthate-treated samples (18.85–40.72%) and in xanthate-treated samples(0.81–5.5%), respectively. The Firmicutes phylum constitutes a rarely dominant group in the naturalenvironment [67,68], and comprises the majority of gram-positive and endospore-forming bacteria [64].Some of its members may take advantage of their secondary produced metabolites to cope withstressful conditions, including heavy metal polluted soil [43]. Ecologically, Firmicutes constitute avery important bacterial group, comprising biosurfactant-producing bacteria that are explored forthe bioremediation of petroleum hydrocarbon-contaminated soils [69]. They are also involved invarious processes, such as cellular metal sequestration [70], iron reduction [71], and fermentationreactions [70,72]. In this study, Bacillaceae family, one of the most involved microbes in those functions,has the highest abundance in the mixture-treated samples (Fig.A1). The second abundant Firmicutesfamily in the mixture-treated samples was Planococcaceae, accounting for 2.79–14.88%, while itaccounted for less than 1% in the Ni-treated samples. In light of these results, a simultaneous presenceof Ni and xanthates may lead to the reduction of the sensitivity of the Firmicutes species to xanthates.
Regarding the Actinobacteria phylum, it comprised one of the above mentioned 13 most dominantclasses, Actinobacteria, and dominated in Ni-treated samples. This phylum comprises gram-positiveand spore-forming bacteria that occur in both terrestrial and aquatic ecosystems [73]. They have beenpreviously identified, with relatively low abundance, in samples from various sources, includingagricultural soil [43,74] and heavy metals contaminated soil [68,75]. Streptomycetaceae which isone of the most ecologically active Actinobacteria families [76,77] exhibited the highest and lowestproportions in Ni-treated samples and xanthate-treated samples, respectively.
Of the 502 genera obtained from all samples, six genera accounted for more than 50%of the total sequences, including Cupriavidus (13.34%), Bacillus (13.05%), Pseudomonas (10.61%),unclassified_f_Enterobacteriaceae (5.62%), Lysobacter (4.41%), and norank_c_Acidobacteria (3.64%). The mostrepresentative genera, with a proportion of more than 1% of the whole bacterial community in at leastone sample, are shown in Table 3.
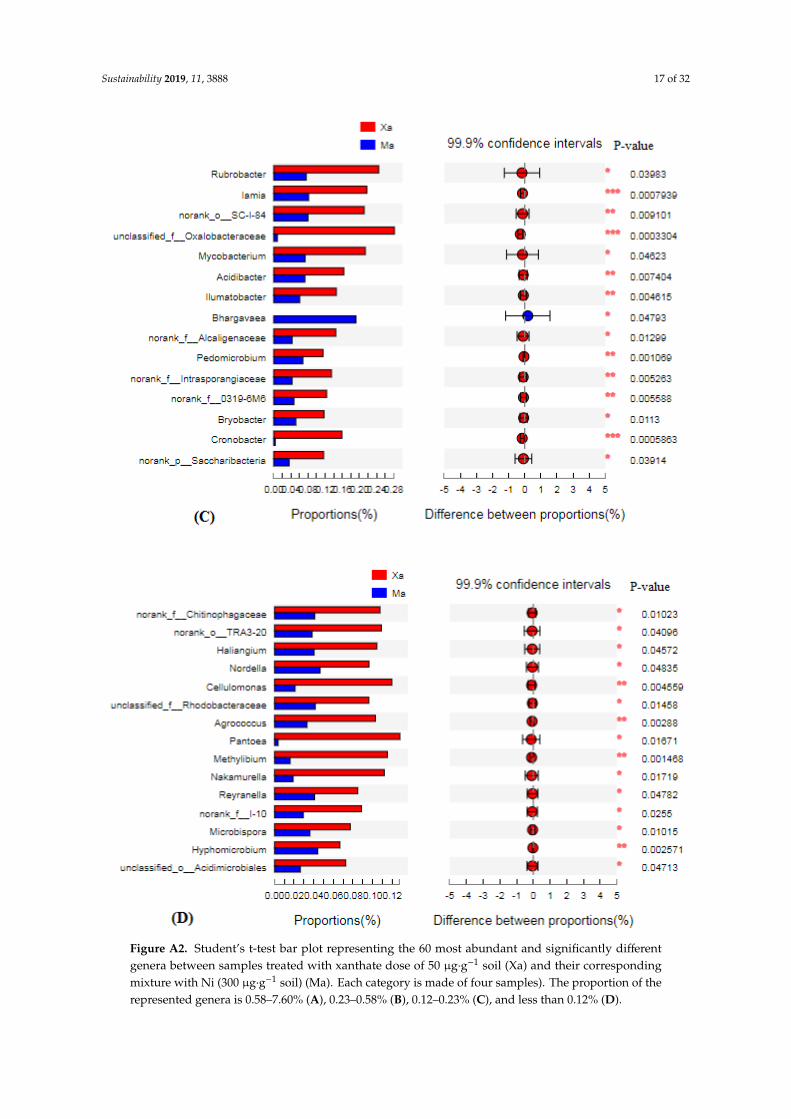
Among them, a higher number was observed in the control sample. The most significantlydifferent genera between xanthates and their corresponding mixture with nickel are presented(Figures A2 and A3).
As it was observed on the class level, the number of the most abundant and significantly differentbacterial genera between the xanthate-treated samples and their corresponding mixture-treated sampleswas higher (more than 4.5 times) in the case a xanthate dose of 50 µg·g−1 soil (Figure A2) than in thecase of a xanthate dose of 100 µg·g−1 soil (Figure A3).
Sustainability 2019, 11, 3888 12 of 32
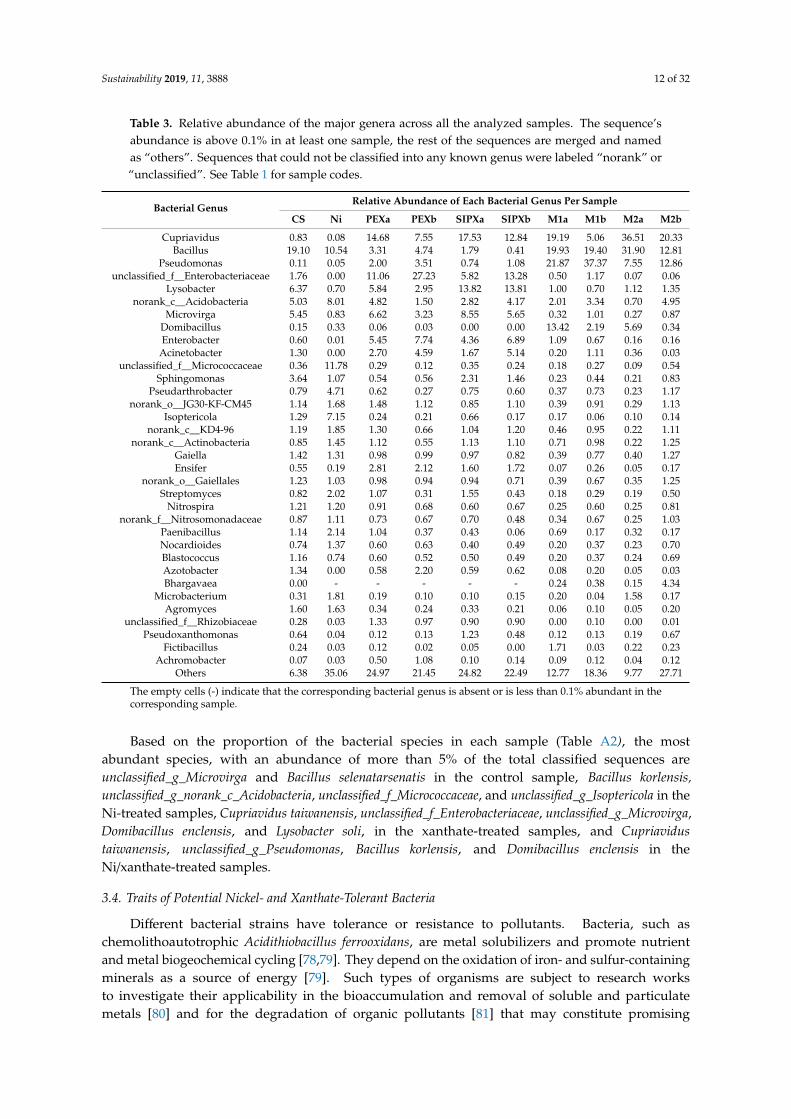
Table 3. Relative abundance of the major genera across all the analyzed samples. The sequence’sabundance is above 0.1% in at least one sample, the rest of the sequences are merged and namedas “others”. Sequences that could not be classified into any known genus were labeled “norank” or“unclassified”. See Table 1 for sample codes.
Bacterial GenusRelative Abundance of Each Bacterial Genus Per Sample
CS Ni PEXa PEXb SIPXa SIPXb M1a M1b M2a M2b
Cupriavidus 0.83 0.08 14.68 7.55 17.53 12.84 19.19 5.06 36.51 20.33Bacillus 19.10 10.54 3.31 4.74 1.79 0.41 19.93 19.40 31.90 12.81
Pseudomonas 0.11 0.05 2.00 3.51 0.74 1.08 21.87 37.37 7.55 12.86unclassified_f__Enterobacteriaceae 1.76 0.00 11.06 27.23 5.82 13.28 0.50 1.17 0.07 0.06
Lysobacter 6.37 0.70 5.84 2.95 13.82 13.81 1.00 0.70 1.12 1.35norank_c__Acidobacteria 5.03 8.01 4.82 1.50 2.82 4.17 2.01 3.34 0.70 4.95
Microvirga 5.45 0.83 6.62 3.23 8.55 5.65 0.32 1.01 0.27 0.87Domibacillus 0.15 0.33 0.06 0.03 0.00 0.00 13.42 2.19 5.69 0.34Enterobacter 0.60 0.01 5.45 7.74 4.36 6.89 1.09 0.67 0.16 0.16
Acinetobacter 1.30 0.00 2.70 4.59 1.67 5.14 0.20 1.11 0.36 0.03unclassified_f__Micrococcaceae 0.36 11.78 0.29 0.12 0.35 0.24 0.18 0.27 0.09 0.54
Sphingomonas 3.64 1.07 0.54 0.56 2.31 1.46 0.23 0.44 0.21 0.83Pseudarthrobacter 0.79 4.71 0.62 0.27 0.75 0.60 0.37 0.73 0.23 1.17
norank_o__JG30-KF-CM45 1.14 1.68 1.48 1.12 0.85 1.10 0.39 0.91 0.29 1.13Isoptericola 1.29 7.15 0.24 0.21 0.66 0.17 0.17 0.06 0.10 0.14
norank_c__KD4-96 1.19 1.85 1.30 0.66 1.04 1.20 0.46 0.95 0.22 1.11norank_c__Actinobacteria 0.85 1.45 1.12 0.55 1.13 1.10 0.71 0.98 0.22 1.25
Gaiella 1.42 1.31 0.98 0.99 0.97 0.82 0.39 0.77 0.40 1.27Ensifer 0.55 0.19 2.81 2.12 1.60 1.72 0.07 0.26 0.05 0.17
norank_o__Gaiellales 1.23 1.03 0.98 0.94 0.94 0.71 0.39 0.67 0.35 1.25Streptomyces 0.82 2.02 1.07 0.31 1.55 0.43 0.18 0.29 0.19 0.50
Nitrospira 1.21 1.20 0.91 0.68 0.60 0.67 0.25 0.60 0.25 0.81norank_f__Nitrosomonadaceae 0.87 1.11 0.73 0.67 0.70 0.48 0.34 0.67 0.25 1.03
Paenibacillus 1.14 2.14 1.04 0.37 0.43 0.06 0.69 0.17 0.32 0.17Nocardioides 0.74 1.37 0.60 0.63 0.40 0.49 0.20 0.37 0.23 0.70Blastococcus 1.16 0.74 0.60 0.52 0.50 0.49 0.20 0.37 0.24 0.69Azotobacter 1.34 0.00 0.58 2.20 0.59 0.62 0.08 0.20 0.05 0.03Bhargavaea 0.00 - - - - - 0.24 0.38 0.15 4.34
Microbacterium 0.31 1.81 0.19 0.10 0.10 0.15 0.20 0.04 1.58 0.17Agromyces 1.60 1.63 0.34 0.24 0.33 0.21 0.06 0.10 0.05 0.20
unclassified_f__Rhizobiaceae 0.28 0.03 1.33 0.97 0.90 0.90 0.00 0.10 0.00 0.01Pseudoxanthomonas 0.64 0.04 0.12 0.13 1.23 0.48 0.12 0.13 0.19 0.67
Fictibacillus 0.24 0.03 0.12 0.02 0.05 0.00 1.71 0.03 0.22 0.23Achromobacter 0.07 0.03 0.50 1.08 0.10 0.14 0.09 0.12 0.04 0.12
Others 6.38 35.06 24.97 21.45 24.82 22.49 12.77 18.36 9.77 27.71
The empty cells (-) indicate that the corresponding bacterial genus is absent or is less than 0.1% abundant in thecorresponding sample.
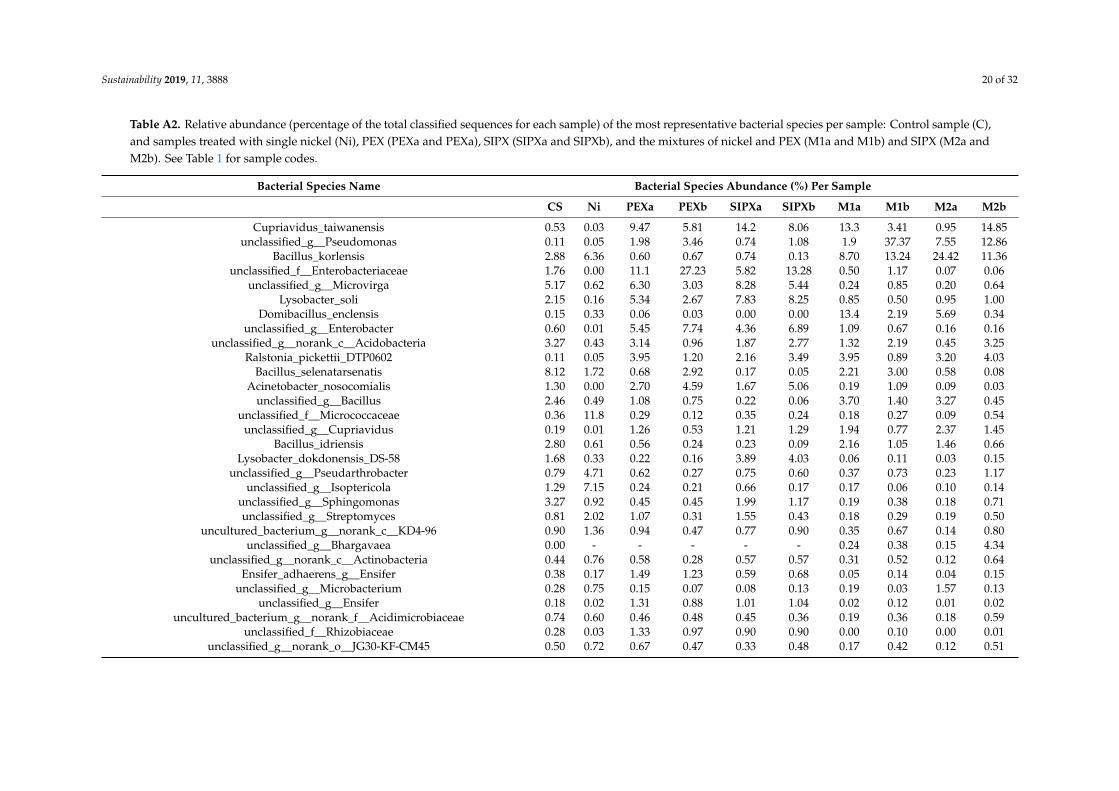
Based on the proportion of the bacterial species in each sample (Table A2), the mostabundant species, with an abundance of more than 5% of the total classified sequences areunclassified_g_Microvirga and Bacillus selenatarsenatis in the control sample, Bacillus korlensis,unclassified_g_norank_c_Acidobacteria, unclassified_f_Micrococcaceae, and unclassified_g_Isoptericola in theNi-treated samples, Cupriavidus taiwanensis, unclassified_f_Enterobacteriaceae, unclassified_g_Microvirga,Domibacillus enclensis, and Lysobacter soli, in the xanthate-treated samples, and Cupriavidustaiwanensis, unclassified_g_Pseudomonas, Bacillus korlensis, and Domibacillus enclensis in theNi/xanthate-treated samples.
3.4. Traits of Potential Nickel- and Xanthate-Tolerant Bacteria
Different bacterial strains have tolerance or resistance to pollutants. Bacteria, such aschemolithoautotrophic Acidithiobacillus ferrooxidans, are metal solubilizers and promote nutrientand metal biogeochemical cycling [78,79]. They depend on the oxidation of iron- and sulfur-containingminerals as a source of energy [79]. Such types of organisms are subject to research worksto investigate their applicability in the bioaccumulation and removal of soluble and particulatemetals [80] and for the degradation of organic pollutants [81] that may constitute promising
Sustainability 2019, 11, 3888 13 of 32
alternative biotechnology to conventional methods for the detoxification of contaminated media.Other organisms are used in biomining for mineral bioleaching and concentration, especially fromlow-grade ores [82,83]. With respect to Ni-resistant bacteria, studies have reported, among others,bacteria of the genera Bacillus, Streptomyces, Acinetobacter, Burkholderia, Klebsiella, Methylobacerium,Acidithiobacillus, and Leptospirillum [79,80,83–85].
As it was recently reported [86], the mineral bioleaching process can be negatively affected byxanthates that tend to preferably bind to the surface of sulfide minerals, inhibiting the contact andinteraction between minerals and the bioleaching microorganisms. The growth, activity, and bioleachingability of Acidithiobacillus ferrooxidans were depressed by different flotation collectors, ethyl xanthates andisopropyl xanthates, being more adverse than frothers [82]. In contrast, a mixture of three mesophilicbacteria, Acidithiobacillus thiooxidans, Acidithiobacillus ferrooxidans, and Leptospirillum ferrooxidans,exhibited less sensitivity and higher zinc mineral bioleaching than any individual strain [86]. This isconsistent with the fact that, to efficiently cope with stressful conditions, as can in the case of exposureto Ni and xanthates, microbes act synergistically rather than by single strain [63,83].
In this study, considering the bacterial abundance, which is a good indicator of the sensitivity topollutants, bacteria in the microbial community exposed to Ni and xanthates fall into four distinctcategories. The first category comprised of the most represented bacteria in Ni-treated sampleswhile they are much less abundant in xanthate-treated samples. They include, among others,the genera unclassified_f_Micrococcaceae, Bacillus, norank_c_Acidobacteria, Isoptericola, Pseudarthrobacter,Paenibacillus, Microbacterium, Agromyces, and Nocardioides. Acidobacteria comprises members that arechemoheterotrophs (the most frequent) and photoheterotrophs, and are abundant in various terrestrialand aquatic habitats, including peatlands, acidic soils, and mineral iron-rich habitats [87].
The second category comprises bacteria that were highly abundant in xanthate-treated sampleswhile being much less abundant (less than 0.5% in general) in Ni-treated samples. The mostrepresentative are members of Proteobacteria phylum which demonstrated high abundance inxanthate-treated samples. They include the genera unclassified_f_Enterobacteriaceae, Cupriavidus,Enterobacter, Lysobacter, Microvirga, Acinetobacter, Ensifer, Pseudomonas, unclassified_f_Rhizobiaceae,and Azotobacter. Except for the Cupriavidus genus, this category of bacteria exhibited much lowerabundance (less than 1% in general) in the mixed-chemical treatments. Such a situation may indicate asynergistic toxic effect for Ni and xanthates. Similar to Bacillus members, bacteria of category 2 aregenerally multi-resistant to antibiotics [83]. A study of the resistance mechanisms could reveal theexistence or non-existence of similar natural response mechanisms to antibiotics and xanthates.
The third group was composed of bacteria which are relatively more abundant in theNi/xanthate-treated samples than in the single chemicals-treated samples. In addition to Bacillusand Cupriavidus genera, which are the most representative, other bacteria of this category includegenera Bhargavaea, Domibacillus, and Pseudomonas. Pseudomonas was more abundant at a xanthatedose of 100 µg·g−1 soil than at a xanthate dose of 50 µg·g−1 soil in the mixture. Xanthate-treatedsamples presented a similar trend. In contrast, Cupriavidus, Bacillus, and Domibacillus exhibited higherabundance in mixtures treatments containing a xanthate dose of 50 µg·g−1 soil than in those containinga xanthate dose of 100 µg·g−1 soil. Such a situation may explain that increasing the xanthate dose inthe mixture with Ni, over a certain limit, can lead to increasing the sensitivity of such bacteria.
The fourth category comprised of bacterial genera that did not show much variation betweensamples. They include, among others, norank_f_Gemmatimonadaceae, norank_f_Acidimicrobiaceae,norank_f_MSB-1E8, and norank_o_Xanthomonadales. Acidimicrobiaceae bacteria are capable of ammonium(NH4) oxidation and play an essential role in denitrification [88]. They are involved in the nitrogencycle in soil and aqueous environments, similar to Nitrosomonadaceae and Nitrospira members [89].
Sustainability 2019, 11, 3888 14 of 32
4. Conclusions
From the results of this study on the interactive effect of nickel and xanthates, PEX and SIPX,on soil bacterial community diversity and structure, all the applied doses affected, albeit differently,the soil bacterial community, particularly the community structure. Based on the diversity indices’values, xanthates can be considered as more toxic to the soil microbial community than nickel andincreasing the xanthate dose in the soil may result in higher toxic effects while the same increase in thexanthate concentration in the mixture with nickel may not necessarily lead to the magnification of thetoxicity level. The observed differences in the bacterial abundance in the presence of the same treatmentcan explain the difference in the bacterial sensitivity to the applied chemicals. Different bacterial strainscould be considered as more affected or moderately affected, or less affected by nickel, or xanthates,or their complex mixture. In the real environment, such a situation may be due to differences inthe bacterial adaptive mechanisms to these types of exposures, which may predict differences in thebacterial strain survival or adaptation in the presence of these chemicals. Analyzing the functionalabundance spectrum will provide important complementary information and extending the analysisto different sites and a wide range of chemicals and doses will allow generating rigorous statisticsand general conclusions on the interactive effect of metals and their mineral flotation collectors onthe soil microbial community. For the sustainability of mining and ore processing, the observed lessaffected or potentially resistant bacterial strains could be well explored to determine their resistancecapacity level and for their application in biomining and for the prediction and remediation of Ni andxanthate-polluted soils.
Author Contributions: P.B. designed the study, provided resources, collected data, and wrote the manuscript. Y.Z.was involved in material collection and contributed to the data analysis. H.J. supervised the study and contributedin designing the study and manuscript. All authors read and approved the final manuscript.
Funding: This research was financially supported by the Chinese Government Scholarship via the ChineseScholarship Council (CSC). The APC was funded by the Burundian Ministry of Higher Education and ScientificResearch through the supplementary scholarship to Prudence Bararunyeretse.
Acknowledgments: Authors greatly thank Weizhuo Zhang for his technical assistance.
Conflicts of Interest: The authors declare no conflict of interest.
Sustainability 2019, 11, 3888 15 of 32
Appendix ASustainability 2019, 11, x FOR PEER REVIEW 17 of 37
Figure A1. Hierarchically clustered heatmap of distribution for the 40 major bacterial families from different samples: Control sample (C) and samples treated with single nickel (Ni), PEX (PEXa, PEXb), SIPX (SIPXa and SIPXb) and the mixtures of Ni and PEX (M1a and M1b) and PEX (M2a and M2b). Rows and columns stand for each bacterial family and sample, respectively. The relative abundance for each bacterial family was depicted by color intensity as shown at the right of the figure. See Table 1 for sample codes.
Figure A1. Hierarchically clustered heatmap of distribution for the 40 major bacterial families fromdifferent samples: Control sample (C) and samples treated with single nickel (Ni), PEX (PEXa, PEXb),SIPX (SIPXa and SIPXb) and the mixtures of Ni and PEX (M1a and M1b) and PEX (M2a and M2b).Rows and columns stand for each bacterial family and sample, respectively. The relative abundance foreach bacterial family was depicted by color intensity as shown at the right of the figure. See Table 1 forsample codes.

Sustainability 2019, 11, 3888 16 of 32Sustainability 2019, 11, x FOR PEER REVIEW 18 of 37
Figure A2. Cont.
Sustainability 2019, 11, 3888 17 of 32Sustainability 2019, 11, x FOR PEER REVIEW 19 of 37
Figure A2. Student’s t-test bar plot representing the 60 most abundant and significantly different genera between samples treated with xanthate dose of 50 µg·g−1 soil (Xa) and their corresponding mixture with Ni (300 µg·g−1 soil) (Ma). Each category is made of four samples). The proportion of the represented genera is 0.58–7.60% (A), 0.23–0.58% (B), 0.12–0.23% (C), and less than 0.12% (D).
Figure A2. Student’s t-test bar plot representing the 60 most abundant and significantly differentgenera between samples treated with xanthate dose of 50 µg·g−1 soil (Xa) and their correspondingmixture with Ni (300 µg·g−1 soil) (Ma). Each category is made of four samples). The proportion of therepresented genera is 0.58–7.60% (A), 0.23–0.58% (B), 0.12–0.23% (C), and less than 0.12% (D).

Sustainability 2019, 11, 3888 18 of 32Sustainability 2019, 11, x FOR PEER REVIEW 20 of 37
Figure A3. Student’s t-test bar plot representing the significantly different genera between samples treated with a xanthate dose of 100 µg·g−1 soil (Xb) and their corresponding mixtures with Ni (300 µg·g−1 soil) (Mb). Each category is made of four samples. The proportion of the represented genera is 0.010–7.30% (A) and less than 0.010 (B).
Figure A3. Student’s t-test bar plot representing the significantly different genera between samplestreated with a xanthate dose of 100 µg·g−1 soil (Xb) and their corresponding mixtures with Ni(300 µg·g−1 soil) (Mb). Each category is made of four samples. The proportion of the representedgenera is 0.010–7.30% (A) and less than 0.010 (B).

Sustainability 2019, 11, 3888 19 of 32
Appendix B
Table A1. Relative abundance (Percentage of the total classified sequences for each sample) of the majorbacterial classes in the absence and presence of single and binary mixture doses of nickel and xanthates(PEX and SIPX). Control samples (CS), samples treated with 300 µg Ni g−1 soil (Ni), 50 µg PEX g−1
soil (PEXa), 100 µg PEX·g−1 soil (PEXb), 50 µg SIPX·g−1 soil (SIPXa), 100 µg SIPX g−1 soil (SIPXb) andsamples treated with binary mixtures of 300 µg Ni g−1 soil and 50 µg PEX g−1 soil (M1a), 100 µg PEX g−1
soil (M1b), 50 µg SIPX g−1 soil (M2a), and 100 µg SIPX g−1 soil (M2b).
Bacterial ClassRelative Abundance of Each Bacterial Class Per Sample
CS M1a M1b M2a M2b Ni PEXa PEXb SIPXa SIPXb
Gammaproteobacteria 14.73 25.51 42.51 10.17 17.09 2.53 29.17 50.02 30.09 43.14Bacilli 22.62 39.51 20.56 40.7 18.79 13.74 4.78 5.48 2.45 0.78
Betaproteobacteria 3.82 20.22 10.89 37.16 23.12 2.89 17.7 10.69 21.5 15.79Actinobacteria 20.74 5.74 8.78 6.04 16.31 46.63 14.16 11.19 14.42 10.94
Alphaproteobacteria 16.79 2.4 5.01 2.14 7.11 7.64 16.86 12.42 19.3 14.81Acidobacteria 6.86 2.48 4.19 0.97 6.42 10.28 6.1 2.16 3.87 5.43
Deltaproteobacteria 1.76 0.62 1.06 0.54 1.13 2 1.43 1.11 1.18 1.01Thermomicrobia 1.36 0.44 1.02 0.33 1.24 1.9 1.65 1.27 0.95 1.21
KD4-96 1.19 0.46 0.95 0.22 1.11 1.85 1.3 0.66 1.04 1.2Gemmatimonadetes 1.22 0.44 0.76 0.33 1.19 1.21 0.8 0.67 0.78 0.7
Nitrospira 1.21 0.25 0.6 0.25 0.81 1.2 0.91 0.68 0.6 0.67Sphingobacteriia 1.2 0.15 0.29 0.17 0.56 1.36 0.45 0.38 0.58 0.45
Anaerolineae 0.36 0.16 0.39 0.09 0.43 0.84 0.54 0.23 0.36 0.43Cytophagia 0.5 0.1 0.26 0.13 0.46 0.73 0.33 0.34 0.18 0.24Chloroflexia 0.51 0.11 0.22 0.09 0.33 0.53 0.44 0.33 0.37 0.36
TK10 0.39 0.11 0.27 0.09 0.34 0.51 0.37 0.25 0.29 0.29Gitt-GS-136 0.23 0.15 0.28 0.06 0.31 0.5 0.4 0.18 0.27 0.39Clostridia 2.23 0.04 0.06 0.02 0.06 0.06 0.12 0.07 0.06 0.04
S085 0.24 0.14 0.19 0.07 0.34 0.3 0.24 0.22 0.19 0.24Spartobacteria 0.13 0.14 0.27 0.03 0.29 0.39 0.18 0.05 0.07 0.2
Caldilineae: 0.28 0.07 0.17 0.04 0.2 0.25 0.23 0.17 0.16 0.2JG30-KF-CM66 0.22 0.09 0.13 0.04 0.25 0.24 0.22 0.16 0.16 0.17
Planctomycetacia 0.14 0.09 0.13 0.03 0.21 0.33 0.18 0.07 0.1 0.12unclassified_k__norank 0.12 0.07 0.14 0.03 0.16 0.21 0.14 0.1 0.12 0.13
norank_p__Tectomicrobia 0.19 0.04 0.06 0.04 0.11 0.21 0.2 0.1 0.1 0.12norank_p__Saccharibacteria 0.18 0.04 0.09 0.03 0.1 0.21 0.13 0.1 0.1 0.11norank_p__Latescibacteria 0.08 0.05 0.1 0.02 0.14 0.21 0.14 0.05 0.07 0.11
Phycisphaerae 0.09 0.04 0.09 0.03 0.11 0.15 0.13 0.08 0.09 0.1OM190 0.05 0.04 0.05 0.01 0.08 0.12 0.08 0.04 0.06 0.07
Ardenticatenia 0.08 0.01 0.01 0.01 0.03 0.14 0.06 0.05 0.05 0.07Tectomicrobia_Incertae_Sedis: 0.07 0.01 0.01 0.01 0.12 0.08 0.06 0.05 0.04
Flavobacteriia 0.03 0.02 0.03 0.01 0.03 0.04 0.03 0.03 0.12 0.05Chlamydiae 0.01 0.02 0.01 0 0.02 0.01 0.01 0.27 0.01 0.01
others 0.39 0.22 0.44 0.09 0.62 0.84 0.47 0.28 0.25 0.39
Sustainability 2019, 11, 3888 20 of 32
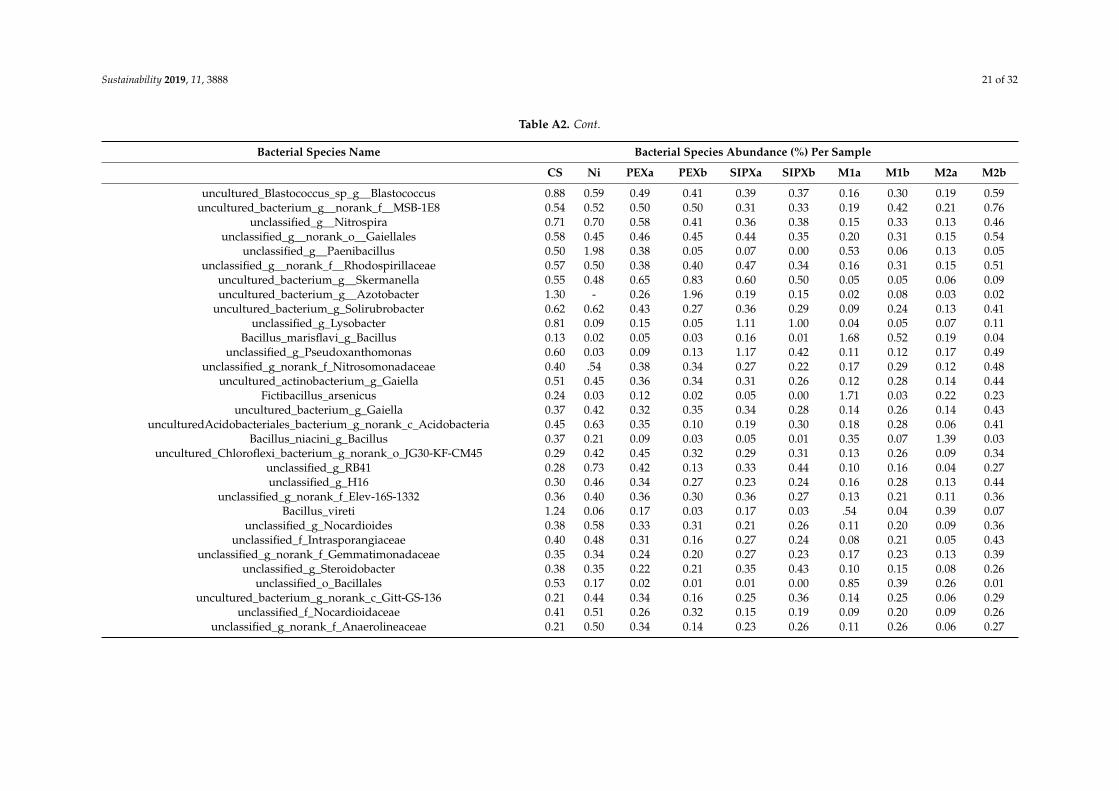
Table A2. Relative abundance (percentage of the total classified sequences for each sample) of the most representative bacterial species per sample: Control sample (C),and samples treated with single nickel (Ni), PEX (PEXa and PEXa), SIPX (SIPXa and SIPXb), and the mixtures of nickel and PEX (M1a and M1b) and SIPX (M2a andM2b). See Table 1 for sample codes.
Bacterial Species Name Bacterial Species Abundance (%) Per Sample
CS Ni PEXa PEXb SIPXa SIPXb M1a M1b M2a M2b
Cupriavidus_taiwanensis 0.53 0.03 9.47 5.81 14.2 8.06 13.3 3.41 0.95 14.85unclassified_g__Pseudomonas 0.11 0.05 1.98 3.46 0.74 1.08 1.9 37.37 7.55 12.86
Bacillus_korlensis 2.88 6.36 0.60 0.67 0.74 0.13 8.70 13.24 24.42 11.36unclassified_f__Enterobacteriaceae 1.76 0.00 11.1 27.23 5.82 13.28 0.50 1.17 0.07 0.06
unclassified_g__Microvirga 5.17 0.62 6.30 3.03 8.28 5.44 0.24 0.85 0.20 0.64Lysobacter_soli 2.15 0.16 5.34 2.67 7.83 8.25 0.85 0.50 0.95 1.00
Domibacillus_enclensis 0.15 0.33 0.06 0.03 0.00 0.00 13.4 2.19 5.69 0.34unclassified_g__Enterobacter 0.60 0.01 5.45 7.74 4.36 6.89 1.09 0.67 0.16 0.16
unclassified_g__norank_c__Acidobacteria 3.27 0.43 3.14 0.96 1.87 2.77 1.32 2.19 0.45 3.25Ralstonia_pickettii_DTP0602 0.11 0.05 3.95 1.20 2.16 3.49 3.95 0.89 3.20 4.03
Bacillus_selenatarsenatis 8.12 1.72 0.68 2.92 0.17 0.05 2.21 3.00 0.58 0.08Acinetobacter_nosocomialis 1.30 0.00 2.70 4.59 1.67 5.06 0.19 1.09 0.09 0.03
unclassified_g__Bacillus 2.46 0.49 1.08 0.75 0.22 0.06 3.70 1.40 3.27 0.45unclassified_f__Micrococcaceae 0.36 11.8 0.29 0.12 0.35 0.24 0.18 0.27 0.09 0.54
unclassified_g__Cupriavidus 0.19 0.01 1.26 0.53 1.21 1.29 1.94 0.77 2.37 1.45Bacillus_idriensis 2.80 0.61 0.56 0.24 0.23 0.09 2.16 1.05 1.46 0.66
Lysobacter_dokdonensis_DS-58 1.68 0.33 0.22 0.16 3.89 4.03 0.06 0.11 0.03 0.15unclassified_g__Pseudarthrobacter 0.79 4.71 0.62 0.27 0.75 0.60 0.37 0.73 0.23 1.17
unclassified_g__Isoptericola 1.29 7.15 0.24 0.21 0.66 0.17 0.17 0.06 0.10 0.14unclassified_g__Sphingomonas 3.27 0.92 0.45 0.45 1.99 1.17 0.19 0.38 0.18 0.71unclassified_g__Streptomyces 0.81 2.02 1.07 0.31 1.55 0.43 0.18 0.29 0.19 0.50
uncultured_bacterium_g__norank_c__KD4-96 0.90 1.36 0.94 0.47 0.77 0.90 0.35 0.67 0.14 0.80unclassified_g__Bhargavaea 0.00 - - - - - 0.24 0.38 0.15 4.34
unclassified_g__norank_c__Actinobacteria 0.44 0.76 0.58 0.28 0.57 0.57 0.31 0.52 0.12 0.64Ensifer_adhaerens_g__Ensifer 0.38 0.17 1.49 1.23 0.59 0.68 0.05 0.14 0.04 0.15
unclassified_g__Microbacterium 0.28 0.75 0.15 0.07 0.08 0.13 0.19 0.03 1.57 0.13unclassified_g__Ensifer 0.18 0.02 1.31 0.88 1.01 1.04 0.02 0.12 0.01 0.02
uncultured_bacterium_g__norank_f__Acidimicrobiaceae 0.74 0.60 0.46 0.48 0.45 0.36 0.19 0.36 0.18 0.59unclassified_f__Rhizobiaceae 0.28 0.03 1.33 0.97 0.90 0.90 0.00 0.10 0.00 0.01
unclassified_g__norank_o__JG30-KF-CM45 0.50 0.72 0.67 0.47 0.33 0.48 0.17 0.42 0.12 0.51
Sustainability 2019, 11, 3888 21 of 32
Table A2. Cont.
Bacterial Species Name Bacterial Species Abundance (%) Per Sample
CS Ni PEXa PEXb SIPXa SIPXb M1a M1b M2a M2b
uncultured_Blastococcus_sp_g__Blastococcus 0.88 0.59 0.49 0.41 0.39 0.37 0.16 0.30 0.19 0.59uncultured_bacterium_g__norank_f__MSB-1E8 0.54 0.52 0.50 0.50 0.31 0.33 0.19 0.42 0.21 0.76
unclassified_g__Nitrospira 0.71 0.70 0.58 0.41 0.36 0.38 0.15 0.33 0.13 0.46unclassified_g__norank_o__Gaiellales 0.58 0.45 0.46 0.45 0.44 0.35 0.20 0.31 0.15 0.54
unclassified_g__Paenibacillus 0.50 1.98 0.38 0.05 0.07 0.00 0.53 0.06 0.13 0.05unclassified_g__norank_f__Rhodospirillaceae 0.57 0.50 0.38 0.40 0.47 0.34 0.16 0.31 0.15 0.51
uncultured_bacterium_g__Skermanella 0.55 0.48 0.65 0.83 0.60 0.50 0.05 0.05 0.06 0.09uncultured_bacterium_g__Azotobacter 1.30 - 0.26 1.96 0.19 0.15 0.02 0.08 0.03 0.02
uncultured_bacterium_g_Solirubrobacter 0.62 0.62 0.43 0.27 0.36 0.29 0.09 0.24 0.13 0.41unclassified_g_Lysobacter 0.81 0.09 0.15 0.05 1.11 1.00 0.04 0.05 0.07 0.11
Bacillus_marisflavi_g_Bacillus 0.13 0.02 0.05 0.03 0.16 0.01 1.68 0.52 0.19 0.04unclassified_g_Pseudoxanthomonas 0.60 0.03 0.09 0.13 1.17 0.42 0.11 0.12 0.17 0.49
unclassified_g_norank_f_Nitrosomonadaceae 0.40 .54 0.38 0.34 0.27 0.22 0.17 0.29 0.12 0.48uncultured_actinobacterium_g_Gaiella 0.51 0.45 0.36 0.34 0.31 0.26 0.12 0.28 0.14 0.44
Fictibacillus_arsenicus 0.24 0.03 0.12 0.02 0.05 0.00 1.71 0.03 0.22 0.23uncultured_bacterium_g_Gaiella 0.37 0.42 0.32 0.35 0.34 0.28 0.14 0.26 0.14 0.43
unculturedAcidobacteriales_bacterium_g_norank_c_Acidobacteria 0.45 0.63 0.35 0.10 0.19 0.30 0.18 0.28 0.06 0.41Bacillus_niacini_g_Bacillus 0.37 0.21 0.09 0.03 0.05 0.01 0.35 0.07 1.39 0.03
uncultured_Chloroflexi_bacterium_g_norank_o_JG30-KF-CM45 0.29 0.42 0.45 0.32 0.29 0.31 0.13 0.26 0.09 0.34unclassified_g_RB41 0.28 0.73 0.42 0.13 0.33 0.44 0.10 0.16 0.04 0.27unclassified_g_H16 0.30 0.46 0.34 0.27 0.23 0.24 0.16 0.28 0.13 0.44
unclassified_g_norank_f_Elev-16S-1332 0.36 0.40 0.36 0.30 0.36 0.27 0.13 0.21 0.11 0.36Bacillus_vireti 1.24 0.06 0.17 0.03 0.17 0.03 .54 0.04 0.39 0.07
unclassified_g_Nocardioides 0.38 0.58 0.33 0.31 0.21 0.26 0.11 0.20 0.09 0.36unclassified_f_Intrasporangiaceae 0.40 0.48 0.31 0.16 0.27 0.24 0.08 0.21 0.05 0.43
unclassified_g_norank_f_Gemmatimonadaceae 0.35 0.34 0.24 0.20 0.27 0.23 0.17 0.23 0.13 0.39unclassified_g_Steroidobacter 0.38 0.35 0.22 0.21 0.35 0.43 0.10 0.15 0.08 0.26
unclassified_o_Bacillales 0.53 0.17 0.02 0.01 0.01 0.00 0.85 0.39 0.26 0.01uncultured_bacterium_g_norank_c_Gitt-GS-136 0.21 0.44 0.34 0.16 0.25 0.36 0.14 0.25 0.06 0.29
unclassified_f_Nocardioidaceae 0.41 0.51 0.26 0.32 0.15 0.19 0.09 0.20 0.09 0.26unclassified_g_norank_f_Anaerolineaceae 0.21 0.50 0.34 0.14 0.23 0.26 0.11 0.26 0.06 0.27

Sustainability 2019, 11, 3888 22 of 32
Table A2. Cont.
Bacterial Species Name Bacterial Species Abundance (%) Per Sample
CS Ni PEXa PEXb SIPXa SIPXb M1a M1b M2a M2b
Agromyces_ulmi 0.79 0.68 0.22 0.15 0.22 0.13 0.04 0.06 0.03 0.13unclassified_g_norank_o_Xanthomonadales 0.31 0.30 0.25 0.19 0.21 0.23 0.13 0.22 0.10 0.37
uncultured_Rubrobacterales_bacterium_g_Gaiella 0.40 0.33 0.22 0.23 0.27 0.22 0.10 0.17 0.09 0.30uncultured_soil_bacterium_g_norank_c_Actinobacteria 0.24 0.34 0.27 0.12 0.31 0.24 0.20 0.22 0.05 0.27
unclassified_g_Brevibacillus 0.12 0.28 0.02 0.01 0.03 0.01 0.57 0.18 0.58 0.21uncultured_Gemmatimonadales_bacterium_g_norank 0.30 0.29 0.21 0.20 0.24 0.18 0.13 0.25 0.09 0.36
uncultured_bacterium_g_norank_o_JG30-KF-CM45 0.28 0.43 0.29 0.28 0.18 0.24 0.07 0.19 0.06 0.23unclassified_g_norank_o_Acidimicrobiales 0.33 0.30 0.25 0.26 0.22 0.19 0.10 0.17 0.09 0.33
unclassified_g_Microlunatus 0.32 0.28 0.25 0.25 0.29 0.20 0.09 0.16 0.09 0.30uncultured_actinobacterium_g_norank 0.32 0.29 0.25 0.24 0.24 0.16 0.09 0.16 0.08 0.32
unclassified_g_Achromobacter 0.06 0.01 0.47 1.08 0.09 0.14 0.09 0.11 0.04 0.10uncultured_Burkholderiales_bacterium_g_norank_f_Nitrosomonadaceae 0.25 0.31 0.19 0.19 0.26 0.16 0.10 0.22 0.08 0.31
uncultured_Acidobacteria_bacterium_g_norank_c_Acidobacteria 0.27 0.39 0.31 0.09 0.12 0.21 0.10 0.17 0.03 0.32uncultured_bacterium_g_norank_f_288-2 0.32 0.25 0.26 0.21 0.24 0.17 0.07 0.15 0.08 0.26
unclassified_f_Comamonadaceae 0.32 0.32 0.15 0.15 0.21 0.19 0.07 0.18 0.06 0.24unclassified_g_Mycobacterium 0.26 0.28 0.19 0.18 0.24 0.15 0.09 0.14 0.06 0.20
uncultured_Rhodoplanes_sp._g_Variibacter 0.28 0.25 0.13 0.16 0.18 0.17 0.10 0.16 0.08 0.26Rhizobium_giardinii_g__Rhizobium 0.11 0.09 0.45 0.45 0.29 0.26 0.02 0.06 0.02 0.07
unclassified_g_norank_c_TK10 0.23 0.30 0.22 0.16 0.19 0.19 0.07 0.15 0.05 0.19Azotobacter_beijerinckii 0.04 0.00 0.32 0.25 0.40 0.46 0.06 0.12 0.02 0.01
uncultured_Actinomycetales_bacterium_g_norank_f_OM1_clade 0.19 0.22 0.18 0.15 0.14 0.12 0.09 0.18 0.08 0.27Agromyces_indicus 0.69 0.78 0.04 0.04 0.06 0.04 .00 0.01 0.00 0.03
Variovorax_soli 0.12 0.10 0.16 0.08 0.60 0.38 0.04 0.07 0.01 0.05unclassified_g_norank_c_KD4-96 0.17 0.28 0.22 0.09 0.17 0.16 0.07 0.17 0.04 0.18
unclassified_g_Iamia 0.23 0.20 0.16 0.18 0.15 0.15 0.06 0.14 0.06 0.22uncultured_Thermomonas_sp._g_Lysobacter 0.62 0.11 0.06 0.05 0.31 0.31 0.02 0.03 0.01 0.07
uncultured_bacterium_g_norank_f_Intrasporangiaceae 0.44 0.34 0.14 0.10 0.13 0.10 0.05 0.07 0.04 0.13uncultured_bacterium_g_norank_o_Gaiellales 0.21 0.17 0.18 0.15 0.15 0.12 0.06 0.13 0.07 0.25
uncultured_Beijerinckiaceae_bacterium_g_Microvirga 0.20 0.19 0.16 0.16 0.14 0.15 0.06 0.15 0.06 0.21uncultured_actinobacterium_g_Micromonospora 0.21 0.21 0.18 0.15 0.11 0.13 0.07 0.14 0.06 0.19
Lysobacter_yangpyeongensis 0.57 0.01 0.07 0.01 0.61 0.14 0.03 0.00 0.05 0.02

Sustainability 2019, 11, 3888 23 of 32
Table A2. Cont.
Bacterial Species Name Bacterial Species Abundance (%) Per Sample
CS Ni PEXa PEXb SIPXa SIPXb M1a M1b M2a M2b
Micromonospora_chokoriensis 0.15 0.14 0.18 0.15 0.15 0.10 0.10 0.20 0.07 0.21uncultured_Actinomycetales_bacterium_g_norank_c_Actinobacteria 0.12 0.21 0.19 0.09 0.18 0.17 0.12 0.14 0.03 0.20
unclassified_g_norank_f_Xanthomonadales_Incertae_Sedis 0.27 0.22 0.10 0.08 0.20 0.16 0.05 0.12 0.04 0.21uncultured_bacterium_g_Candidatus_Xiphinematobacter 0.08 0.31 0.14 0.04 0.06 0.16 0.11 0.22 0.02 0.25
unclassified_g_Lysinibacillus 0.59 0.00 0.03 0.02 0.02 0.00 0.22 0.08 0.35 0.03uncultured_proteobacterium_g_Acidibacter 0.18 0.24 0.14 0.12 0.14 0.18 0.07 0.09 0.06 0.17
uncultured_bacterium_g_Ilumatobacter 0.21 0.19 0.14 0.16 0.15 0.12 0.06 0.11 0.06 0.18Sphingomonas_leidyi 0.31 0.12 0.08 0.10 0.30 0.27 0.04 0.06 0.03 0.10
bacterium_WX65 0.26 0.20 0.16 0.16 0.10 0.13 0.04 0.13 0.04 0.16uncultured_Pseudoxanthomonas_sp._g_norank 0.19 0.18 0.12 0.12 0.14 0.12 0.08 0.13 0.07 0.21
unclassified_g_norank_f_Rhodobiaceae 0.17 0.16 0.12 0.14 0.14 0.10 0.08 0.13 0.07 0.22Nocardioides_terrigena 0.16 0.31 0.13 0.17 0.07 0.11 0.04 0.10 0.07 0.18
unclassified_g_Bradyrhizobium 0.27 0.25 0.07 0.05 0.18 0.12 .06 0.10 0.04 0.18unclassified_g_norank_f_Alcaligenaceae 0.23 0.22 0.13 0.12 0.16 0.12 0.04 0.09 0.04 0.17
uncultured_bacterium_g_norank_o_SC-I-84 0.25 0.15 0.11 0.09 0.12 0.10 0.06 0.15 0.03 0.24Acidobacteria_bacterium_CB_286306 0.15 0.29 0.21 0.05 0.10 0.14 0.06 0.12 0.04 0.14
unclassified_g_Gracilibacillus 0.01 0.08 0.01 - 0.00 0.00 0.17 0.00 0.69 0.09unclassified_k_norank 0.12 0.21 0.14 0.10 0.12 0.13 0.07 0.14 0.03 0.16
Bacillus_litoralis_g__Bacillus 0.85 .04 0.05 0.05 0.04 0.03 0.10 0.03 0.02 0.06unclassified_g__Streptococcus 0.01 0.01 0.00 0.00 0.00 0.21 0.33 0.22 0.10 0.20
Massilia_timonae 0.06 0.03 0.07 0.08 0.51 0.38 0.03 0.01 0.01 0.02unclassified_g_norank_f_Acidimicrobiaceae 0.17 0.16 0.13 0.12 0.10 0.08 0.05 0.10 0.04 0.21
Agrococcus_jenensis 0.11 0.43 0.11 0.08 0.10 0.09 0.03 0.07 0.03 0.12uncultured_bacterium_g_Microlunatus 0.24 0.21 0.14 0.09 0.13 0.12 0.04 0.05 0.03 0.12
unclassified_g_Ramlibacter 0.26 0.14 0.10 0.05 0.16 0.11 0.06 0.09 0.03 0.14uncultured_Chloroflexi_bacterium_g_norank_c_KD4-96 0.13 0.21 0.14 0.09 0.10 0.14 0.05 0.10 0.03 0.14
unclassified_g_Blastococcus 0.28 0.15 0.12 0.11 0.10 0.12 0.03 0.07 0.05 0.10uncultured_Rhodobiaceae_bacterium_g_norank_f_Rhodobiaceae 0.14 0.13 0.11 0.10 0.12 0.07 0.08 0.14 0.05 0.18
unclassified_g_Massilia 0.02 0.02 0.15 0.13 0.39 0.25 0.08 0.00 0.01 0.08uncultured_bacterium_g_norank_f_Elev-16S-1332 0.16 0.16 0.12 0.12 0.13 0.09 0.04 0.06 0.04 0.19

Sustainability 2019, 11, 3888 24 of 32
Table A2. Cont.
Bacterial Species Name Bacterial Species Abundance (%) Per Sample
CS Ni PEXa PEXb SIPXa SIPXb M1a M1b M2a M2b
uncultured_bacterium_g_Roseiflexus 0.19 0.17 0.14 0.13 0.14 0.11 0.02 0.06 0.03 0.11unclassified_g_Candidatus_Alysiosphaera 0.18 0.17 0.16 0.13 0.09 0.09 0.03 0.06 0.04 0.13
Solibacillus_silvestris_StLB046 0.04 - 0.00 0.01 0.00 - 0.67 0.12 0.02 0.00uncultured_soil_bacterium_g_norank_c_S085 0.13 0.15 0.12 0.09 0.08 0.11 0.07 0.10 0.04 0.14
unclassified_g_Roseiflexus 0.11 0.17 0.15 0.12 0.12 0.12 0.03 0.08 0.03 0.09Bacillus_humi 0.23 0.02 0.01 0.02 0.01 0.00 0.43 0.04 0.11 0.02
Acidobacteria_bacterium_LWH4 0.21 0.24 0.12 0.03 0.07 0.15 0.05 0.04 0.01 0.09uncultured_bacterium_g_Chryseolinea 0.09 0.19 0.12 0.16 0.06 0.08 0.02 0.08 0.03 0.18
unclassified_f_Oxalobacteraceae 0.04 0.01 0.28 0.05 0.29 0.24 0.01 0.03 0.01 0.03unclassified_f_Rhodobacteraceae 0.22 0.11 0.10 0.09 0.10 0.09 0.05 0.06 0.03 0.13
uncultured_bacterium_g_norank_f_0319-6M6 0.15 0.12 0.09 0.11 0.09 0.08 0.04 0.09 0.03 0.13unclassified_g_norank_o_TRA3-20 0.13 0.14 0.09 0.09 0.08 0.08 0.04 0.11 0.02 0.11
uncultured_bacterium_g_G55 0.12 0.13 0.12 0.10 0.09 0.10 0.05 0.06 0.04 0.11unclassified_g_norank_o_AKYG1722 0.13 0.15 0.13 0.12 0.07 0.08 0.04 0.07 0.04 0.07
uncultured_soil_bacterium_g_norank_f_Caldilineaceae 0.14 0.09 0.14 0.07 0.08 0.09 0.05 0.08 0.03 0.10unclassified_g_Pantoea 0.03 - 0.14 0.40 0.11 0.17 0.01 0.03 - 0.01
uncultured_Burkholderiaceae_bacterium_g_norank_f_Nitrosomonadaceae 0.10 0.15 0.09 0.06 0.10 0.06 0.04 0.09 0.04 0.11unclassified_g_norank_f_Cytophagaceae 0.11 0.22 0.08 0.06 0.05 0.06 0.02 0.09 0.04 0.12
uncultured_bacterium_g_norank_p_Tectomicrobia 0.15 0.15 0.13 0.07 0.08 0.10 0.03 0.04 0.02 0.08uncultured_bacterium_g_Ammoniphilus 0.07 0.02 0.04 0.01 0.01 0.01 0.29 0.21 0.08 0.01
uncultured_Acidobacteria_bacterium_g_norank_f_Blastocatellaceae_Subgroup_4_ 0.20 0.17 0.05 0.03 0.06 0.08 0.04 0.08 0.01 0.14Cellulomonas_fimi 0.15 0.37 0.06 0.03 0.06 0.04 0.01 0.03 0.02 0.05
unclassified_g_Pedomicrobium 0.13 0.09 0.07 0.08 0.08 0.06 0.04 0.08 0.04 0.12uncultured_Caulobacteraceae_bacterium_g_Phenylobacterium 0.04 0.01 0.22 0.06 0.27 0.13 0.01 0.02 0.01 0.03
unclassified_g_Solirubrobacter 0.19 0.14 0.09 0.08 0.07 0.09 0.02 0.06 0.02 0.04uncultured_bacterium_g_norank_o_Acidimicrobiales 0.15 0.11 0.08 0.09 0.07 0.06 0.03 0.08 0.03 0.10
uncultured_bacterium_g_Phenylobacterium 0.15 0.08 0.06 0.05 0.15 0.12 0.02 0.06 0.02 0.07uncultured_Hyphomicrobiaceae_bacterium_g_Hyphomicrobium 0.10 0.08 0.07 0.07 0.07 0.06 0.04 0.08 0.04 0.14
unclassified_g_Cellulomonas 0.14 0.38 0.06 0.02 0.05 0.04 0.01 0.01 0.01 0.04Nocardioides_exalbidus 0.06 0.22 0.07 0.09 0.07 0.07 0.02 0.03 0.02 0.08

Sustainability 2019, 11, 3888 25 of 32
Table A2. Cont.
Bacterial Species Name Bacterial Species Abundance (%) Per Sample
CS Ni PEXa PEXb SIPXa SIPXb M1a M1b M2a M2b
Paenibacillus_sp._Y412MC10 0.01 0.07 0.17 0.11 0.13 0.02 0.03 0.03 0.12 0.01uncultured_Actinomycetales_bacterium_g_Rubrobacter 0.15 0.07 0.10 0.06 0.06 0.07 0.03 0.06 0.03 0.09
uncultured_Geoalkalibacter_sp._g_norank_c_Acidobacteria 0.08 0.11 0.11 0.05 0.04 0.07 0.05 0.09 0.02 0.09uncultured_bacterium_gp6 0.08 0.13 0.08 0.03 0.08 0.07 0.04 0.07 0.01 0.11
uncultured_candidate_division_SPAM_bacterium 0.12 0.14 0.07 0.05 0.05 0.06 0.03 0.07 0.03 0.08unclassified_g_Phyllobacterium 0.06 .09 0.10 0.14 0.07 0.10 .03 0.04 0.02 0.04
unclassified_g_Arenimonas 0.39 0.09 0.02 0.03 0.04 0.04 .01 0.03 0.02 0.06unclassified_g_norank_c_JG30-KF-CM66 0.09 0.10 0.09 0.06 0.07 0.06 0.04 0.04 0.02 0.10
unclassified_f_Propionibacteriaceae 0.11 0.11 0.07 0.08 0.07 0.06 0.03 0.06 0.02 0.08unclassified_g_Pseudonocardia 0.11 0.07 0.06 0.05 0.08 0.06 0.04 0.07 0.04 0.09
unclassified_g_Microbispora 0.06 0.05 0.08 0.07 0.08 0.05 0.04 0.09 0.03 0.12uncultured_Acidimicrobidae_bacterium_g_norank_o_Acidimicrobiale 0.11 0.10 0.07 0.06 0.07 0.08 0.02 0.04 0.03 0.09
unclassified_g_norank_f_Ellin6055 0.23 0.10 0.05 0.07 0.08 0.06 0.01 0.03 0.02 0.05unclassified_g_Rubrobacter 0.05 0.09 0.11 0.04 0.10 0.08 0.03 0.05 0.01 0.08unclassified_g_Cronobacter 0.02 0.17 0.15 0.22 0.16 0.12 0.01 0.01 - -
uncultured_bacterium_g_norank_f_Planctomycetaceae 0.06 0.09 0.07 0.03 0.05 0.06 0.05 0.06 0.01 0.08uncultured_bacterium_g_Candidatus_Alysiosphaera 0.08 - 0.12 0.08 0.06 0.06 0.02 0.03 0.03 0.07
Rhizobium_pusense 0.06 0.02 0.13 0.16 0.14 0.12 0.01 0.01 0.00 0.00Lysobacter_daejeonensis 0.54 0.00 .00 0.00 0.06 0.07 0.00 0.00 0.00 0.00
unclassified_o_Acidimicrobiales 0.10 0.09 0.08 0.06 0.06 0.05 0.03 0.04 0.02 0.10Agromyces_ramosus 0.13 0.18 0.07 0.05 0.06 0.04 0.01 0.03 0.01 0.04
unclassified_f_Pseudomonadaceae 0.35 0.00 0.00 0.03 0.05 0.02 0.00 0.11 0.06 0.01uncultured_bacterium_g_Amaricoccus 0.12 0.08 0.06 0.06 0.09 0.06 0.03 0.05 0.01 0.07unclassified_g_norank_f_OM1_clade 0.06 0.08 0.05 0.07 0.06 0.06 0.04 0.06 0.03 0.10
uncultured_bacterium_g_Methylibium 0.09 0.05 0.12 0.06 0.11 0.10 0.02 0.02 0.01 0.05uncultured_bacterium_g_Vicinamibacter 0.11 0.13 0.06 0.01 0.08 0.07 0.02 0.04 0.02 0.07
unclassified_g_Paracoccus 0.08 0.05 0.06 0.05 0.17 0.16 0.00 0.03 0.00 0.01uncultured_Bacteroidetes_bacterium_g_norank_f_Chitinophagaceae 0.18 0.14 0.05 0.04 0.05 0.03 0.00 0.03 0.02 0.06
Sphingobacterium_sp._21 0.02 0.55 0.00 - 0.01 0.01 - - 0.00 -wastewater_metagenome_g_norank_c_Acidobacteria 0.08 0.13 0.07 0.03 0.06 0.06 0.02 0.06 0.01 0.07
unclassified_f_Micromonosporaceae 0.06 0.06 0.05 0.06 0.06 0.04 0.04 0.07 0.03 0.11
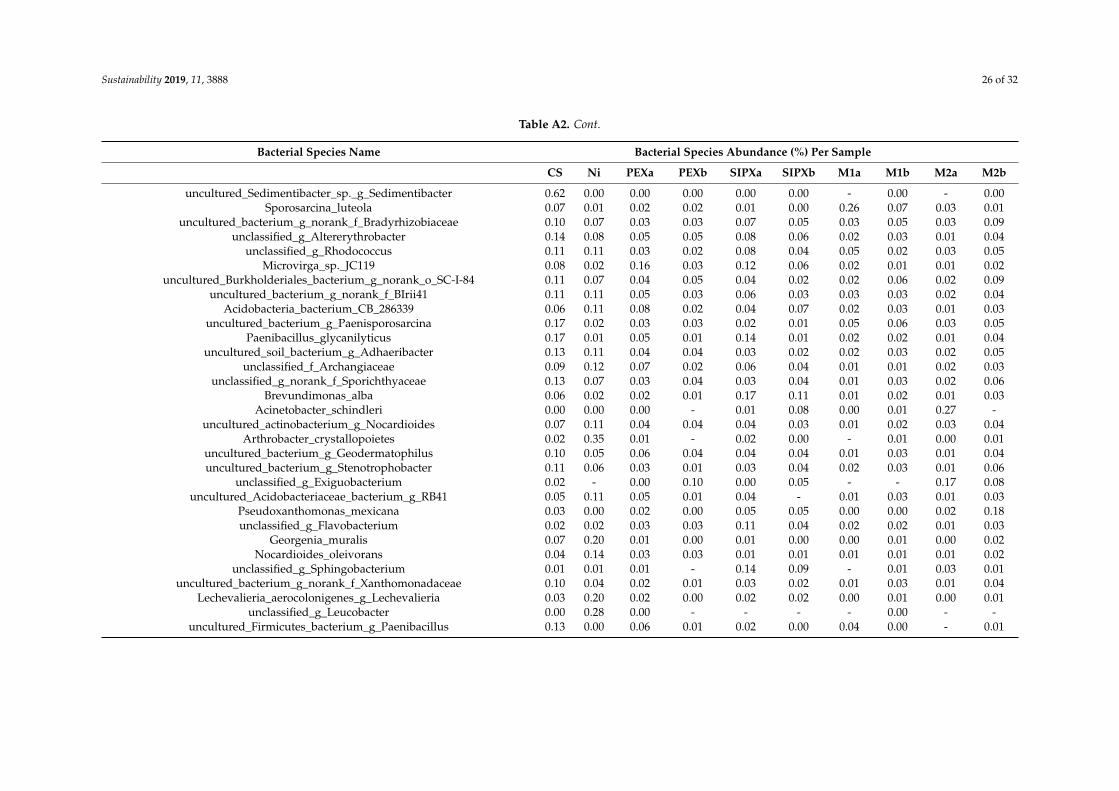
Sustainability 2019, 11, 3888 26 of 32
Table A2. Cont.
Bacterial Species Name Bacterial Species Abundance (%) Per Sample
CS Ni PEXa PEXb SIPXa SIPXb M1a M1b M2a M2b
uncultured_Sedimentibacter_sp._g_Sedimentibacter 0.62 0.00 0.00 0.00 0.00 0.00 - 0.00 - 0.00Sporosarcina_luteola 0.07 0.01 0.02 0.02 0.01 0.00 0.26 0.07 0.03 0.01
uncultured_bacterium_g_norank_f_Bradyrhizobiaceae 0.10 0.07 0.03 0.03 0.07 0.05 0.03 0.05 0.03 0.09unclassified_g_Altererythrobacter 0.14 0.08 0.05 0.05 0.08 0.06 0.02 0.03 0.01 0.04
unclassified_g_Rhodococcus 0.11 0.11 0.03 0.02 0.08 0.04 0.05 0.02 0.03 0.05Microvirga_sp._JC119 0.08 0.02 0.16 0.03 0.12 0.06 0.02 0.01 0.01 0.02
uncultured_Burkholderiales_bacterium_g_norank_o_SC-I-84 0.11 0.07 0.04 0.05 0.04 0.02 0.02 0.06 0.02 0.09uncultured_bacterium_g_norank_f_BIrii41 0.11 0.11 0.05 0.03 0.06 0.03 0.03 0.03 0.02 0.04
Acidobacteria_bacterium_CB_286339 0.06 0.11 0.08 0.02 0.04 0.07 0.02 0.03 0.01 0.03uncultured_bacterium_g_Paenisporosarcina 0.17 0.02 0.03 0.03 0.02 0.01 0.05 0.06 0.03 0.05
Paenibacillus_glycanilyticus 0.17 0.01 0.05 0.01 0.14 0.01 0.02 0.02 0.01 0.04uncultured_soil_bacterium_g_Adhaeribacter 0.13 0.11 0.04 0.04 0.03 0.02 0.02 0.03 0.02 0.05
unclassified_f_Archangiaceae 0.09 0.12 0.07 0.02 0.06 0.04 0.01 0.01 0.02 0.03unclassified_g_norank_f_Sporichthyaceae 0.13 0.07 0.03 0.04 0.03 0.04 0.01 0.03 0.02 0.06
Brevundimonas_alba 0.06 0.02 0.02 0.01 0.17 0.11 0.01 0.02 0.01 0.03Acinetobacter_schindleri 0.00 0.00 0.00 - 0.01 0.08 0.00 0.01 0.27 -
uncultured_actinobacterium_g_Nocardioides 0.07 0.11 0.04 0.04 0.04 0.03 0.01 0.02 0.03 0.04Arthrobacter_crystallopoietes 0.02 0.35 0.01 - 0.02 0.00 - 0.01 0.00 0.01
uncultured_bacterium_g_Geodermatophilus 0.10 0.05 0.06 0.04 0.04 0.04 0.01 0.03 0.01 0.04uncultured_bacterium_g_Stenotrophobacter 0.11 0.06 0.03 0.01 0.03 0.04 0.02 0.03 0.01 0.06
unclassified_g_Exiguobacterium 0.02 - 0.00 0.10 0.00 0.05 - - 0.17 0.08uncultured_Acidobacteriaceae_bacterium_g_RB41 0.05 0.11 0.05 0.01 0.04 - 0.01 0.03 0.01 0.03
Pseudoxanthomonas_mexicana 0.03 0.00 0.02 0.00 0.05 0.05 0.00 0.00 0.02 0.18unclassified_g_Flavobacterium 0.02 0.02 0.03 0.03 0.11 0.04 0.02 0.02 0.01 0.03
Georgenia_muralis 0.07 0.20 0.01 0.00 0.01 0.00 0.00 0.01 0.00 0.02Nocardioides_oleivorans 0.04 0.14 0.03 0.03 0.01 0.01 0.01 0.01 0.01 0.02
unclassified_g_Sphingobacterium 0.01 0.01 0.01 - 0.14 0.09 - 0.01 0.03 0.01uncultured_bacterium_g_norank_f_Xanthomonadaceae 0.10 0.04 0.02 0.01 0.03 0.02 0.01 0.03 0.01 0.04
Lechevalieria_aerocolonigenes_g_Lechevalieria 0.03 0.20 0.02 0.00 0.02 0.02 0.00 0.01 0.00 0.01unclassified_g_Leucobacter 0.00 0.28 0.00 - - - - 0.00 - -
uncultured_Firmicutes_bacterium_g_Paenibacillus 0.13 0.00 0.06 0.01 0.02 0.00 0.04 0.00 - 0.01
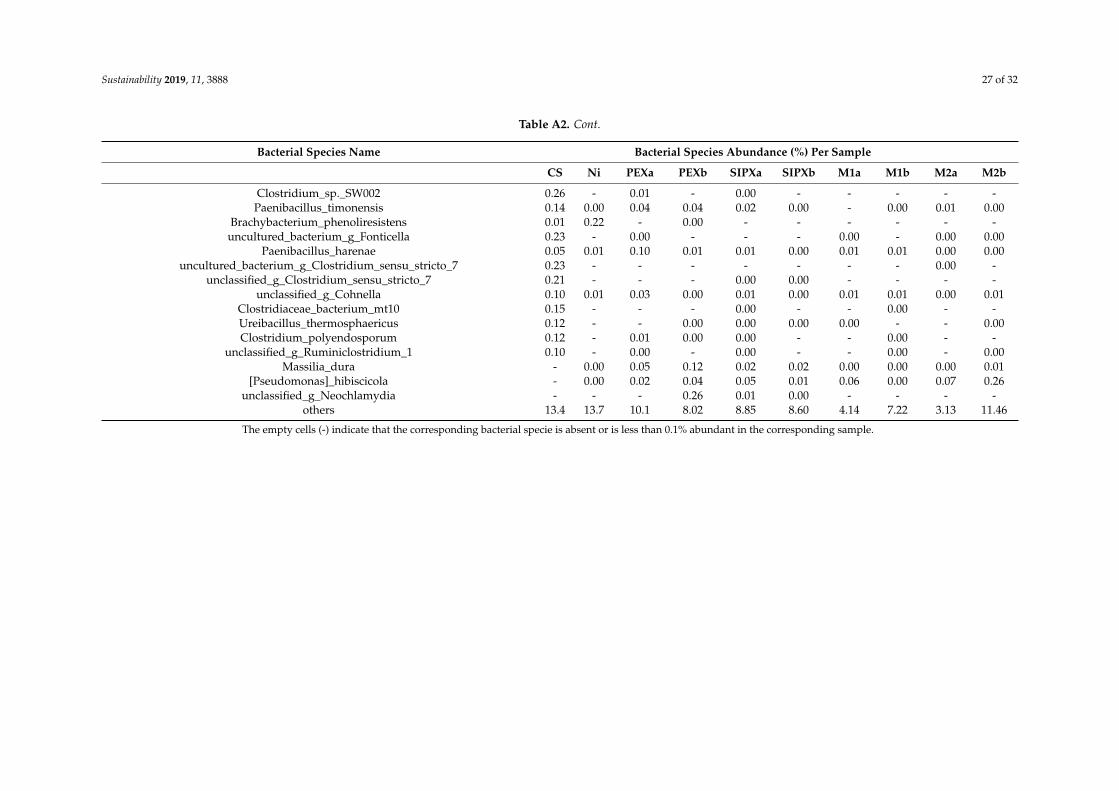
Sustainability 2019, 11, 3888 27 of 32
Table A2. Cont.
Bacterial Species Name Bacterial Species Abundance (%) Per Sample
CS Ni PEXa PEXb SIPXa SIPXb M1a M1b M2a M2b
Clostridium_sp._SW002 0.26 - 0.01 - 0.00 - - - - -Paenibacillus_timonensis 0.14 0.00 0.04 0.04 0.02 0.00 - 0.00 0.01 0.00
Brachybacterium_phenoliresistens 0.01 0.22 - 0.00 - - - - - -uncultured_bacterium_g_Fonticella 0.23 - 0.00 - - - 0.00 - 0.00 0.00
Paenibacillus_harenae 0.05 0.01 0.10 0.01 0.01 0.00 0.01 0.01 0.00 0.00uncultured_bacterium_g_Clostridium_sensu_stricto_7 0.23 - - - - - - - 0.00 -
unclassified_g_Clostridium_sensu_stricto_7 0.21 - - - 0.00 0.00 - - - -unclassified_g_Cohnella 0.10 0.01 0.03 0.00 0.01 0.00 0.01 0.01 0.00 0.01
Clostridiaceae_bacterium_mt10 0.15 - - - 0.00 - - 0.00 - -Ureibacillus_thermosphaericus 0.12 - - 0.00 0.00 0.00 0.00 - - 0.00Clostridium_polyendosporum 0.12 - 0.01 0.00 0.00 - - 0.00 - -
unclassified_g_Ruminiclostridium_1 0.10 - 0.00 - 0.00 - - 0.00 - 0.00Massilia_dura - 0.00 0.05 0.12 0.02 0.02 0.00 0.00 0.00 0.01
[Pseudomonas]_hibiscicola - 0.00 0.02 0.04 0.05 0.01 0.06 0.00 0.07 0.26unclassified_g_Neochlamydia - - - 0.26 0.01 0.00 - - - -
others 13.4 13.7 10.1 8.02 8.85 8.60 4.14 7.22 3.13 11.46
The empty cells (-) indicate that the corresponding bacterial specie is absent or is less than 0.1% abundant in the corresponding sample.

Sustainability 2019, 11, 3888 28 of 32
References
1. Dixit, R.; Malaviya, D.; Pandiyan, K.; Singh, U.; Sahu, A.; Shukla, R.; Singh, B.; Rai, J.; Sharma, P.; Lade, H.Bioremediation of heavy metals from soil and aquatic environment: An overview of principles and criteriaof fundamental processes. Sustainability 2015, 7, 2189–2212. [CrossRef]
2. Rong, X.-M.; Huang, Q.-Y.; Jiang, D.-H.; Cai, P.; Liang, W. Isothermal Microcalorimetry: A Review ofApplications in Soil and Environmental Sciences. Pedosphere 2007, 17, 137–145. [CrossRef]
3. Gadd, G.M. Metals, minerals and microbes: Geomicrobiology and bioremediation. Microbiology 2010, 156,609–643. [CrossRef] [PubMed]
4. Chakraborty, S.; Saha, N.; Roy, S.S. Role of microbes in soil formation and aggregation. Innov. Farm. 2016, 1,11–14.
5. Aislabie, J.; Deslippe, J.R.; Dymond, J. Soil microbes and their contribution to soil services. In EcosystemServices in New Zealand—Conditions and Trends; Manaaki Whenua Press: Lincoln, New Zealand, 2013;pp. 143–161.
6. Harasim, P.; Filipek, T.; Harasim, P. Nickel in the environment. J. Elem. 2015. [CrossRef]7. Ngole, V.; Ekosse, G. Copper, nickel and zinc contamination in soils within the precincts of mining and
landfilling environments. Int. J. Environ. Sci. Technol. 2012, 9, 485–494. [CrossRef]8. Ahmad, M.S.A.; Ashraf, M. Essential roles and hazardous effects of nickel in plants. In Reviews of Environmental
Contamination and Toxicology; Springer: Berlin, Germany, 2012; pp. 125–167.9. Barałkiewicz, D.; Siepak, J. Chromium, nickel and cobalt in environmental samples and existing legal norms.
Pol. J. Environ. Stud. 1999, 8, 201–208.10. Bulatovic, S.M. Handbook of Flotation Reagents: Chemistry, Theory and Practice: Volume 1: Flotation of Sulfide
Ores; Elsevier: Amsterdam, The Netherlands, 2007.11. Na, L.; Yong, C.; Chao, Z.; Wen, Z.; Fu, M.; Chen, W.; Song, W. Highly Sensitive Determination of Butyl
Xanthate in Surface and Drinking Water by Headspace Gas Chromatography with Electron Capture Detector.Chromatographia 2015, 78, 1305–1310.
12. Pearse, M.J. An overview of the use of chemical reagents in mineral processing. Miner. Eng. 2005, 18, 139–149.[CrossRef]
13. Sicupira, L.; Veloso, T.; Reis, F.; Leão, V. Assessing metal recovery from low-grade copper ores containingfluoride. Hydrometallurgy 2011, 109, 202–210. [CrossRef]
14. Nicnas, S.E.X. Priority Existing Chemical. Secondary Notification Assessment, Report N5S; National IndustrialChemicals Notification and Assessment Scheme: Canberra, Australia, 2000; pp. 20–22.
15. Edraki, M.; Baumgartl, T.; Manlapig, E.; Bradshaw, D.; Franks, D.M.; Moran, C.J. Designing mine tailings forbetter environmental, social and economic outcomes: A review of alternative approaches. J. Clean. Prod.2014, 84, 411–420. [CrossRef]
16. Antoniadis, V.; Shaheen, S.M.; Boersch, J.; Frohne, T.; Du Laing, G.; Rinklebe, J. Bioavailability and riskassessment of potentially toxic elements in garden edible vegetables and soils around a highly contaminatedformer mining area in Germany. J. Environ. Manag. 2017, 186, 192–200. [CrossRef] [PubMed]
17. Chen, C.Y.; Lin, T.H. Nickel toxicity to human term placenta: In vitro study on lipid peroxidation. J. Toxicol.Environ. Health Part A 1998, 54, 37–47.
18. Cempel, M.; Nikel, G. A Review of Its Sources and Environmental Toxicology. Pol. J. Environ. Stud. 2006, 15,375–382.
19. Das, K.K.; Das, S.N.; Dhundasi, S.A. Nickel, its adverse health effects & oxidative stress. Indian J. Med Res.2008, 128, 412–425. [PubMed]
20. None, N. (Environmental Health Criteria 108). 383 Seiten, 36 Tab. World Health Organization, Geneva 1991.Preis: 38,– Sw.fr.; 34,20 US $ (Entwicklungsländer 26,60 Sw.fr.). Food 1992, 36, 102.
21. Gad, N.; El-Sherif, M.; El-Gereedly, N. Influence of nickel on some physiological aspects of tomato plants.Aust. J. Basic Appl. Sci. 2007, 1, 286–293.
22. Rastogi, G.; Sani, R.K. Molecular Techniques to Assess Microbial Community Structure, Function,and Dynamics in the Environment. In Microbes and Microbial Technology; Springer: New York, NY, USA, 2011;pp. 29–57.
23. Wyszkowska, J.; Kucharski, J.; Boros, E. Effect of nickel contamination on soil enzymatic activities. Plant SoilEnviron. 2005, 51, 523–531. [CrossRef]
Sustainability 2019, 11, 3888 29 of 32
24. Ko, K.-S.; Ha, K.; Kong, I.C. Effects of monotypic and binary mixtures of metal oxide nanoparticles onmicrobial growth in sandy soil collected from artificial recharge sites. Int. J. Mol. Sci. 2015, 16, 27967–27977.[CrossRef] [PubMed]
25. Lokke, H.; Ragas, A.M.; Holmstrup, M. Tools and perspectives for assessing chemical mixtures and multiplestressors. Toxicology 2013, 313, 73–82. [CrossRef] [PubMed]
26. McCarty, L.; Borgert, C. Review of the toxicity of chemical mixtures: Theory, policy, and regulatory practice.Regul. Toxicol. Pharmacol. 2006, 45, 119–143. [CrossRef] [PubMed]
27. Downing, H.F.; Delorenzo, M.E.; Fulton, M.H.; Scott, G.I.; Madden, C.J.; Kucklick, J.R. Effects of theAgricultural Pesticides Atrazine, Chlorothalonil, and Endosulfan on South Florida Microbial Assemblages.Ecotoxicology 2004, 13, 245–260. [CrossRef] [PubMed]
28. Muturi, E.J.; Donthu, R.K.; Fields, C.J.; Moise, I.K.; Kim, C.H. Effect of pesticides on microbial communitiesin container aquatic habitats. Sci. Rep. 2017, 7, 44565. [CrossRef] [PubMed]
29. Bararunyeretse, P.; Ji, H.; Yao, J. Toxicity of nickel to soil microbial community with and without the presenceof its mineral collectors—A calorimetric approach. Environ. Sci. Pollut. Res. 2017, 24, 15134–15147. [CrossRef][PubMed]
30. Piterina, A.V.; Bartlett, J.; Pembroke, J.T. Molecular Analysis of Bacterial Community DNA in SludgeUndergoing Autothermal Thermophilic Aerobic Digestion (ATAD): Pitfalls and Improved Methodology toEnhance Diversity Recovery. Diversity 2010, 2, 505–526. [CrossRef]
31. Hill, G.T.M.; Mitkowski, N.A.; Aldrich-Wolfe, L.; Emele, L.R.; Jurkonie, D.D.; Ficke, A.;Maldonado-Ramirez, S.; Lynch, S.T.; Nelson, E.B. Methods for assessing the composition and diversity ofsoil microbial communities. Appl. Soil Ecol. 2000, 15, 25–36. [CrossRef]
32. Pichler, M.; Coskun, Ö.K.; Ortega-Arbulú, A.S.; Conci, N.; Wörheide, G.; Vargas, S.; Orsi, W.D. A 16S rRNAgene sequencing and analysis protocol for the Illumina MiniSeq platform. Microbiol. Open 2018, 7, e00611.[CrossRef]
33. Fierer, N.; Schimel, J.P.; Holden, P.A. Variations in microbial community composition through two soil depthprofiles. Soil Biol. Biochem. 2003, 35, 167–176. [CrossRef]
34. Ahamadou, B.; Huang, Q.; Chen, W.; Wen, S.; Zhang, J.; Mohamed, I.; Cai, P.; Liang, W. Microcalorimetricassessment of microbial activity in long-term fertilization experimental soils of Southern China.FEMS Microbiol. Ecol. 2009, 70, 186–195. [CrossRef]
35. Chen, H.; Zhuang, R.; Yao, J.; Wang, F.; Qian, Y.; Masakorala, K.; Cai, M.; Liu, H. Short-term effect of anilineon soil microbial activity: A combined study by isothermal microcalorimetry, glucose analysis, and enzymeassay techniques. Environ. Sci. Pollut. Res. Int. 2014, 21, 674–683. [CrossRef]
36. Li, H.; Yao, J.; Gu, J.; Duran, R.; Roha, B.; Jordan, G.; Liu, J.; Min, N.; Lu, C. Microcalorimetry and enzymeactivity to determine the effect of nickel and sodium butyl xanthate on soil microbial community. Ecotoxicol.Environ. Saf. 2018, 163, 577–584. [CrossRef] [PubMed]
37. Chen, H.; Yao, J.; Wang, F.; Choi, M.M.; Bramanti, E.; Zaray, G. Study on the toxic effects of diphenolcompounds on soil microbial activity by a combination of methods. J. Hazard. Mater. 2009, 167, 846–851.[CrossRef] [PubMed]
38. Critter, S.A.; Freitas, S.S.; Airoldi, C. Comparison between microorganism counting and a calorimetricmethod applied to tropical soils. Thermochim. Acta 2002, 394, 133–144. [CrossRef]
39. Li, J.; Wu, X.; Gebremikael, M.T.; Wu, H.; Cai, D.; Wang, B.; Li, B.; Zhang, J.; Li, Y.; Xi, J. Response of soilorganic carbon fractions, microbial community composition and carbon mineralization to high-input fertilizerpractices under an intensive agricultural system. PLoS ONE 2018, 13, e0195144. [CrossRef] [PubMed]
40. Xu, S.; Yao, J.; Ainiwaer, M.; Hong, Y.; Zhang, Y. Analysis of Bacterial Community Structure of ActivatedSludge from Wastewater Treatment Plants in Winter. Biomed. Res. Int. 2018, 2018, 8278970. [CrossRef][PubMed]
41. Li, K.; Dan, Z.; Gesang, L.; Wang, H.; Zhou, Y.; Du, Y.; Ren, Y.; Shi, Y.; Nie, Y. Comparative Analysis ofGut Microbiota of Native Tibetan and Han Populations Living at Different Altitudes. PLoS ONE 2016, 11,e0155863. [CrossRef] [PubMed]
42. Yi, X.; Yuan, J.; Zhu, Y.; Yi, X.; Zhao, Q.; Fang, K.; Cao, L. Comparison of the Abundance and CommunityStructure of N-Cycling Bacteria in Paddy Rhizosphere Soil under Different Rice Cultivation Patterns. Int. J.Mol. Sci. 2018, 19, 3772. [CrossRef] [PubMed]

Sustainability 2019, 11, 3888 30 of 32
43. Zhang, Q.; Sun, J.; Liu, S.; Wei, Q. Manure refinement affects apple rhizosphere bacterial community structure:A study in sandy soil. PLoS ONE 2013, 8, e76937. [CrossRef]
44. Jiang, J.; Song, Z.; Yang, X.; Mao, Z.; Nie, X.; Guo, H.; Peng, X. Microbial community analysis of applerhizosphere around Bohai Gulf. Sci. Rep. 2017, 7, 8918. [CrossRef]
45. Edgar, R.C. UPARSE: Highly accurate OTU sequences from microbial amplicon reads. Nat. Methods 2013, 10,996. [CrossRef]
46. Schloss, P.D.; Westcott, S.L.; Ryabin, T.; Hall, J.R.; Hartmann, M.; Hollister, E.B.; Lesniewski, R.A.;Oakley, B.B.; Parks, D.H.; Robinson, C.J.; et al. Introducing mothur: open-source, platform-independent,community-supported software for describing and comparing microbial communities. Appl. Environ.Microbio. 2009, 75, 7537–7541. [CrossRef] [PubMed]
47. Ashley, S.; Jo, H. Beyond the Venn diagram: The hunt for a core microbiome. Environ. Microbiol. 2012, 14,4–12.
48. Cole, J.R.; Wang, Q.; Caedenas, E.; Fish, J.; Chai, B.; Farris, R.J.; Kulam-syed-Mohideen, A.S.; McGarrel, D.M.;Marsh, T.; Garrity, G.M.; et al. The Ribosomal Database Project: improved alignments and new tools forrRNA analysis. Nucleic Acids Res. 2009, 37, D141–D145. [CrossRef] [PubMed]
49. Quast, C.; Pruesse, E.; Yilmaz, P.; Gerken, J.; Schweer, T.; Yarza, P.; Peplies, J.; Glöckner, F.O. The SILVAribosomal RNA gene database project: improved data processing and web-based tools. Nucleic Acids Res.2013, 41, 590–596. [CrossRef] [PubMed]
50. Swieciło, A.; Zych-Wezyk, I. Bacterial stress response as an adaptation to life in a soil environment. Pol. J.Environ. Stud. 2013, 22, 1577.
51. Alboghobeish, H.; Tahmourespour, A.; Doudi, M. The study of Nickel Resistant Bacteria (NiRB) isolated fromwastewaters polluted with different industrial sources. J. Environ. Health Sci. Eng. 2014, 12, 44. [CrossRef][PubMed]
52. Macomber, L.; Hausinger, R.P. Mechanisms of nickel toxicity in microorganisms. Metallomics 2011, 3,1153–1162. [CrossRef] [PubMed]
53. Denkhaus, E.; Salnikow, K. Nickel essentiality, toxicity, and carcinogenicity. Crit. Rev. Oncol. Hematol. 2002,42, 35–56. [CrossRef]
54. Khan, A.; Schuler, M.; Prior, M.; Yong, S.; Coppock, R.; Florence, L.; Lillie, L. Effects of hydrogen sulfideexposure on lung mitochondrial respiratory chain enzymes in rats. Toxicol. Appl. Pharmacol. 1990, 103,482–490. [CrossRef]
55. Gu, Y.; Nostrand, J.D.V.; Wu, L.; He, Z.; Qin, Y.; Zhao, F.J.; Zhou, J. Bacterial community and arsenic functionalgenes diversity in arsenic contaminated soils from different geographic locations. PLoS ONE 2017, 12,e0176696.
56. Stevens, H.; Stubner, M.; Simon, M.; Brinkhoff, T. Phylogeny of Proteobacteria and Bacteroidetes from oxichabitats of a tidal flat ecosystem. FEMS Microbiol. Ecol. 2005, 54, 351–365. [CrossRef] [PubMed]
57. Spain, A.M.; Krumholz, L.R.; Elshahed, M.S. Abundance, composition, diversity and novelty of soilProteobacteria. ISME J. 2009, 3, 992. [CrossRef] [PubMed]
58. Gupta, R.S. The phylogeny of proteobacteria: Relationships to other eubacterial phyla and eukaryotes.FEMS Microbiol. Rev. 2000, 24, 367–402. [CrossRef] [PubMed]
59. Peng, M.; Zi, X.; Wang, Q. Bacterial community diversity of oil-contaminated soils assessed by highthroughput sequencing of 16S rRNA genes. Int. J. Environ. Res. Public Health 2015, 12, 12002–12015.[CrossRef] [PubMed]
60. Parajuli, A.; Grönroos, M.; Kauppi, S.; Płociniczak, T.; Roslund, M.I.; Galitskaya, P.; Laitinen, O.H.; Hyöty, H.;Jumpponen, A.; Strömmer, R. The abundance of health-associated bacteria is altered in PAH pollutedsoils—Implications for health in urban areas? PLoS ONE 2017, 12, e0187852. [CrossRef] [PubMed]
61. DeBruyn, J.M.; Mead, T.J.; Wilhelm, S.W.; Sayler, G.S. PAH biodegradative genotypes in Lake Erie sediments:Evidence for broad geographical distribution of pyrene-degrading mycobacteria. Environ. Sci. Technol. 2009,43, 3467–3473. [CrossRef] [PubMed]
62. Chen, S.; Gong, W.; Mei, G.; Zhou, Q.; Bai, C.; Xu, N. Primary biodegradation of sulfide mineral flotationcollectors. Miner. Eng. 2011, 24, 953–955. [CrossRef]
63. Hamsavathani, V.; Aysha, O.; Valli, S. Biodegradation of xenobiotics: A review on petroleum hydrocarbonsand pesticide degradation. WJ Pharma Pharm. Sci. 2015, 4, 1791–1808.

Sustainability 2019, 11, 3888 31 of 32
64. Dabrowska, D.; Kot-Wasik, A.; Namiesnik, J. The Importance of Degradation in the Fate of Selected OrganicCompounds in the Environment. Part II. Photodegradation and Biodegradation. Pol. J. Environ. Stud. 2004,13.
65. Seo, J.-S.; Keum, Y.-S.; Li, Q. Bacterial degradation of aromatic compounds. Int. J. Environ. Res. Public Health2009, 6, 278–309. [CrossRef]
66. Das, A.C.; Debnath, A. Effect of systemic herbicides on N2-fixing and phosphate solubilizing microorganismsin relation to availability of nitrogen and phosphorus in paddy soils of West Bengal. Chemosphere 2006, 65,1082–1086. [CrossRef] [PubMed]
67. Traag, B.A.; Pugliese, A.; Eisen, J.A.; Losick, R. Gene conservation among endospore-forming bacteria revealsadditional sporulation genes in Bacillus subtilis. J. Bacteriol. 2013, 195, 253–260. [CrossRef] [PubMed]
68. Valverde, A.; González-Tirante, M.; Medina-Sierra, M.; Santa-Regina, I.; García-Sánchez, A.; Igual, J.M.Diversity and community structure of culturable arsenic-resistant bacteria across a soil arsenic gradient at anabandoned tungsten–tin mining area. Chemosphere 2011, 85, 129–134. [CrossRef] [PubMed]
69. Bento, F.M.; Camargo, F.A.; Okeke, B.C.; Frankenberger, W.T. Comparative bioremediation of soilscontaminated with diesel oil by natural attenuation, biostimulation and bioaugmentation. Bioresour.Technol. 2005, 96, 1049–1055. [CrossRef] [PubMed]
70. Burkhardt, E.-M.; Bischoff, S.; Akob, D.M.; Büchel, G.; Küsel, K. Heavy metal tolerance of Fe (III)-reducingmicrobial communities in contaminated creek bank soils. Appl. Environ. Microbiol. 2011, 77, 3132–3136.[CrossRef]
71. Nicholson, W.L.; Munakata, N.; Horneck, G.; Melosh, H.J.; Setlow, P. Resistance of Bacillus endospores toextreme terrestrial and extraterrestrial environments. Microbiol. Mol. Biol. Rev. 2000, 64, 548–572. [CrossRef]
72. Sharmin, F.; Wakelin, S.; Huygens, F.; Hargreaves, M. Firmicutes dominate the bacterial taxa within sugar-caneprocessing plants. Sci. Rep. 2013, 3, 3107. [CrossRef]
73. Yuan, M.; Yu, Y.; Li, H.-R.; Dong, N.; Zhang, X.-H. Phylogenetic diversity and biological activity ofactinobacteria isolated from the Chukchi Shelf marine sediments in the Arctic Ocean. Mar. Drugs 2014, 12,1281–1297. [CrossRef]
74. Qiu, M.; Zhang, R.; Xue, C.; Zhang, S.; Li, S.; Zhang, N.; Shen, Q. Application of bio-organic fertilizer cancontrol Fusarium wilt of cucumber plants by regulating microbial community of rhizosphere soil. Biol. Fertil.Soils 2012, 48, 807–816. [CrossRef]
75. Remenár, M.; Harichová, J.; Zámocký, M.; Pangallo, D.; Szemes, T.; Budiš, J.; Soltys, K.; Ferianc, P.Metagenomics of a nickel-resistant bacterial community in an anthropogenic nickel-contaminated soil insouthwest Slovakia. Biologia 2017, 72, 971–981. [CrossRef]
76. Hasani, A.; Kariminik, A.; Issazadeh, K. Streptomycetes: Characteristics and their antimicrobial activities.Int. J. Adv. Biol. Biomed. Res. 2014, 2, 63–75.
77. Ceylan, O.; Okmen, G.; Ugur, A. Isolation of soil Streptomyces as source antibiotics active againstantibiotic-resistant bacteria. Eurasian J. Biosci. 2008, 2, 73–82.
78. Jorge, V.; Inti, P.; Raquel, Q.; Dodson, R.J.; Herve, T.; Robert, B.; Eisen, J.A.; Holmes, D.S. Acidithiobacillusferrooxidans metabolism: From genome sequence to industrial applications. BMC Genom. 2008, 9, 597.
79. Seifelnassr, A.A.S.; Abouzeid, A.-Z.M. Exploitation of Bacterial Activities in Mineral Industry andEnvironmental Preservation: An Overview. J. Min. 2013, 2013, 1–13. [CrossRef]
80. Raja, C.E.; Selvam, G.S.; Omine, K. Isolation, identification and characterization of heavy metal resistantbacteria from sewage. In Proceedings of the International Joint Symp on Geodisaster Prevention andGeoenvironment in Asia, Fukuoka, Japan, 24–25 November 2009; pp. 205–211.
81. Deo, N.; Natarajan, K.A. Biological removal of some flotation collector reagents from aqueous solutions andmineral surfaces. Miner. Eng. 1998, 11, 717–738. [CrossRef]
82. Dong, Y.B.; Lin, H.; Kai-Bin, F.U.; Xiao-Lan, M.O.; Wen, H.W. Effect of flotation reagents on bioleaching oflow grade copper tailings by Acidthiobacillus ferrooxidans. Chin. J. Nonferrous Met. 2011, 21, 2291–2297.
83. Okibe, N.; Johnson, D.B. Toxicity of flotation reagents to moderately thermophilic bioleaching microorganisms.Biotechnol. Lett. 2002, 24, 2011–2016. [CrossRef]
84. Bhagat, N.; Vermani, M.; Bajwa, H.S. Characterization of heavy metal (cadmium and nickle) tolerant Gramnegative enteric bacteria from polluted Yamuna River, Delhi. Afr. J. Microbiol. Res. 2016, 10, 127–137.
85. Kacar, A. Investigation of Heavy Metal-Resistant Sediment Bacteria and Some Water Quality Parameters:A Case Study of Lake Bafa (Turkey). Int. J. Environ. Res. 2015, 9, 813–822.

Sustainability 2019, 11, 3888 32 of 32
86. Dehghan, R.; Dianati, M. The effects of Pb-Zn flotation reagents on the bioleaching process by mesophilicbacteria. Int. J. Miner. Process. 2015, 143, 80–86. [CrossRef]
87. Dedysh, S.N.; Sinninghe Damsté, J.S. Acidobacteria; John Wiley & Sons Ltd.: Chichester, UK, 2018; pp. 1–10.[CrossRef]
88. Shan, H.; Chen, C.; Jaffé, P.R. Seasonal distribution of nitrifiers and denitrifiers in urban river sedimentsaffected by agricultural activities. Sci. Total Environ. 2018, 642, 1282–1291.
89. Shan, H.; Chen, C.; Peng, X.; Jaffé, P.R. Environmental factors affecting the presence of Acidimicrobiaceaeand ammonium removal under iron-reducing conditions in soil environments. Soil Biol. Biochem. 2016, 98,148–158.
© 2019 by the authors. Licensee MDPI, Basel, Switzerland. This article is an open accessarticle distributed under the terms and conditions of the Creative Commons Attribution(CC BY) license (http://creativecommons.org/licenses/by/4.0/).