Molecular and morphological identification of hymenoptran ...
RESEARCH ARTICLE
Molecular and morphological evidence of hybridizationbetween native Ruditapes philippinarum and the introducedRuditapes form in Japan
Shuichi Kitada • Chie Fujikake • Yoshiho Asakura •
Hitomi Yuki • Kaori Nakajima • Kelley M. Vargas •
Shiori Kawashima • Katsuyuki Hamasaki • Hirohisa Kishino
Received: 14 August 2012 / Accepted: 19 February 2013 / Published online: 3 March 2013
� Springer Science+Business Media Dordrecht 2013
Abstract Marine aquaculture and stock enhancement are
major causes of the introduction of alien species. A good
example of such an introduction is the Japanese shortneck
clam Ruditapes philippinarum, one of the most important
fishery resources in the world. To meet the domestic
shortage of R. philippinarum caused by depleted catches,
clams were imported to Japan from China and the Korean
peninsula. The imported clam is an alien species that has a
very similar morphology, and was misidentified as R. phil-
ippinarum (hereafter, Ruditapes form). We genotyped
1,186 clams of R. philippinarum and R. form at four
microsatellite loci, sequenced mitochondrial DNA (COI
gene fragment) of 485 clams, 34 of which were R. var-
iegatus, and measured morphometric and meristic charac-
ters of 754 clams from 12 populations in Japan and China,
including the Ariake Sea and Tokyo Bay, where large
numbers of R. form were released. Our analyses confirmed
that R. form was from the genus Ruditapes, and the genetic
differentiation between R. philippinarum and R. form was
distinct, but small, compared with five bivalve outgroups.
However, R. form had distinct shell morphology, especially
larger numbers of radial ribs on the shell surface, sug-
gesting that R. form might be a new Ruditapes species or a
variation of R. philippinarum that originated from southern
China. A genetic affinity of the sample from the Ariake Sea
to R. form was found with the intermediate shell mor-
phology and number of radial ribs, and the hybrid pro-
portion was estimated at 51.3 ± 4.6 % in the Ariake Sea.
Keywords Hybrid swarm � Ruditapes form �Ruditapes philippinarum � Population structure �Taxonomy
Introduction
Introduction of non-native species has been a method of
increasing fisheries production since the 1970s. As a result,
marine aquaculture and stock enhancement have led to the
introduction of marine species (Bax et al. 2003). An
important concern in marine introductions is hybridization
between introduced alien and closely related native spe-
cies. Natural hybridization has played an important role in
the evolution of many plant and animal taxa, but increased
anthropogenic hybridization is causing extinction of many
species, subspecies and locally adapted populations by both
replacement and genetic mixing (Allendorf et al. 2001).
Evidence of anthropogenic hybridization in marine fishery
resources has recently been observed in bivalves. Yama-
kawa and Imai (2012) reported hybridization between the
alien Meretrix petechialis (Lamarck 1818) introduced from
China and the Korean peninsula and the native Meretrix
rusolia (Roding 1798) in Japan. Likewise, Hurtado et al.
(2011) found hybridization between distinct Ruditapes
species: the introduced Japanese shortneck clam (or Manila
clam) Ruditapes philippinarum (Adams and Reeve 1850)
and the native European grooved carpet shell Ruditapes
decussatus (Linnaeus 1758) in Spain.
Electronic supplementary material The online version of thisarticle (doi:10.1007/s10592-013-0467-x) contains supplementarymaterial, which is available to authorized users.
S. Kitada (&) � C. Fujikake � Y. Asakura � H. Yuki �K. Nakajima � K. M. Vargas � S. Kawashima � K. Hamasaki
Department of Marine Biosciences, Tokyo University of Marine
Science and Technology, Minato, Tokyo 108-8477, Japan
e-mail: [email protected]
H. Kishino
Graduate School of Agricultural and Life Sciences,
University of Tokyo, Bunkyo, Tokyo 113-8657, Japan
123
Conserv Genet (2013) 14:717–733
DOI 10.1007/s10592-013-0467-x
In the genus Ruditapes, R. philippinarum is the most
important commercial fisheries species, which occurs in
East Asia, North America and Europe. Although it is native
to Sakhalin, Japan, Korea and China (Gosling 2003), it was
accidentally introduced into Puget Sound, Washington,
USA, with the Pacific oyster Crassostrea gigas, in the
1930s (Williams 1980), and it has been cultured since the
late 1970s (Becker et al. 2008). In the early 1970s, it was
introduced from the USA for aquaculture purposes to
France (Flye-Sainte-Marie et al. 2007) and the UK (Utting
and Spencer 1992); it was introduced to Italy in the 1980s
(Chiesa et al. 2011) and to Ireland in 1984 (Drummond
et al. 2006), and from the UK to Israel (Shpigel and
Spencer 1996). China is the number one country in the
world in terms of production of the Manila clam, producing
about 1.8 million metric tons annually, which accounts for
about 90 % of global production (Zhang and Yan 2006).
In Japan, R. philippinarum is one of the most important
fishery resources. Until the mid-1980s, the abundant annual
catch from natural populations was stable at about 110–160
thousand tons, but began to decrease from the mid-1980s.
This severe decrease occurred in two major production
areas: Tokyo Bay off Chiba prefecture, and the Ariake Sea
off Kumamoto prefecture (Fig. 1). In contrast, in the top
production area of Mikawa Bay, Aichi prefecture, the catch
has remained stable since the 1970s, but has increased
since the late 2000s (Fig. S1a in the Supplementary
material). In the major production areas, naturally pro-
duced seed of R. philippinarum were translocated and
released within and between prefectures to enhance fishery
production. In 2009, 14,027 million naturally produced
seed with a mean shell length (SL) of 12 mm (range 4–56),
and 5,775 thousand artificially produced spat of 17 mm SL
(1–30) were released for fishery stock enhancement in
Japanese waters (Fig. S1b, Fisheries Research Agency and
National Association for the Promotion of Productive Seas
2011). Despite stock enhancement efforts, the annual catch
remained low at 31,500 tons in 2009 and close to the his-
torical minimum of 31,022 tons in 2001 (Ministry of
Agriculture, Forestry and Fisheries 1967–2011, Fig. S1a).
To meet the shortage in domestic demand, R. philippina-
rum was imported into Japan from China and the Korean
peninsula in the late 1980s. Imports increased to about
75,000 tons in 2000, but decreased to 12,000 tons in 2008
(Ministry of Finance 1991–2010, Fig. S1a). Because
imported clams were shipped to consumer markets directly,
this is not the problem. The issue of conservation arose
from the fact that live clams were released into shallow
waters for short-term aquaculture before they were sent to
consumer markets. In addition, huge numbers of clams
were released into natural waters, mainly in the Ariake Sea
and Tokyo Bay, to enhance stocks for commercial and
recreational fisheries. However, the release statistics do not
include the number of clams released in Japan for recrea-
tional clam gathering, and the release information for
imported clams is unknown.
Vargas et al. (2008) examined the shell morphology and
allozyme variations of R. philippinarum imported from
China and the Korean peninsula at the Chiba Prefectural
Fisheries Cooperative Association. They found that the
imported clam was very similar to R. philippinarum, but
significantly genetically different from R. philippinarum
samples collected in Japan and China, which authors
concluded had been misidentified as R. philippinarum.
Vargas et al. (2010) confirmed that the clams collected at
Dandong, Xiamen and Haikou, China were genetically the
same as the above-mentioned imported clam and exhibit
finer, more closely spaced radial ribs on shell surfaces
compared with native R. philippinarum. The shell of the
clam is thinner (data not shown), and its shell character-
istics are different from R. philippinarum, as shown in the
Results section. Based on shell morphology, we confirmed
that large numbers of these clams were released in the
recreational shell-gathering grounds in Tokyo Bay, where
we took samples at TKB-2 and TKB-3 (see Table 1). The
clam does not naturally inhabit Japanese waters and, in
fact, we did not find this clam among our samples of native
R. philippinarum. The clam is therefore an alien species.
Judging from the shell morphology, the clam should be
genus Ruditapes. However, the taxonomic status of the
clam was not clear. Therefore, in this paper, we tentatively
treat the clam as a Ruditapes form.
Vargas et al. (2010) estimated Nei’s genetic distance
(Nei 1978) from allozymic genotype frequencies between
samples of R. philippinarum and R. form at 0.1069 ±
0.0258; the within-sample estimates were much smaller,
being 0.0049 ± 0.0014 for R. philippinarum and 0.0105 ±
0.0044 for R. form. Using mitochondrial DNA (mtDNA)
cytochrome oxidase subunit I (COI) sequences, Sekine et al.
(2006) reported genetic differentiation between R. philipp-
inarum samples collected in Japan (28 individuals from six
sites) and in China (11 individuals from three sites). Mao
et al. (2011) analysed the sequences of Sekine et al. (2006)
combined with their own samples of R. philippinarum
collected in Japan (19 individuals from two sites) and China
(132 individuals from eight sites), and confirmed the dis-
tinct differentiation between R. philippinarum populations
in Japan and China. However, some of their Chinese sam-
ples are not R. philippinarum but rather R. form, judging
from the substantial pairwise FST values between the Chi-
nese and Japanese samples of 0.6417 ± 0.0470 (0.531–
0.817). In this average FST calculation, we excluded the
Chinese samples from Tj (Tianjin), Qd (Qingdao) and Rs
(Rushan) which might contain R. philippinarum shown as
the haplotype lineage A (see Fig. 3 of Mao et al. 2011), and
the Japanese sample Kag (Kagawa) which might contain
718 Conserv Genet (2013) 14:717–733
123
R. form clams imported and released for recreational shell
gathering. In fact, the samples Tj and Qd from the Bohai
Sea had small FST values of 0.0564 ± 0.0644 (-0.063–
0.152) between Japanese samples, but had very large values
of 0.4198 ± 0.1419 (0.199–0.576) between the Chinese
samples from Dl1 (Dalian 1), Dl2 (Dalian 2), Xia (Kiao-
chow Bay), Lz (Laizhou), Nb (Ningbo), Pt (Putian), Xm
(Xiamen), and Gz (Guangzhou). The pairwise FST values of
Mao et al. (2011) strongly suggested that the haplotype
lineage A (red colour in their paper) was R. philippinarum,
and the lineages B and C (green and blue colours) were R.
form. Available evidence shows that Ruditapes species can
hybridize if geographic isolation is removed because R. phil-
ippinarum and R. decussatus hybridize, as mentioned above.
The genetic difference between R. philippinarum and
R. form is much smaller than that between R. philippinarum
and R. decussatus as shown in the ‘‘Results’’ section.
Therefore, R. form can hybridize with the native Japanese
R. philippinarum by anthropogenic introduction. If this is the
case, backcrossing with parental types and mating among
hybrids by varying numbers of generations should make the
introduced population a hybrid swarm; that is, a population
of individuals that are all hybrids (Allendorf et al. 2001). In
this case, the genotypes of R. form should be half in the
hybrid swarm and the pure R. philippinarum would become
extinct in the introduced population. Therefore, the intro-
gression—gene flow between populations whose individuals
hybridize (Allendorf et al. 2001)—of R. form into R. phil-
ippinarum is a real issue of concern from a conservation
viewpoint.
In this study, we first explore the phylogenetic rela-
tionships of R. form with R. philippinarum compared with
five outgroups: R. bruguieri (Hanley 1845), R. decussatus,
R. variegatus (synonym R. variegate, Sowerby 1852),
Meretrix lusoria and M. petechialis. We then investigate
genetic diversity and population structure of R. philippin-
arum and R. form in Japan and China, based on samples
taken from natural populations using fine-scale DNA
markers. Finally, we examine if the alien R. form is
hybridizing with native R. philippinarum, based on genetic
and morphometric measurements of clams from the Ariake
Sea and Tokyo Bay, Japan, where large numbers of R. form
have been released. In addition, the allozyme genotype
data from Vargas et al. (2008, 2010) were reanalysed for
the individuals used in this study. This study provides the
first evidence for anthropogenic hybridization of R. phil-
ippinarum and R. form, based on their population struc-
ture in Japan and China. Our study also highlights a
need for a taxonomic revision of species in the genus
Ruditapes.
East ChinaSea
30’
33°00’N
30’
32°00’N
30’ 130°00’E 30’
0 30km15
1-3
12
13
10
11
5
7
Japan
China
6
4
8
AriakeSea
ShiranuiSea
Kyushu Island
9
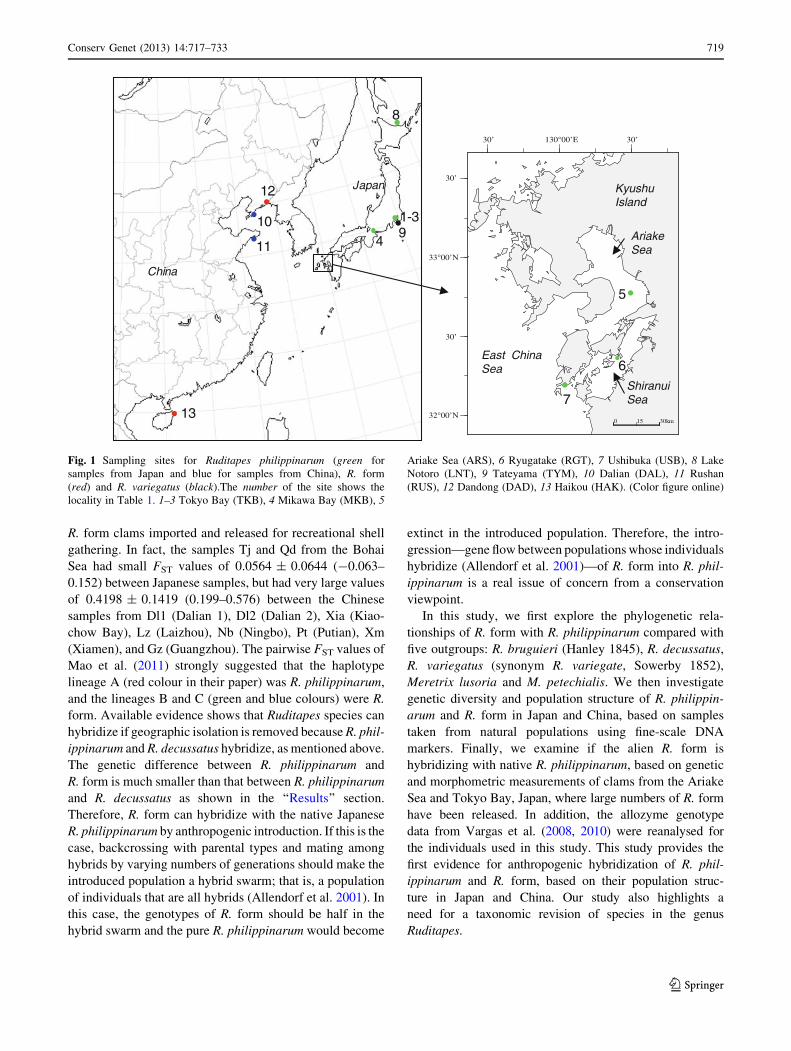
Fig. 1 Sampling sites for Ruditapes philippinarum (green for
samples from Japan and blue for samples from China), R. form
(red) and R. variegatus (black).The number of the site shows the
locality in Table 1. 1–3 Tokyo Bay (TKB), 4 Mikawa Bay (MKB), 5
Ariake Sea (ARS), 6 Ryugatake (RGT), 7 Ushibuka (USB), 8 Lake
Notoro (LNT), 9 Tateyama (TYM), 10 Dalian (DAL), 11 Rushan
(RUS), 12 Dandong (DAD), 13 Haikou (HAK). (Color figure online)
Conserv Genet (2013) 14:717–733 719
123
Materials and methods
Collecting samples
More than 1,200 individuals were collected from 12 pop-
ulations, consisting of 10 R. philippinarum and two R. form.
In addition, 50 individuals of R. variegatus were collected
as an outgroup (Fig. 1; Table 1). Sampling sites in Japan
for R. philippinarum were Tokyo Bay off Chiba (TKB-1
and TKB-2) and off Kanagawa prefectures (TKB-3),
Mikawa Bay in Aichi prefecture (MKB), the Ariake Sea
(ARS), Ryugatake (RGT) and Ushibuka (USB) in Kuma-
moto prefecture, and Lake Notoro (LNT) in Hokkaido.
Sites for R. philippinarum in China were Dalian (DAL) in
Liaoning, and Rushan (RUS) in Shandong province.
Samples were collected manually from tidal flats or shal-
low waters, except for the ARS sample, which was taken
by fishermen. Large numbers of R. form were released for
fisheries stock enhancement in the Ariake Sea and Tokyo
Bay, but current releases of R. form are mainly for recre-
ational fishing. Indeed, a large number of R. form was
released at the sampling sites of TKB-1 and TKB-2, which
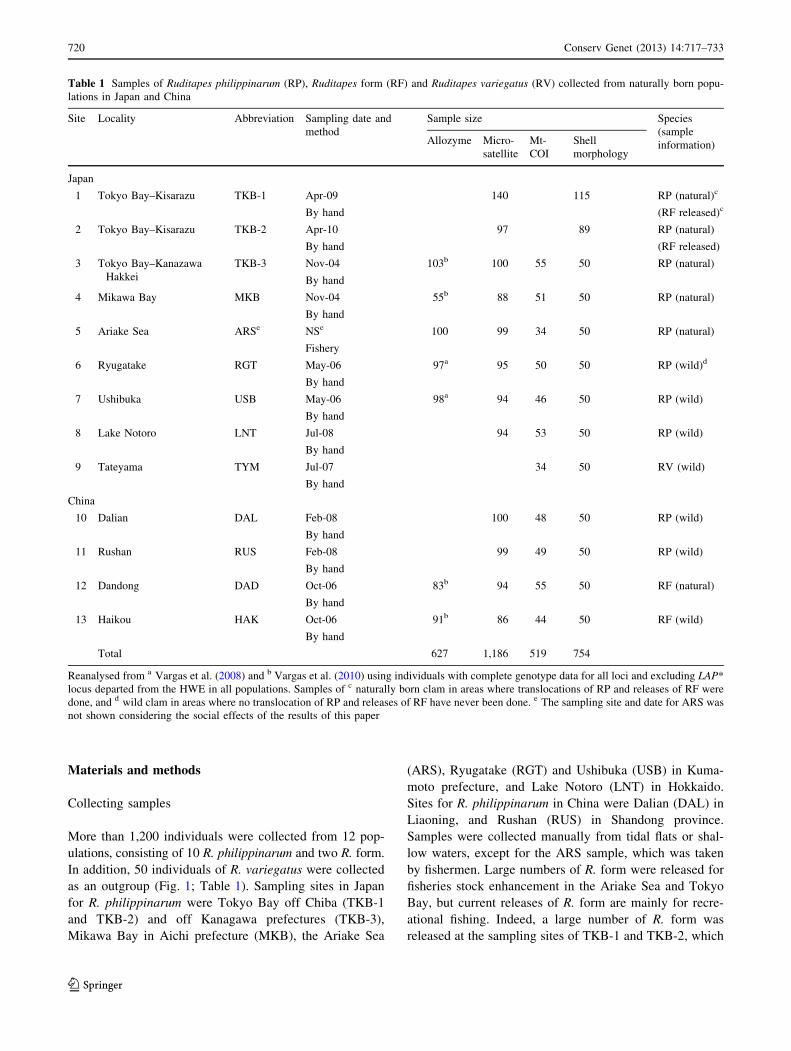
Table 1 Samples of Ruditapes philippinarum (RP), Ruditapes form (RF) and Ruditapes variegatus (RV) collected from naturally born popu-
lations in Japan and China
Site Locality Abbreviation Sampling date and
method
Sample size Species
(sample
information)Allozyme Micro-
satellite
Mt-
COI
Shell
morphology
Japan
1 Tokyo Bay–Kisarazu TKB-1 Apr-09
By hand
140 115 RP (natural)c
(RF released)c
2 Tokyo Bay–Kisarazu TKB-2 Apr-10
By hand
97 89 RP (natural)
(RF released)
3 Tokyo Bay–Kanazawa
Hakkei
TKB-3 Nov-04
By hand
103b 100 55 50 RP (natural)
4 Mikawa Bay MKB Nov-04
By hand
55b 88 51 50 RP (natural)
5 Ariake Sea ARSe NSe
Fishery
100 99 34 50 RP (natural)
6 Ryugatake RGT May-06
By hand
97a 95 50 50 RP (wild)d
7 Ushibuka USB May-06
By hand
98a 94 46 50 RP (wild)
8 Lake Notoro LNT Jul-08
By hand
94 53 50 RP (wild)
9 Tateyama TYM Jul-07
By hand
34 50 RV (wild)
China
10 Dalian DAL Feb-08
By hand
100 48 50 RP (wild)
11 Rushan RUS Feb-08
By hand
99 49 50 RP (wild)
12 Dandong DAD Oct-06
By hand
83b 94 55 50 RF (natural)
13 Haikou HAK Oct-06
By hand
91b 86 44 50 RF (wild)
Total 627 1,186 519 754
Reanalysed from a Vargas et al. (2008) and b Vargas et al. (2010) using individuals with complete genotype data for all loci and excluding LAP*
locus departed from the HWE in all populations. Samples of c naturally born clam in areas where translocations of RP and releases of RF were
done, and d wild clam in areas where no translocation of RP and releases of RF have never been done. e The sampling site and date for ARS was
not shown considering the social effects of the results of this paper
720 Conserv Genet (2013) 14:717–733
123
were recreational fishing areas. To take a sample of natu-
rally born R. philippinarum in the recreational fishing
areas, we collected 0?-year-old young clams, judging from
their SL. From the SL, those from TKB-1 were thought to
be born in autumn and TKB-2 in summer of the previous
year. In contrast, there has been no release of R. form in
TKB-3. The sample from ARS was taken from a fishing
ground in the Ariake Sea where R. form had not been
released for more than 10 years. In Mikawa Bay, naturally
born spat of R. philippinarum collected in the bay were
released within the bay, but there was no introduction of
R. form. Samples from RGT, USB, LNT, DAL and RUS
were wild clams, because stocking or introduction of
R. philippinarum and R. form did not occur in these areas.
The R. form sample from Haikou (HAK) was taken from a
wild population from Hainan Island where there had never
been translocation or stocking. The sample from Dandong
(DAD) was taken from a naturally reproducing population
of R. form in the coastal waters of Pyonganbuk-do, North
Korea near Dandong, introduced from Fujian province,
China to North Korea (personal communication, Sun
Zonghmin). The R. variegatus sample from Tateyama
(TYM), Chiba prefecture, Japan, was collected manually
from a wild population in a shallow sandy bottom with
rocks near tide pools. Thus, all samples were naturally born
individuals taken from the introduced populations and/or
wild individuals from pure populations without any intro-
duction (Table 1). All specimens were stored at -80 �C
before genetic analyses.
Mitochondrial DNA sequencing
In some shellfish species such as R. philippinarum, ‘‘Doubly
Uniparental Inheritance’’ (DUI) of mitochondrial DNA
(mtDNA) was reported with two different sex-related M- and
F-type mtDNAs (Passamonti and Scali 2001; Passamonti
et al. 2003). Plazzi and Passamonti (2010) recommended that
DNA should be obtained from the foot muscle as DUI spe-
cies carry very little M-type mtDNA in the foot muscle.
Therefore, we only used adductor and foot muscle tissue to
avoid co-extraction of male-type mtDNA. The muscle tissue
from each individual was boiled in water at 96 �C for 5 min
and stored in 99.5 % ethanol. Genomic DNA was extracted
following the standard phenol–chloroform procedure and/or
with the DNeasy Blood and Tissue Kit (Qiagen), according
to the manufacturer’s instructions.
DNA fragments corresponding to COI (about 700 bp)
were amplified with polymerase chain reaction (PCR)
using the universal primers for invertebrates LCO1490:
50 GGTCAACAAATCATAAAGATATTGG 30 and HCO
2198: 50 TAAACTTCAGGGTGACCAAAAAATCA 3 0
(Folmer et al. 1994). PCR amplifications were carried out
using a GeneAmp PCR System 2700 Thermal Cycler
(Applied Biosystems; www.appliedbiosystems.com) in
25 ll aliquots of a mixture containing 1.0 ll of genomic
DNA as a template (*1.0 lg/ll), 0.13 ll of Takara Ex Taq
polymerase (Takara Bio Inc.; www.takara-bio.com), 1.0 ll
of 10 lM primers, 2.5 ll of 109 Ex PCR buffer (MgCl220 mM), 2.0 ll of dNTP mixture (2.5 mM of each dNTP)
and 17.4 ll of sterile water with the following thermal-cycle
profile: 1 min initial denaturation at 95 �C followed by 35
cycles of 1 min denaturation at 95 �C, 1 min annealing at
40 �C and 7 min extension at 72 �C. The PCR product was
purified with ExoSAP-IT (USB Corp., USA). The purified
product was used as the template DNA for cycle sequencing
reactions performed on a GeneAmp PCR System 2700
Thermal Cycler (Applied Biosystems) in 20 ll aliquots of a
mixture containing 2 ll of template DNA, 0.32 ll of 10 lM
primer HCO2198, 1.5 ll of BigDye Terminator v3.1 or v1.1
Cycle Sequencing Ready Reaction Kit (Applied Biosystems)
and 16.2 ll of sterile water with the following cycling pro-
file: 1 min initial denaturation at 96 �C, followed by 25
cycles of 10 s denaturation at 96 �C, 5 s annealing at 50 �C
and 4 min extension at 60 �C. Sequencing products were
subjected to capillary electrophoresis in an ABI PRISM
3130xl Genetic Analyzer (Applied Biosystems). A total of
519 individuals were sequenced (Table 1).
Microsatellite DNA genotyping and allozyme data
Nine microsatellite markers developed for R. philippinarum
by Yasuda et al. (2007) were examined, and 1,186 individuals
were genotyped at four loci (Asari 16, Asari 55, Asari 62,
Asari 64). All loci were scored by capillary electrophoresis
using an ABI PRISM 3130xl Genetic Analyzer (Applied
Biosystems) with fluorescent dye-labelled primers. The ther-
mal cycles for PCR amplification were conducted in 13 ll
aliquots of a mixture containing 1.0 ll of genomic DNA as a
template, 0.05 ll of Takara Ex Taq polymerase (Takara Bio
Inc.; www.takara-bio.com), 1.0 ll of 10 lM primers, 1.25 ll
of 109 Ex PCR buffer (MgCl2 20 mM), 1.0 ll of dNTP
mixture and 7.7 ll of sterile water with the following cycling
profile, consisting of 38 cycles of denaturation at 94 �C for
10 min, a primer-specific annealing temperature for 30 s, and
an extension at 51 �C for 30 s and 72 �C for 1 min. The
annealing temperatures were 51 �C for all primers.
Allozyme genotypes of 627 individuals in the samples
analysed for mitochondrial and microsatellite analysis that
had no missing data were used for the data analysis from
722 individuals in Vargas et al. (2008, 2010). The geno-
types were encoded by seven loci (IDH*, MDH-1*, MDH-
2*, PGM*, 6PGD*, SOD-1* and SOD-2*), excluding the
LAP* locus, which departed from Hardy–Weinberg equi-
librium (HWE) in all samples. The techniques employed
for electrophoretic analyses and staining protocols were
described in Vargas et al. (2008).
Conserv Genet (2013) 14:717–733 721
123
Phylogenetic analysis
Sequences were aligned using Clustal X (Thompson et al.
1997). Alignments were also manually adjusted and no
indels (insertions/deletions) were found in the sequences.
Haplotypes were defined based on sequence data using
DnaSP ver. 5.00 (Librado and Rozas 2009).
To explore the taxonomic status of R. form, genetic
distances among the major haplotypes of R. philippinarum
collected in Japan and in China (this study, Hap 2, 6, 15, 24
and 32), those of R. form (Hap 92 and 115), and all hap-
lotypes of R. variegatus collected in Japan (Hap 1–7) were
estimated with sequences of R. philippinarum F-type and
M-type collected in Japan, those of R. philippinarum col-
lected in southern China [(a) Mao et al. (2011) and
(b) Chen et al. (2011)], R. variegatus collected in southern
China (Chen et al. (2011), R. bruguieri, R. decussatus,
M. lusoria and M. petechialis, with their GeneBank acces-
sion number. Substitution models were compared (Guindon
and Gascuel 2003; Posada and Buckley 2004; Posada 2008)
with the Bayesian information criterion (BIC) (Schwarz
1978), and the corrected Akaike information criterion
(AICc) (Akaike 1974; Sugiura 1978; Hurvich and Tsai
1989). The maximum likelihood (ML) (Felsenstein 1981)
tree of the COI haplotypes under the best-fit substitution
model was constructed. The analysis was implemented using
MEGA5 (Tamura et al. 2011). The same procedure was
applied on our haplotypes of R. philippinarum and R. form.
Genealogical relationships among haplotypes were also
examined by constructing haplotype networks using a
median-joining method (Bandelt et al. 1999) in Network ver.
4.6.0.0. Genetic diversity in each sample was quantified as
the number of haplotypes, haplotype diversity (Nei 1987),
and nucleotide diversity (Tajima 1983; Nei 1987) using
Arlequin ver. 3.5.1.2 (Excoffier et al. 2005).
Population genetics analysis
The HWE was tested, and heterozygosity was calculated
for each locus and population using GENEPOP version
4.0.10 (Raymond and Rousset 1995a). The exact test of
population differentiation based on haplotype and allele
frequencies was performed using the Markov chain pro-
cedure (1,000 dememorizations, 10,000 steps in the Mar-
kov chain) (Raymond and Rousset 1995b), as implemented
in Arlequin. The initial a = 0.05 significance level was
adjusted for simultaneous pairwise comparisons using the
sequential Bonferroni correction (Rice 1989). The fixation
index FST is most commonly used to measure genetic
divergence among subpopulations (Palsbøll et al. 2006).
The global FST over populations and posterior means of
population pairwise FST were therefore estimated based on
an empirical Bayesian method (Kitada et al. 2007) using
the software POPDIF1.0 (http://popgene.co-site.jp/soft-
ware.html) to avoid a biased estimation of pairwise FST,
especially for species with large gene flow, such as marine
fish and shellfish. Nei’s genetic distance (D, Nei 1978) and
RST (Slatkin 1995) was also calculated for all pairs of
populations using GenAlEx 6.5 (Peakall and Smouse 2006)
and SPAGeDi 1.3 (Hardy and Vekemans 2002), respec-
tively. R language (R Development Core Team) was used
for the cluster analysis based on pairwise D, FST and RST.
To describe the genetic characteristics of the populations,
STRUCTURE 2.3.3 (Pritchard et al. 2000) was imple-
mented for 500,000 Markov chain Monte Carlo replicates
after a burn-in period of 50,000 under the correlated allele
frequency model. The number of putative ancestry popu-
lations was assumed to be two (K = 2) because we ana-
lysed two putative populations, R. philippinarum and
R. form.
To infer introgression of R. form into R. philippinarum
populations, the mixing proportion (here, it refers to the
hybridization proportion) of R. form in the Ariake Sea and
Tokyo Bay was estimated from sample multilocus allele
frequencies for the mixed (= hybridized) and baseline
populations by the extended method of Kishino et al.
(1994) (see ‘‘Appendix’’ section) using POPMIX2.0 (http://
popgene.co-site.jp/software.html). Although there were no
baseline data before the import of R. form, in this study,
the samples from USB and MKB were assumed as baseline
populations for wild R. philippinarum from the Ariake Sea
and Tokyo Bay, respectively before the release of R. form.
ARS and TKB were treated as samples from the hybridized
populations affected by releases of R. form. Our reasoning
for this is that R. form has never been released in Ushibuka,
so USB might not be affected by releases of R. form
because of its distance from the Ariake Sea (Fig. 1). There
was a long history of translocation of seed from Mikawa
Bay to Tokyo Bay before the imports of R. form, and
no difference in allele frequencies between MKB and
TKB was found, as stated later. Therefore, the allele fre-
quencies in USB and MKB could be regarded as similar
to those in ARS and TKB at present, without releases of
R. form.
Morphometric analysis
The number of radial ribs (RR) on the shell surface was
counted in all samples using a magnifying glass. The SL,
shell height (SH) and shell width (SW) were also measured
for all samples (Table 1). The shell morphological data of
RR (SH/SL, SW/SL) were analysed using discriminant
canonical variate analysis (CVA). The linkage between
individual numbers of RR and genotypes was examined by
a principal component analysis (PCA) based on allozyme
and microsatellite genotypes for 42 individuals from the
722 Conserv Genet (2013) 14:717–733
123
ARS sample that had genotype data with the number of
RR. R language was used for the multivariate analyses.
Results
Mitochondrial DNA phylogeny
The 493 bp COI sequences were amplified for R. philipp-
inarum and R. form, and the sequences were aligned.
Sequence comparisons yielded 121 haplotypes from 485
individuals (Table S1). The COI sequences of all
R. philippinarum individuals amplified with the universal
primers for invertebrates coincided with the F-type COI
sequence (AB065375), but the M-type COI sequence of
R. philippinarum (AB0653745) was very different (figure
not shown). We excluded the M-type COI sequence from
further analysis. The results confirmed that the COI
sequences amplified with the universal primers for inver-
tebrates were the F-type COI sequence of R. philippinarum
and R. form (Fig. 2).The number of private haplotypes was
60 for R. philippinarum collected in Japan (hereafter Jap-
anese R. philippinarum), 19 for R. philippinarum collected
in China (Chinese R. philippinarum), and 31 for R. form,
Ruditapes philippinarum (AB065375|F-Type)
Ruditapes philippinarum (Hap15)
Ruditapes philippinarum (Hap24)
Ruditapes philippinarum (Hap32)
Ruditapes philippinarum (Hap2)
Ruditapes philippinarum (Hap6)
Ruditapes philippinarum (JN054502|Nb(a))
Ruditapes form (Hap115)
Ruditapes philippinarum (HQ703308|SZ(b))
Ruditapes philippinarum (HQ703310|NJ(b))
Ruditapes philippinarum (AB244408|Xm(a))
Ruditapes philippinarum (JN054515|Gz(a))
Ruditapes philippinarum (HQ703311|BMJ(b))
Ruditapes philippinarum (JN054610|Pt(a))
Ruditapes form (Hap92)
Ruditapes philippinarum (HQ703306|ZP(b))
Ruditapes variegatus (EF066719)
Ruditapes variegatus (JN248565)
Ruditapes variegata (HQ703315|SY(b))
Ruditapes variegata (HQ703312|BH(b))
Ruditapes variegata (HQ703314|WZ(b))
Ruditapes variegatus (Hap5)
Ruditapes variegatus (Hap6)
Ruditapes variegatus (Hap3)
Ruditapes bruguieri (DQ184829)
Ruditapes variegatus (Hap2)
Ruditapes variegatus (Hap7)
Ruditapes variegatus (Hap1)
Ruditapes variegatus (Hap4)
Ruditapes decussatus (DQ458492)
Meretrix lusoria (GQ903339)
Meretrix petechialis (EU145977)100
33
70
34
99
61
99
40
53
88
46
78
83
68
0.1
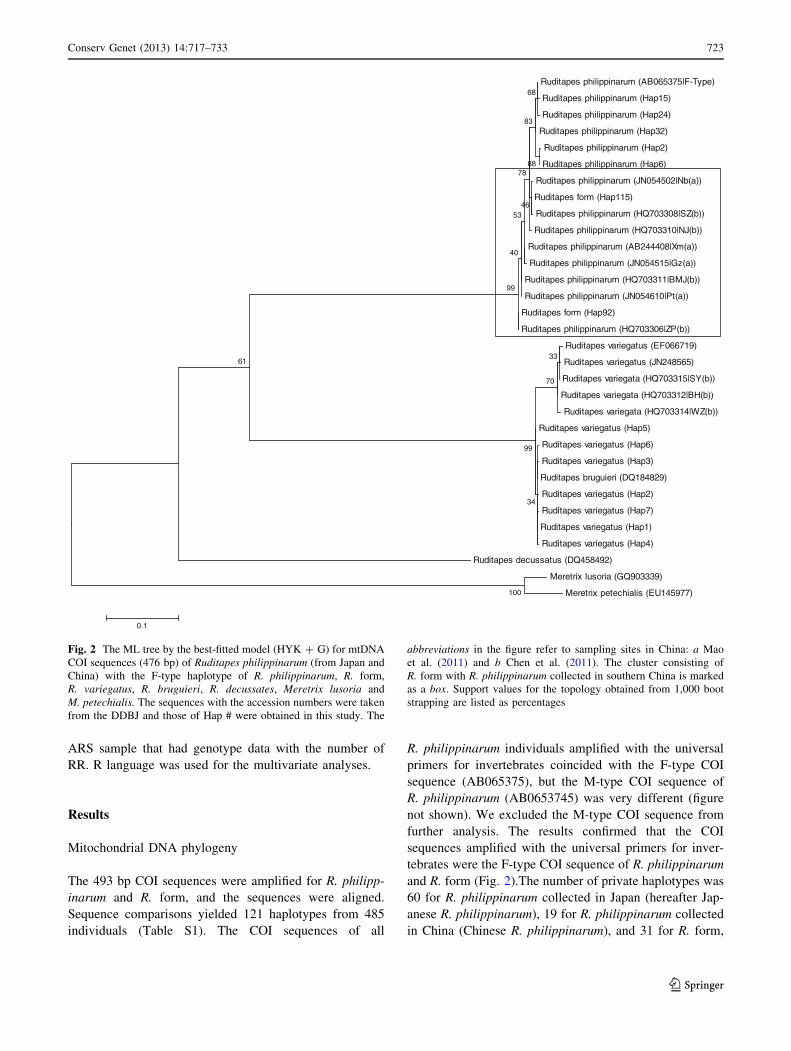
Fig. 2 The ML tree by the best-fitted model (HYK ? G) for mtDNA
COI sequences (476 bp) of Ruditapes philippinarum (from Japan and
China) with the F-type haplotype of R. philippinarum, R. form,
R. variegatus, R. bruguieri, R. decussates, Meretrix lusoria and
M. petechialis. The sequences with the accession numbers were taken
from the DDBJ and those of Hap # were obtained in this study. The
abbreviations in the figure refer to sampling sites in China: a Mao
et al. (2011) and b Chen et al. (2011). The cluster consisting of
R. form with R. philippinarum collected in southern China is marked
as a box. Support values for the topology obtained from 1,000 boot
strapping are listed as percentages
Conserv Genet (2013) 14:717–733 723
123
respectively. Hap 81, Hap 21 and Hap 72 were common for
Japanese/Chinese R. philippinarum and R. form. Japanese
and Chinese R. philippinarum shared four haplotypes (Hap
12, Hap 32, Hap 60, Hap 67), and Chinese R. philippina-
rum and R. form also shared four (Hap 22, Hap 97, Hap
106, Hap 110). For R. variegatus, 493 bp COI sequences
were also amplified and aligned. Sequence comparisons
yielded seven haplotypes from 50 individuals. The
sequences (493 bp) were submitted to the DDBJ, the
European Molecular Biology Laboratory (EMBL) and
Genbank databases under accession numbers AB694757–
AB694847 for R. philippinarum, AB694848–AB694884
for R. form, and AB694885–AB694891 for R. variegatus.
We aligned our sequences with those of the outgroups, and
476 bp sequences were obtained. The best substitution model
selected by BIC (4829.32) and AICc (4327.24) was Hase-
gawa–Kishino–Yano (HKY) (Hasegawa et al. 1985) with
discrete gamma rate heterogeneity among sites (?G) (Yang
1993). The best ML tree (HKY ? G) showed large genetic
differentiation of R. philippinarum from R. variegatus,
R. decussatus, M. lusoria and M. petechialis. Our haplotypes
of Japanese and Chinese R. philippinarum made a mono-
phyletic cluster. However, R. form belonged to a different
cluster of R. philippinarum collected in southern China
[(a) Mao et al. (2011) and (b) Chen et al. (2011)] (marked as a
box in Fig. 2). The evolutionary distance between our
Hap
58H
ap59
Hap
60H
ap61
Hap
62H
ap63
Hap
64H
ap55
Hap
57H
ap65
Hap
66H
ap67
Hap
56H
ap68
Hap42
Hap49
Hap37
Hap38
Hap43
Hap39
Hap44
Hap41
Hap40
Hap46
Hap50
Hap34
Hap35
Hap36
Hap48
Hap52
Hap33
Hap53
Hap47Hap51Hap54Hap69
Hap32Hap45
Hap77Hap70Hap71Hap72Hap74Hap73Hap75Hap76Hap29Hap30
Hap31
Hap78
Hap79
Hap4
Hap5
Hap3
Hap2
Hap9
Hap10
Hap6
Hap7
Hap8
Hap11
Hap13
Hap12
Hap2862pa
HHap27
Hap14
Hap22
Hap24
Hap23
Hap21
Hap25
Hap15
Hap18
Hap20
Hap19
Hap16
Hap17Hap80Hap
1
Hap11
5Hap
116
Hap117Hap118Hap119Hap120Hap121Hap114Hap112Hap110Hap111
Hap113Hap108Hap109Hap104Hap105
Hap106
Hap107
Hap86
Hap87
Hap88
Hap89
Hap82
Hap83
Hap84
Hap85
Hap81
Hap90
Hap91
Hap103
Hap101
Hap102
Hap97Hap99
Hap98
Hap100
Hap95
Hap94
Hap92
Hap93
Hap96
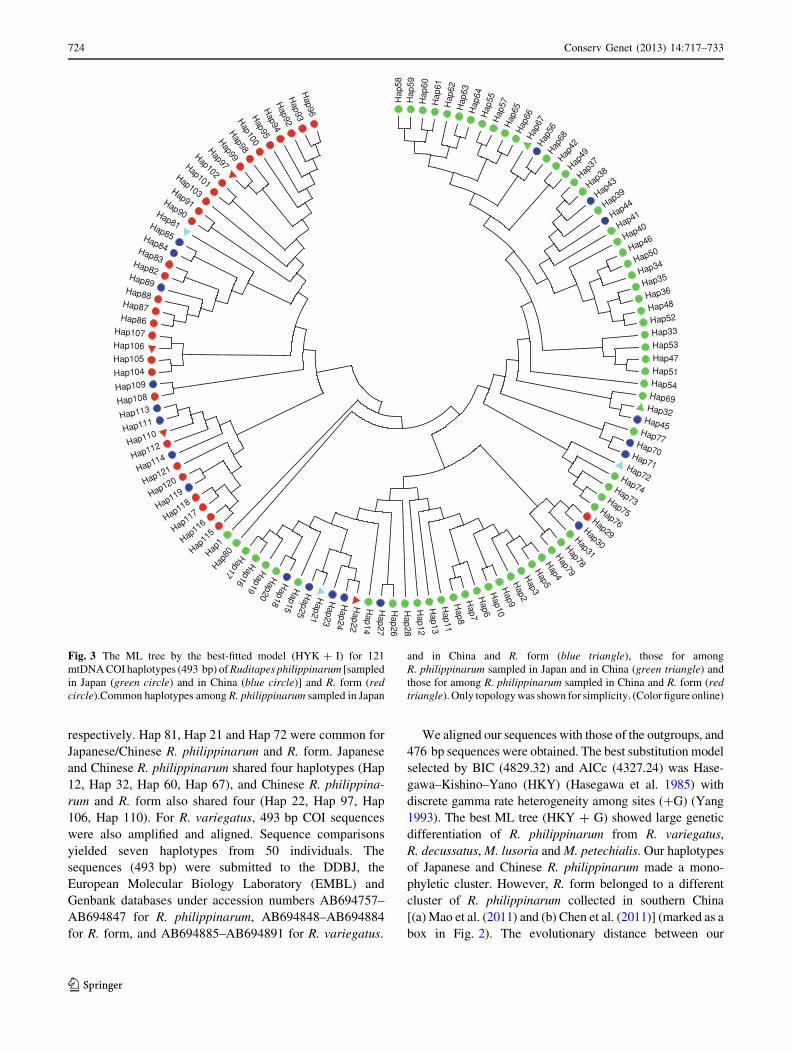
Fig. 3 The ML tree by the best-fitted model (HYK ? I) for 121
mtDNA COI haplotypes (493 bp) of Ruditapes philippinarum [sampled
in Japan (green circle) and in China (blue circle)] and R. form (redcircle).Common haplotypes among R. philippinarum sampled in Japan
and in China and R. form (blue triangle), those for among
R. philippinarum sampled in Japan and in China (green triangle) and
those for among R. philippinarum sampled in China and R. form (redtriangle). Only topology was shown for simplicity. (Color figure online)
724 Conserv Genet (2013) 14:717–733
123
R. philippinarum and R. form samples was much smaller than
that between R. variegatus samples collected in southern
China (Chen et al. 2011), and our sample collected in Japan.
The sequence of R. bruguieri (Mikkelsen et al. 2006) was
homologous with those of our R. variegatus sample.
When analysing our 121 haplotype sequences (493 bp) of
R. philippinarum and R. form, the best substitution model
selected by BIC (5922.16) was HKY with a certain fraction
of invariable sites (?I) (Fitch and Margoliash 1967;
Shoemaker and Fitch 1989). The AICc (3722.30) selected a
different model: Tamura–Nei (TN93) (Tamura and Nei
1993) (?I). The best BIC ML tree (HKY ? I) detected clear
genetic differentiation of R. form from R. philippinarum, and
Chinese R. philippinarum was included in both clusters: the
cluster mainly consisting of R. philippinarum and the cluster
mainly consisting of R. form and some common haplotypes
(Fig. 3). A network diagram of the 121 haplotypes also
identified two distinct clusters of R. philippinarum and
R. form (Fig. S2). Three individuals from TKB-3 and MKB
had a major haplotype of R. form and Chinese R. philippin-
arum (Hap 81). Two individuals from ARS had minor hap-
lotypes of R. form from Dandong (Hap 21 and Hap 72)
(Table S1). However, we found no diagnostic haplotype
composition between R. form and Japanese R. philippinarum
samples.
Genetic diversity, population structure
and introgression
Numbers of haplotypes, haplotype diversity and nucleotide
diversity were relatively high in all samples except for RGT
and USB, which were taken from small pure populations
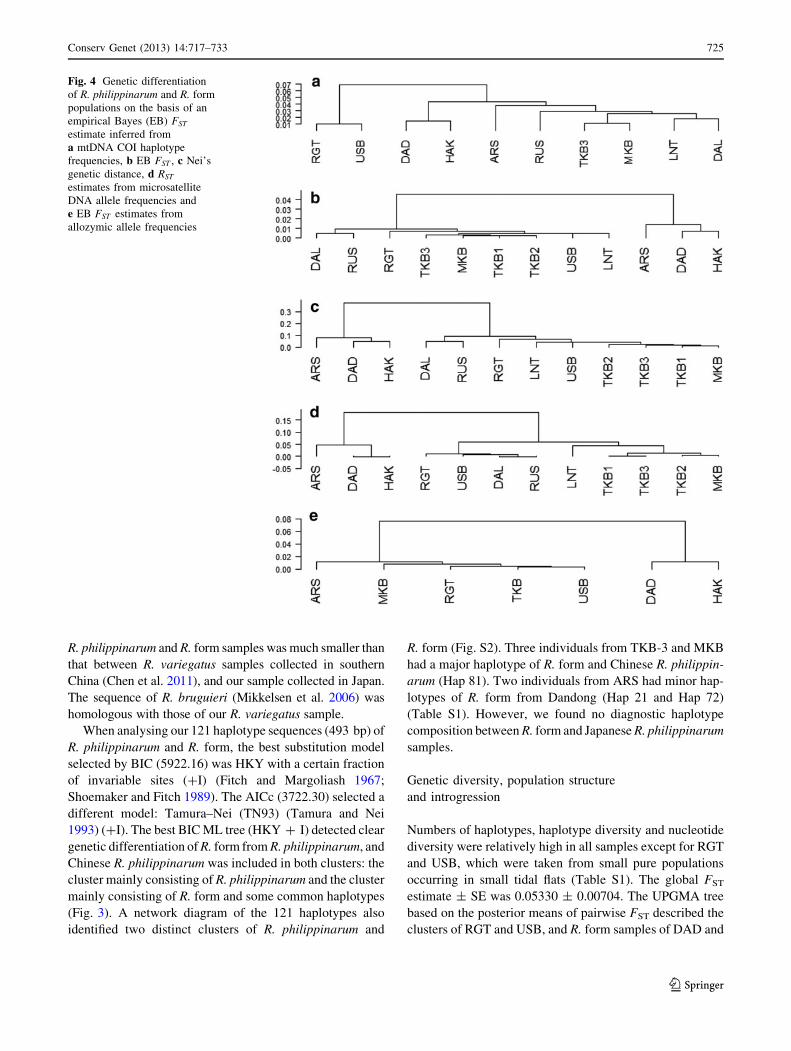
occurring in small tidal flats (Table S1). The global FST
estimate ± SE was 0.05330 ± 0.00704. The UPGMA tree
based on the posterior means of pairwise FST described the
clusters of RGT and USB, and R. form samples of DAD and
Fig. 4 Genetic differentiation
of R. philippinarum and R. form
populations on the basis of an
empirical Bayes (EB) FST
estimate inferred from
a mtDNA COI haplotype
frequencies, b EB FST , c Nei’s
genetic distance, d RST
estimates from microsatellite
DNA allele frequencies and
e EB FST estimates from
allozymic allele frequencies
Conserv Genet (2013) 14:717–733 725
123
HAK. ARS was in an intermediate position between R. form
samples and other Japanese and Chinese R. philippinarum
samples (Fig. 4a, Table S2). The network diagram suggested
no mtDNA introgression of R. form into R. philippinarum
populations of the Ariake Sea and Tokyo Bay (Fig. S2).
The locus Asari 55 departed significantly from HWE in all
samples; therefore, we excluded the genotype data from
further analysis. For the three microsatellite loci, 63 alleles
were found among 807 Japanese R. philippinarum, 199
Chinese R. philippinarum, and 180 R. form. All samples were
in HWE at the loci Asari 62 and Asari 64 (except LNT),
although four samples departed from HWE at Asari 16,
supporting the proposal that all samples were collected from
naturally produced and/or wild populations. The mean
number of alleles and observed heterozygosity per locus
was 11.3–18.3 and 0.570–0.790. When compared with the
R. philippinarum samples, there was a private allele in
samples of R. form (143 at Asari 64), but it was a very minor
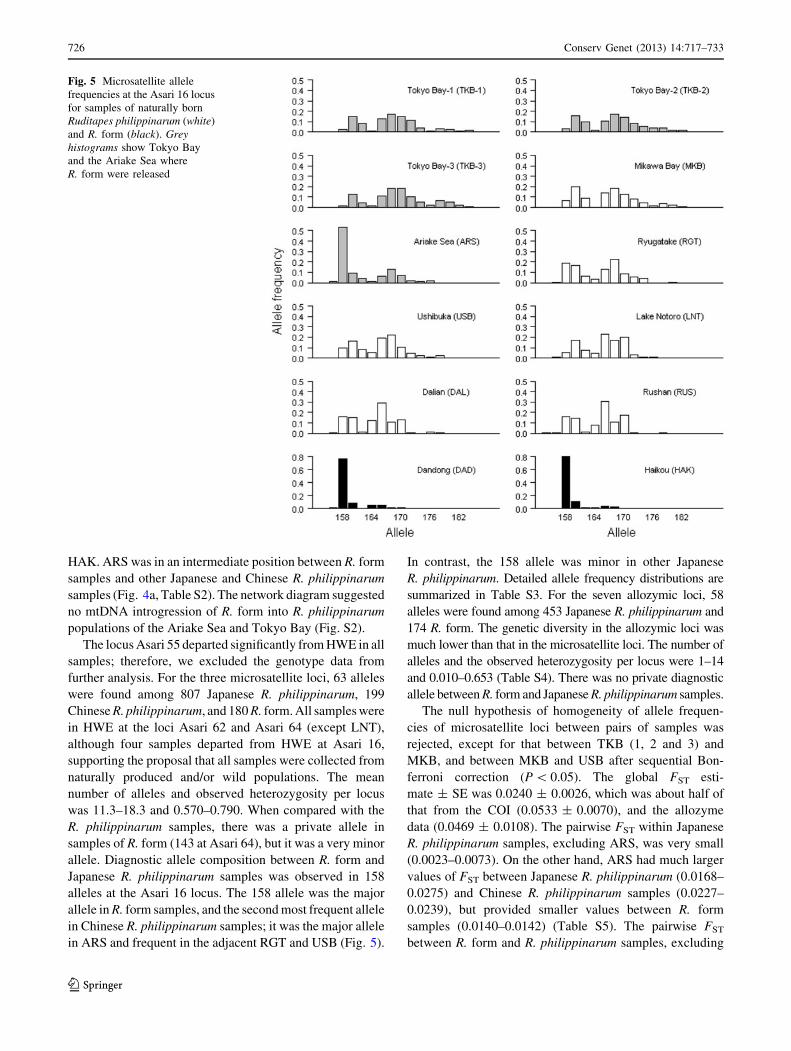
allele. Diagnostic allele composition between R. form and
Japanese R. philippinarum samples was observed in 158
alleles at the Asari 16 locus. The 158 allele was the major
allele in R. form samples, and the second most frequent allele
in Chinese R. philippinarum samples; it was the major allele
in ARS and frequent in the adjacent RGT and USB (Fig. 5).
In contrast, the 158 allele was minor in other Japanese
R. philippinarum. Detailed allele frequency distributions are
summarized in Table S3. For the seven allozymic loci, 58
alleles were found among 453 Japanese R. philippinarum and
174 R. form. The genetic diversity in the allozymic loci was
much lower than that in the microsatellite loci. The number of
alleles and the observed heterozygosity per locus were 1–14
and 0.010–0.653 (Table S4). There was no private diagnostic
allele between R. form and Japanese R. philippinarum samples.
The null hypothesis of homogeneity of allele frequen-
cies of microsatellite loci between pairs of samples was
rejected, except for that between TKB (1, 2 and 3) and
MKB, and between MKB and USB after sequential Bon-
ferroni correction (P \ 0.05). The global FST esti-
mate ± SE was 0.0240 ± 0.0026, which was about half of
that from the COI (0.0533 ± 0.0070), and the allozyme
data (0.0469 ± 0.0108). The pairwise FST within Japanese
R. philippinarum samples, excluding ARS, was very small
(0.0023–0.0073). On the other hand, ARS had much larger
values of FST between Japanese R. philippinarum (0.0168–
0.0275) and Chinese R. philippinarum samples (0.0227–
0.0239), but provided smaller values between R. form
samples (0.0140–0.0142) (Table S5). The pairwise FST
between R. form and R. philippinarum samples, excluding
Fig. 5 Microsatellite allele
frequencies at the Asari 16 locus
for samples of naturally born
Ruditapes philippinarum (white)
and R. form (black). Greyhistograms show Tokyo Bay
and the Ariake Sea where
R. form were released
726 Conserv Genet (2013) 14:717–733
123
ARS, was the largest at 0.0424–0.0642 (Table S5). Nei’s
genetic distances were much higher than FST, which ranged
0.015–0.095 within Japanese R. philippinarum samples,
excluding ARS (Table S6). Those for ARS between Japa-
nese R. philippinarum (0.224–0.279) and Chinese R. phil-
ippinarum samples (0.201–0.230) were similar and very
large, but much smaller between R. form (0.062–0.095).
Those between R. form and R. philippinarum samples,
excluding ARS, was the highest at 0.317–0.567, but that
within R. form was small (0.046). The UPGMA dendro-
gram of the pairwise FST and Nei’s genetic distance clearly
described three clusters of Japanese R. philippinarum,
Chinese R. philippinarum and R. form, and revealed
genetic affinity of ARS with R. form, respectively (Fig. 4b,
c). The RST dendrogram also confirmed the three clusters
(Fig. 4d, Table S5). Interestingly, RGT and USB were in
the same cluster with Chinese R. philippinarum from DAL
and RUS, and other Japanese samples were included in
another cluster. The cluster analysis of the pairwise FST
based on allozymic allele frequencies supported the sig-
nificant genetic differentiation of R. form (0.0577–0.1062),
excluding ARS, and the difference of ARS (0.0049–
0.0154) from the Japanese R. philippinarum samples
(Fig. 4e, Table S7).
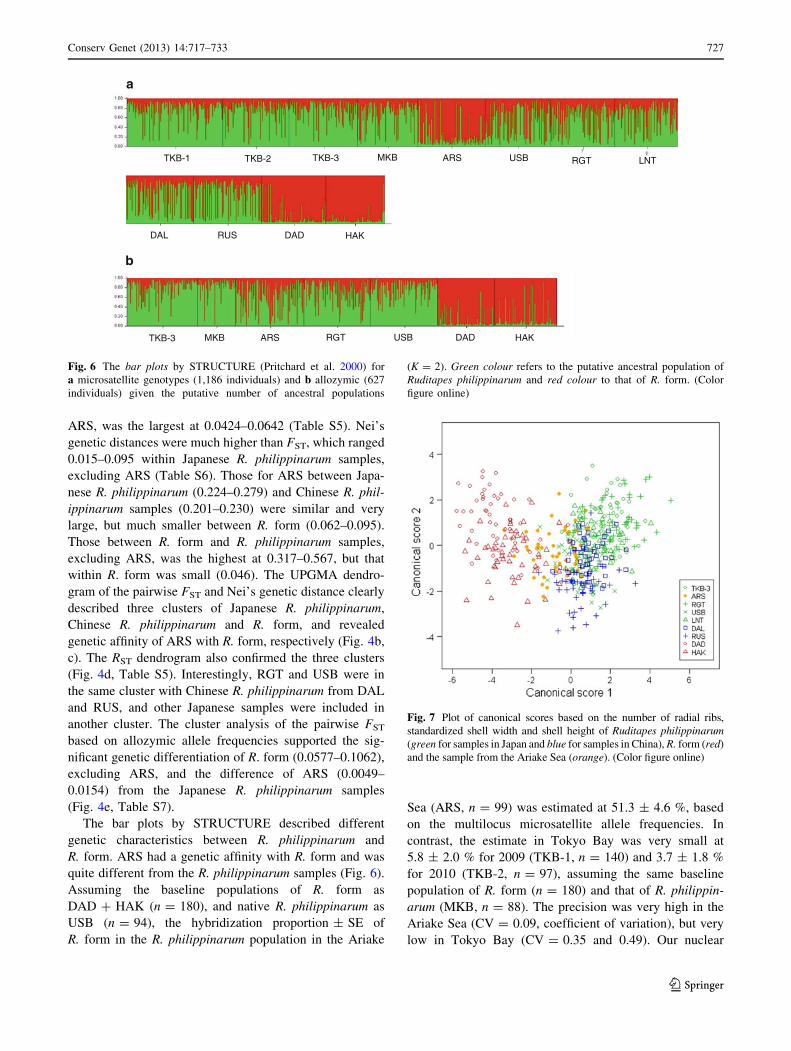
The bar plots by STRUCTURE described different
genetic characteristics between R. philippinarum and
R. form. ARS had a genetic affinity with R. form and was
quite different from the R. philippinarum samples (Fig. 6).
Assuming the baseline populations of R. form as
DAD ? HAK (n = 180), and native R. philippinarum as
USB (n = 94), the hybridization proportion ± SE of
R. form in the R. philippinarum population in the Ariake
Sea (ARS, n = 99) was estimated at 51.3 ± 4.6 %, based
on the multilocus microsatellite allele frequencies. In
contrast, the estimate in Tokyo Bay was very small at
5.8 ± 2.0 % for 2009 (TKB-1, n = 140) and 3.7 ± 1.8 %
for 2010 (TKB-2, n = 97), assuming the same baseline
population of R. form (n = 180) and that of R. philippin-
arum (MKB, n = 88). The precision was very high in the
Ariake Sea (CV = 0.09, coefficient of variation), but very
low in Tokyo Bay (CV = 0.35 and 0.49). Our nuclear
TKB-3 MKB ARS USB DAD HAKRGT
b
RUS DADDAL HAK
TKB-1 MKB ARS LNTUSB RGTTKB-2 TKB-3
a
Fig. 6 The bar plots by STRUCTURE (Pritchard et al. 2000) for
a microsatellite genotypes (1,186 individuals) and b allozymic (627
individuals) given the putative number of ancestral populations
(K = 2). Green colour refers to the putative ancestral population of
Ruditapes philippinarum and red colour to that of R. form. (Color
figure online)
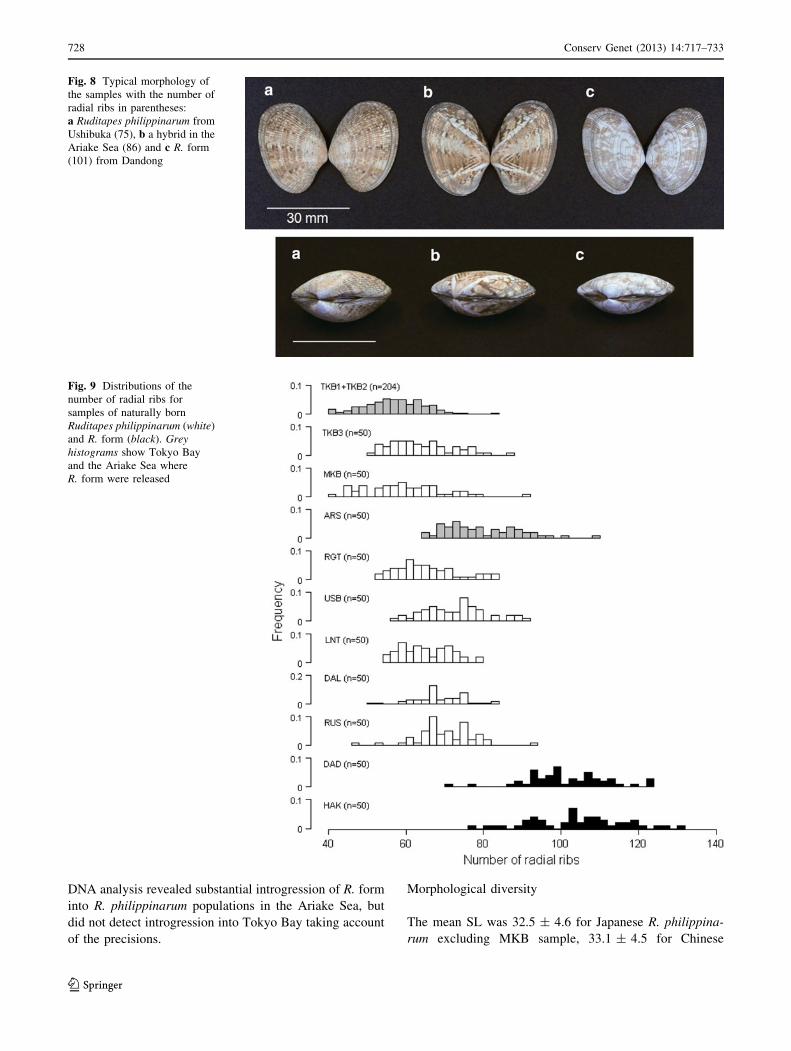
Fig. 7 Plot of canonical scores based on the number of radial ribs,
standardized shell width and shell height of Ruditapes philippinarum(green for samples in Japan and blue for samples in China), R. form (red)
and the sample from the Ariake Sea (orange). (Color figure online)
Conserv Genet (2013) 14:717–733 727
123
DNA analysis revealed substantial introgression of R. form
into R. philippinarum populations in the Ariake Sea, but
did not detect introgression into Tokyo Bay taking account
of the precisions.
Morphological diversity
The mean SL was 32.5 ± 4.6 for Japanese R. philippina-
rum excluding MKB sample, 33.1 ± 4.5 for Chinese
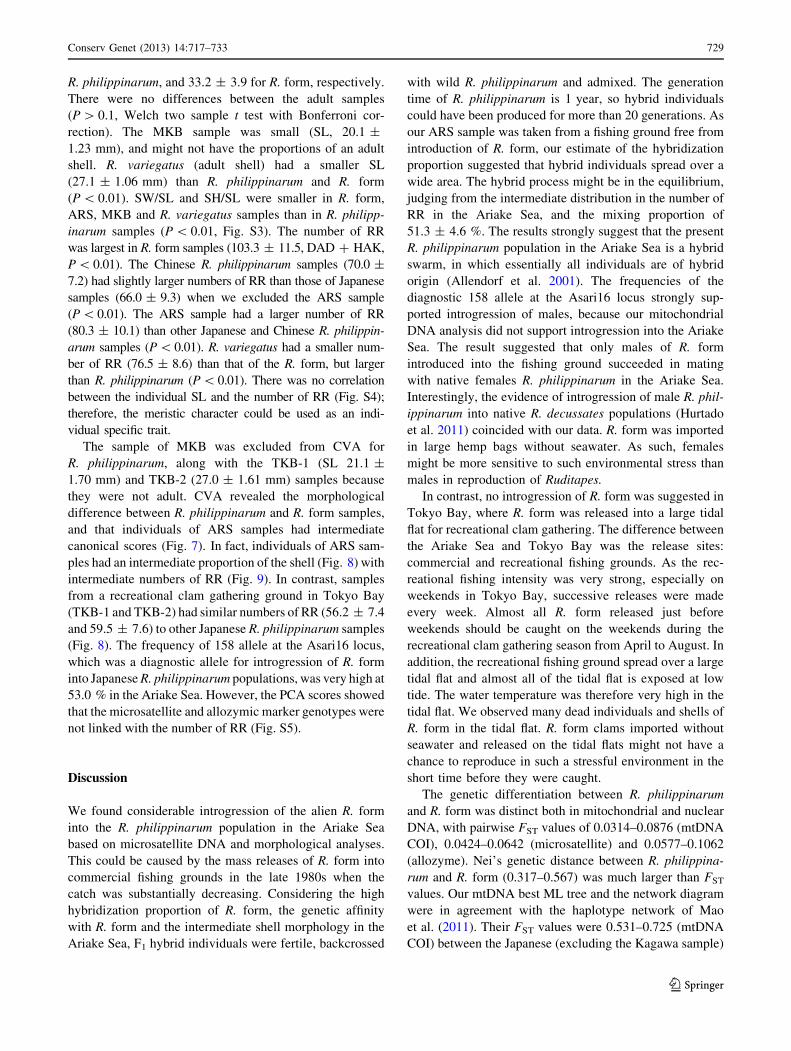
Fig. 8 Typical morphology of
the samples with the number of
radial ribs in parentheses:
a Ruditapes philippinarum from
Ushibuka (75), b a hybrid in the
Ariake Sea (86) and c R. form
(101) from Dandong
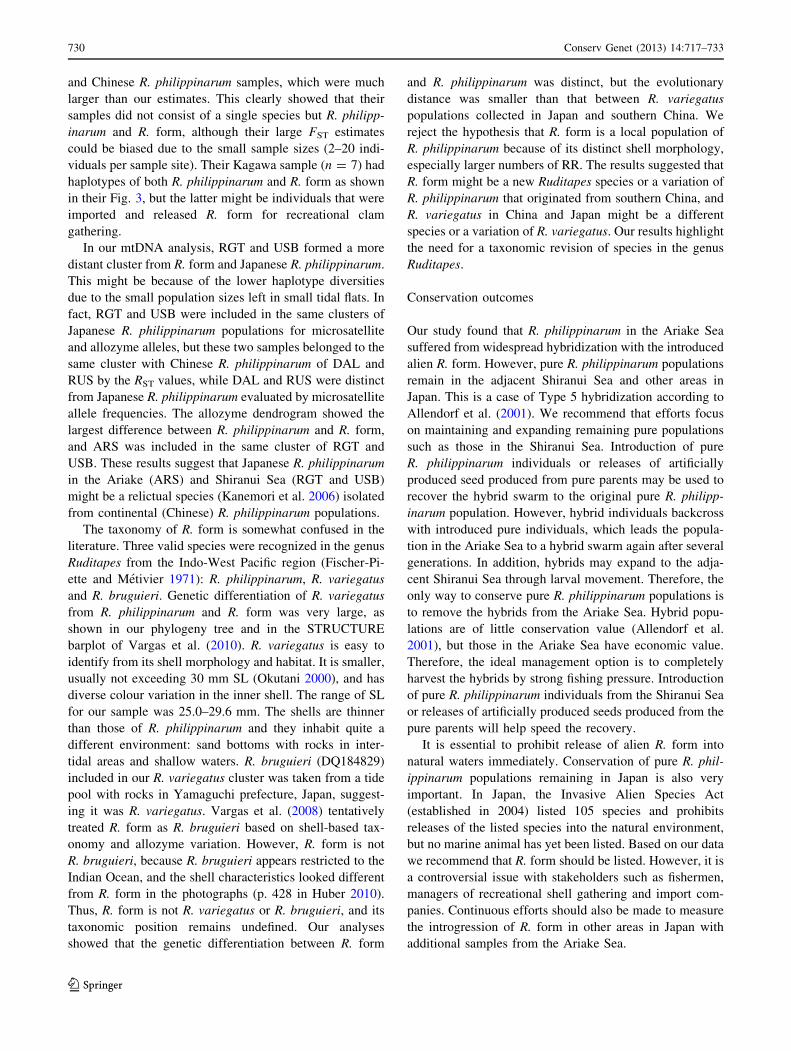
Fig. 9 Distributions of the
number of radial ribs for
samples of naturally born
Ruditapes philippinarum (white)
and R. form (black). Greyhistograms show Tokyo Bay
and the Ariake Sea where
R. form were released
728 Conserv Genet (2013) 14:717–733
123
R. philippinarum, and 33.2 ± 3.9 for R. form, respectively.
There were no differences between the adult samples
(P [ 0.1, Welch two sample t test with Bonferroni cor-
rection). The MKB sample was small (SL, 20.1 ±
1.23 mm), and might not have the proportions of an adult
shell. R. variegatus (adult shell) had a smaller SL
(27.1 ± 1.06 mm) than R. philippinarum and R. form
(P \ 0.01). SW/SL and SH/SL were smaller in R. form,
ARS, MKB and R. variegatus samples than in R. philipp-
inarum samples (P \ 0.01, Fig. S3). The number of RR
was largest in R. form samples (103.3 ± 11.5, DAD ? HAK,
P\ 0.01). The Chinese R. philippinarum samples (70.0 ±
7.2) had slightly larger numbers of RR than those of Japanese
samples (66.0 ± 9.3) when we excluded the ARS sample
(P \0.01). The ARS sample had a larger number of RR
(80.3 ± 10.1) than other Japanese and Chinese R. philippin-
arum samples (P \0.01). R. variegatus had a smaller num-
ber of RR (76.5 ± 8.6) than that of the R. form, but larger
than R. philippinarum (P \0.01). There was no correlation
between the individual SL and the number of RR (Fig. S4);
therefore, the meristic character could be used as an indi-
vidual specific trait.
The sample of MKB was excluded from CVA for
R. philippinarum, along with the TKB-1 (SL 21.1 ±
1.70 mm) and TKB-2 (27.0 ± 1.61 mm) samples because
they were not adult. CVA revealed the morphological
difference between R. philippinarum and R. form samples,
and that individuals of ARS samples had intermediate
canonical scores (Fig. 7). In fact, individuals of ARS sam-
ples had an intermediate proportion of the shell (Fig. 8) with
intermediate numbers of RR (Fig. 9). In contrast, samples
from a recreational clam gathering ground in Tokyo Bay
(TKB-1 and TKB-2) had similar numbers of RR (56.2 ± 7.4
and 59.5 ± 7.6) to other Japanese R. philippinarum samples
(Fig. 8). The frequency of 158 allele at the Asari16 locus,
which was a diagnostic allele for introgression of R. form
into Japanese R. philippinarum populations, was very high at
53.0 % in the Ariake Sea. However, the PCA scores showed
that the microsatellite and allozymic marker genotypes were
not linked with the number of RR (Fig. S5).
Discussion
We found considerable introgression of the alien R. form
into the R. philippinarum population in the Ariake Sea
based on microsatellite DNA and morphological analyses.
This could be caused by the mass releases of R. form into
commercial fishing grounds in the late 1980s when the
catch was substantially decreasing. Considering the high
hybridization proportion of R. form, the genetic affinity
with R. form and the intermediate shell morphology in the
Ariake Sea, F1 hybrid individuals were fertile, backcrossed
with wild R. philippinarum and admixed. The generation
time of R. philippinarum is 1 year, so hybrid individuals
could have been produced for more than 20 generations. As
our ARS sample was taken from a fishing ground free from
introduction of R. form, our estimate of the hybridization
proportion suggested that hybrid individuals spread over a
wide area. The hybrid process might be in the equilibrium,
judging from the intermediate distribution in the number of
RR in the Ariake Sea, and the mixing proportion of
51.3 ± 4.6 %. The results strongly suggest that the present
R. philippinarum population in the Ariake Sea is a hybrid
swarm, in which essentially all individuals are of hybrid
origin (Allendorf et al. 2001). The frequencies of the
diagnostic 158 allele at the Asari16 locus strongly sup-
ported introgression of males, because our mitochondrial
DNA analysis did not support introgression into the Ariake
Sea. The result suggested that only males of R. form
introduced into the fishing ground succeeded in mating
with native females R. philippinarum in the Ariake Sea.
Interestingly, the evidence of introgression of male R. phil-
ippinarum into native R. decussates populations (Hurtado
et al. 2011) coincided with our data. R. form was imported
in large hemp bags without seawater. As such, females
might be more sensitive to such environmental stress than
males in reproduction of Ruditapes.
In contrast, no introgression of R. form was suggested in
Tokyo Bay, where R. form was released into a large tidal
flat for recreational clam gathering. The difference between
the Ariake Sea and Tokyo Bay was the release sites:
commercial and recreational fishing grounds. As the rec-
reational fishing intensity was very strong, especially on
weekends in Tokyo Bay, successive releases were made
every week. Almost all R. form released just before
weekends should be caught on the weekends during the
recreational clam gathering season from April to August. In
addition, the recreational fishing ground spread over a large
tidal flat and almost all of the tidal flat is exposed at low
tide. The water temperature was therefore very high in the
tidal flat. We observed many dead individuals and shells of
R. form in the tidal flat. R. form clams imported without
seawater and released on the tidal flats might not have a
chance to reproduce in such a stressful environment in the
short time before they were caught.
The genetic differentiation between R. philippinarum
and R. form was distinct both in mitochondrial and nuclear
DNA, with pairwise FST values of 0.0314–0.0876 (mtDNA
COI), 0.0424–0.0642 (microsatellite) and 0.0577–0.1062
(allozyme). Nei’s genetic distance between R. philippina-
rum and R. form (0.317–0.567) was much larger than FST
values. Our mtDNA best ML tree and the network diagram
were in agreement with the haplotype network of Mao
et al. (2011). Their FST values were 0.531–0.725 (mtDNA
COI) between the Japanese (excluding the Kagawa sample)
Conserv Genet (2013) 14:717–733 729
123
and Chinese R. philippinarum samples, which were much
larger than our estimates. This clearly showed that their
samples did not consist of a single species but R. philipp-
inarum and R. form, although their large FST estimates
could be biased due to the small sample sizes (2–20 indi-
viduals per sample site). Their Kagawa sample (n = 7) had
haplotypes of both R. philippinarum and R. form as shown
in their Fig. 3, but the latter might be individuals that were
imported and released R. form for recreational clam
gathering.
In our mtDNA analysis, RGT and USB formed a more
distant cluster from R. form and Japanese R. philippinarum.
This might be because of the lower haplotype diversities
due to the small population sizes left in small tidal flats. In
fact, RGT and USB were included in the same clusters of
Japanese R. philippinarum populations for microsatellite
and allozyme alleles, but these two samples belonged to the
same cluster with Chinese R. philippinarum of DAL and
RUS by the RST values, while DAL and RUS were distinct
from Japanese R. philippinarum evaluated by microsatellite
allele frequencies. The allozyme dendrogram showed the
largest difference between R. philippinarum and R. form,
and ARS was included in the same cluster of RGT and
USB. These results suggest that Japanese R. philippinarum
in the Ariake (ARS) and Shiranui Sea (RGT and USB)
might be a relictual species (Kanemori et al. 2006) isolated
from continental (Chinese) R. philippinarum populations.
The taxonomy of R. form is somewhat confused in the
literature. Three valid species were recognized in the genus
Ruditapes from the Indo-West Pacific region (Fischer-Pi-
ette and Metivier 1971): R. philippinarum, R. variegatus
and R. bruguieri. Genetic differentiation of R. variegatus
from R. philippinarum and R. form was very large, as
shown in our phylogeny tree and in the STRUCTURE
barplot of Vargas et al. (2010). R. variegatus is easy to
identify from its shell morphology and habitat. It is smaller,
usually not exceeding 30 mm SL (Okutani 2000), and has
diverse colour variation in the inner shell. The range of SL
for our sample was 25.0–29.6 mm. The shells are thinner
than those of R. philippinarum and they inhabit quite a
different environment: sand bottoms with rocks in inter-
tidal areas and shallow waters. R. bruguieri (DQ184829)
included in our R. variegatus cluster was taken from a tide
pool with rocks in Yamaguchi prefecture, Japan, suggest-
ing it was R. variegatus. Vargas et al. (2008) tentatively
treated R. form as R. bruguieri based on shell-based tax-
onomy and allozyme variation. However, R. form is not
R. bruguieri, because R. bruguieri appears restricted to the
Indian Ocean, and the shell characteristics looked different
from R. form in the photographs (p. 428 in Huber 2010).
Thus, R. form is not R. variegatus or R. bruguieri, and its
taxonomic position remains undefined. Our analyses
showed that the genetic differentiation between R. form
and R. philippinarum was distinct, but the evolutionary
distance was smaller than that between R. variegatus
populations collected in Japan and southern China. We
reject the hypothesis that R. form is a local population of
R. philippinarum because of its distinct shell morphology,
especially larger numbers of RR. The results suggested that
R. form might be a new Ruditapes species or a variation of
R. philippinarum that originated from southern China, and
R. variegatus in China and Japan might be a different
species or a variation of R. variegatus. Our results highlight
the need for a taxonomic revision of species in the genus
Ruditapes.
Conservation outcomes
Our study found that R. philippinarum in the Ariake Sea
suffered from widespread hybridization with the introduced
alien R. form. However, pure R. philippinarum populations
remain in the adjacent Shiranui Sea and other areas in
Japan. This is a case of Type 5 hybridization according to
Allendorf et al. (2001). We recommend that efforts focus
on maintaining and expanding remaining pure populations
such as those in the Shiranui Sea. Introduction of pure
R. philippinarum individuals or releases of artificially
produced seed produced from pure parents may be used to
recover the hybrid swarm to the original pure R. philipp-
inarum population. However, hybrid individuals backcross
with introduced pure individuals, which leads the popula-
tion in the Ariake Sea to a hybrid swarm again after several
generations. In addition, hybrids may expand to the adja-
cent Shiranui Sea through larval movement. Therefore, the
only way to conserve pure R. philippinarum populations is
to remove the hybrids from the Ariake Sea. Hybrid popu-
lations are of little conservation value (Allendorf et al.
2001), but those in the Ariake Sea have economic value.
Therefore, the ideal management option is to completely
harvest the hybrids by strong fishing pressure. Introduction
of pure R. philippinarum individuals from the Shiranui Sea
or releases of artificially produced seeds produced from the
pure parents will help speed the recovery.
It is essential to prohibit release of alien R. form into
natural waters immediately. Conservation of pure R. phil-
ippinarum populations remaining in Japan is also very
important. In Japan, the Invasive Alien Species Act
(established in 2004) listed 105 species and prohibits
releases of the listed species into the natural environment,
but no marine animal has yet been listed. Based on our data
we recommend that R. form should be listed. However, it is
a controversial issue with stakeholders such as fishermen,
managers of recreational shell gathering and import com-
panies. Continuous efforts should also be made to measure
the introgression of R. form in other areas in Japan with
additional samples from the Ariake Sea.
730 Conserv Genet (2013) 14:717–733
123
Acknowledgments We thank Robert Toonen and three anonymous
reviewers for constructive comments on earlier versions of the
manuscript. This study was funded by the Japan Society for the
Promotion of Science to SK (Funding No. 18380114 and 22380110).
We thank Takuma Sugaya for his advice on molecular experiments,
and Mitsuharu Toba, Masaaki Kuroda, Takahiro Kudo, Toyoshige
Yanagisawa, Sun Zonghmin, and staff of Dalian Ocean University
and Hainan University for their kind assistance during the fieldwork
in Japan and China. We also thank Jiro Tanaka and Kotaro Tsuchiya
for advice on the taxonomy of Ruditapes species.
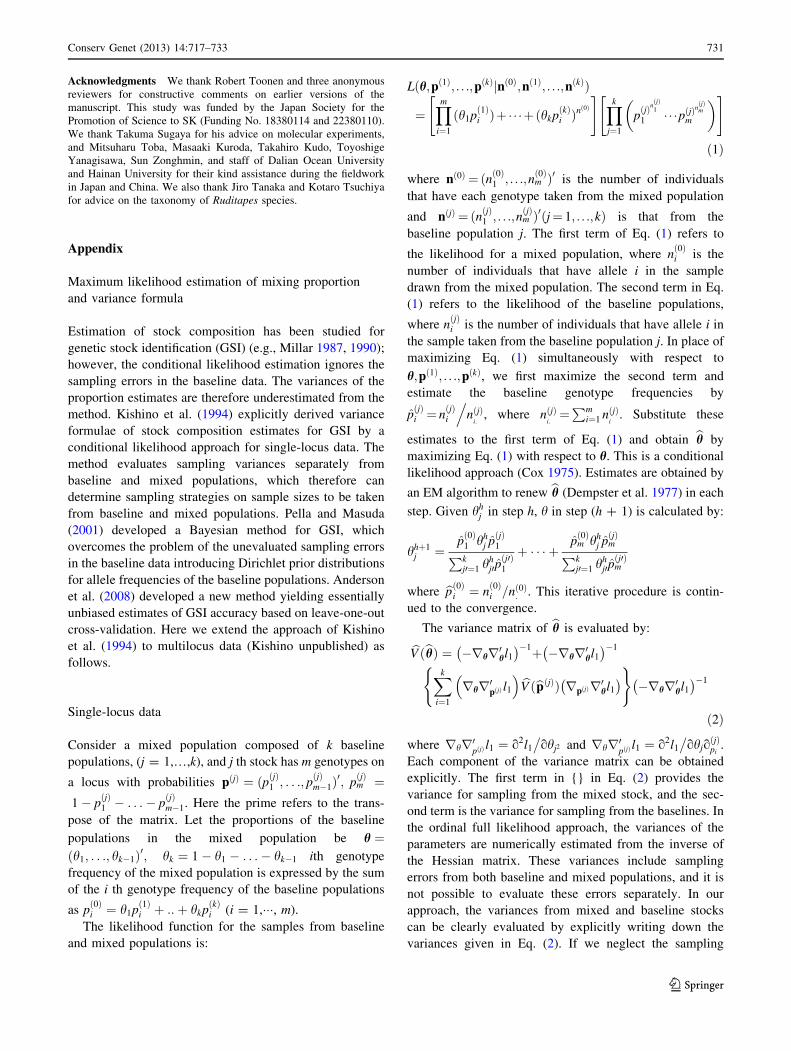
Appendix
Maximum likelihood estimation of mixing proportion
and variance formula
Estimation of stock composition has been studied for
genetic stock identification (GSI) (e.g., Millar 1987, 1990);
however, the conditional likelihood estimation ignores the
sampling errors in the baseline data. The variances of the
proportion estimates are therefore underestimated from the
method. Kishino et al. (1994) explicitly derived variance
formulae of stock composition estimates for GSI by a
conditional likelihood approach for single-locus data. The
method evaluates sampling variances separately from
baseline and mixed populations, which therefore can
determine sampling strategies on sample sizes to be taken
from baseline and mixed populations. Pella and Masuda
(2001) developed a Bayesian method for GSI, which
overcomes the problem of the unevaluated sampling errors
in the baseline data introducing Dirichlet prior distributions
for allele frequencies of the baseline populations. Anderson
et al. (2008) developed a new method yielding essentially
unbiased estimates of GSI accuracy based on leave-one-out
cross-validation. Here we extend the approach of Kishino
et al. (1994) to multilocus data (Kishino unpublished) as
follows.
Single-locus data
Consider a mixed population composed of k baseline
populations, (j = 1,…,k), and j th stock has m genotypes on
a locus with probabilities pðjÞ ¼ ðpðjÞ1 ; . . .; pðjÞm�1Þ
0; pðjÞm ¼
1� pðjÞ1 � . . .� p
ðjÞm�1. Here the prime refers to the trans-
pose of the matrix. Let the proportions of the baseline
populations in the mixed population be h ¼ðh1; . . .; hk�1Þ0; hk ¼ 1� h1 � . . .� hk�1 ith genotype
frequency of the mixed population is expressed by the sum
of the i th genotype frequency of the baseline populations
as pð0Þi ¼ h1p
ð1Þi þ ::þ hkp
ðkÞi (i = 1,���, m).
The likelihood function for the samples from baseline
and mixed populations is:
Lðh;pð1Þ; . . .;pðkÞjnð0Þ;nð1Þ; . . .;nðkÞÞ
¼Ym
i¼1
ðh1pð1Þi Þþ � � �þðhkp
ðkÞi Þ
nð0Þ
" #Yk
j¼1
pðjÞnðjÞ1
1 � � �pðjÞnðjÞm
m
� �" #
ð1Þ
where nð0Þ ¼ ðnð0Þ1 ; . . .;nð0Þm Þ0 is the number of individuals
that have each genotype taken from the mixed population
and nðjÞ ¼ ðnðjÞ1 ; . . .;nðjÞm Þ0ðj¼ 1; . . .;kÞ is that from the
baseline population j. The first term of Eq. (1) refers to
the likelihood for a mixed population, where nð0Þi is the
number of individuals that have allele i in the sample
drawn from the mixed population. The second term in Eq.
(1) refers to the likelihood of the baseline populations,
where nðjÞi is the number of individuals that have allele i in
the sample taken from the baseline population j. In place of
maximizing Eq. (1) simultaneously with respect to
h;pð1Þ; . . .;pðkÞ, we first maximize the second term and
estimate the baseline genotype frequencies by
pðjÞi ¼ n
ðjÞi
.nðjÞ
i:, where nðjÞ
i:¼Pm
i¼1 nðjÞi
. Substitute these
estimates to the first term of Eq. (1) and obtain bh by
maximizing Eq. (1) with respect to h. This is a conditional
likelihood approach (Cox 1975). Estimates are obtained by
an EM algorithm to renew bh (Dempster et al. 1977) in each
step. Given hhj in step h, h in step (h ? 1) is calculated by:
hhþ1j ¼
pð0Þ1 hh
j pðjÞ1
Pkj0¼1 hh
j0pðj0Þ1
þ � � � þpð0Þm hh
j pðjÞm
Pkj0¼1 hh
j0pðj0Þm
where bpð0Þi ¼ nð0Þi =nð0Þ: . This iterative procedure is contin-
ued to the convergence.
The variance matrix of bh is evaluated by:
bV ðbhÞ ¼ �rhr0hl1
� ��1þ �rhr0hl1
� ��1
Xk
i¼1
rhr0pðjÞ l1
� �bV ðbpðjÞÞ rpðjÞr0hl1
� �( )
�rhr0hl1
� ��1
ð2Þ
where rhr0pðjÞ l1 ¼ o2l1�ohj2 and rhr0pðjÞ l1 ¼ o2l1
�ohjo
ðjÞpi
.
Each component of the variance matrix can be obtained
explicitly. The first term in {} in Eq. (2) provides the
variance for sampling from the mixed stock, and the sec-
ond term is the variance for sampling from the baselines. In
the ordinal full likelihood approach, the variances of the
parameters are numerically estimated from the inverse of
the Hessian matrix. These variances include sampling
errors from both baseline and mixed populations, and it is
not possible to evaluate these errors separately. In our
approach, the variances from mixed and baseline stocks
can be clearly evaluated by explicitly writing down the
variances given in Eq. (2). If we neglect the sampling
Conserv Genet (2013) 14:717–733 731
123
variances in estimating allele frequencies of the baseline
populations, the second term in {} equals 0 and the vari-
ance matrix becomes bV ðbhÞ ¼ �rhr0hl1� ��1
.
Multi-locus data
Assuming linkage equilibriums between loci, the likeli-
hood function across–over loci is the product of the like-
lihood function across loci:
Lðh; pð1;uÞ; . . .; pðk;uÞjnð0;uÞ; nð1;uÞ; . . .; nðk;uÞÞ
¼Yv
u¼1
Ymu
i¼1
h1pð1;uÞi þ � � � þ hkp
ðk;uÞi
� �nð0;uÞi
!
Yv
u¼1
Yk
j¼1
pðj;uÞn
ðj;uÞ1
1 � � � pðj;uÞnðj;uÞmu
mu
� � !
where v is the number of loci (u = 1, …, v).Similarly, for
the single-locus model, maximum likelihood estimates of
the mixing proportion bh are obtained by an EM algorithm.
Given hhj in step h, h in step (h ? 1) is calculated by:
hhþ1j ¼
Xv
u¼1
nð0;uÞ
Pv
u0¼1
nð0;u0Þ
pð0;uÞ1 hh
j pðj;uÞ1
Pkj0¼1 hh
j0 pðj0;uÞ1
þ �� �þpð0;uÞ1 hh
j pðj;uÞ1
Pkj0¼1 hh
j0 pðj0;uÞmu
" #
where bpð0;uÞi ¼ nð0;uÞi =nð0;uÞ: . This iterative procedure is
continued to the convergence.
The variance matrix of bh is evaluated by:
bV ðbhÞ ¼ �Xv
u¼1
rhr0hlðuÞ1
!�1
þ �Xv
u¼1
rhr0hlðuÞ1
!�1
Xv
u¼1
Xk
j¼1
rhr0pðj;uÞ lðuÞ1
� �bV ðbpðj;uÞÞ rpðj;uÞr0hlðuÞ
1
� � !
�Xv
u¼1
rhr0hlðuÞ1
!�1
Each component of the variance matrix can be explicitly
given similarly to the single-locus model.
References
Akaike H (1974) A new look at the statistical model identification.
IEEE Trans Autom Control 19:716–723
Allendorf FW, Leary RF, Spruell P, Wenburg JK (2001) The
problems with hybrids: setting conservation guidelines. Trends
Ecol Evol 16:613–622
Anderson EC, Waples RS, Kalinowski ST (2008) An improved
method for predicting the accuracy of genetic stock identifica-
tion. Can J Fish Aquat Sci 65:1475–1486
Bandelt H-J, Foster P, Rohl A (1999) Median-joining networks
inferring intraspecific phylogenies. Mol Biol Evol 16:37–48
Bax N, Williamson A, Aguero M, Gonzalez E, Geeves W (2003)
Marine invasive alien species: a threat to global biodiversity.
Mar Policy 27:313–323
Becker P, Barringer C, Marelli DC (2008) Thirty years of sea
ranching Manila clams (Venerupis philippinarum): successful
techniques and lessons learned. Rev Fish Sci 16:44–50
Chen J, Qi Li Q, Kong L, Yu H (2011) How DNA barcodes
complement taxonomy and explore species diversity: the case
study of a poorly understood marine fauna. PLoS One
6(6):e21326. doi:10.1371/journal.pone.0021326
Chiesa S, Nonnis Marzano F, Minervini G et al (2011) The invasive
Manila clam Ruditapes philippinarum (Adams and Reeve, 1850)
in Northern Adriatic Sea: population genetics assessed by an
integrated molecular approach. Fish Res 110:259–267
Cox DR (1975) Partial likelihood. Biometrika 62:269–276
Dempster AP, Laird NM, Rubin DB (1977) Maximum likelihood
from incomplete data via the EM algorithm. J R Stat Soc
B39:415–423
Drummond L, Mulcahy M, Culloty S (2006) The reproductive
biology of the Manila clam, Ruditapes philippinarum, from the
north-west of Ireland. Aquaculture 254:326–340
Excoffier L, Laval G, Schneider S (2005) Arlequin ver. 3.0: an
integrated software package for population genetics data anal-
ysis. Evol Bioinformatics Online 1:47–50
Felsenstein J (1981) Evolutionary trees from DNA sequences: a
maximum likelihood approach. J Mol Evol 17:368–376
Fischer-Piette E, Metivier B (1971) Revision de Tapetinae (mollus-
ques bivalves). Memoires du Museum National D0Histoire
Naturelle. Ser A (Zool) 71:1–106
Fisheries Research Agency and National Association for the Promo-
tion of Productive Seas (2011) Annual statistics of seed
production and release in 2009. National Association for the
Promotion of Productive Seas, Tokyo (in Japanese)
Fitch WM, Margoliash E (1967) A method for estimating the number
of invariant amino acid coding positions in a gene using
cytochrome c as a model case. Biochem Genet 1:65–71
Flye-Sainte-Marie J, Jean F, Paillard C et al (2007) Ecophysiological
dynamic model of individual growth of Ruditapes philippina-rum. Aquaculture 266:130–143
Folmer O, Black M, Hoeh W, Lutz R, Vrijenhoek R (1994) DNA
primers for amplification of mitochondrial cytochrome c oxidase
subunit I from diverse metazoan invertebrates. Mol Mar Biol
Biotechnol 3(5):294–299
Gosling E (2003) Bivalve molluscs: biology, ecology and culture.
Fishing News Books, Oxford
Guindon S, Gascuel O (2003) A simple, fast, and accurate algorithm
to estimate large phylogenies by maximum likelihood. Syst Biol
52:696–704
Hardy OJ, Vekemans X (2002) SPAGeDi: a versatile computer
program to analyse spatialgenetic structure at the individual or
population levels. Mol Ecol Notes 2:618–620
Hasegawa M, Kishino H, Yano T (1985) Dating of the human–ape
splitting by a molecular clock of mitochondrial DNA. J Mol Evol
22:160–174
Huber M (2010) Compendium of bibalves. Conch Books,
Hackenheim
Hurtado NS, Perez-Garcıa C, Moran P, Pasantes JJ (2011) Genetic and
cytological evidence of hybridization between native Ruditapesdecussatus and introduced Ruditapes philippinarum (Mollusca,
Bivalvia, Veneridae) in NW Spain. Aquaculture 311:123–128
Hurvich CM, Tsai C-L (1989) Regression and time series model
selection in small samples. Biometrika 76:297–307
Kanemori Y, Takegaki T, Natsukari Y (2006) Genetic population
structure of the mudskipper Boleophthalmus pectinirostrisinferred from mitochondrial DNA sequences. Japan J Ichthyol
53(2): 133–141 (in Japanese with English abstract)
732 Conserv Genet (2013) 14:717–733
123
Kishino H, Kitada S, Hiramatsu K (1994) Sampling scheme for the
estimation of the stock composition in the mixed population
based on genetic data. Nippon Suisan Gakkaishi 60:359–364 (in
Japanese with English abstract)
Kitada S, Kitakado T, Kishino H (2007) Empirical Bayes inference of
FST and its distribution in the genome. Genetics 177:861–873
Librado P, Rozas J (2009) DnaSP v5: a software for comprehensive
analysis of DNA polymorphism data. Bioinformatics
25:1451–1452
Mao Y, Gao T, Yanagimoto T, Xiao Y (2011) Molecular phyloge-
ography of Ruditapes philippinarum in the Northwestern Pacific
Ocean based on COI gene. J Exp Mar Biol Ecol 407:171–181
Mikkelsen PM, Rudiger B, Kappner I, Rawlings TA (2006) Phylog-
eny of Veneroidea (Mollusca: Bivalvia) based on morphology
and molecules. Zool J Linn Soc 148:439–521
Millar RB (1987) Maximum likelihood estimation of mixed stock
fishery composition. Can J Fish Aquat Sci 44:583–590
Millar RB (1990) Comparison of methods for estimating mixed stock
fishery composition. Can J Fish Aquat Sci 47:2235–2241
Ministry of Agriculture, Forestry and Fisheries (1967–2011) Annual
statistics of fisheries and aquaculture production in 1965–2009.
Association of Agriculture and Forestry Statistics, Tokyo (in
Japanese)
Ministry of Finance (1991–2010) Trade Statistics of Japan in
1989–2008. Ministry of Finance, Tokyo (in Japanese)
Nei M (1978) Estimation of average heterozygosity and genetic
distance from a small number of individuals. Genetics
89:583–590
Nei M (1987) Molecular evolutionary genetics. Columbia University
Press, New York
Okutani T (2000) Marine mollusks in Japan. Tokai University Press,
Tokyo (in Japanese)
Palsbøll PJ, Berube M, Allendorf FW (2006) Identification of
management units using population genetic data. Trends Ecol
Evol 22:11–16
Passamonti M, Scali V (2001) Gender-associated mitochondrial DNA
heteroplasmy in the venerid clam Tapes philippinarum (Mol-
lusca: Bivalvia). Curr Genet 39:117–124
Passamonti M, Boore JL, Scali V (2003) Molecular evolution and
recombination in gender-associated mitochondrial DNAs of the
Manila clam Tapes philippinarum. Genetics 164:603–611
Peakall R, Smouse PE (2006) GENALEX6: genetic analysis in Excel.
Population genetic software for teaching and research. Mol Ecol
Note 6:288–295
Pella J, Masuda M (2001) Bayesian methods for analysis of stock
mixtures from genetic characters. Fish Bull 99:151–167
Plazzi F, Passamonti M (2010) Towards a molecular phylogeny of
mollusks: bivalves’ early evolution as revealed by mitochondrial
genes. Mol Phylogenet Evol 57:641–657
Posada D (2008) jModelTest: phylogenetic model averaging. Mol
Biol Evol 25:1253–1256
Posada D, Buckley TR (2004) Model selection and model averaging
in phylogenetics: advantages of Akaike information criterion and
Bayesian approaches over likelihood ratio tests. Syst Biol
53:793–808
Pritchard JK, Stephens M, Donnelly P (2000) Inference of population
structure using multilocus genotype data. Genetics 155:945–959
Raymond M, Rousset F (1995a) GENEPOP (version 3.4): population
genetics software for exact tests and ecumenicism. J Hered
86:248–249
Raymond M, Rousset F (1995b) An exact test for population
differentiation. Evolution 49:1280–1283
Rice RW (1989) Analyzing tables of statistical tests. Evolution
43:223–225
Schwarz G (1978) Estimating the dimension of a model. Ann Stat
6:461–464
Sekine Y, Yamakawa H, Takazawa S, Lin Y, Toba M (2006)
Geographic variation of the COX1 gene of the short-neck clam
Ruditapes philippinarum in coastal regions of Japan and China.
Venus 65:229–240 (in Japanese with English abstract)
Shoemaker JS, Fitch WM (1989) Evidence from nuclear sequences
that invariable sites should be considered when sequence
divergence is calculated. Mol Biol Evol 6:270–289
Shpigel M, Spencer B (1996) Performance of diploid and triploid
Manila clams (Tapes philippinarum, Adams and Reeve) at
various levels of tidal exposure in the UK and in water from fish
ponds at Eilat, Israel. Aquaculture 141:159–171
Slatkin M (1995) A measure of population subdivision based on
microsatellite allele frequencies. Genetics 139:457–462
Sugiura N (1978) Further analysis of the data by Akaike’s information
criterion and the finite corrections. Commun Stat A 7:13–26
Tajima F (1983) Evolutionary relationship of DNA sequences in finite
populations. Genetics 105:437–460
Tamura K, Nei M (1993) Estimation of the number of nucleotide
substitutions in the control region of mitochondrial DNA in
humans and chimpanzees. Mol Biol Evol 10:512–526
Tamura K, Peterson D, Peterson N, Stecher G, Nei M, Kumar S
(2011) MEGA5: molecular evolutionary genetics analysis using
maximum likelihood, evolutionary distance, and maximum
parsimony methods. Mol Biol Evol 28:2731–2739
Thompson JD, Gibson TJ, Plewniak F, Jeanmougin F, Higgins DG
(1997) The ClustalX windows interface: flexible strategies for
multiple sequence alignment aided by quality analysis tools.
Nucleic Acids Res 24:4876–4882
Utting SD, Spencer BE (1992) Introductions of marine bivalve
molluscs into the United Kingdom for commercial culture—case
histories. ICES Mar Sci Symp 194:84–91
Vargas K, Asakura Y, Ikeda M et al (2008) Allozyme variation of
littleneck clam Ruditapes philippinarum and genetic mixture
analysis of foreign clams in Ariake Sea and Shiranui Sea off
Kyushu Island, Japan. Fish Sci 74:533–543
Vargas K, Hamasaki K, Asakura Y et al (2010) Genetic diversity and
differentiation in allozymes and shell sculpture of the clams
Ruditapes spp. in natural populations of Japan and China. Fish
Genet Breed Sci 40:37–46
Williams JG (1980) Growth and survival in newly settled spats of the
Manila clam Tapes japonica. Fish Bull 77:891–900
Yamakawa AY, Imai H (2012) Hybridization between Meretrixlusoria and the alien congeneric species M. petechialis in Japan
as demonstrated using DNA markers. Aquat Invasions
7:327–336
Yang Z (1993) Maximum-likelihood estimation of phylogeny from
DNA sequences when substitution rates differ over sites. Mol
Biol Evol 10:1396–1401
Yasuda N, Nagai S, Yamaguchi S, Lian C, Hamaguchi M (2007)
Development of microsatellite markers for the Manila clam
Ruditapes philippinarum. Mol Ecol Notes 7:43–45
Zhang G, Yan X (2006) A new three-phase culture method for Manila
clam, Ruditapes philippinarum, farming in northern China.
Aquaculture 258:452–461
Conserv Genet (2013) 14:717–733 733
123