
Moldova is a small agriculture based country bordered by ...
65
Transcript of Moldova is a small agriculture based country bordered by ...


Moldova
Household Food Security Survey of
Rural Moldova
United Nations Development Programme World Food Programme
February 2008

ACKNOWLEDGMENTS
This report is produced within the context of the joint UN project "Relief and Technical Assistance to the Drought in Moldova” under an arrangement between the United Nations Development Programme and the World Food Programme’s Regional Bureau under the generous funding from the European Commission. WFP provided technical support in design, coordination, quality control and analysis. Useful comments and suggestions were contributed by UNDP and FAO of the United Nations in Moldova. The household survey of rural Moldova was conducted by CIVIS, a local Non-Governmental Organization experienced in surveys. The effort could not have succeeded without the support of the Government of Moldova and the Transnistria authorities. Cooperation from officials and citizens during the interviews was most forthcoming.
LIST OF ABBREVIATIONS
CFSAM Crop and Food Security Assessment Mission DHS Demographic and Health Survey FAO Food and Agriculture Organization FCS Food Consumption Score Ha Hectares HHFS Household Food Security IOM International Organization for Migration NBS National Bureau of Statistics, Government of Moldova ODC Regional bureau for Middle East, Central Asia & Eastern Europe in Cairo SD Standard Deviation UN United Nations UNDP United Nations Development Programme USD United States Dollar WB World Bank WFP World Food Programme
HHFS Survey 2007 i

Table of Contents
ACKNOWLEDGMENTS .............................................................................................I
LIST OF ABBREVIATIONS .......................................................................................I
LIST OF TABLES AND FIGURES........................................................................... V
PART A .......................................................................................... 1
EXECUTIVE SUMMARY .......................................................................................... 1
HOUSEHOLD FOOD SECURITY SURVEY ........................................................... 2
Demographics ............................................................................................................. 2
Landholdings............................................................................................................... 4
Income and Expenditures............................................................................................ 4
Remittances................................................................................................................. 6
Markets ....................................................................................................................... 7
Vulnerable Groups ...................................................................................................... 7
Impact of Drought....................................................................................................... 8
Food Consumption and Nutrition ............................................................................. 10
Coping Strategies ...................................................................................................... 11
Drought Support........................................................................................................ 14
Spatial Distribution ................................................................................................... 14
METHODOLOGY ..................................................................................................... 15
Objective ................................................................................................................... 15
Sampling ................................................................................................................... 15
Sample characteristics........................................................................................... 15 Data collection period ........................................................................................... 15 Survey instrument .............................................................................................. 15 Sample representation........................................................................................... 15
Food Consumption Score.......................................................................................... 17
Field Work Constraints ............................................................................................. 18
Limitations ................................................................................................................ 18
HHFS Survey 2007 ii

CONCLUSIONS ......................................................................................................... 19
RECOMMENDATIONS............................................................................................ 20
ANNEXES ................................................................................................................... 21
Annex 1 – Maps ........................................................................................................ 22
Map 1 – Moldova Population 2007 ...................................................................... 22 Map 2 – Moldova Elevation ................................................................................. 23 Map 3 – Agricultural Crops 2006 – Yield of Cereals & Legumes ....................... 24 Map 4 – Agricultural Crops 2006 – Yield of Maize............................................. 25 Map 5 – Agricultural Crops 2006 – Yield of Sunflower ...................................... 26 Map 6 - Agricultural Crops 2006 – Yield of Grapes ............................................ 27 Map 7 - Agricultural Crops 2006 – Yield of Tobacco.......................................... 28 Map 8 – Livestock 2007 – Cows .......................................................................... 29 Map 9 – Livestock 2007 – Sheep & Goats ........................................................... 30
Annex 2 – Tables ...................................................................................................... 31
Table: a1 - Population as of January 1, 2007 in thousands................................... 31 Table: a2 - Household Demography - Gender...................................................... 32 Table: a3 - Household Disability .......................................................................... 32 Table: a4 - Number of people living in the household ......................................... 33 Table: a5 - Yield of Agricultural crops in 2006 - Centners / Hectare................... 34 Table: a6 - Season's production level of Annual crops compare to last 5 years... 35 Table: a7 - Agricultural land information............................................................. 35 Table: a8 - Livestock as of January 2007 - in thousand capita............................. 36 Table: a9 - Major Source of Income ..................................................................... 37 Table: a10 - Minor Source of Income................................................................... 37 Table: a11 - Main annual crops ............................................................................ 38 Table: a12 - Main reason for debt......................................................................... 39 Table: a13 - Expenditure per month ..................................................................... 39 Table: a14 - Food Consumption ........................................................................... 40 Table: a15 - Coping Strategies.............................................................................. 41 Table: a16 – Other Coping Strategies................................................................... 41 Table: a17 - Coping Strategies – Sold Assets....................................................... 41 Table: a18 - Coping Strategies – Sold or Cull Livestock ..................................... 42 Table: a19 - Coping Strategies - Adoption ........................................................... 42 Table: a20 - Drought Support ............................................................................... 42
Annex 3 – References ............................................................................................... 43
PART 2 - REPORT ON RAPID HOUSEHOLD FOOD
SECURITY ASSESSMENT IN TRANSNISTRIA..................... 44
HHFS Survey 2007 iii

BACKGROUND ......................................................................................................... 44
SOCIO-ECONOMIC BACKGROUND ................................................................... 45
AGRICULTURE IN TRANSNISTRIA.................................................................... 48
IMPACT OF THE DROUGHT................................................................................. 51
MARKETS .................................................................................................................. 51
INCOME AND EXPENDITURES............................................................................ 52
NUTRITION ............................................................................................................... 54
RECOMMENDATION.............................................................................................. 54
ANNEXES ................................................................................................................... 56
Annex A - Beneficiary Targeting Criteria for fodder distribution and food aid intervention: .............................................................................................................. 57
Annex B - Population................................................................................................ 58
HHFS Survey 2007 iv

LIST OF TABLES AND FIGURES Tables Table 1: Farm Categories
Table 2: Employment Categories
Table 3: Poverty Rates in Percentage Points
Table 4: Vulnerable Groups
Table 5: Vegetable Prices
Table 6: Percentage of Women and Children with Anemia
Table 7: Food Consumption Score
Table 8: Strategies to meet household needs
Table 9: Sale of productive assets to meet food needs
Table 10: Drought Support Sources
Table 11: Number of Households by Rayon
Table 12: Food Group and Weights
Figures Figure 1: Household Size
Figure 2: Percentage of Households by Number of Children and Youth
Figure 3: Source of Rural Household Incomes in 2006
Figure 4: Production Level Compared to Previous 5 Years
Figure 5: Predominant Coping Strategies
Figure 6: % of households that have sold/culled livestock due to fodder shortages
HHFS Survey 2007 v

Part A
EXECUTIVE SUMMARY
Moldova is a small agricultural country with a sizable portion of its workforce engaged in employment abroad. Rural areas are poor and rely for subsistence on services, social benefits and agriculture. There is a high proportion of elderly often living alone or with disability. Parents often go abroad in search of incomes leaving young children with grandparents. Farm sizes are small and families rely on kitchen gardens to provide most of the dietary diversity. These gardens serve as important safety nets in drought conditions. The drought of 2007 was unprecedented in the last 60 years. Almost every farmer recorded losses, some even their entire crop. Lack of fodder forced extensive selling and culling of livestock. As a coping strategy, farmers had to cultivate less land, send family members aboard and borrow. Farmers had to sell productive assets including land and milk producing cows exacerbating their vulnerability and lowering recovery prospects. Markets are well connected and provide food stocks for those who may afford them. The real limitation to food security is the economic power to purchase a balanced and nutritious diet. Household incomes, normally used to increase agricultural production and heating over the harsh winter, were diverted to the purchase of food. In such circumstances, social support programmes, such as school feeding, provided vital support to the food security of vulnerable households. In August a joint FAO/WFP Crop and Food Security Assessment recommended a series of short, medium and long term interventions. To better understand the food security situation at the household level, a survey was conducted by UNDP/WFP in November 2007. Findings of this survey support recommendations of the CFSAM: vulnerable group feeding, fodder support, credit, crop insurance and monitoring. The survey also provides a baseline for future surveys to compare results. With this baseline, impact of interventions may be measured and decisions for future interventions may be based on empirical evidence. Reclassification of vulnerable groups is an important task the government has undertaken. Support of this task is a key recommendation. Similarly, updating of the baseline through periodic household surveys would ensure a good understanding of the basic factors contributing to household food security in rural Moldova. The HHFS is the first of its kind for Moldova. Capturing the dynamics of food security in rural Moldova is an important endeavor and maintenance of this information a task for future planners.
HHFS Survey 2007 1
HOUSEHOLD FOOD SECURITY SURVEY Moldova is a small agricultural country in Eastern Europe bordered by two large cereal producers – Ukraine and Romania. Based on extremely low precipitation levels and unusually high temperatures, the drought of 2007 is being compared with the devastating drought of 1946 which resulted in massive losses. With two thirds of its population in rural areas and chiefly dependent on agriculture, drought caused a serious impact on food security of its inhabitants. Moldova is a small sized country with rather uniform topography (Map 1: Elevation), with the North having slightly higher hills and receiving more precipitation. The country is divided into 32 Rayons grouped into three Regions: North, Centre and South. Land cover and land use change gradually from North to South. North receives slightly higher precipitation resulting in more orchards compared to more vineyards in the South. Soil quality throughout the country is good for agriculture. With only small rivers traversing the country and limited irrigation infrastructure, the bulk of agriculture is rainfed. Grasslands are scattered across the country providing vital feed for livestock. All regions produce wheat and maize. Four Rayons in the North received summer rains and were not affected by the drought. Impact of drought in South and Centre Regions was relatively more pronounced. Within a Region, local conditions, such as ownership of own water well, bear more on kitchen garden produce than the geographic location. In August 2007 a FAO/WFP team conducted a Crop and Food Security Assessment Mission (CFSAM). This was followed by a UNDP/WFP lead Household Food Security (HHFS) Survey of rural Moldova in November 2007. The HHFS is the first of its kind and establishes a baseline for future studies. The next sections present findings of the survey followed by conclusions and recommendations. Complementing the HHFS results is a series of maps illustrating spatial distribution of agriculture and livestock.
Demographics About 60% of rural households consist of 3 to 5 members while a little less than a quarter households are composed of either single or double members. About 9% of households have a single member. Large households with more than 5 persons are only 16% (Figure 1). There are a significant number of elderly people in rural areas with about 10% of households consisting only of elderly people.
HHFS Survey 2007 2

Figure 1: Household Size
Household Sizein rural Moldova
9%
15%
19%
23%
18%
10%
4%
2%0.2% 0.2%0%
5%
10%
15%
20%
25%
1 2 3 4 5 6 7 8 9 12Person(s)
Source: HHFS Survey 2007 About 57% of households have young people below the age of 18 but only 18% have children up to 5 years old (Figure 2). Every fifth household has a disability. Alarmingly, the ratio of disability amongst households exclusively composed of elderly people is 21%. This suggests an increased vulnerability amongst elderly disabled households due to absence of support family. Figure 2: Percentage of Households by Number of Children and Youth
0%
10%
20%
30%
40%
50%
60%
1 child 2 children 3 children Total
16,7%
1,7%
18,4%
32,8%
22,3%
2,2%
57,3%
Children of 0- 5 years
Children of 0-17 years
Source: HHFS Survey 2007
HHFS Survey 2007 3

Landholdings Post Soviet land distributions resulted in a majority of the farms being small landholdings i.e. less than 2 hectares (Table 1). Almost all farming is mechanized, raising the need for collective farming through associations. Table 1: Farm Categories Farm Category Number Small Farms 400,000 (average less than 2 ha) LLCs 1,200 (average 500-600 ha) Cooperatives 150 (joint stock) Source: National Farmers Federation Over 85% of households own agricultural land though the average landholding is only 1.8 hectares. The main source of income for the remaining 15% landless people is services (see section on incomes). Plot sizes vary from a minimum of 0.1 ha to a maximum of 30 ha. Small farms are predominant. Over half (55%) of the households own less than 2 ha and a quarter owns less than 1 ha. However, it is common, especially amongst elderly families, to lease out their lands and live off the proceeds. The sizes of leased lands vary from 0.12 ha to a maximum of 120 ha. Kitchen gardens provide vital support to household food security. All rural households (99.6%) maintain a kitchen garden, the average size being 0.21 ha (21 are). The kitchen garden sizes increase with family sizes. Average kitchen garden size of a family of two is 0.2 ha (20 are), that for 3-5 persons is 0.21 (21 are) and for larger families of over five persons is 0.22 ha (22 are), indicating increments of 100 square meters (1 are). Kitchen gardens in dwellings with a private well fare better in drought circumstances. About 41% of households have private wells. Considering the installation costs, presence of a recently dug private well was identified as a proxy indicator of relative wealth. Similarly, a gas connection is indicative of relative cash surplus. Over 30% households have gas connections of which 29% had installed them recently (2006 or 2007). In localities where gas is available, only 54% of households have been able to afford a connection. This suggests low purchasing power. Vegetables are a significant portion of rural cuisine and greenhouses provide vital incomes for some families. About 6% of households maintain a functioning greenhouse and 4% cite it as their chief income source.
Income and Expenditures About 60% of the population lives in rural areas (NBS 2007). Agriculture is the dominant sector of employment (Table 2). The drought had far more damaging effect on rural populations that relied on own production for a major portion of their cereal and vegetable requirements.
HHFS Survey 2007 4

Table 2: Employment Categories Employment Categories Thousand persons (2005)
Agriculture 537 Industry 159 Retail 183 Public Administration 244 Other 196 Source: NBS 2007 Poverty is widespread (Table 3) with 2006 pre-drought national poverty rate at 27% and that in rural areas exceeding 42% (WB 2006). Whereas urban residents saw their incomes rise and their poverty rates decline, poverty actually increased among farmers and rural pensioners (WB 2006). A major proportion of a poor man’s expense is dedicated to food. The lowest quintile spent about 77% of its consumption expenditure on food and non-alcoholic beverages (Statistical Yearbook 2006). Table 3: Poverty Rates in Percentage Points Economic Activity 2005 Farmer 48 Farm Labour 51 Non Farm Labour 31 Self employed 17 Pensioner 35 Source: Poverty Update, 2006, World Bank The main income sources in rural Moldova are services and pension/social allowances (35% and 34% households respectively). This is followed by annual crops at 20% of which corn (41%), wheat (34%) and potatoes (16%) are significant. Casual labour is a major income source for 16% of households followed by remittances (11%), livestock and dairy products (7%), vineyards (6%) and greenhouses (3%). Livestock serves as a significant secondary source of income for 80% of households. Other secondary income sources include annual crops (70%), vineyards (27%) and vegetables/greenhouse products at 27% (Figure 3).
HHFS Survey 2007 5

Figure 3: Source of Rural Household Incomes in 2006
20,3%
7,1%
7,1%
4,0%
1,2%
5,6%
0,2%
35,0%
33,6%
4,0%
10,8%
15,0%
0,4%
66,9%
23,5%
79,7%
23,8%
14,0%
26,7%
0,4%
6,3%
0,6%
7,6%
12,2%
16,9%
0% 10% 20% 30% 40% 50% 60% 70% 80% 90%
Annual crops
Diary products
Livestock
Vegetable/greenhouse
Fruits
Vineyards/Wine
Non wood forest products
Services
Business
Remittance
Pension/allowance
Casual labour
Other sources
Main
Secondary
Source: HHFS Survey 2007 About one third of households were in debt at the time of the HHFS Survey of November 2007. The main reason for debt was food needs (48%) followed by agricultural expenses (45%) and expenses on health/education (45%). About 10% of households had borrowed to pay for utilities (primarily heating). To capture expenses, the households were asked to breakdown their expense of October 2007. For 48% of households over half of their monthly expense was incurred on food. On average, household expenses were spread over food (46%), health/education (20%), utilities (16%) and agriculture (14%). About 43% of households did not record agriculture expenses during October which may reflect on the large number of farmers who decided to abandon land preparation for the winter crops due to drought conditions.
Remittances Remittances play a major role in the national economy. Approximately one quarter of the economically active population of Moldova is located abroad (IOM 2007). The number of migrants grew from 100 thousand in 1999 to over 400 thousand in 2004 (Labour Force Survey, National Bureau of Statistics). A 2006 study by Kiel Institute (IOM/SICA) found a linear growth in number of migrants since 1999. However, the study also found
• mean remittances per household were greater than median i.e. there are many households with modest remittances and a much smaller number with relatively high remittances
HHFS Survey 2007 6

• mean was relatively high due to some very high remittances reported by a few households in Chisinau
• Remittance levels strongly depend on the country the migrant is working in. They are highest for migrants in Europe and lowest for migrants in Russia or Ukraine
• Of the migrants to Russia and Ukraine, 77% (in construction sector) and 64% (non-construction) come from rural areas.
This suggests migrants from rural households remit least amounts of money. This is in line with poverty rates (42% rural). Studies of 2004 indicate only 3% of remittances reached the poorest quintile (WB 2006). The same study concluded that ‘neither public transfers nor private remittances are reaching relatively poor groups in amounts sufficient to offset the loss of income from other sources, in particular agriculture’. It is therefore important to note, in spite of high national level figures on remittances, interpreting these as a strong safety net for poor rural households could be misleading.
Markets The entire country is well connected with every village accessible through all weather asphalt roads. The remotest farm is within a few kilometers of a paved road. With 14 border crossings along its short east and west borders, the country is well connected to neighboring countries for import and export of commodities. Markets within each Rayon are accessible throughout the year. Food security of vulnerable people rests in their economic accessibility to food in the markets.
Vulnerable Groups
The communist era defined specific groups as vulnerable. These included pensioners, invalid (challenged), unemployed, large families and children with one parent. Poverty was not a criteria. This approach is currently under review at the Ministry of Social Protection which plans to introduce a vulnerability classification taking poverty into account. The government provides allowances to its vulnerable people. As is evident from Table 4, these allowances are small while loss of crop, kitchen gardens and livestock is substantial. Table 4: Vulnerable Groups as Defined by Ministry of Social Protection
Vulnerable Groups Number of People
Government Allowance (13 Lei = 1 USD)
Pensioners 614,000 550 lei/month Invalids 169,000 300 lei/month Unemployed 72,000 400 lei/month; up to 6 months Large families/one parent families 59,000 Allowance plus subsidy on
utilities Source: Ministry of Social Protection
HHFS Survey 2007 7

Impact of Drought The major impact of drought1 was felt by the agriculture community. Drought resulted in extremely low agriculture produce2. Corn crop all but failed. Initial wheat yields were estimated at 50% to 25% of normal. Similarly, production of vegetables from kitchen gardens, particularly where own wells are not available, dropped considerably. The HHFS Survey asked households to compare production this season with that over the previous five years. About 96% of households reported production losses in 2007. Losses were reported across the agriculture sector. Most significant losses were reported in annual crops where 43% of households reported over 75% of losses (Figure 4). A third of households lost between 50-75%. Only 1% of households reported higher production in annual crops than previous years. Vegetables were the second most affected. Thirtyfive percent of households lost more than three quarters while one third of households lost between 50-75% as compared to previous years. Again, only 1% reported improvement over previous years. Horticultural losses ranged above half for 20-30 percentage of households. Production of kitchen gardens was similarly low, with production losses over 50% for 25-30% of households. Though insignificant, about 2% of households reported gains in production of horticulture and kitchen gardens as compared to previous years. Figure 4: Production Level Compared to Previous 5 Years
1,4% 1,3%2,4% 2,0%2,9%
7,8%8,9%
6,2%6,6%
11,7% 11,7%9,7%
13,5%
16,9%
26,8%24,8%
32,2%
27,3%
23,5%
30,1%
43,4%
35,0%
26,7% 27,2%
0%
5%
10%
15%
20%
25%
30%
35%
40%
45%
50%
Grains Vegetable Fruits / grapes Kitchen garden
MoreThe sameLess (0%-25%)Less (26%-50%)Less (51%-75%)Less (76%-100%)
Source: HHFS Survey 2007 Fodder was scarce, forcing farmers to sell or cull livestock. Some Rayons reported over 50% loss of livestock. This included loss of milk producing cows. Small farmers rely on subsistence farming for cereals and on their kitchen gardens for vegetables. Both sources 1 In addition to drought, some Rayons have experienced sudden hailstorms in July and August destroying wheat crops before they could be harvested 2 See FAO/WFP Crop and Food Security Assessment Mission Report at www.un.md for details.
HHFS Survey 2007 8
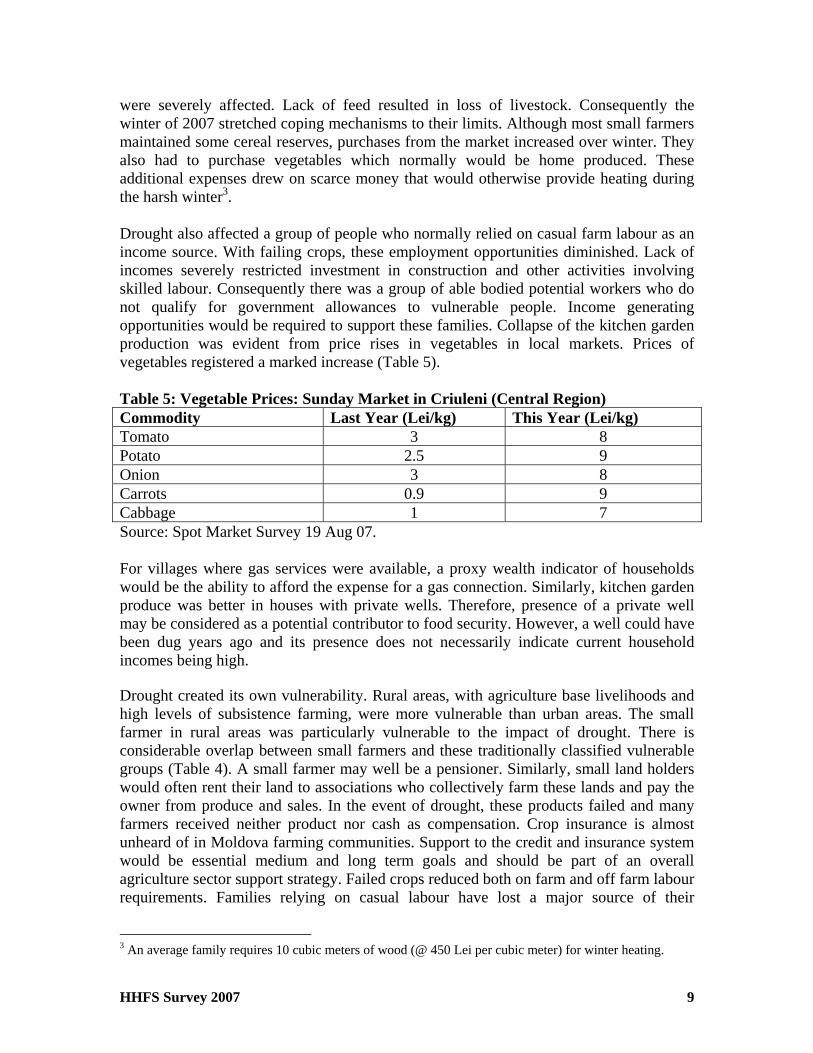
were severely affected. Lack of feed resulted in loss of livestock. Consequently the winter of 2007 stretched coping mechanisms to their limits. Although most small farmers maintained some cereal reserves, purchases from the market increased over winter. They also had to purchase vegetables which normally would be home produced. These additional expenses drew on scarce money that would otherwise provide heating during the harsh winter3. Drought also affected a group of people who normally relied on casual farm labour as an income source. With failing crops, these employment opportunities diminished. Lack of incomes severely restricted investment in construction and other activities involving skilled labour. Consequently there was a group of able bodied potential workers who do not qualify for government allowances to vulnerable people. Income generating opportunities would be required to support these families. Collapse of the kitchen garden production was evident from price rises in vegetables in local markets. Prices of vegetables registered a marked increase (Table 5). Table 5: Vegetable Prices: Sunday Market in Criuleni (Central Region) Commodity Last Year (Lei/kg) This Year (Lei/kg) Tomato 3 8 Potato 2.5 9 Onion 3 8 Carrots 0.9 9 Cabbage 1 7 Source: Spot Market Survey 19 Aug 07. For villages where gas services were available, a proxy wealth indicator of households would be the ability to afford the expense for a gas connection. Similarly, kitchen garden produce was better in houses with private wells. Therefore, presence of a private well may be considered as a potential contributor to food security. However, a well could have been dug years ago and its presence does not necessarily indicate current household incomes being high. Drought created its own vulnerability. Rural areas, with agriculture base livelihoods and high levels of subsistence farming, were more vulnerable than urban areas. The small farmer in rural areas was particularly vulnerable to the impact of drought. There is considerable overlap between small farmers and these traditionally classified vulnerable groups (Table 4). A small farmer may well be a pensioner. Similarly, small land holders would often rent their land to associations who collectively farm these lands and pay the owner from produce and sales. In the event of drought, these products failed and many farmers received neither product nor cash as compensation. Crop insurance is almost unheard of in Moldova farming communities. Support to the credit and insurance system would be essential medium and long term goals and should be part of an overall agriculture sector support strategy. Failed crops reduced both on farm and off farm labour requirements. Families relying on casual labour have lost a major source of their
3 An average family requires 10 cubic meters of wood (@ 450 Lei per cubic meter) for winter heating.
HHFS Survey 2007 9

livelihood. Such labour normally came from able bodied persons who do not qualify as pensioners, elderly or other vulnerable groups. They were too young to qualify for Social Canteen and too old for School Feeding. This group required work opportunities to make up for loss of employment, especially during the winter season when heating costs were extensive and incentive to cut forests for wood was maximum.
The drought caused loss of revenue of local governments. This threatened, and in many cases ceased, the school feeding programmes in villages. The daily meal for these children was a major source of nourishment and supported learning capacities. With loss of incomes and crops, families were unable to maintain the quality and quantity of food intake thus increasing the role of school feeding.
Food Consumption and Nutrition Rural diets consist of staple (wheat), vegetables, occasional meat and seasonal fruits. Tea with bread, cheese and honey are consumed at breakfast. Meals consist of soup, bread and Mamalika (corn and cheese mixed with either fish or meat). On occasion, beverages may include wine, especially from own vineyards. Nationally, about 8% of children under 5 are moderately4 stunted and 4% are suffering from acute malnutrition i.e. are wasted 5 (DHS 2005). About 4 percent children are underweight. According to the Demographic and Health Survey of 2005, 40% of households consume inadequate (<15 ppm) of iodized salt. The situation is worst in rural areas (51%). One percent of women suffer from night blindness (vitamin A deficiency) and 28% of women in Moldova have some level of anemia (Table 6). Women living in rural areas and those with four or more children are more likely to have mild anemia than other women. Women with these background characteristics would benefit the most from an iron supplementation program. Table 6: Percentage of Children and Women with Anemia
Group Mild Anemia (10.0 – 11.9 g/dl)
Moderate Anemia (7.0 – 9.9 g/dl)
Children (6-59 months) 22 10 Women 23 4
Source: DHS 2005 The food consumption score is a method developed by WFP to capture consumption patterns and dietary diversity. The system requires recording of food groups over a 7 day period. Weights are assigned to each food group and the score is a combination of number of days a food was consumed and the food group weight. It allows periodic comparisons for use in food security monitoring systems. Drops in food consumption scores over time alert monitors to the possibility of malnutrition in the near future thus serving as an early warning indicator (for details on methodology see wfp.org).
4 A child between -2 and -3 SD is considered moderately stunted. 5 A child below -2 SD from the reference median for weight-for-height is considered wasted.
HHFS Survey 2007 10

A FCS of above 35 is considered adequate, 35-21 as borderline and a score of less than 21 suggests poor food consumption. About 11% of households tallied a fcs of less than 21 suggesting poor consumption, 26% were borderline and a large number (62%) scored above 35 suggesting adequate consumption. Comparing by land holding sizes, the score improves with land size (Table 7). Households with no land score least and those with more than 5 hectares score most. However, households having between one to two hectares score less than households with even smaller land holdings. This may suggest alternative income sources are more supportive for families with small (less than 2 ha) lands. Further investigation would be required to assess the underlying causes and effects. Table 7: Food Consumption Score
Percentage of households Land size Poor
Consumption FCS < 21
Borderline Consumption FCS 21 - 35
Adequate Consumption
FCS > 35
Average FCS
No land 16.7 26.7 56.6 41.7 < 1 ha 10.3 25.9 63.8 44.7 1-2 ha 13.8 29.4 59.8 39.7 >2-5 ha 9.0 26.0 65.0 42.6 > 5 ha 4.3 26.1 69.6 48.4 Source: HHFS Survey 2007
Coping Strategies Households were asked about strategies adopted in October 2007. The main coping strategy adopted by 85% of households was consumption of less expensive or less preferred foods (Figure 5). For 18% of households this strategy was applied daily while a quarter of households applied it often (more than 2 days a week). Skipping meals or reducing portion size was practiced by 60% of households One-fifth of the households adopted this method often (more than 2 days a week).
HHFS Survey 2007 11

Figure 5: Predominant Coping Strategies
40,9%
14,7%
98,7%
75,2%
69,4%
19,1%
14,2%
1,5%
8,1%
19,4%
26,2%
2,0%
13,0%
15,2%
26,5%
11,3%
8,3%
5,4%
18,4%
10,0%
1,2%
0% 20% 40% 60% 80% 100%
skip a meal or reduce portion size
rely on less expensive or less preferred foods
meal from social canteen
meal through school feeding
purchase food on credit or borrowing
Never Seldom (1-3 days / month) Sometimes (1-2 days / week) Often (3-6 days / week) Daily Source: HHFS Survey 2007 A larger timeframe was selected for a series of questions on coping mechanisms. Participants were asked to answer these questions keeping in mind the period March to November 2007 (Table 8). This allowed the responses to include initial drought effects. Since March, 18% of households were forced to cultivate lesser land than what was available. This points to diversion of resources to food and other needs. It was practiced by households with larger lands (3 or more hectares). Twenty eight percent of households sent a family member for additional earnings. The practice was higher in larger families. Sending of family members for additional earnings was practiced more often by families with children less than 5 years old. These children were left in care of the remaining parent or grandparents. Reliance on savings was predominant in households with larger land sizes (over 2 hectares). Table 8: Strategies to meet household needs
Percentage of Households Land size Cultivate less land Send abroad Use savings
No land - 30.0 55.0 < 1 ha 14.7 21.6 50.0 1-2 ha 14.7 35.7 26.0 >2-5 ha 20.0 26.0 61.0 > 5 ha 21.7 26.1 60.9 Source: HHFS Survey 2007 Loss of productive assets is a serious indicator of stress (Table 9). Participants were asked of they had sold productive assets since March 2007 in order to meet food needs. Only 2% of households were forced to sell their land. These households owned less than 1 ha of land. 29% sold their milk producing cow and 16% sold draft animals. Only 1% sold their farm machinery/tools.
HHFS Survey 2007 12

Table 9: Sale of Productive Assets to meet food needs
Percentage of Households Land size Land Milk producing cow Traction
animal Farm
machinery/toolsNo land - 6.7 1.7 0 < 1 ha 3.4 8.6 0 0 1-2 ha 0 16.5 3.7 0 >2-5 ha 0 14.0 5.0 1 > 5 ha 0 26.1 8.7 0 Source: HHFS Survey 2007 Dry conditions resulted in less livestock feed. Respondents were asked if they sold or culled livestock in response to lack of fodder/feed (Figure 6). Three quarters of households owning livestock faced fodder shortages. About one third were force to meet fodder needs either through credit or by borrowing in kind. Of households citing livestock as their main income source, 3% have no remaining livestock. The strategy of restructuring livestock was used by threequarters of households. Loss of milk producing cows is another indicator of stress severity. Over 40% households with milk producing cows had to sell this asset. Between March and October, twenty percent of households sold the only milk producing cow they owned. This translates in immediate loss of food and income for the families and long term loss of potential calves. For households owning pigs, 78% sold/culled at least one due to feed shortages and 47% lost all pigs they owned. About 4% of poultry owners lost all their stock. Figure 6: Percentage of households that have sold/culled livestock due to fodder shortages
0%
10%
20%
30%
40%
50%
60%
70%
80%
milk producing cows pigs poultry traction animals sheep, goat, rabbit
39,7%
77,8% 74,1%
29,5%
56,4%
17,2%
44,6%
4,1%
15,9%
26,5%
at least one all
Source: HHFS Survey 2007
HHFS Survey 2007 13

Drought Support Participants were asked about drought support from government, non-government agencies and private sector (Table 10). Only 4% of households received assistance, mainly from government (3%) in non food interventions. The private sector provided support only to households with more than 5 ha of land. Aid from non-government agencies was targeted to households with less than two hectares of land. Table 10: Drought Support Sources
Percentage of households that received drought support Land size Source: Government Non government
agencies Private
No land 1.7 0.0 0.0 < 1 ha 0.9 0.9 0.0 1-2 ha 4.6 0.9 0.0 >2-5 ha 3.0 0.0 0.0 > 5 ha 13.0 0.0 4.3 Source: HHFS Survey 2007
Spatial Distribution The map section illustrates spatial distribution of agriculture (2006) and livestock (2007). Main population centers are in Chisinau, Balti and UTA Gagauzia (Map 1). Elevation is low with only a few points exceeding 400 meters (Map2). Yields of cereals and legumes are higher in the North and South (Map 3) . Six Rayons recorded maize yields over 25 Centners/Ha (Map 4). Goldeni, Falesti and Ungheni Rayons produce highest yields of sunflower (Map5). Grape yields are higher in the South Rayons of Cahul, Cantemir, Leova; central Rayons of Chisinau and Strseni and Falesti in the North (Map 6). Tobacco production per hectare is highest in selected Rayons of each Region (Map 7). Northern Rayons record a higher ratio of cows (Map 8) while sheep and goats are highest in Cantemir, Cahul and UTA Gagauzia of South; Hincesti of Centre and Falesti of North (Map 9).
HHFS Survey 2007 14

METHODOLOGY Objective: Establish baseline on household food security in rural Moldova. The survey was designed to provide a) information on current food security status and b) provide a baseline for comparison with future surveys, particularity, impact assessment of drought response interventions.
Sampling The survey adopted a systematic random sampling methodology administering a questionnaire to a representative sample of households. The geographic area covered was rural Moldova. Transnistria was not included6. Sample characteristics: systematic random sampling. A virtual list of rural population was generated. Interval was calculated. Initial household was selected using random table and subsequent households were selected by applying the interval to the virtual list. Codes in virtual list allowed rayon and village identification. A total of 422 respondents from 410 localities were selected. Selected households were contacted using lists maintained at the Mayor’s office. In instances where an adult member in the selected household was unavailable, the survey was not carried out in that household, and no supplementary household was selected. Data collection period: November 2-13, 2007. Survey instrument: a standard written questionnaire with codified questions and answers was administered. Enumerators were provided training and the instrument was modified based on results from pre-testing. The questionnaires were completed on site at residences of respondents. The work languages were Romanian and Russian. Sample representation: the sample was representative for the target group subject to the survey. Calculation for establishing Number of sample households: RAPID SURVEY N = DEFF x [(Z2.P.(1-P))/d2] Where 6 A household food security survey for Transnistria was conducted in December of 2007.
HHFS Survey 2007 15

N = Number of sample households DEFF = 1, Design Effect (systematic random sample) Z = 1.96, Confidence level (95%) P = Estimated prevalence 50% d = Desired precision (0.05) for ±5% Sample Size: 1.962 x 0.50 (1-0.50)/0.05 = 384 No response errors = 10% Total sample size + 384 + 38 = 422 Actual number of households surveyed: 408 BASELINE FOR COMPARISION WITH FUTURE IMPACT SURVEY p1 The estimated proportion with disease or intervention at baseline survey p2 The estimated proportion with disease or intervention at follow-up survey DEFF The estimated design effect - here it is assumed the DEFF will be the same
for both surveys α Level of significance (“alpha”), usually .05 or 5% (corresponds with 95%
confidence interval) 1- β Power, usually .8 (80%) or .9 (90%)
The formula:
[ ]2
21
22211β1α/2
)p(p
qpqpZ-qp2ZDEFFn
−
+×= −
where
2pp
p 21 += and p1q −= when sample sizes are to be equal
q1 = 1 – p1 q2 = 1 – p2
Zα/2 is the Z-value for the level of significance Z1-β is the Z-value for the Power As result of drought estimated baseline prevalence of small farmers in need of food stock is 50%. The fodder programme intervention is estimated to lower the prevalence in this group to 40%. Example: p1 = .50, q1 = .50 p2 = .40, q2 = .60 α = .05, therefore = 1.96 α/2Z β = .20, therefore = -.842 β1Z −
DEFF = 1 (systematic random sampling)
HHFS Survey 2007 16

Need to calculate p . For equal sample sizes:
452
4050p ...=
+= , .55 .451q =−=
[ ]388
01.876.31
)40.(.50)60)(.40(.)50)(.50(.(-.842)-)2(.45)(.5596.1
1n 2
2
≈×=−
+×=
The sample size would be 388 households in for each cross-sectional survey, i.e., 388 for the baseline survey and 388 in the follow-up survey. Table 11: Number of Households by Rayon
Rayon Number of Households
% of total Rayon Number of
Households % of total
1. Hincesti 22 5,4% 19. Soldanesti 7 1,7% 2. Leova 7 1,7% 20. Rezina 7 1,7% 3. Cahul 17 4,2% 21. Donduseni 7 1,7% 4. Cantemir 12 2,9% 22. Falesti 16 3,9% 5. UTAG 21 5,1% 23. Ungheni 14 3,4% 6. Anenii Noi 13 3,2% 24. Causani 14 3,4% 7. Straseni 14 3,4% 25. Stefan Voda 12 2,9% 8. Criuleni 13 3,2% 26. Telenesti 13 3,2% 9. Dubasari 7 1,7% 27. Ialoveni 16 3,9% 10. Basarabeasca 4 1,0% 28. mun. Balti 1 0,2% 11. Cimislia 10 2,5% 29. Floresti 14 3,4% 12. Orhei 19 4,7% 30. Singerei 13 3,2% 13. Nisporeni 10 2,5% 31. Glodeni 10 2,5% 14. Riscani 12 2,9% 32. Drochia 14 3,4% 15. Edinet 11 2,7% 33. Soroca 12 2,9% 16. Ocnita 7 1,7% 34. Briceni 9 2,2% 17. Taraclia 5 1,2% 35. mun. Chisinau 13 3,2% 18. Calarasi 12 2,9% TOTAL 408 100%
Source: HHFS Survey 2007
Food Consumption Score Table 12: Food Group and Weights
Food Group Food Items Weight Cereals and Tubers wheat, maize, sorghum, pasta 2.0Pulses Beans, peas, groundnuts, cashews 3.0Vegetables vegetables and leaves 1.0Fruits Fruits and fruit products 1.0Meat and Fish beef, goat, sheep, poultry, eggs, fish 4.0Milk Milk, yoghurt, cheese and other dairy products 4.0Sugar sugar and sugar products 0.5Oil: oil, fats, butter 0.5Source: EFSA Handbook, WFP
HHFS Survey 2007 17

FCS = acerealxcereal + apulsexpulse + avegxveg + afruitxfruit + aanimalxanimal + amilkXmilk + asugarxsugar + aoilxoil Where FSC + Food consumption score ai + weight of food group
Field Work Constraints The major constraint for the actual field work was time limitation. The assessors’ team was attempting to maximize the efficiency of time usage, by sending the faxes to rayon administration stressing the importance of the subject. Nevertheless, because of poor connectivity the message with instructions on household identification never reached the administrations of some communities, and as a consequence the surveyors’ team had to spend some additional time on identification process. Another issue that the surveyors’ team was facing during the data collection exercise was wrong interpretation of the instructions on targeted household identification, and in these cases, as well, the interviewer had to dedicate some additional time on identification. Despite the issues mentioned above interviewers’ team was able to complete the task within the acceptable sample size; 408 questionnaires were completed and submitted for the data analysis.
Limitations
1. The survey was conducted while the country was under drought conditions. Subsequent comparisons with data collected in this survey must take into account this factor.
2. The survey concentrated on rural Moldova. Urban areas and the Transnistria area were not included.
3. The sample size does not support regional or rayon based analysis.
HHFS Survey 2007 18

CONCLUSIONS
• About 10% of rural households are exclusively elderly and one fifth of this group suffers from disability.
• Small farmers with one or two hectares of land are predominant.
• All rural households maintain a kitchen garden. Presence of a private well
contributes to the garden and improves household food security during droughts.
• Recently dug private wells and gas connections may serve as proxy indicators for relative purchasing power.
• School feeding is an important safety net for household food security
• Poor households spend over half of their money on food.
• Main income sources in rural Moldova are services and pensions/social
allowances. .
• About one third of households were in debt mostly incurred to meet food needs.
• Some farmers abandoned land preparation for winter crops due to drought conditions.
• Remittances play a major role in national economy but interpreting these as a
strong safety net for poor rural households could be misleading.
• Vulnerable group classification is under review to include poverty as an indicator.
• Markets are well connected and accessible ensuring availability of food. Food security of vulnerable people rests primarily in their economic accessibility.
• About 96% of households reported production losses as compared to previous
years.
• Lack of feed resulted in loss of livestock and one fifth of households lost all their milk producing cows.
• There is a considerable overlap between small farmers and vulnerable groups.
• Families relying on casual labour have lost a major income source.
HHFS Survey 2007 19

• In some instances, loss of revenue by local governments has affected school feeding in villages.
• Skipping meals and reducing portion sizes was practised by 60% of households.
• Sending of family member for additional earnings is common in families with
small children.
• Only 4% of households reported receiving assistance, mainly from the government.
• Access to credit and crop insurance is lacking.
RECOMMENDATIONS
• Government efforts to reclassify vulnerable groups taking into account poverty should be supported.
• During drought, income generating opportunities are required for families relying
exclusively on casual labour.
• Medium and long term recommendations made by the FAO/WFP CFSAM, particularly on credit and insurance, should be implemented.
• A follow-up HHFS survey should be conducted in a year’s time to allow
comparison and detect changes in household food security situation.
HHFS Survey 2007 20

ANNEXES
HHFS Survey 2007 21

Annex 1 – Maps
Map 1 – Moldova Population 2007
HHFS Survey 2007 22

Map 2 – Moldova Elevation
HHFS Survey 2007 23 HHFS Survey 2007 23

Map 3 – Agricultural Crops 2006 – Yield of Cereals & Legumes
HHFS Survey 2007 24

Map 4 – Agricultural Crops 2006 – Yield of Maize
HHFS Survey 2007 25

Map 5 – Agricultural Crops 2006 – Yield of Sunflower
HHFS Survey 2007 26

Map 6 - Agricultural Crops 2006 – Yield of Grapes
HHFS Survey 2007 27

Map 7 - Agricultural Crops 2006 – Yield of Tobacco
HHFS Survey 2007 28

Map 8 – Livestock 2007 – Cows
HHFS Survey 2007 29

Map 9 – Livestock 2007 – Sheep & Goats
HHFS Survey 2007 30

Annex 2 – Tables
Table: a1 - Population as of January 1, 2007 in thousands
Rayon name Urban population
Rural population
Total population
Anenii noi 8.6 74.6 83.2 Balti 142.2 4.9 147.1 Basarabeasca 12.7 16.9 29.6 Briceni 15.6 61.4 77.0 Cahul 39.2 84.9 124.1 Calarasi 16.4 63.9 80.3 Cantemir 6.0 57.6 63.6 Causeni 25.1 68.5 93.6 Chisinau 712.1 68.2 780.3 Cimislia 14.9 48.9 63.8 Criuleni 8.6 64.3 72.9 Donduseni 10.8 36.1 46.9 Drochia 20.7 71.7 92.4 Dubasari 0.0 35.4 35.4 Edinet 26.0 58.4 84.4 Falesti 18.1 76.3 94.4 Floresti 19.2 72.8 92.0 Goldeni 12.1 51.5 63.6 Hincesti 17.2 107.1 124.3 Laloveni 14.7 82.8 97.5 Leova 16.1 38.4 54.5 Nisporeni 15.2 52.6 67.8 Ocnita 19.5 37.7 57.2 Orhei 33.7 92.9 126.6 Rezina 13.5 39.9 53.4 Riscani 16.3 55.7 72.0 Singerei 18.8 76.0 94.8 Soldanesti 7.6 37.0 44.6 Soroca 37.3 64.0 101.3 St 73.4 efan-Voda 8.9 64.5 Straseni 21.5 70.0 91.5 Taraclia 15.1 29.8 44.9 Telenesti 8.4 67.2 75.6 Ungheni 40.6 76.7 117.3 Unitatea Teritoriala Autonnma Gagauzia 65.3 94.5 159.8
Unitatea Teritoriala Din Stinga Nistrului No data No data No data
Source: Moldova in figure 2007 National Bureau of Statistics, Republic of Moldova
HHFS Survey 2007 31

Table: a2 - Household Demography - Gender
l Age category % Male % Female % Tota
Und 3% 3% 6% er 5 years
5-17 years 10% 2212% %
18-59 years 31% 61% 30%
60 years and more 5% 6% 11%
Source: d Food Security Survey 2007
FP / EC HouseholUNDP / W
% Population
3%10%
31%
3%
12%
30%
Under 5 years 5-17 years 8-59 years 60 y nd more
5%6%
0%
10%
20%
30%
40%
50%
60%
70%
1 ears a
% Female% Male
Household Disability
Percentage
Table: a3 -
Any member of HH ability 22% with dis
Source: Household Food Security SurvUNDP / W
ey 2007 FP / EC
HHFS Survey 2007 32

Table: a4 - Number of people living in the household
HH Size Percent
1 9%
2 15%
3 19%
4 23%
5 18%
6 10%
7 4%
8 2%
9 0.2%
12 0.2%
Source: Household Food Security Survey 2007 UNDP / WFP / EC
Household Sizein rural Moldova
15%
19%
23%
18%
10%
4%
2%0.2% 0.2%
0%
5%
15%
20%
25%
1 2 3 4 5 6 7 8 9 12Person(s)
9%10%
HHFS Survey 2007 33

Table: a5 - Yield of Agricultural crops in 2006 - Centners / Hectare
Source: Moldova in figure 2007 National Bureau of Statistics, Republic of Moldova
Rayon Cereal Grain Maizname e Tobacco Sunflower Sugar
beet Vegetables Grapes Fruits
Anenii noi 17.0 13.9 0.0 9.7 334.9 68.8 11.1 23.9 Balti 12.5 14.3 0.0 10.8 163.5 104.0 0.0 11.6 Basarabeasca 19.1 10.7 0.0 9.3 0.0 216.2 9.1 14.3 Briceni 23.0 16.5 5.2 10.4 280.1 109.9 0.0 34.4 Cahul 20.8 17.2 0.0 10.2 0.0 26.7 31.5 21.8 Calarasi 19.3 21.9 0.0 9.6 0.0 122.0 23.2 44.8 Cantemir 19.8 14.1 13.1 12.3 194.4 143.8 60.1 41.2 Causeni 19.2 20.1 15.3 11.5 326.0 97.7 19.6 77.4 Chisinau 18.2 21.0 12.9 10.5 0.0 67.2 31.1 30.9 Cimislia 16.0 8.0 22.6 10.5 152.8 61.8 16.3 29.5 Criuleni 20.9 19.9 16.4 14.4 0.0 68.1 12.4 66.2 Donduse 25.0 25.5 0.0 13.1 329.5 52.1 11.7 21.1 ni Drochia 22.4 15.8 17.9 14.4 246.5 90.6 0.0 26.3 Dubasari 18.7 14.8 13.6 11.7 324.6 83.4 0.0 26.3 Edinet 20.5 16.8 5.0 13.7 217.8 46.5 0.0 19.5 Falesti 23.7 30.2 14.2 16.6 375.8 81.4 33.7 38.8 Floresti 23.0 19.5 8.3 14.2 264.3 59.5 0.0 37.7 Goldeni 24.5 24.7 10.3 15.8 198.7 49.5 6.9 19.8 Hincesti 19.4 20.6 0.8 12.6 223.4 60.8 21.5 35.8 Laloveni 19.0 17.3 16.1 11.2 327.0 57.0 18.5 39.7 Leova 19.6 19.7 17.5 12.6 0.0 25.5 31.3 22.8 Nisporeni 12.5 11.3 13.7 8.6 244.2 45.5 0.0 27.8 Ocnita 21.8 40.5 0.0 13.3 317.0 97.1 0.0 38.8 Orhei 21.1 15.4 15.8 14.2 233.7 104.0 10.9 47.3 Rezina 19.1 18.3 10.7 11.8 161.1 24.6 0.0 30.9 Riscani 19.8 20.5 12.6 12.4 259.6 83.6 7.4 25.7 Singerei 19.4 13.0 16.7 14.8 270.5 98.7 6.8 36.5 Soldanesti 18.9 12.7 10.9 13.9 281.0 32.1 0.0 14.8 Soroca 21.2 26.0 7.9 14.3 238.5 53.7 1.2 58.4 St 116.8 10.7 36.2 efan-Voda 21.4 21.4 18.4 11.5 283.7 Straseni 24.8 26.3 0.0 12.4 0.0 103.2 39.3 60.3 Taraclia 21.1 16.0 0.0 10.8 0.0 42.5 29.7 10.5 Telenesti 15.5 13.8 7.3 12.3 162.1 33.9 7.5 36.4 Ungheni 26.4 35.2 12.1 15.1 372.8 89.3 9.0 35.2 Unitatea Teritoriala Autonnma Gaga
20.3 13.2 16.0 11.4 0.0 70.5 23.2 16.5
Unitatea Teritoriala Din Stinga Ni
No data No data No data No data No data No data No data No data
HHFS Survey 2007 34

Table: a6 - Season's production level of Annual crops compare to last 5 years
on level s Vegetables Fruits/ Kitchen Garden Producti Grain Grapes
More 0.2% 1.5% 2.0% 1.2%
The same 1.5% 5.4% 1% 2.5% 6.
less 0%-25% 5.6% 2.2% 7.1% 6% 9.
less 26%-50% 2% 16.2% .5% 11.5% 3. 24
less 51%-75% 1% 14.2 .9% 27.5% 5. % 29
less 76%-100% 6% 16.2 .0% 37.0% 6. % 27
Don't have anual g % 81.1% 39.5 .0% rains 14.7 % 1
Source: Household Food S ty S 2007
FP / E
7 - Agric al la form n
Land information
ecuri urvey UNDP / W C
Table: a ultur nd in atio
Average size agri e land wns 1.8 (ha) of cultur HH o
Average size (ha) cultu d leas others 0.of agri re lan ed from 4
Average ha) o en ga 0. size ( f kitch rden 2
% of HH func green house 6%s have tional
% o have private wel 41f HHs l %
% of houses with onnect 30 gas c ion %
Source: lHouseho d Food S ty S 2007
FP / Eecuri urvey
UNDP / W C
HHFS Survey 2007 35

Table: a8 - Livestock as of January 2007 - in thousand capita
Rayon name Cow Sheep & Goats Cattle Pigs
Anenii n 17.6 oi 6.1 15.9 9.1 Balti 10.4 2.3 7.3 3.2 Basarab 2.2 easca 1.0 19.9 1.8 Brice 17.3 ni 8.6 15.4 10.9 Cahul 3.8 78.3 6.7 16.8 Cala 14.2rasi 3.6 16.1 5.7 Can 11.7temir 4.0 50.0 6.0 Causeni 8.5 38.0 12.3 25.9 Chi 11.5 sinau 2.9 6.9 4.7 Cimislia 4.9 34.7 7.2 11.9 Criuleni 5.7 7.8 8.1 12.4 Donduseni 6.8 11.0 8.5 10.8
10.3 Drochia 16.7 13.3 12.9 Dubasari 2.2 2.1 3.1 6.7 Edinet 12.4 25.1 16.8 11.9 Falesti 9.5 46.4 13.7 19.6 Floresti 7.0 24.4 10.1 25.9 Goldeni 29.8 12.0 12.8 7.5 Hinces 11.0 25.2 ti 7.4 51.2 Lalo 7 14.1 veni 4.9 10.0 .2 L 6 15.4 eova 4.4 36.0 .0 Nisporeni 3.9 24.3 5.9 16.2 Ocnita 5.9 6 9.2 5.3 .6 Orhei 2.6 11.5 19.8 8.2 2Rezina 3.5 9.9 5.6 10.8 Riscani 28.3 20.3 9.8 14.8 Singerei 39.9 20.4 9.4 13.6 Soldanesti 7.8 4.2 9.1 5.7 Soroca 9.2 15.0 13.2 19.6 Stefan-Voda 5.0 13.0 7.1 21.9 Straseni 3.5 9.4 5.1 18.0 Taraclia 1.9 42.6 3.1 10.1 Telenesti 7.1 31.1 10.8 18.2 Ungheni 6.4 35.9 9.2 16.4 Unitatea Teritoriala Autonnma Gaga 5.5 117.0 9.5 15.9
Unitatea Teritoriala Din Stinga Ni No data No data No data No data
Source: Moldova in figure 2007 National Bureau of Statistics, Republic of Moldova
HHFS Survey 2007 36

Table: a9 - Major Source of Income
First source of incom Pe S ource o Percent e rcent econd s f income
Services 2 Pension / Allowance 40%7%
Annual crops 2 Service 18%0% s
Pension / Allowance 1 Casual l 17%6% abour
Remittance Vineyar 6%9% ds / Wine
Casual labour Remitta 5%8% nce
Diary products Vegetable / Greenhouse 4%6%
Livestock 6% Busines 3%s
Vineyards / Wine Diary p cts 3%3% rodu
Business 2% Livesto 3%ck
Vegetable/greenhouse Fruits 1%2%
Fruits 1%
Non wood forest products 0. 2%
Work abroad 0. 2%
Assistance from relatives 0. 2%
SHousehold Food Security Survey 2007 UNDP / WFP / EC
Table: a10 - Minor Source of Income
. source of income Perce 2nd. source of income Percent
ource:
1st nt
Annual crops 6 Livesto 59%9% ck
Livestock 1 Diary p ts 16%8% roduc
Diary products 1 Vegetable / Greenhouse 9%0%
Vegetable / Greenhouse Vineyar 5%1% ds / Wine
Fruits 1% Fruits 4%
Vineyards / Wine Casual l 3%1% abour
Pension / Allowance 1% Service 1%s
Pension / Allowance 1%
Remi 1%ttance
Non wood forest products 0.3%
Business 0.3%
HHFS Survey 2007 37

3rd.source of income Percent 4th. source of income Percent
Veget Vineable / Greenhouse 22% yards / Wine 26%
Vineyards / Wine 22% Casual labour 20%
Livestock 20% Fruits 16%
Casual labour 11% Pension / Allowance 15%
Fruits 1 ouse 0% Vegetable / Greenh 8%
Pension / Allowance 6% Remittance 8%
Remittance 6% Services 6%
Services 3% Business 1%
Diary products 1%
5th. source of income Perce Percent 6th. source of income nt
Casual labour 2 ension / Allowance 100%8% P
Pension / Allowance 23%
Vineyards / Wine 18%
Services 18%
Remittance 10%
Non wood forest products 3%
Business 3%
Source:
Table: a11 - Main annual crops
Annual crop Percentage
Household Food Security Survey 2007 UNDP / WFP / EC
Maize 8%
Wheat 7%
Potato 3%
Sunflower 1%
Barley 1%
Annual crop is not major source of income 80%
Source: Household Food Security Survey 2007 UNDP / WFP / EC
HHFS Survey 2007 38

Table: a12 - Main reason for debt
son P rRea e centage
Agriculture inputs 14%
Food needs 8%
Health / Education 4%
Renovation and construction 2%
Utility / Heating 1%
Private business 1%
Credits 0.5%
State taxes 0.2%
Leisure 0.2%
Gas connection 0.2%
Funeral 0.2%
Don't have debts % 69
SHousehold Food Security Survey 2007 UNDP / WFP / EC
Expenditure Percentage
ource:
Table: a13 - Expenditure per month
Food 46%
Health / Education 20%
Agriculture 14%
Communal services 16%
Other 4%
Source: Household Food Security Survey 2007 UNDP / WFP / EC
HHFS Survey 2007 39

Table: a14 - Food Consumption
eek consuming food group Number of days per wFood Grou % no
sumption
% 1 Day Consumption
2 Dsum
% 3 Days Consumption
% 4 Days Consumption
% 5 Days Consumption
% 6 Days Consumption
% 7 Days nsumption
p %Con
ays ption CoCon
Cereals & Tub 0.0% 0.0% 3% 3% 3 3% 87% ers 1% %
Pulses 39 % 2% % 24% 19 9% 4% 1% 0%
Vegetables 14% 16 6 28% 12% 6% % 12% % 5%
Fruits 26 % 11 21% % 13% 17 % 6% 3% 3%
Meat & Fish 26% 13% 17 11% 6% 3% 21% % 3%
Diary 31% 9% 11 13% 6% 6% 4% 20% %
Sugar 6% 4% 5% 5% 3% 4% 5% 68%
Oil 2% 2% 3% 3% 1% 3% 2% 83%
Source: Household Food Security Survey 2007 UNDP / WFP / EC
HHFS Survey 2007 40

Table: a15 - Coping Strategies
SHousehold Food Security Survey 2007 UNDP / WFP / EC
Table: a16 – Other Coping Strategies
r t e P
ource:
Othe stra egi s ercentage
Cultivate less land 15%
Send amily member for onal earnings 28% a f
additi
Utiliz v 5e sa ings 6%
SourceHousehold Food Security Survey 2007 UNDP / WFP / EC
Tab - p e S e
Sold assets Percentage
:
le: a17 Co ing Strategi s – old Ass ts
Land 1%
Milk d w pro ucing co 29%
Tra n animals (bull - horse - donkey) ctio 16%
Farm machinery / tools 1%
Source: Household Food Security Survey 2007 UNDP / WFP / EC
Frequent to using the strategy last month Stra ie e
( 1- 3 days / month)
Sometimes (1 - 2 days /
week)
% 6 Days Consumption
% 7 Days Consumption
teg s N ver Seldom
Skip a meal or reduce portion size 41% 19% 19% 15% 5%
Rely s ex orerr o 14% 26% 26% 18% on les
prefpensi
ed fve
ods less 15%
Meal from social canteen 99% 0.2% 0.7% 0.2% 0.2%
Meal through school feeding 75% 1% 2% 11% 10% Purch food on credit or
rrowing 69% 8% 13% 8% 1% ase bo
HHFS Survey 2007 41

Table: a18 - Coping Strategies – Sold or Cull Livestock
Own / Sold or cull livestock % Currently l oown % Cul r sell
Milk producing cow % 15% 31
Tractio als (bull - horse - y) n anim donke 9% 3%
Pig 25% 36%
Sheep / goat /rabbit 1% 16% 2
Poultry 81% 63%
Source: ld Food Security Survey 2007
ion
fodd Percentage
HousehoUNDP / WFP / EC
Table: a19 - Coping Strategies - Adopt
Adoption to meet er needs
Didn't experience lack in fod 26% der
Restructuring of the livestock 14%
P edit or borrowing 30% urchase fodder on cr
Source: ld Food Security Survey 2007
ht Support
% Received % Received Non food
% Received Food & non
food
HousehoUNDP / WFP / EC
Table: a20 - Droug
Aid Source food
Government 0.7% 2.0% 0.5%
Non government 0.0% 0.5% 0.0%
Private 0.0% 0.3% 0.0%
Source: ld Food Security Survey 2007 Househo
UNDP / WFP / EC
HHFS Survey 2007 42

Annex 3 – References CFSAM 2007. FAO/WFP Crop and Food Security Assessment Mission, August 2007.
DHS 2005. Demographic and Health Survey, Republic of Moldova
IOM oldovan C unities Abroa d Moldova
IOM/SICA 2006. Mo a: Migration and Remittan iel Institute orld
Economy
NBS 2007. Moldova in Figures 2007
l Yearbook 2006. Statistical Yearbook of the Republic of Moldova 2006
Poverty Update. Report No. 35618-MD, World Bank
2007. Exploring the Link between M omm d an
ldov ces, K for W
Statistica
WB 2006. Moldova
HHFS Survey 2007 43

Part 2 - Report on Rapid Household Food Security Assessment in ransnistria
nk
drought ich resulted in massive losses and famine in the post second world war Soviet
request
pid assessment onducted in Transnistria by WFP over the period of 13-21 December 2007. Meetings here held in the Ministries of Economy, Health, Social Defense Statistics, two research
ompanies (Centre of the Strategic Research and Reform and New Age - Novi Vek - in easpoon and Chishev, and with districts officials. Two focus group discussions were onducted in the villages: large scale farmers (men) and women employed by the local illage administration. Field trips covered Tersapol, Slobodia, Ribninsk and Grigoriopol istricts. The Statistic Yearbook 2006 issued by the Ministry of Economy of Transnistria, port of the Centre of the Strategic Research and Reform (CISR) and different other data
rovided by the officials during interviews were used as reference material for this report.
ue to limited time, weather conditions7 and political sensitivity, the team was not able to btain all relevant data. Hesitation to organize face to face interviews with most ulnerable households was also observed. Despite these shortcomings the commendations in this report are based on a literature review, fiel d observations, terviews and triangulation of the available data.
ollowing to August 2007 Rapid Food Security Assessment in Moldova proper, a ousehold Food Security Baseline Survey was conducted in November 2007. It is highly commended that a similar survey is carried out in Transnistria to establish a baseline for ture monitoring.
T
BACKGROUND Transnistria is a breakaway region of the Republic of Moldova located on the east baof Dnistr River bordering with Ukraine. Due to low precipitation, and hihest temperatures over the last 100 years, the drought in summer of 2007 is being compared to the of 1946 whMoldova. A Joint FAO/WFP Crop and Food Security Assessment Mission in response to afrom the Government of Moldova carried out from 12-22 August 2007 did not cover the left bank of Dnistr. This report presents the analysis and findings of a racwcTcvdrep Dovrein FHrefu
7 heavy snow and frost on the roads
HHFS Survey 2007 44

SOCIO-ECONOMIC BACKGROUND Transnistria is located on 12 percent of the former territory of the Soviet Republic of
ere constructed here. In addition, there were about another 100 plants, among
tization process followed by big
ation rate fluctuations over 2001-2006. Some stability was achieved in 006. However, according to the Office of the Statistics of Transnistria, inflation rate for e period of January-November 2007 is 27%. This indicator for the same period of last
ear was 7.75%.
Moldova. Fifteen percent of the population of the Republic lived on this territory during Soviet times. However 40 percent of the domestic product was localized and produced in this part of the Soviet Republic. Due to better road access to the rest of the Soviet Union, its close location to one of the biggest ports of Odessa on the Black Sea, low seismic risk and ample water resources, a big metallurgic factory and the largest electric station in the
alkans wBthem, large scale food processing units. These processed most of the agricultural produce of the region. Transnistria stretches 4,160 sq. kms along the left bank of Dnistr with relatively uniform topography. The North having slightly higher hills and receiving more precipitation. The soil and climatic conditions of the region are considered to be very good for agriculture. There are seven administrative territorial units in the region with three big industrial cities (Teraspol, Bendery, Ribnitsa) and 5 rayons8 (districts) with 156 villages. 32 percent of the population are Moldovs, 30% are Russian, 29% Ukrainian and 90 percent Orthodox Christians. Total population of Transnistria is 540,600 9 . Around 46 percent of the population lives in rural or semi rural settlements. 49 percent of the total labor force
37,300) is registered as economically active out of which only 7 percent are formally (3employed by the agriculture sector10, 28 percent work in the public sector, 27 percent - in industry and 38 percent - in services. Average starting monthly salary in agriculture sector is 82 USD, in industry - 199 USD and in public sector 104 – 162 USD. The per capita GDP rate in 200111 was 394.9 USD and in 2006 it reached 967.5 USD.
he main reason for this significant growth is the privaTcash inflows. This injection to the budget made it possible to increase salaries of state employees three times, increase pensions and cover some past arrears in pension and salary payments. The currency in circulation is called Transnistria Moldova Republic Ruble (Ruble). The exchange rate at the time of this assessment was 1 USD = 8,4 Ruble.
able 1 shows inflT2thy
8 Ribnitsa at the same time is administrative centre for the Ribnitski Rayon 9 Statistics Yearbook of Transnistria, 2006 10 These are remaining workers of the collective and soviet farms (Colkhozes and Sovkhozes), plus the workers of the newly emerging agro enterprises described in the section Agriculture in Transnistria
s last official household poverty analysis was made in 2001 11 2001 is taken as a reference year a
HHFS Survey 2007 45

Table 1: Main macro economic indicators of Transnistria 2001 - 2007
5 2006 Jan-Nov 2006
Jan-Nov 2007
2001 2002 2003 2004 200
GDP per capita rate in USD 394.9 392.2 490.8 675.5 844.1 967.5 n/a Inflation rate (%) 48.9 14.07 21.7 30.2 13.4 10.7 7.75 27 Agriculture output in Rubles 176.8 181.3 173.2 224.7 217.1 n/a Source: CISR and Office of the Statistics of Transnistria Transnistria was part of a 1997 Worold Bank funded household survey on Incomes and Expenditures in Moldova. Collected data was analyzed in Chisinau, however this cooperation ceased in 2003. Monthly collection of the same data from 120 households from different rayons of Transnistria is still ongoing but the data are not analyzed. According to the survey, in 2001, about 87 percent of the surveyed populations lived below the subsistence level.
s
The consumer budget line (average monthly expenditure) for one adult is 1,116.37 Transnistrian Ruble (133 USD) for November 2007 and the minimum subsistence level expenditure for an adult is 607.86 ruble (72.36 USD). Table 2 presents poverty indicatorfor 2001. Table 2: Poverty indicators Transnistria Ruble USD % of people living
below 2001 Nov. 2007 2001 Nov. 2007 2001 Nov. 2007 Minimum subsistence level 181.84 607.86 31.79 72.36 86.6 n/a Minimum consumption budget level 358.09 1,116.37 62.60 132.90 13.4 n/a Source: Office of the Statistics of Transnitria
here are 133,500 pensioners Tin Transnistria. Pension and other social allowances are provided according to: a) age (55 years for women and 60 years for men), b) disability, c) years worked, d) loss of the breadwinner, e) social status and f) veterans of the war. The average pension rate is 500 Ruble (59 USD) there are very few war veteran pensioners receiving up to 150 USD.
Table 3: Allowances to the pensioners of different categories Category of the pensioner Amount of allowance in USD for
2006 age 56 disability 55 loss of breadwinner 36 years worked 50 social status 22 Source: Statistics Yearbook of Transnistria, 2006
The consumer budget line for an adult is 1,116.37 Transnistrian Rubles (133 USD) for n adult is 607.86 Rubles
of l.
an 2007.
November 2007 and the minimum subsistence level line for ma(72.36 USD) for the same period. According to the assessment of the situation by somethe officials around 50 percent of the population live below minimum subsistence leveDuring interviews, respondents considered the situation in 2001 as being better th
HHFS Survey 2007 46

There are eleven categories qualifying for social assistance. The status is granted through pplication and provision o t r m c %
vel. Most of er ith amilie ing ll e 125 Ruble (around 15 USD) per child and r i I o s s am t up to 2
,411 children are getting ocial allowance according to the criteria listed in Table 4. During field visits it was
a of pro f that he ove all fa ily in ome is below 75 the f
of the s havminimum subsistence le
inimum a these crit
n ia are interlinked w
children and m o cwan amou ts toincreases with the numbe of ch ldren. t is planned t increa e i th o nu 59 Ruble (31 USD) from January 2008. 6,750 families having 12sobserved that some deserving families were unable to provide necessary documentation and could not benefit from the allowance. Table 4: Data of the beneficiaries of the social allowance by 1 Nov. 2007
Category No. of Families No. of Children Single mother 2,603 3,360 Multi children families 1,758 5,654 Families with one disabled parent 1,119 1,558 Special group 662 880 Families with disabled children 279 286 Families where one parent is under the investigation
37 50
Parent of the military servant 0 0 People working on Chernobyl rehabilitation
10 16
Single breadwinner of the multi children family
134 412
Families with one or both parents 96 103 being students Single unemployed parent with child <3 y.o.
52 83
Total 6,750 12,402 Source: Ministry of Health and Social Defense of Transnistria There are 11 residential institucategories financed either by theEducation (MoE). The Swiss Dewith the MoHSD to support of thin non residential institutions. Table 5: beneficiaries of the residential children institutions in Transnistria
Institution type Num
ti catering for around 2,696 children of different s of Health and Social Defense (MoHSD) or v tion and a British N are working e ildren to their families or ir placement
ber of children Category Financing Body
ons Ministrieelopment Coopera GO return of ch the
Children House 100 orphans 0-7 yo MoHSD Rehabilitation Centre 50 Disabled MoHSD Rehabilitation Centre 50 Disabled MoHSD
Boarding schools: 8 2,496 orphans, children from families experiencing economic difficulties, children from dysfunctional families
MoE
11 institutions 2,696
HHFS Survey 2007 47

Source: Ministry of Health and Social Defense of Transnistria
er g e
AGRIC RE IN TR R
still ong The land is not privatized in the region. The as d and other
ere he used ork. This righ uaranteed by a be sold, gifted or handed over to any private or legal entity.
huge indebtness of the former kolkhozes, the property is already e taken away their creditors unless these unprofitable agro-e officially declared bankrupt by the authorities. Moreover,
arms is already taken away by the authority and relocated in to be leased to private farmers or
d. There flat tax on land amounting to 12 USD ha/year. on total agriculture land resources of Transnistria is depicted in Table 5.
e official data it can be concluded that only 53 percent of the and perennials) was cultivated in 2006.
any urban ones, own some plot
t of the
rtion of the agriculture rms was p uced on p owned farms. Distribution of the land rming entities and ownership of the livestock is depicted in Tables 7
tion of the agricu nd to di ion levels in 06
All public schools have a school feeding programme. However it was observed that freeone time meals were provided only to very few children from extremely poor families. All children have access to preschool education funded by the authorities and parents pay only supplementary fees for this service. Different charity agencies used to operate free soup kitchens for needy people. Howevthe Assessment Team could not obtain any information on such currently functioninkitchens. In the MoHSD it was verified that this support was very important for som
yers of the poorest people and confirmed the need for such support. la
ULTU ANSNIST IA Land reform in Transnistia is
ber of the collective farmoing.
former mem (kolkhoz) still h legal rights to lanproperty of the kolkhoz wh to w t is gcertificate which could However due to thebeing taken or likely to b byfarming organizations aruncultivated land of these fthe state land reserve fund other commercial entities for a maximum of 99 years perioInformation
is a
Through the analysis of thland (arable
ll households living in rural and semi-urban, including mAof land since Soviet times. This land is adjacent to their houses and farming is a common practice. According to the official data around 14.5 % of the agriculture land recourses of Transnistria are owned by the private household farms.
pproximately 50 to 74 percen
Table 6: Agriculture land resources of Transnistria
Area in Ha Total arable 229,700 Total perennials 23,100 among them: Orchards 16,200 A
livestock is also under the private po he essession. By t nd of 2006 the largest propoproduct in value te rod rivately among different faand 8 respectively. Table 7: Alloca lture la fferent farming entities and product 20
Grapes 5,700 Pastures and mow land 22,800
Source: Statistics Yearbook of Transnistria, 2006
HHFS Survey 2007 48

under cultivation in
2006
agriculture land under cultivation
in 2006
volume in monetary terms in
2006
Agriculture land (ha) Distribution of Distribution of
production
1 Private household farms 19,33512 14.50% 38.50% 2 Agro farming organizations 63,600 47.60% 34.10% 3 Large household farms and leasers 38,715 29.00% 5.10% 4 Agriculture organizations of limited liability 30,972 23.20% 16.90% 5 Supporting farms 267 0.20% 5.40% Totals 133,554 100% 100%
Source: Statistics Yearbook of Transnistria Agriculture production on private farms largely depends on the size of the land plot
cording to the new Land Code it engaged in small scale farming.
t to
ut of 116 retained farms, 80 were
arm e right on any property. The sam o
ns living in the rural or n
n by one household. These are the households h
which does not exceed 0.3 ha per household. However acis planned to increase it to 0.7 ha/hh. All households areThose who used to be members of the collective farm (equity holders) are entitled to some part of produce from the farm. However, the Assessment Team concludes thaduring the last few years and particularly after this summer drought, nothing was givenshareholders. Very few percent of these type of household have organized themselves by withdrawing their land share (2.7 to 3.3 per former collective farm member) from the collective farms and in small groups started independent management of their farms. The others have leased some small plots from the state land reserve funds. However it was difficult to conclude whether access to additional land for lease or withdrawal of their land shares from the farm is appreciated by the authorities and popular among rural households. Agro farming organizations are the former collective and Soviet farms. These farms were sustained by the Transnistria authorities till the new Land Code was issued in 2002. Very few of them were abolished or declared bankrupt. Ononprofitable by the end of 200613. Some of these farms have changed their legal status and are now called cooperative farms. However, this change does not imply serious structural transformation. All rural and semi-urban population was employed during Soviet times in collective or Soviet fworkers of the soviet farms do not haveformer teacher, doctors or people of othedistricts. Large household farms are large farms ruwho hold the right to use land (up to 200 or heritage this right to others. There are onl re region. They live in the village and represent the richest wealth group in the rural setting.
s. Unlike to the former kolkhoz members,th e applied t
ar professio semi urb
a) up to 99 years, including the privilege to sell y a few dozen such households in the enti
n by the private household farms in this table is actually the land size owned by the 12 Area under cultivatio
75,992 households 13 Statistics Yearbook of Transnistria, 2006
HHFS Survey 2007 49

Chart 1: Distribution of Arable Land under Crops
Feed crops, 19%
Technical crops, 4%
Grains and pulses,
Potato and vegetables,
57.10%19.90%
There is a subgroup of leasers in the
u h row of the
no
a e.
e agriculture training to their students.
shown in Chart 1.
opportunities in the rural area,
is around 300 USD.
Table 8: Livestock ow in 5 nership trend Transnistria 200 – Jan. 2007 fo rtTable 7. The leaser ca be individual or gr up of people (small and large sc le) and corporatThe latter are
005 6 by 2007 2 200 Jan.
# % # % # %
Total cattle 30,880 2729,323 ,818 among it private HH farms 62% 61% 1 7%19,166 17,752 5,853 5Total cows 1 1518,90 16,997 ,351 among it private HH farms 7% 76% 11 75%14,461 7 12,920 ,483 Total pigs
commercial enterprises which lease land for producing raw material. If the authorites assess the allocated land is not used as outlined in the agreement, they retains the right to confiscate the property. Organization of limited liability is a newly emerging form of entity in line with market economies, however land cannot be purchased Supporting farm lands are provided to institutes whose primary activity is not agriculture. These are schools, orphanages and etc. Since Soviet times these institutions produce ome food and provide som
27,502 32,298 36,456 among it private HH farms 943 3% 879 3% 1,156 3% Total sheep and goat 18,170 16,660 15,489 among it private HH farms 12,907 71% 11,291 68% 10,727 69%Total poultry 452,641 539,005 486,262 among it private HH farms 338,856 75% 343,913 64% 323,465 67%Source: Statistics Yearbook of Transnistria 2006
s There is a growing tendency of land resources becoming concentrated under the organizations of limited liability and leasers. This leaves very little opportunity for poor households in the countryside to access their own equity or other land if they wish so. They are limited to small private household farms and seasonal work on large farms. 76% of arable land cultivated in 2006 was sown under the extensive mechanized crops. Distribution of the types of rops is c
Opportunities for seasonal work is greater in the regions where mainly vegetable, potato and fruits are grown. Popular professions, but very few
are mechanics, drivers and milkers. Their average monthly salary
HHFS Survey 2007 50

HHFS Survey 2007 51
DROUGHT
rley due to the drought of 2007 in the region was m a o 3
percent, however loss of maize, fl n g c
were ted in s ses up 9 0 p n it
0 A gc autum
r i
spring seeds for maize and
lds in 2006 is depicted in Chart 2.
omatoes are used as a
h in
of one so called survival cow is the last resort. In the odzia around 11-17 percent of rural housholds own proportion is significantly lower. Cash from selling of their income. Drought resulted in drying of communal ple started to sell their cows. The Assessment Team r raw information available from the district officials
IMPACT OF TH The overall loss of wh
crops than last year. This is explained by anticipated lack of
E
eat and baesti ated t ar und 5-40
sun ower a d ve etable rops estima ome ca
to 0-10 erce t. Fru andgrape losses was assessed to be than over 5
s%. ccordin
r to
offi ials thinted
n large the w
area nterwas pla unde
sunflower planting in 2008. Distribution of land cultivated by all types of agriculture organizations and entities under he different grain crops except private househo
Distribution of A
Wheat
Maize7%
Barley37%
rable Land Under Grain
53%
s
Others3%
t Small scale households mainly produce maize, vegetables, few fruits and grapes on their land plots. Some of the corn is used for poultry and pig fodder and residue is used for attle feed during winter. Surplus of grapes, fruits, cabbage and tc
source of cash by the households, though most produce is self consumed. Families largely depend on home grown vegetables. In most of the villages there are public as well as private wells and most of the
ouseholds have special water reservoirs which they use for watering plants. Thoughthe villages there are neighborhoo HFor many households ownership districts like Grigoriopol and Slobcows. However in other rayons thismilk is a significant proportion of pastures during summer and peocould not obtain statistics howeveconfirm this tendency.
MARKETS
ds where water wells were dry this summer.

The entire Region is well connected with every village accessible through all weather sphalt roads. The remotest farm is within a few kilometers of a paved road. There are
few14 bridges connecting right and left banks of the Dnistr. There are four types of eepers, b) Office of Migration (Transnistria
d) Customs offices of Transnistria sides.
eclearance from the both sides. The checkpoints at Bendeis rigorous. Nevertheless no serious problem of lack of athe Assessment Team. There are daily markets in all district centers and citiesfor basic food and household commodities. It was not data on imports of cereals and other basic commoditiesthe Ministry of Economy it was mentioned that this typeby the ministry and according to preliminary results arocereals of the region is satisfied through local productiolifting some crossborder restrictions with Ukraine this y
al areas. Around 15 percent here live in extreme overty, another 10-15 percent of the population receive salaries through work in public
ge”.
activity. However it was noted that generally this is a very stable and unreliable source of income.
a
checkpoints: a) organized by Russian Peace Kuthorities c) Customs Offices of Moldova and a
All vehicles are stopped at each checkpoint except for Russian Peace Keeper Points. Passengers and cargo movement are checked and registered. Movement of the
ction, various fees and document ri city are most busy and control ny types of goods was found by
. Almost all villages have shops possible to obtain disaggregated . However during the meeting at of analysis has been undertaken und 25 percent of the demand in n. The rest is imported and after ear, no deficit of food items was
observed in the local markets. Food security of vulnerable people rests in their economic accessibility to food in the markets.
commercial goods, and food for sale are subject to insp
INCOME AND EXPENDITURES According to the information collected by the WFP team it could be concluded that poverty is more widespread in rurpsector and/or have jobs in the enterprises or agriculture organization and thus are considered to be better off. Around one percent of population is considered to be rich. These are large scale household farmers. The rest of the population lives on “ed The core source of income of rural households is their private farm and livestock. Supplementary sources are - seasonal work on large vegetable and fruit farms, and remittances. Short term travel To Russia for temporary jobs is common practice. On average these migrants earn 500 USD per month and come back after 3 months to update migration papers and consequently travel back after some. In one of the villages visited by the team it was estimated that around 40 percent of households cope with their difficulties through thisun
exact number could not be obtained by the team, through there are 6 big bridges 14
HHFS Survey 2007 52

According to the statistics yearbook of 2006, around 44 percent of the income of average household comes from on salaries and social transfers and about 22% from remittances.. It is assumed that the remaining income comes from farming. This proportion would be much higher for families where there are no employed members or do not receive pension or social allowance. In order to provide additional social protection, authorities have introduceed price control over certain commodities and services (Table 9) Table 9: List of the Commodities and Services under the Price Regulation in Transnistria Commodities Services Bread and pastry Gas Pasta Electricity Milk and baby food Utilities Cereals and pulses Public transport exact taxi Manufactured canned baby food Postal service, telephone service All kind of animal and vegetable fats Services related to TV broadcasting Eggs Services for lift Some essential medicines Service of street cleaning from snow Soap Technical service for installation of electro
gas, hot water and portable water School books and stationary Prices on all staple commodities sold on the markets have increased during this year. The
hart below shows price changes of the main commodities. Price for cattle feed have
Table 10: Average prices on staple commodities
Cdoubled this year and resulted in slaughtering and selling of cattle and pigs or restructuring of the livestock composition. Bread price is not included in this chart as it is controlled. However, first price increase by 25% occurred in October 2007. There are two more increases planned for 2008.
2006
Kg/Ruble 2007
KG/Ruble
Potato 3.50 5.16 Wheat flour I quality 1.85 3.90 Maize flour 2.68 4.70 Beans 5.35 11.25 Pulses 2.71 5.44 Vegetable oil 6.50 10.79
Price Dynamics on the Staple Commodities during 2007
-
5.00
10.00
15.00
20.00
25.00
Janu
ary
Febr
uary
Mar
chAp
ri lM
ayJu
neJu
lyAu
gust
Sep t
embe
rO
ctobe
rNo
vem
ber
Rubl
e
Potato
Wheat f lour I quality
Maize flour
Beans
Pulses
Vegetable oil
HHFS Survey 2007 53

NUTRITION Rural diets consist of staple (wheat), vegetables, occasional meat and seasonal fruits. Sweet tea with bread and butter, rarely with cheese is consumed at breakfast. Meals onsist of vegetable soup, brec ad, Mamalika (corn porridge) and buckwheat. On occasion,
he lack of information on poverty or food security it is highly recommended to conduct a Household Food Security Baseline Survey. There are
ncies with proper c o conduct a survey. However the t Team met the representatives of the Research Company New Age
netw r has recently
f very seriou od (milk producing cows) and conseq ehouseholds is obvious. The situati where there
rtunities am ercial agriculture farms growing labor intensive crops like fruits, vegetable, potato. Rural households
mended for most vulnerable groups. This support will become more crucial after the upcoming bread price increment by the beginning
ention would be support of schools with o er
ration should be provided for the rest. Opening of the social ens es ly in the district centers is a feasible strategy. The criteria for vulnerable groups are described in the annex A.
• Support with maize seeds for smal nsure uction ed
for the livestock and will ensure re eir food inse for ne r. Support is required in order to ma heir agriculture ac on th d land. It is very likely that without external support small lease househo ill not cultivate allocated land plots a will withdr is land r imitating incomes of these food insecure households.
beverages may include wine, especially from own vineyards. Tthere is no data on malnutrition rate in the region.
RECOMMENDATION
• Due to t
limited age apacity tAssessmen(Novi Vek) which has a o k of enumerators in Rayons andconducted several surveys.
• The likelihood o s depletion of the important liveliho
u nt deterioration of the food security of the on is more dramatic in the districts
are limited job oppo ong enterprises or comm
living in the districts of Grigoriopol, Dubasari and Kamenki are found to be more vulnerable to the risk to lose their cows due to non availability and high cost of fodder. Annex A provides the breakdown of the estimated beneficiary numbers and criteria for this intervention.
• Food aid is highly recom
of next year. Proposed strategy for intervfood commodities to ensure free ne time meal for all students. Relief wint
cante pecial
l scale farmers will e prod of fecovery of th curity xt yeaintain t tivity e lease
lds wnd authorities aw th furthe
HHFS Survey 2007 54

• Cash for wosmall scale farm
rk is proposed for achieving long term sustainable food security of ers in Transnistria.
HHFS Survey 2007 55

ANNEXES
HHFS Survey 2007 56

Annex A - Beneficiary Targeting Criteria for fodder distribution and od aid intervention:
he beneficiaries should be selected from the households primarily one or all of the
following criteria: a) Households owning one cow (his criteria is used only for selecting
beneficiaries for fodder distribution intervention) useholds falling under the criteria of the Ministry of Health and Social fense, receiving or not - allowance under the Programme for the
Support of the Families with Low Income c) households with one and more disabled (due to disease or age) d) households with 2 (two) and more children
The households falling in the above criteria but with additional features described below should be excluding from the beneficiary lists with the indicated (from one to seven) descending order:
1. households running large scale household farms (krestiansko fermerskoe xoziastvo) and producing cereals, vegetable, fruits, grape, livestock
2. owning functional green house and fish ponds 3. leasing more than 1 ha of the land where potatoes, vegetables, fruits and grapes
are grown 4. having the formal job with any farm as agronomist, mechanist, driver, milker and
other highly paid jobs 5. owning operational vehicle (tractor, combiner, car and etc.) 6. family member employed in public sector primarily on managerial position 7. family member has job in the enterprise or banking sector 8. one member is war veteran
fo
T
b) hoDe
HHFS Survey 2007 57
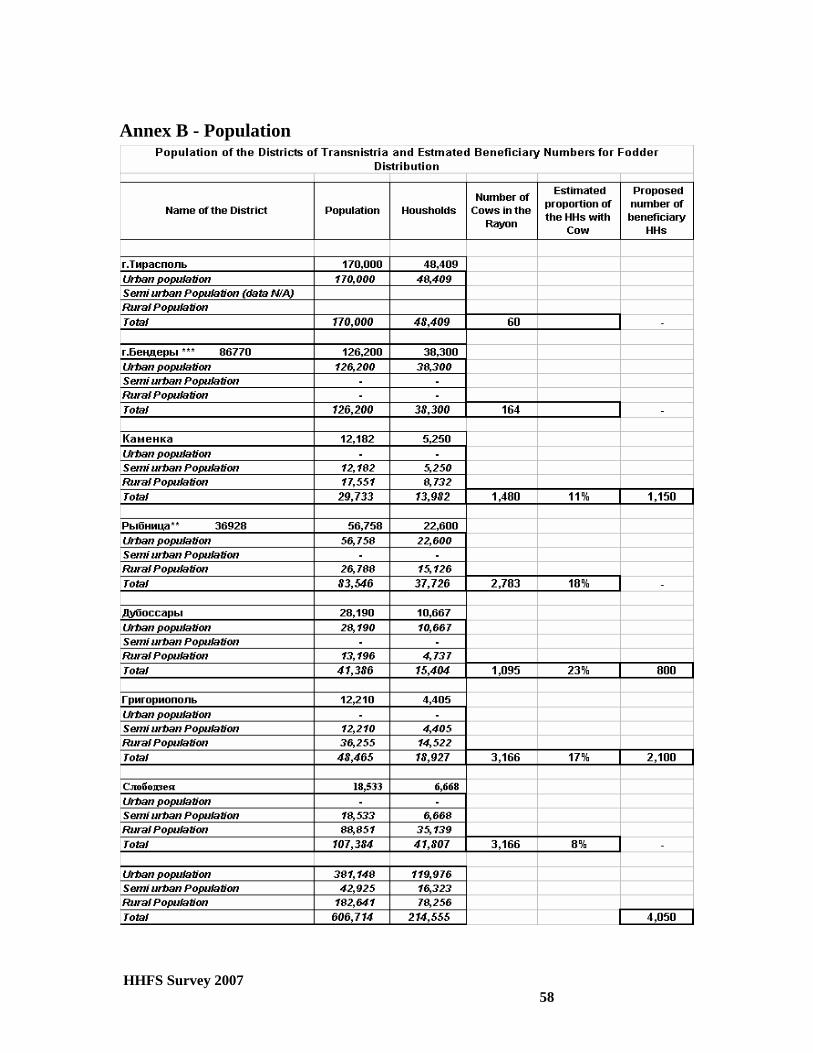
Annex B - Population
HHFS Survey 2007 58


