Network embeddedness, specialization choices and performance ...
Appendix C Page C-1
Appendix C: Data Tables and Methodology Note: Section numbers refer to Chapters and Sections in the body of the report.
2. Characteristics of Embeddedness
2.1 Background Traditional statistical methods of correlation analysis and chi-square analyses were employed wherever appropriate. In addition, a variety of data-mining techniques were also used to gather information. These techniques include Factor Analysis, Correspondence Analysis, and Logistic Regression. Wherever possible, p-values to indicate whether a result was statistically significant were included. It was assumed that α = 0.05 was the target level of significance. The predominant data-mining method used in these analyses is Correspondence Analysis. This type of analysis attempts to find patterns in the data based on chi-square distances from a computed central measure, very similar to a mean. Graphs are produced that plot variables based on these differences on two coordinate axes. Those variables that appear close together on the graph can be assumed to have similar characteristics and are marked with green circles. Factor Analysis also uncovers underlying patterns in the data by grouping variables into similar factors or categories. Logistic Regression identifies which variables have the strongest influence on the outcome of dichotomous variables. Several of the questions in the survey are designed to have yes or no answers.
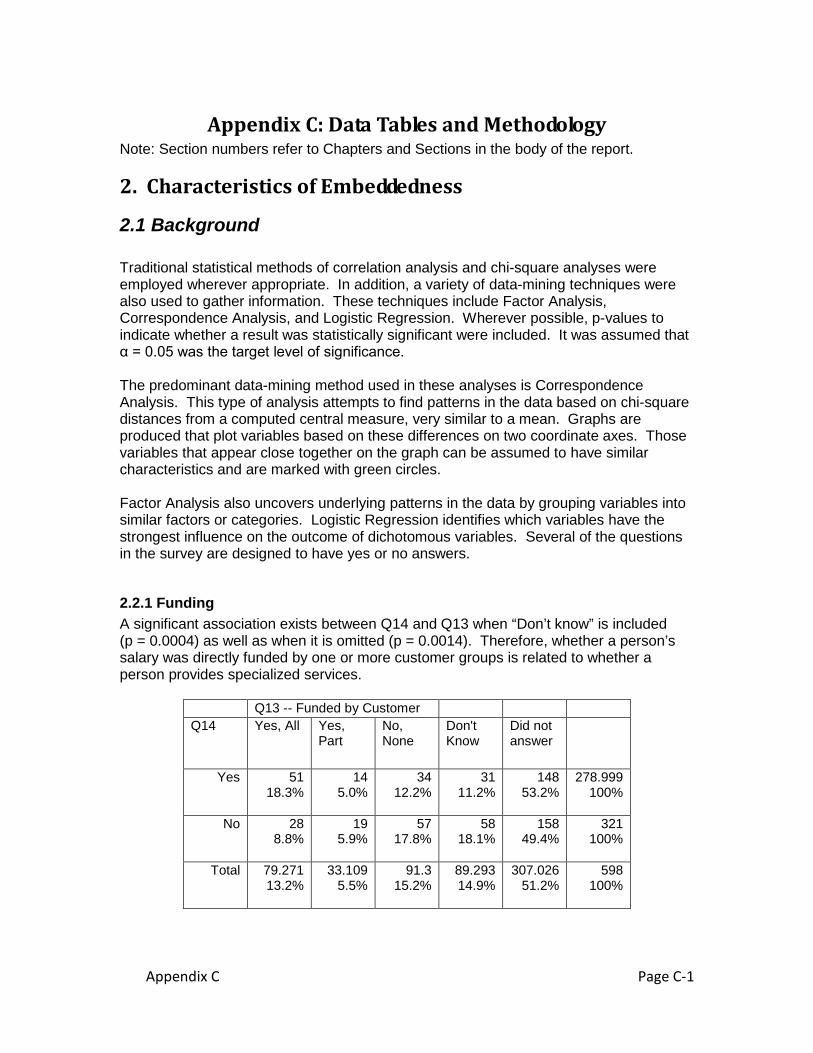
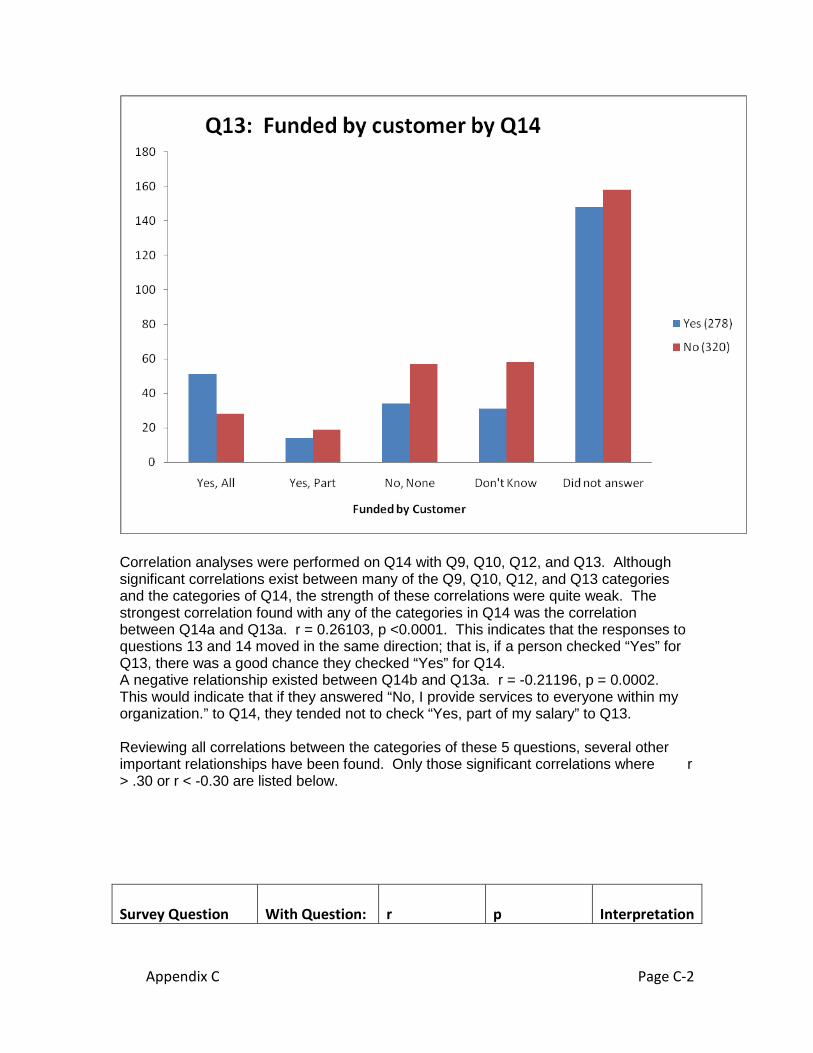
2.2.1 Funding A significant association exists between Q14 and Q13 when “Don’t know” is included (p = 0.0004) as well as when it is omitted (p = 0.0014). Therefore, whether a person’s salary was directly funded by one or more customer groups is related to whether a person provides specialized services.
Q13 -- Funded by Customer Q14 Yes, All Yes,
Part No, None
Don't Know
Did not answer
Yes 51 18.3%
14 5.0%
34 12.2%
31 11.2%
148 53.2%
278.999 100%
No 28 8.8%
19 5.9%
57 17.8%
58 18.1%
158 49.4%
321 100%
Total 79.271 13.2%
33.109 5.5%
91.3 15.2%
89.293 14.9%
307.026 51.2%
598 100%
Appendix C Page C-2
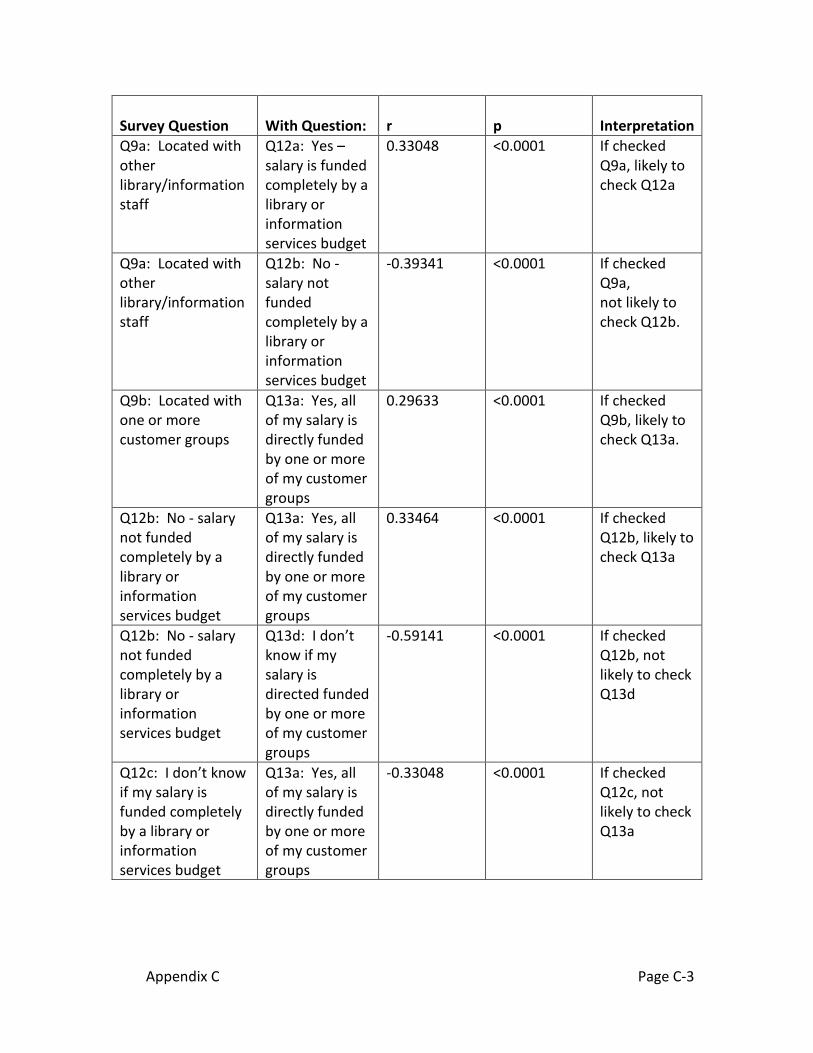
Correlation analyses were performed on Q14 with Q9, Q10, Q12, and Q13. Although significant correlations exist between many of the Q9, Q10, Q12, and Q13 categories and the categories of Q14, the strength of these correlations were quite weak. The strongest correlation found with any of the categories in Q14 was the correlation between Q14a and Q13a. r = 0.26103, p <0.0001. This indicates that the responses to questions 13 and 14 moved in the same direction; that is, if a person checked “Yes” for Q13, there was a good chance they checked “Yes” for Q14. A negative relationship existed between Q14b and Q13a. r = -0.21196, p = 0.0002. This would indicate that if they answered “No, I provide services to everyone within my organization.” to Q14, they tended not to check “Yes, part of my salary” to Q13. Reviewing all correlations between the categories of these 5 questions, several other important relationships have been found. Only those significant correlations where r > .30 or r < -0.30 are listed below. Survey Question
With Question:
r
p
Interpretation
Appendix C Page C-3
Survey Question
With Question:
r
p
Interpretation
Q9a: Located with other library/information staff
Q12a: Yes – salary is funded completely by a library or information services budget
0.33048 <0.0001 If checked Q9a, likely to check Q12a
Q9a: Located with other library/information staff
Q12b: No - salary not funded completely by a library or information services budget
-0.39341 <0.0001 If checked Q9a, not likely to check Q12b.
Q9b: Located with one or more customer groups
Q13a: Yes, all of my salary is directly funded by one or more of my customer groups
0.29633 <0.0001 If checked Q9b, likely to check Q13a.
Q12b: No - salary not funded completely by a library or information services budget
Q13a: Yes, all of my salary is directly funded by one or more of my customer groups
0.33464 <0.0001 If checked Q12b, likely to check Q13a
Q12b: No - salary not funded completely by a library or information services budget
Q13d: I don’t know if my salary is directed funded by one or more of my customer groups
-0.59141 <0.0001 If checked Q12b, not likely to check Q13d
Q12c: I don’t know if my salary is funded completely by a library or information services budget
Q13a: Yes, all of my salary is directly funded by one or more of my customer groups
-0.33048 <0.0001 If checked Q12c, not likely to check Q13a
Appendix C Page C-4
Survey Question
With Question:
r
p
Interpretation
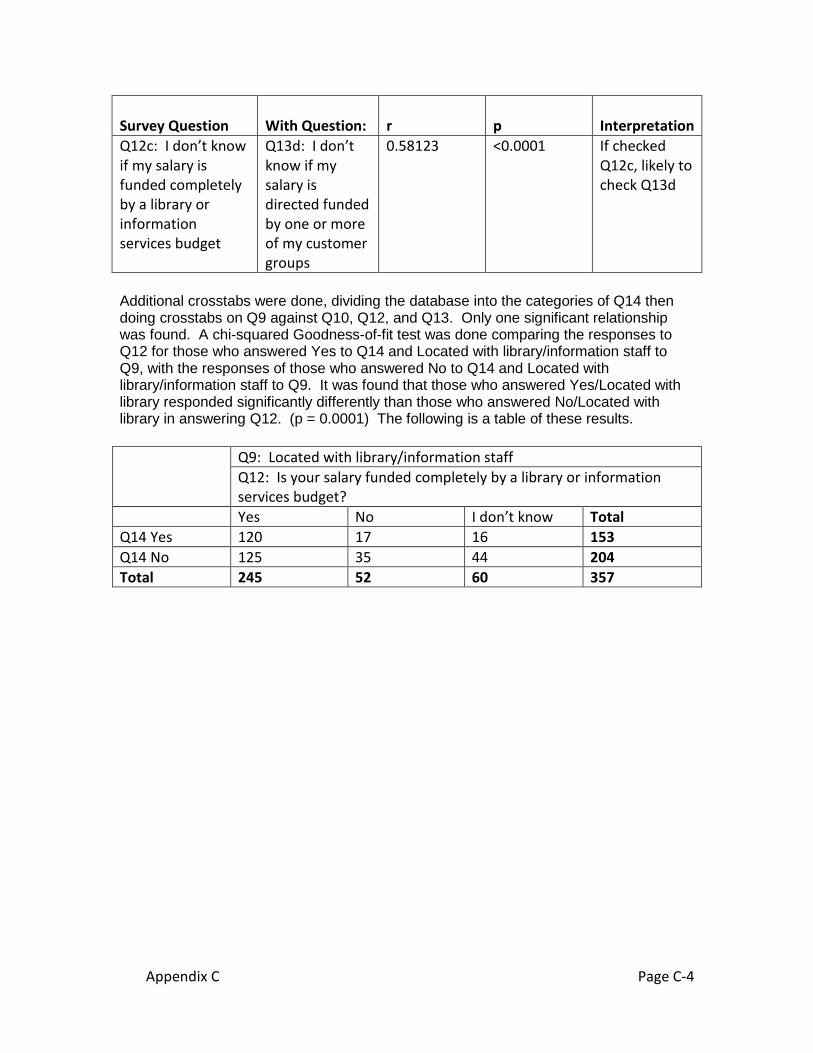
Q12c: I don’t know if my salary is funded completely by a library or information services budget
Q13d: I don’t know if my salary is directed funded by one or more of my customer groups
0.58123 <0.0001 If checked Q12c, likely to check Q13d
Additional crosstabs were done, dividing the database into the categories of Q14 then doing crosstabs on Q9 against Q10, Q12, and Q13. Only one significant relationship was found. A chi-squared Goodness-of-fit test was done comparing the responses to Q12 for those who answered Yes to Q14 and Located with library/information staff to Q9, with the responses of those who answered No to Q14 and Located with library/information staff to Q9. It was found that those who answered Yes/Located with library responded significantly differently than those who answered No/Located with library in answering Q12. (p = 0.0001) The following is a table of these results. Q9: Located with library/information staff
Q12: Is your salary funded completely by a library or information services budget?
Yes No I don’t know Total Q14 Yes 120 17 16 153 Q14 No 125 35 44 204 Total 245 52 60 357
Appendix C Page C-5
3. Organization and Industry Characteristics
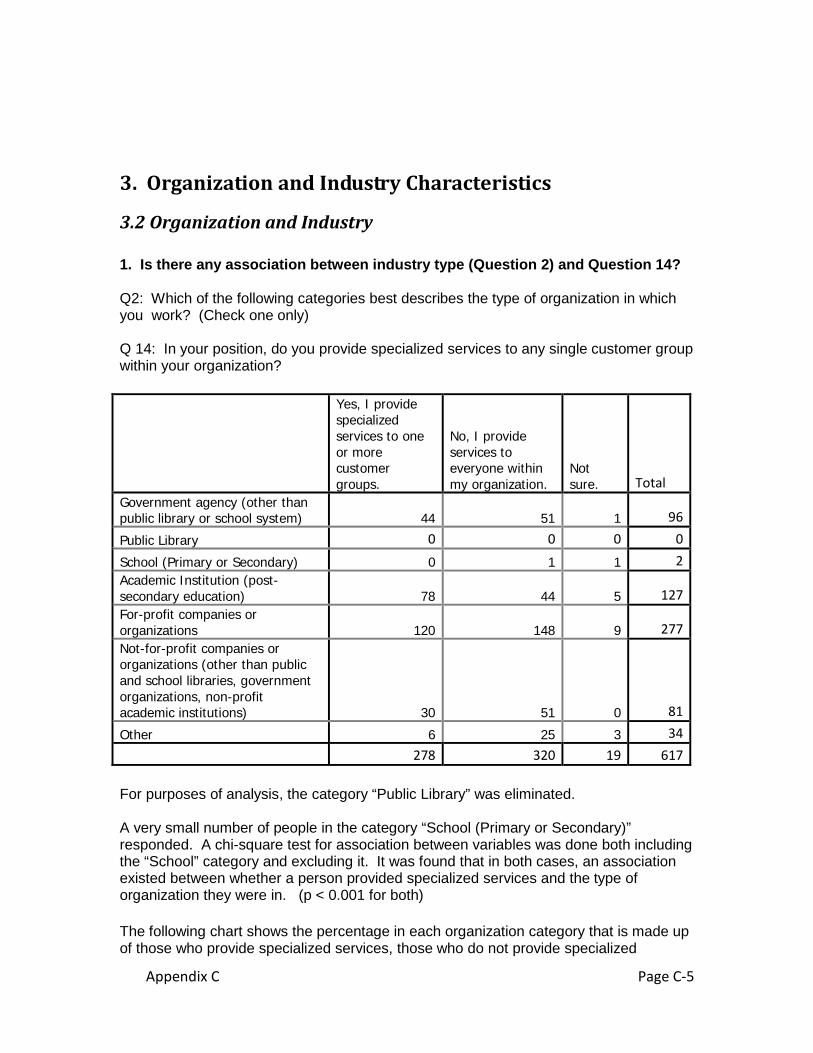
3.2 Organization and Industry 1. Is there any association between industry type (Question 2) and Question 14?
Q2: Which of the following categories best describes the type of organization in which you work? (Check one only) Q 14: In your position, do you provide specialized services to any single customer group within your organization?
Yes, I provide specialized services to one or more customer groups.
No, I provide services to everyone within my organization.
Not sure. Total
Government agency (other than public library or school system) 44 51 1 96
Public Library 0 0 0 0
School (Primary or Secondary) 0 1 1 2 Academic Institution (post-secondary education) 78 44 5 127 For-profit companies or organizations 120 148 9 277 Not-for-profit companies or organizations (other than public and school libraries, government organizations, non-profit academic institutions) 30 51 0 81
Other 6 25 3 34
278 320 19 617
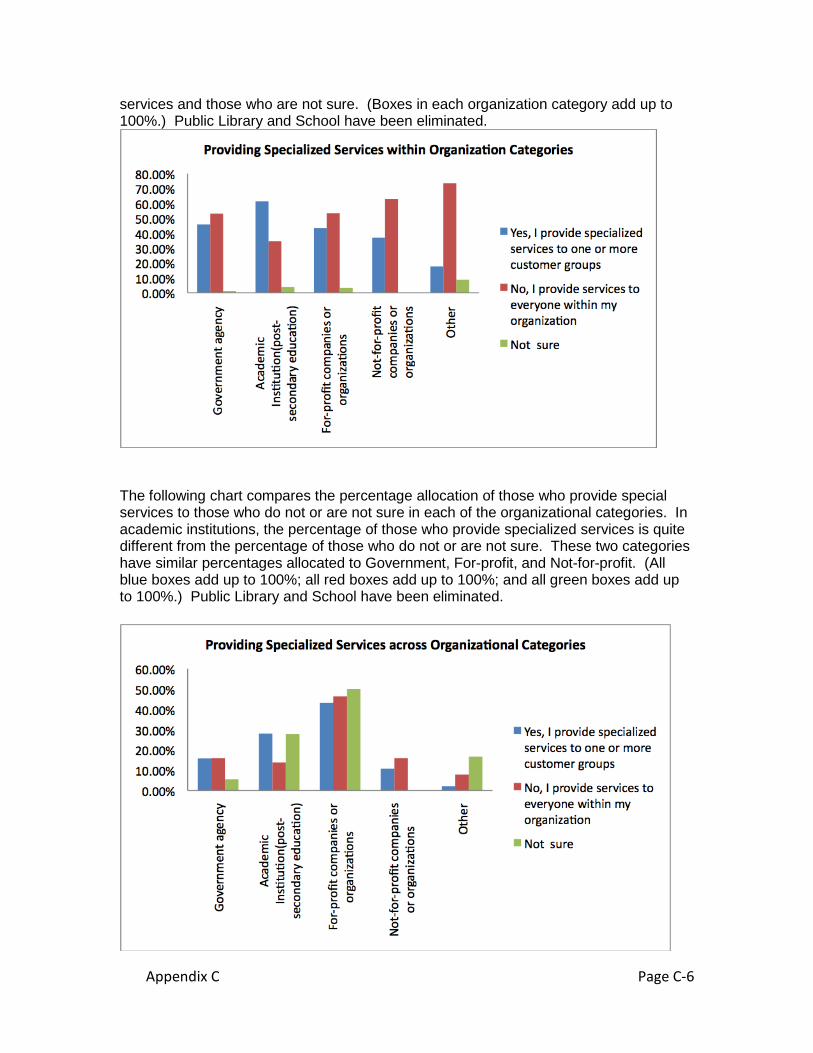
For purposes of analysis, the category “Public Library” was eliminated. A very small number of people in the category “School (Primary or Secondary)” responded. A chi-square test for association between variables was done both including the “School” category and excluding it. It was found that in both cases, an association existed between whether a person provided specialized services and the type of organization they were in. (p < 0.001 for both) The following chart shows the percentage in each organization category that is made up of those who provide specialized services, those who do not provide specialized
Appendix C Page C-6
services and those who are not sure. (Boxes in each organization category add up to 100%.) Public Library and School have been eliminated.
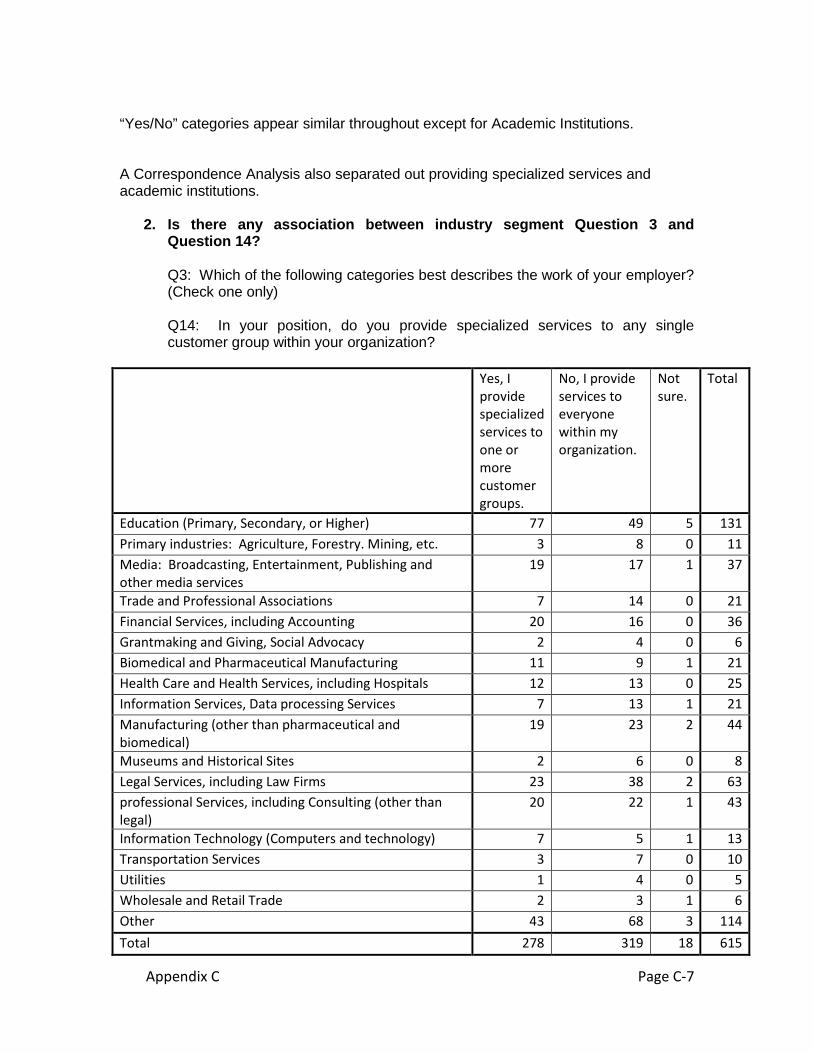
The following chart compares the percentage allocation of those who provide special services to those who do not or are not sure in each of the organizational categories. In academic institutions, the percentage of those who provide specialized services is quite different from the percentage of those who do not or are not sure. These two categories have similar percentages allocated to Government, For-profit, and Not-for-profit. (All blue boxes add up to 100%; all red boxes add up to 100%; and all green boxes add up to 100%.) Public Library and School have been eliminated.
Appendix C Page C-7
“Yes/No” categories appear similar throughout except for Academic Institutions. A Correspondence Analysis also separated out providing specialized services and academic institutions.
2. Is there any association between industry segment Question 3 and Question 14? Q3: Which of the following categories best describes the work of your employer? (Check one only) Q14: In your position, do you provide specialized services to any single customer group within your organization?
Yes, I provide specialized services to one or more customer groups.
No, I provide services to everyone within my organization.
Not sure.
Total
Education (Primary, Secondary, or Higher) 77 49 5 131 Primary industries: Agriculture, Forestry. Mining, etc. 3 8 0 11 Media: Broadcasting, Entertainment, Publishing and other media services
19 17 1 37
Trade and Professional Associations 7 14 0 21 Financial Services, including Accounting 20 16 0 36 Grantmaking and Giving, Social Advocacy 2 4 0 6 Biomedical and Pharmaceutical Manufacturing 11 9 1 21 Health Care and Health Services, including Hospitals 12 13 0 25 Information Services, Data processing Services 7 13 1 21 Manufacturing (other than pharmaceutical and biomedical)
19 23 2 44
Museums and Historical Sites 2 6 0 8 Legal Services, including Law Firms 23 38 2 63 professional Services, including Consulting (other than legal)
20 22 1 43
Information Technology (Computers and technology) 7 5 1 13 Transportation Services 3 7 0 10 Utilities 1 4 0 5 Wholesale and Retail Trade 2 3 1 6 Other 43 68 3 114
Total 278 319 18 615

Appendix C Page C-8
A chi-square analysis has determined that the variables are independent (p = 0.319). That is, the employers’ work does not influence whether a librarian described themselves as providing specialized services or not. Eliminating “Other” (Q3) from the employers’ work categories and “Not Sure” from the Specialized Service categories (Q14) still indicates that the variables are independent. (p = 0.096).
Appendix C Page C-9
3.3 Organization Size
3. Is there any association between industry size (Question 4) and Question 14?
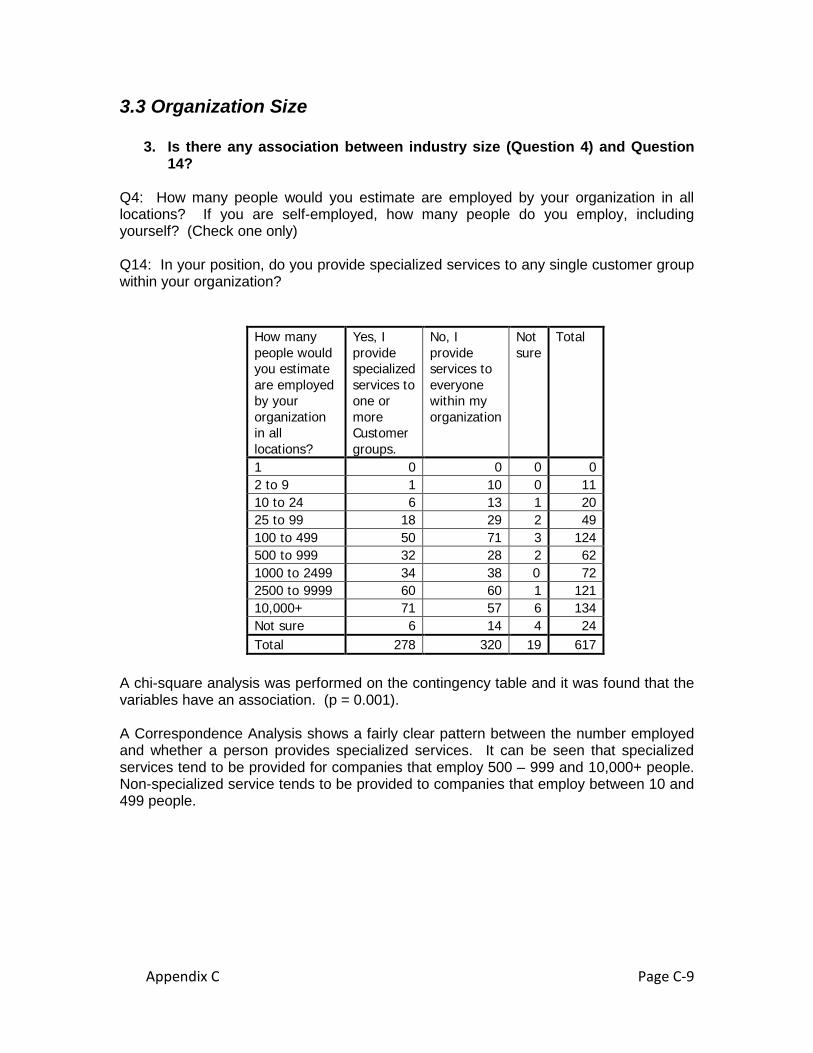
Q4: How many people would you estimate are employed by your organization in all locations? If you are self-employed, how many people do you employ, including yourself? (Check one only) Q14: In your position, do you provide specialized services to any single customer group within your organization?
How many people would you estimate are employed by your organization in all locations?
Yes, I provide specialized services to one or more Customer groups.
No, I provide services to everyone within my organization
Not sure
Total
1 0 0 0 0 2 to 9 1 10 0 11 10 to 24 6 13 1 20 25 to 99 18 29 2 49 100 to 499 50 71 3 124 500 to 999 32 28 2 62 1000 to 2499 34 38 0 72 2500 to 9999 60 60 1 121 10,000+ 71 57 6 134 Not sure 6 14 4 24 Total 278 320 19 617
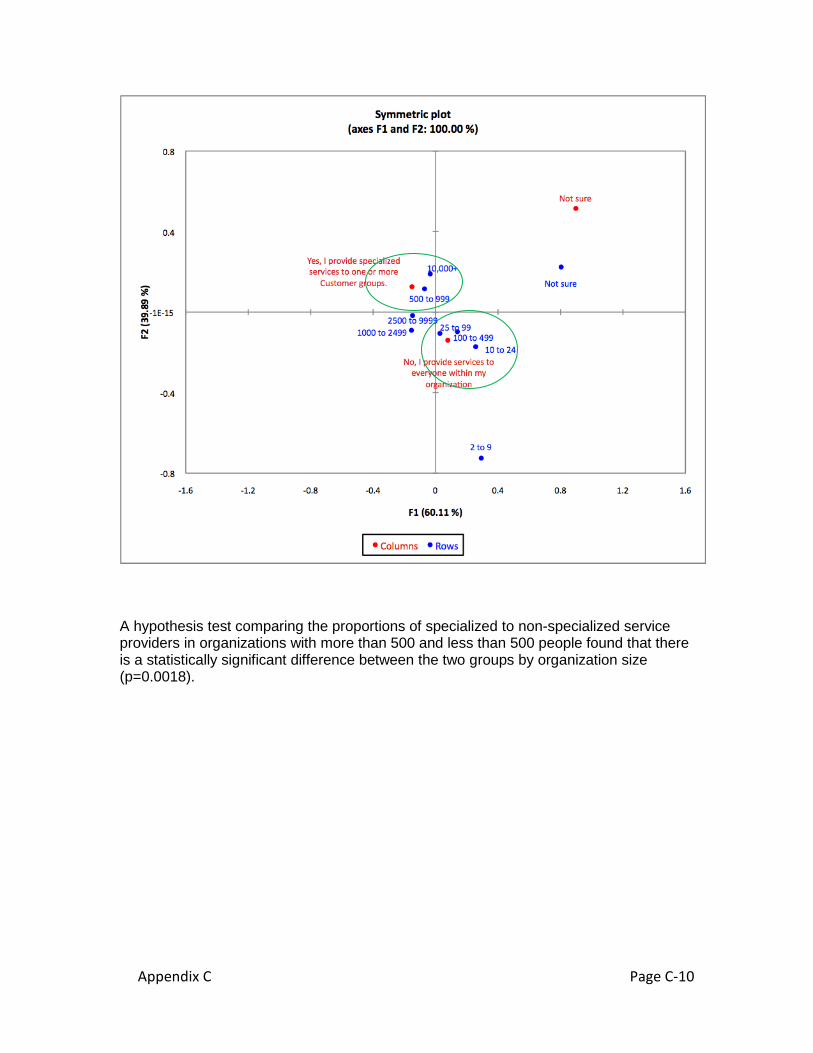
A chi-square analysis was performed on the contingency table and it was found that the variables have an association. (p = 0.001). A Correspondence Analysis shows a fairly clear pattern between the number employed and whether a person provides specialized services. It can be seen that specialized services tend to be provided for companies that employ 500 – 999 and 10,000+ people. Non-specialized service tends to be provided to companies that employ between 10 and 499 people.
Appendix C Page C-10
A hypothesis test comparing the proportions of specialized to non-specialized service providers in organizations with more than 500 and less than 500 people found that there is a statistically significant difference between the two groups by organization size (p=0.0018).
Appendix C Page C-11
3.4 Longevity and Growth of Embedded Programs Phase II analysis for the Embedded Librarianship Research Project attempts to determine relationships between the questions considered “Measures of Success” and the questions grouped into the categories “Education,” “Types of Services,” “Initiation Phase,” “Implementation,” and “Evaluation.” Correlation analyses were performed using the questions in “Measures of Success” against the questions in each of the other question groups. The following report contains the results of these analyses, listing the correlations that were statistically significant at the α = 0.05 level. Many of the question responses were recoded to make the direction of the correlation analyses more consistent. Questions of measurement were recoded so that measurement values, such as “very successful”, were recoded so that higher numbers represented more positive ratings. (Q37) Another example of recoding would be any question that asked the respondent to answer “Increased/Decreased/Stayed the same.” These were recoded so that “Increased” = 2, “Stayed the same” = 1, and “Decreased” = 0. Any “Yes” or “No” questions were recoded with “Yes” = 1 and “No” = 0. Every attempt was made to indicate when variables involved in the analysis had been recoded. After the correlation coefficients were determined, the average of the questions was used to help interpret the results. Correlations of all possible pairing of questions are available but only those with significance at the α = 0.05 level are presented in this report. The averages of all variables were computed in SAS. At the end of each section of analyses, graphs and tables from Correspondence Analyses performed in both the statistical package, SAS, and the open-source software package, R. Each of these packages offers a unique perspective on Correspondence Analysis; the analyses are richer for combining both results. In addition, since neither SAS nor R addresses statistical significance of Correspondence Analysis, significance was examined by using the method devised by Michael Greenacre in Correspondence Analysis in Practice, 2nd ed. It was found that none of the analyses would be considered significant under this method. However, general information about the relationships between questions can certainly be seen and will be useful. Correspondence Analysis attempts to identify those variables, or questions in this case, that behave in a similar manner. The analysis develops “profiles” for rows and columns and compares how closely each row and column matches these profiles. Profiles can be thought of as a list of the average responses to each of the questions involved in the analysis. The graphs presented show the “distance” each question’s responses and each participant’s responses are from these profiles. Those closest to the expected values hover around the axes; those that differ from most other responses are at a greater distance from the axes.
• Q3 with Q40
Appendix C Page C-12
A positive correlation existed between the length of time a person indicated they were in their current position and to their knowledge, the number of years in total that customized and specialized information services have been offered in their organization to individual customer groups. (r = 0.238, p = 0.0161) This indicates that the longer a person was in their current position, the longer they felt, in years total, customized and specialized information services had been offered to individual customer groups by their organization. The average for Q40 was 5.0, 7 to 9 years.
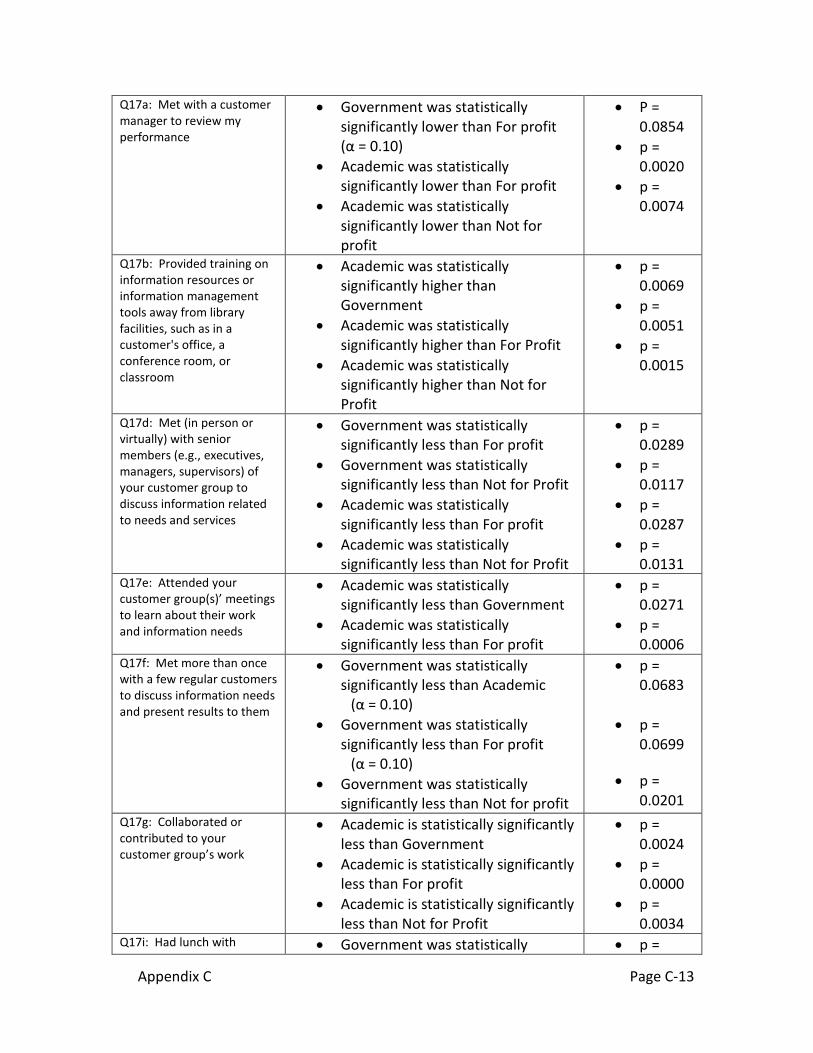
• Q8 with Q41 A positive correlation existed between the number of librarians or information professionals who provide the same services to the respondent’s customer group and the number of librarian or information professionals who provide specialized services in the respondent’s organization since January 2007. (r = 0.387, p < 0.0001) This indicates that the number of librarians or information professionals who provided services to the respondent’s group and the number in the entire organization who provide services tended to move in the same direction. Questions 8 and 41 were both recoded with “Decreased” = 0, “Stayed about the same” = 1, and “Increased” = 2. The average for Q8 was 1.08 and the average for Q41 was 0.963. This would indicate that most felt that both measures had stayed about the same. The fact that the average for Q41 dips below 1 would indicate that some respondents reported a decrease in the number providing services to their customer group as well as decreases in the number providing services in the organization since 2007. 3.6 Organizational Differences Q17 Which of the following activities have you done with your customer group(s) since January 2008? Two types of analyses were performed for each possible pairing of organizations and responses per question category: 1) a series of hypothesis tests and 2) a series of relative risk tests. The first analysis was a traditional hypothesis test comparing the response proportions of two different organizations for a particular activity in Q17. Each was a pooled hypothesis test on independent samples. Because the number of people who answered “Other” for organizational type was so small, this type of analysis could not be done on that category. Only those results that were significant at the α = 0.10 level or less were considered. The following table lists the results that were significant at the α = 0.05 level unless stated otherwise.
Appendix C Page C-13
Q17a: Met with a customer manager to review my performance
• Government was statistically significantly lower than For profit (α = 0.10)
• Academic was statistically significantly lower than For profit
• Academic was statistically significantly lower than Not for profit
• P = 0.0854
• p = 0.0020
• p = 0.0074
Q17b: Provided training on information resources or information management tools away from library facilities, such as in a customer's office, a conference room, or classroom
• Academic was statistically significantly higher than Government
• Academic was statistically significantly higher than For Profit
• Academic was statistically significantly higher than Not for Profit
• p = 0.0069
• p = 0.0051
• p = 0.0015
Q17d: Met (in person or virtually) with senior members (e.g., executives, managers, supervisors) of your customer group to discuss information related to needs and services
• Government was statistically significantly less than For profit
• Government was statistically significantly less than Not for Profit
• Academic was statistically significantly less than For profit
• Academic was statistically significantly less than Not for Profit
• p = 0.0289
• p = 0.0117
• p = 0.0287
• p = 0.0131
Q17e: Attended your customer group(s)’ meetings to learn about their work and information needs
• Academic was statistically significantly less than Government
• Academic was statistically significantly less than For profit
• p = 0.0271
• p = 0.0006
Q17f: Met more than once with a few regular customers to discuss information needs and present results to them
• Government was statistically significantly less than Academic
(α = 0.10) • Government was statistically
significantly less than For profit (α = 0.10)
• Government was statistically significantly less than Not for profit
• p = 0.0683
• p =
0.0699
• p = 0.0201
Q17g: Collaborated or contributed to your customer group’s work
• Academic is statistically significantly less than Government
• Academic is statistically significantly less than For profit
• Academic is statistically significantly less than Not for Profit
• p = 0.0024
• p = 0.0000
• p = 0.0034
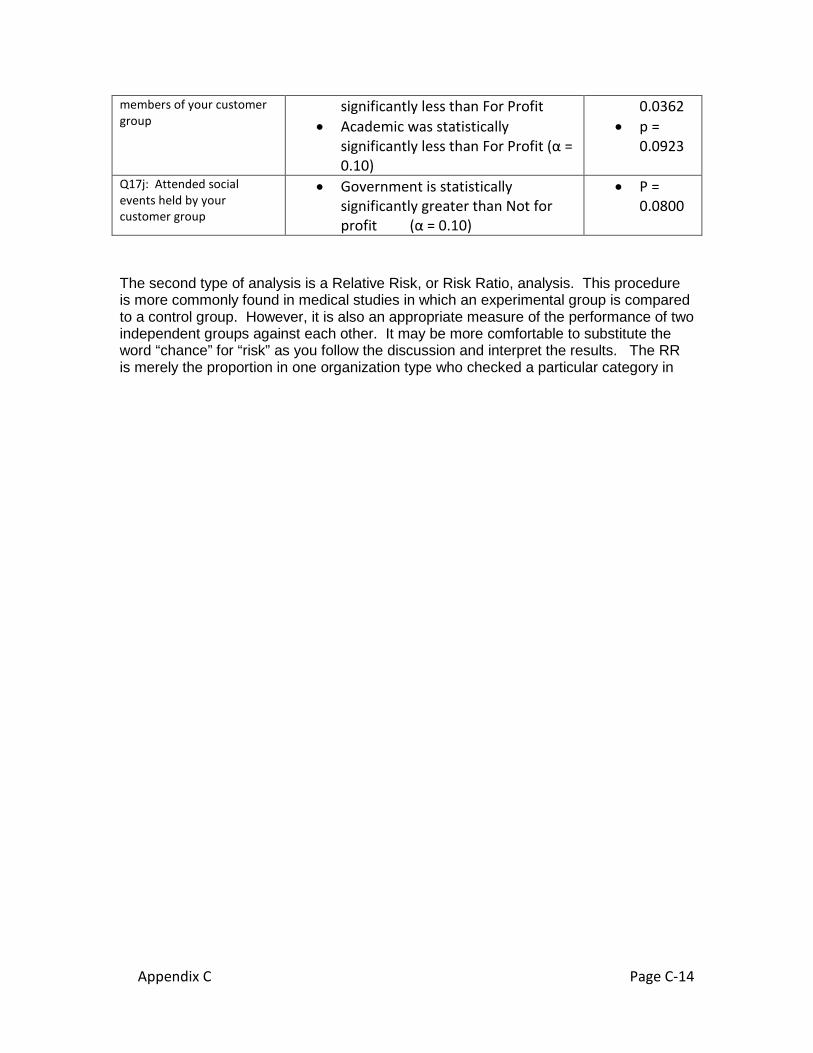
Q17i: Had lunch with • Government was statistically • p =
Appendix C Page C-14
members of your customer group
significantly less than For Profit • Academic was statistically
significantly less than For Profit (α = 0.10)
0.0362 • p =
0.0923
Q17j: Attended social events held by your customer group
• Government is statistically significantly greater than Not for profit (α = 0.10)
• P = 0.0800
The second type of analysis is a Relative Risk, or Risk Ratio, analysis. This procedure is more commonly found in medical studies in which an experimental group is compared to a control group. However, it is also an appropriate measure of the performance of two independent groups against each other. It may be more comfortable to substitute the word “chance” for “risk” as you follow the discussion and interpret the results. The RR is merely the proportion in one organization type who checked a particular category in
Appendix C Page C-15
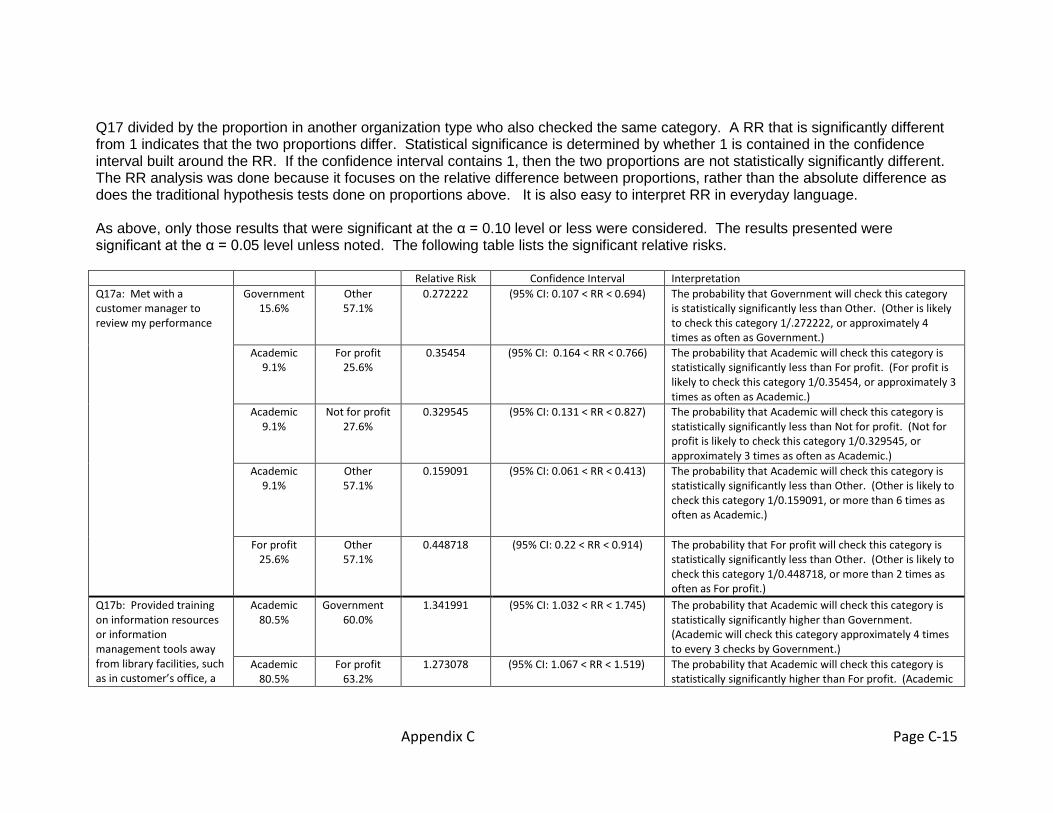
Q17 divided by the proportion in another organization type who also checked the same category. A RR that is significantly different from 1 indicates that the two proportions differ. Statistical significance is determined by whether 1 is contained in the confidence interval built around the RR. If the confidence interval contains 1, then the two proportions are not statistically significantly different. The RR analysis was done because it focuses on the relative difference between proportions, rather than the absolute difference as does the traditional hypothesis tests done on proportions above. It is also easy to interpret RR in everyday language. As above, only those results that were significant at the α = 0.10 level or less were considered. The results presented were significant at the α = 0.05 level unless noted. The following table lists the significant relative risks. Relative Risk Confidence Interval Interpretation Q17a: Met with a customer manager to review my performance
Government 15.6%
Other 57.1%
0.272222 (95% CI: 0.107 < RR < 0.694)
The probability that Government will check this category is statistically significantly less than Other. (Other is likely to check this category 1/.272222, or approximately 4 times as often as Government.)
Academic 9.1%
For profit 25.6%
0.35454 (95% CI: 0.164 < RR < 0.766) The probability that Academic will check this category is statistically significantly less than For profit. (For profit is likely to check this category 1/0.35454, or approximately 3 times as often as Academic.)
Academic 9.1%
Not for profit 27.6%
0.329545 (95% CI: 0.131 < RR < 0.827) The probability that Academic will check this category is statistically significantly less than Not for profit. (Not for profit is likely to check this category 1/0.329545, or approximately 3 times as often as Academic.)
Academic 9.1%
Other 57.1%
0.159091 (95% CI: 0.061 < RR < 0.413) The probability that Academic will check this category is statistically significantly less than Other. (Other is likely to check this category 1/0.159091, or more than 6 times as often as Academic.)
For profit 25.6%
Other 57.1%
0.448718 (95% CI: 0.22 < RR < 0.914) The probability that For profit will check this category is statistically significantly less than Other. (Other is likely to check this category 1/0.448718, or more than 2 times as often as For profit.)
Q17b: Provided training on information resources or information management tools away from library facilities, such as in customer’s office, a
Academic 80.5%
Government 60.0%
1.341991 (95% CI: 1.032 < RR < 1.745)
The probability that Academic will check this category is statistically significantly higher than Government. (Academic will check this category approximately 4 times to every 3 checks by Government.)
Academic 80.5%
For profit 63.2%
1.273078 (95% CI: 1.067 < RR < 1.519) The probability that Academic will check this category is statistically significantly higher than For profit. (Academic
Appendix C Page C-16
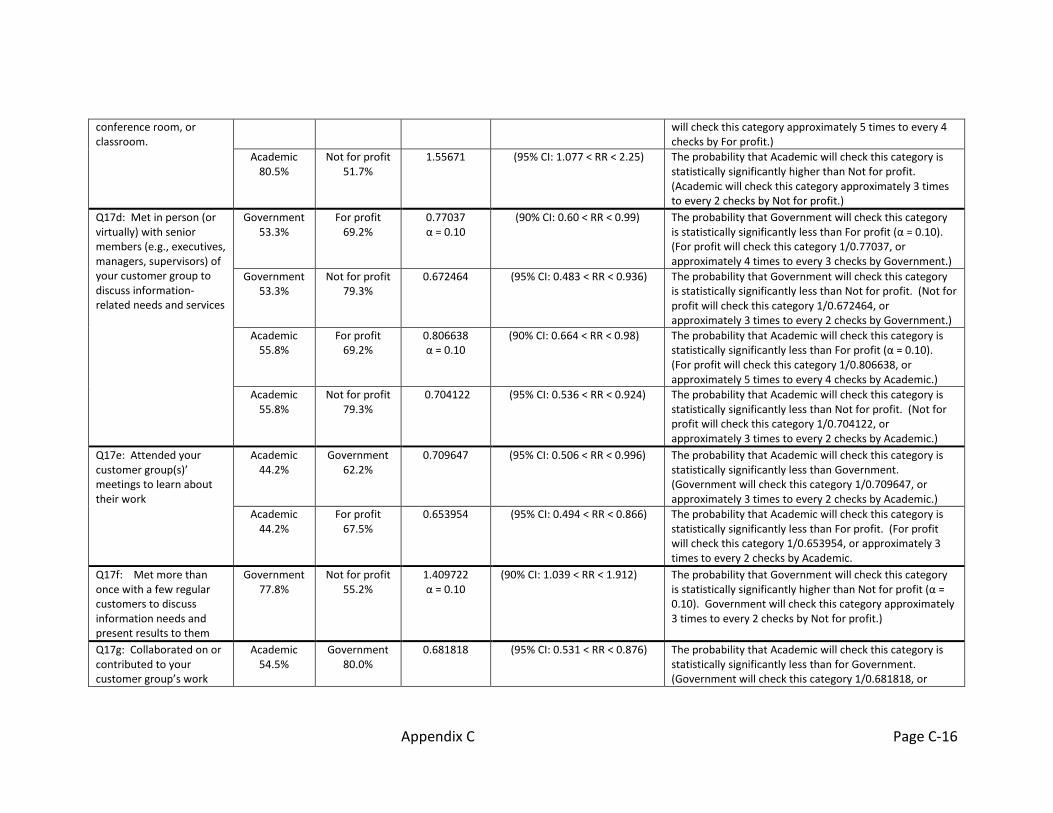
conference room, or classroom.
will check this category approximately 5 times to every 4 checks by For profit.)
Academic 80.5%
Not for profit 51.7%
1.55671 (95% CI: 1.077 < RR < 2.25) The probability that Academic will check this category is statistically significantly higher than Not for profit. (Academic will check this category approximately 3 times to every 2 checks by Not for profit.)
Q17d: Met in person (or virtually) with senior members (e.g., executives, managers, supervisors) of your customer group to discuss information-related needs and services
Government 53.3%
For profit 69.2%
0.77037 α = 0.10
(90% CI: 0.60 < RR < 0.99)
The probability that Government will check this category is statistically significantly less than For profit (α = 0.10). (For profit will check this category 1/0.77037, or approximately 4 times to every 3 checks by Government.)
Government 53.3%
Not for profit 79.3%
0.672464 (95% CI: 0.483 < RR < 0.936) The probability that Government will check this category is statistically significantly less than Not for profit. (Not for profit will check this category 1/0.672464, or approximately 3 times to every 2 checks by Government.)
Academic 55.8%
For profit 69.2%
0.806638 α = 0.10
(90% CI: 0.664 < RR < 0.98)
The probability that Academic will check this category is statistically significantly less than For profit (α = 0.10). (For profit will check this category 1/0.806638, or approximately 5 times to every 4 checks by Academic.)
Academic 55.8%
Not for profit 79.3%
0.704122 (95% CI: 0.536 < RR < 0.924)
The probability that Academic will check this category is statistically significantly less than Not for profit. (Not for profit will check this category 1/0.704122, or approximately 3 times to every 2 checks by Academic.)
Q17e: Attended your customer group(s)’ meetings to learn about their work
Academic 44.2%
Government 62.2%
0.709647 (95% CI: 0.506 < RR < 0.996)
The probability that Academic will check this category is statistically significantly less than Government. (Government will check this category 1/0.709647, or approximately 3 times to every 2 checks by Academic.)
Academic 44.2%
For profit 67.5%
0.653954 (95% CI: 0.494 < RR < 0.866) The probability that Academic will check this category is statistically significantly less than For profit. (For profit will check this category 1/0.653954, or approximately 3 times to every 2 checks by Academic.
Q17f: Met more than once with a few regular customers to discuss information needs and present results to them
Government 77.8%
Not for profit 55.2%
1.409722 α = 0.10
(90% CI: 1.039 < RR < 1.912)
The probability that Government will check this category is statistically significantly higher than Not for profit (α = 0.10). Government will check this category approximately 3 times to every 2 checks by Not for profit.)
Q17g: Collaborated on or contributed to your customer group’s work
Academic 54.5%
Government 80.0%
0.681818 (95% CI: 0.531 < RR < 0.876) The probability that Academic will check this category is statistically significantly less than for Government. (Government will check this category 1/0.681818, or
Appendix C Page C-17
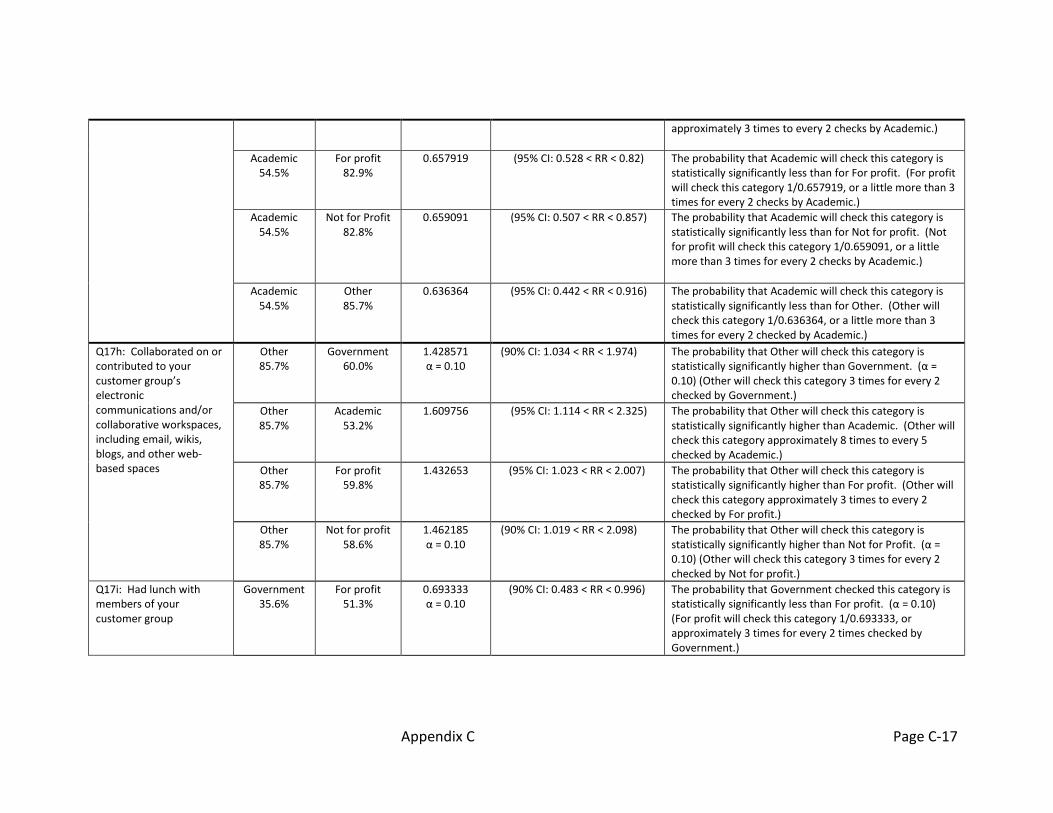
approximately 3 times to every 2 checks by Academic.)
Academic 54.5%
For profit 82.9%
0.657919 (95% CI: 0.528 < RR < 0.82) The probability that Academic will check this category is statistically significantly less than for For profit. (For profit will check this category 1/0.657919, or a little more than 3 times for every 2 checks by Academic.)
Academic 54.5%
Not for Profit 82.8%
0.659091 (95% CI: 0.507 < RR < 0.857) The probability that Academic will check this category is statistically significantly less than for Not for profit. (Not for profit will check this category 1/0.659091, or a little more than 3 times for every 2 checks by Academic.)
Academic 54.5%
Other 85.7%
0.636364 (95% CI: 0.442 < RR < 0.916) The probability that Academic will check this category is statistically significantly less than for Other. (Other will check this category 1/0.636364, or a little more than 3 times for every 2 checked by Academic.)
Q17h: Collaborated on or contributed to your customer group’s electronic communications and/or collaborative workspaces, including email, wikis, blogs, and other web-based spaces
Other 85.7%
Government 60.0%
1.428571 α = 0.10
(90% CI: 1.034 < RR < 1.974)
The probability that Other will check this category is statistically significantly higher than Government. (α = 0.10) (Other will check this category 3 times for every 2 checked by Government.)
Other 85.7%
Academic 53.2%
1.609756 (95% CI: 1.114 < RR < 2.325) The probability that Other will check this category is statistically significantly higher than Academic. (Other will check this category approximately 8 times to every 5 checked by Academic.)
Other 85.7%
For profit 59.8%
1.432653 (95% CI: 1.023 < RR < 2.007)
The probability that Other will check this category is statistically significantly higher than For profit. (Other will check this category approximately 3 times to every 2 checked by For profit.)
Other 85.7%
Not for profit 58.6%
1.462185 α = 0.10
(90% CI: 1.019 < RR < 2.098)
The probability that Other will check this category is statistically significantly higher than Not for Profit. (α = 0.10) (Other will check this category 3 times for every 2 checked by Not for profit.)
Q17i: Had lunch with members of your customer group
Government 35.6%
For profit 51.3%
0.693333 α = 0.10
(90% CI: 0.483 < RR < 0.996)
The probability that Government checked this category is statistically significantly less than For profit. (α = 0.10) (For profit will check this category 1/0.693333, or approximately 3 times for every 2 times checked by Government.)
Appendix C Page C-18
Interpretations of the relative risks are given in the table above. In addition to the interpretations listed in the table, relative risk can be explained in terms of risk (“chance”) reduction, which is 1 – RR, when RR < 1, or RR – 1, when RR > 1. In the first row of the table, the RR of Government compared to Other in Q17a is 0.27222. By risk reduction, Government is 1 – 0.27222, or 72.8% less likely to check Q17a than Other. If RR is greater than 1, as in Q17b, it can be said that Academic is likely to check this category 1.341991 – 1, or 34.2% more times than Government.
Appendix C Page C-19
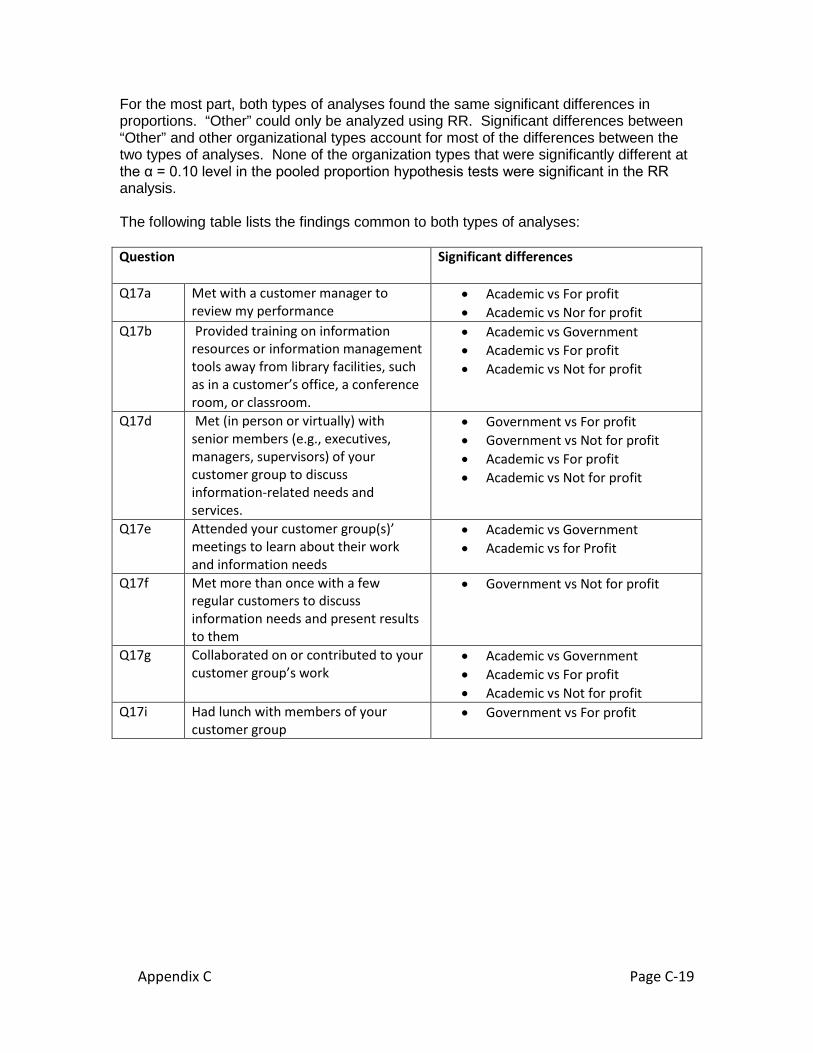
For the most part, both types of analyses found the same significant differences in proportions. “Other” could only be analyzed using RR. Significant differences between “Other” and other organizational types account for most of the differences between the two types of analyses. None of the organization types that were significantly different at the α = 0.10 level in the pooled proportion hypothesis tests were significant in the RR analysis. The following table lists the findings common to both types of analyses: Question Significant differences
Q17a Met with a customer manager to
review my performance • Academic vs For profit • Academic vs Nor for profit
Q17b Provided training on information resources or information management tools away from library facilities, such as in a customer’s office, a conference room, or classroom.
• Academic vs Government • Academic vs For profit • Academic vs Not for profit
Q17d Met (in person or virtually) with senior members (e.g., executives, managers, supervisors) of your customer group to discuss information-related needs and services.
• Government vs For profit • Government vs Not for profit • Academic vs For profit • Academic vs Not for profit
Q17e Attended your customer group(s)’ meetings to learn about their work and information needs
• Academic vs Government • Academic vs for Profit
Q17f Met more than once with a few regular customers to discuss information needs and present results to them
• Government vs Not for profit
Q17g Collaborated on or contributed to your customer group’s work
• Academic vs Government • Academic vs For profit • Academic vs Not for profit
Q17i Had lunch with members of your customer group
• Government vs For profit
Appendix C Page C-20
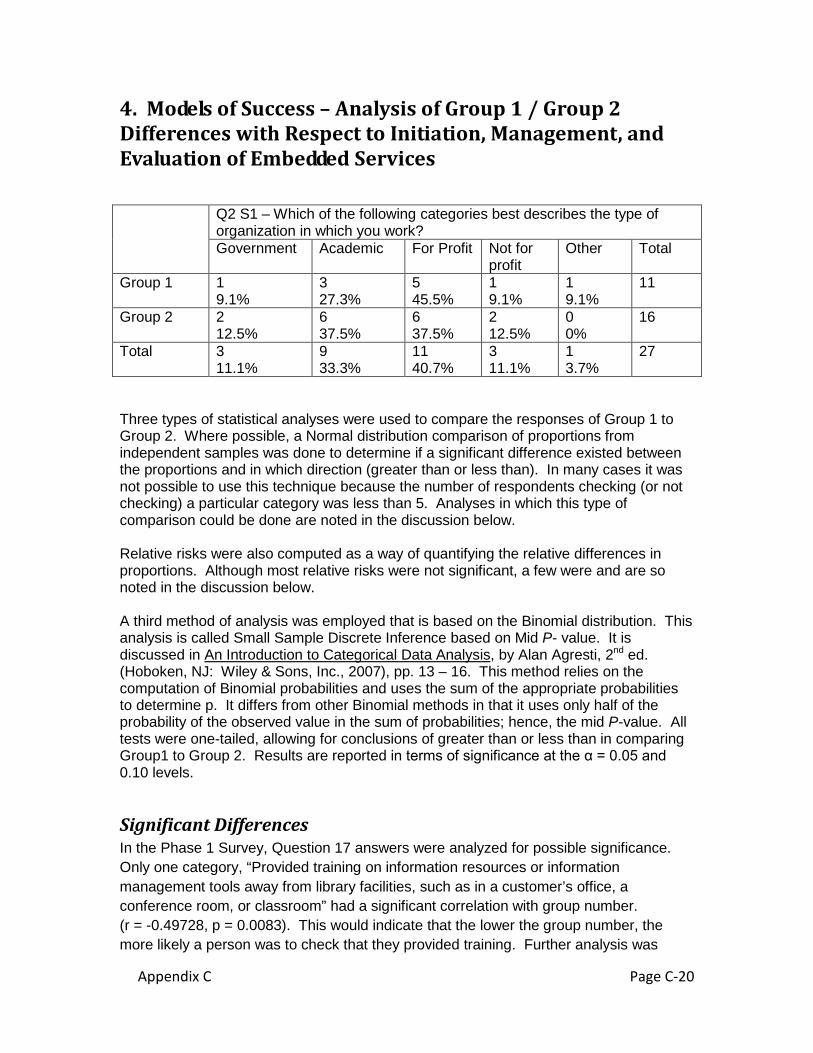
4. Models of Success – Analysis of Group 1 / Group 2 Differences with Respect to Initiation, Management, and Evaluation of Embedded Services
Three types of statistical analyses were used to compare the responses of Group 1 to Group 2. Where possible, a Normal distribution comparison of proportions from independent samples was done to determine if a significant difference existed between the proportions and in which direction (greater than or less than). In many cases it was not possible to use this technique because the number of respondents checking (or not checking) a particular category was less than 5. Analyses in which this type of comparison could be done are noted in the discussion below. Relative risks were also computed as a way of quantifying the relative differences in proportions. Although most relative risks were not significant, a few were and are so noted in the discussion below. A third method of analysis was employed that is based on the Binomial distribution. This analysis is called Small Sample Discrete Inference based on Mid P- value. It is discussed in An Introduction to Categorical Data Analysis, by Alan Agresti, 2nd ed. (Hoboken, NJ: Wiley & Sons, Inc., 2007), pp. 13 – 16. This method relies on the computation of Binomial probabilities and uses the sum of the appropriate probabilities to determine p. It differs from other Binomial methods in that it uses only half of the probability of the observed value in the sum of probabilities; hence, the mid P-value. All tests were one-tailed, allowing for conclusions of greater than or less than in comparing Group1 to Group 2. Results are reported in terms of significance at the α = 0.05 and 0.10 levels.
Significant Differences In the Phase 1 Survey, Question 17 answers were analyzed for possible significance. Only one category, “Provided training on information resources or information management tools away from library facilities, such as in a customer’s office, a conference room, or classroom” had a significant correlation with group number. (r = -0.49728, p = 0.0083). This would indicate that the lower the group number, the more likely a person was to check that they provided training. Further analysis was
Q2 S1 – Which of the following categories best describes the type of organization in which you work? Government Academic For Profit Not for
profit Other Total
Group 1 1 9.1%
3 27.3%
5 45.5%
1 9.1%
1 9.1%
11
Group 2 2 12.5%
6 37.5%
6 37.5%
2 12.5%
0 0%
16
Total 3 11.1%
9 33.3%
11 40.7%
3 11.1%
1 3.7%
27
Appendix C Page C-21
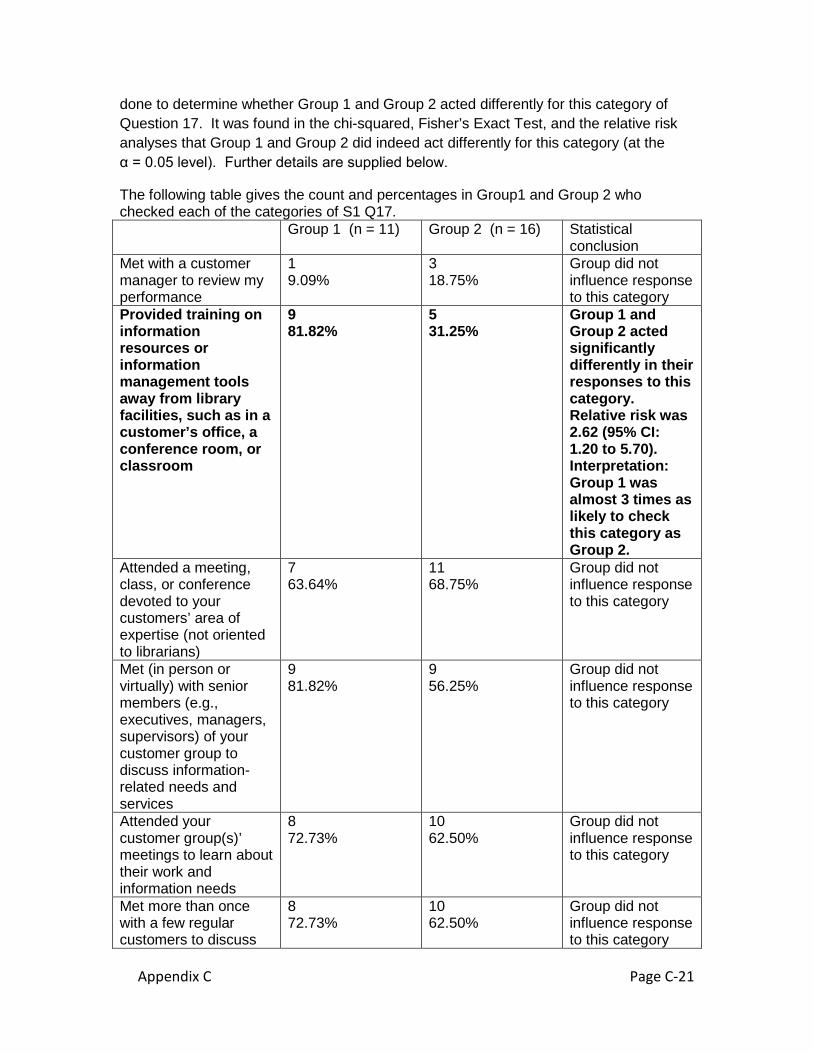
done to determine whether Group 1 and Group 2 acted differently for this category of Question 17. It was found in the chi-squared, Fisher’s Exact Test, and the relative risk analyses that Group 1 and Group 2 did indeed act differently for this category (at the α = 0.05 level). Further details are supplied below.
The following table gives the count and percentages in Group1 and Group 2 who checked each of the categories of S1 Q17. Group 1 (n = 11) Group 2 (n = 16) Statistical
conclusion Met with a customer manager to review my performance
1 9.09%
3 18.75%
Group did not influence response to this category
Provided training on information resources or information management tools away from library facilities, such as in a customer’s office, a conference room, or classroom
9 81.82%
5 31.25%
Group 1 and Group 2 acted significantly differently in their responses to this category. Relative risk was 2.62 (95% CI: 1.20 to 5.70). Interpretation: Group 1 was almost 3 times as likely to check this category as Group 2.
Attended a meeting, class, or conference devoted to your customers’ area of expertise (not oriented to librarians)
7 63.64%
11 68.75%
Group did not influence response to this category
Met (in person or virtually) with senior members (e.g., executives, managers, supervisors) of your customer group to discuss information-related needs and services
9 81.82%
9 56.25%
Group did not influence response to this category
Attended your customer group(s)’ meetings to learn about their work and information needs
8 72.73%
10 62.50%
Group did not influence response to this category
Met more than once with a few regular customers to discuss
8 72.73%
10 62.50%
Group did not influence response to this category
Appendix C Page C-22
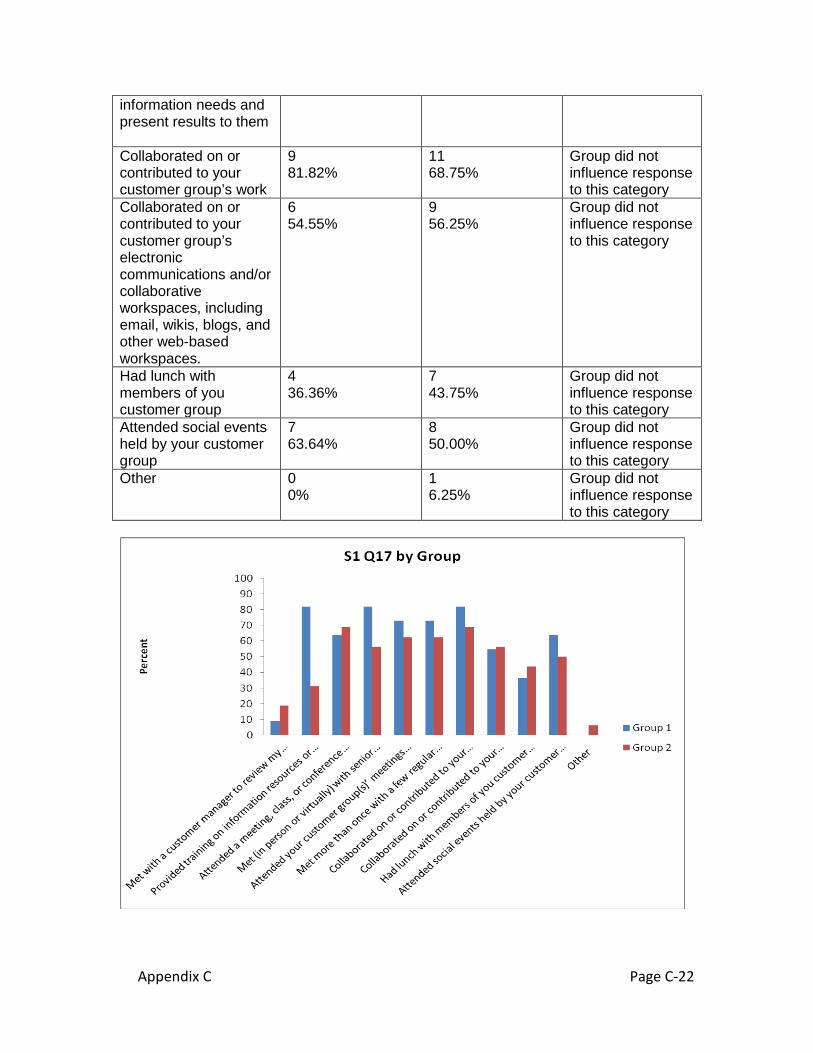
information needs and present results to them Collaborated on or contributed to your customer group’s work
9 81.82%
11 68.75%
Group did not influence response to this category
Collaborated on or contributed to your customer group’s electronic communications and/or collaborative workspaces, including email, wikis, blogs, and other web-based workspaces.
6 54.55%
9 56.25%
Group did not influence response to this category
Had lunch with members of you customer group
4 36.36%
7 43.75%
Group did not influence response to this category
Attended social events held by your customer group
7 63.64%
8 50.00%
Group did not influence response to this category
Other 0 0%
1 6.25%
Group did not influence response to this category
Appendix C Page C-23
In the Phase 2 Survey, questions 13 through 20 and 24 through 36 were analyzed. The following are the statistically significant differences found between Group 1 and Group 2.
Q15: In your current position, are you required to participate in continuing education of any kind to acquire or update knowledge in a related subject area? (Yes answers)
Small Sample Discrete Inference based on Mid P- value: Group 1 is statistically significantly higher than Group 2 at the α = 0.05 level. (p = 0.0456).
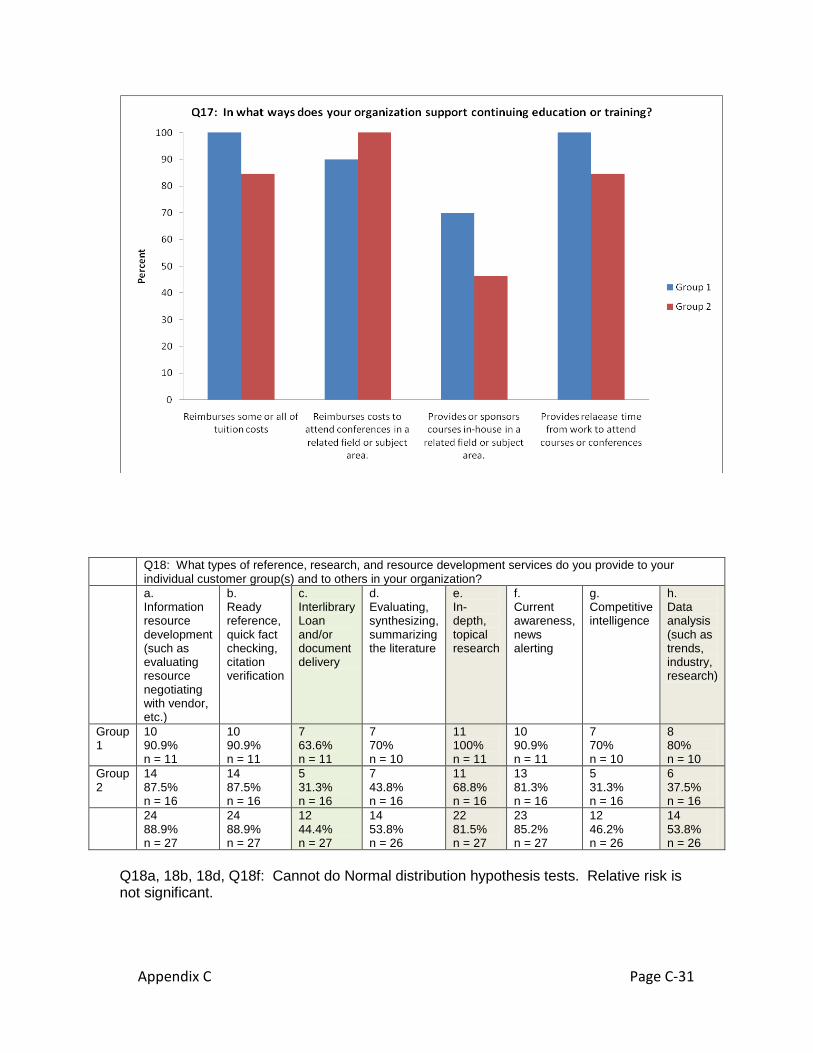
Q17: in what ways does your organization support continuing education or training?
a) Reimburses some or all tuition costs: Small Sample Discrete Inference based on Mid P- value: Group 1 is statistically significantly higher than Group 2 at the α = 0.10 level. (p = 0.094).
c) Provides or sponsors courses in-house in a related field or subject area: Small Sample Discrete Inference based on Mid P- value: Group 1 is statistically significantly higher than Group 2 at the α = 0.10 level. (p = 0.075).
d) Provides release time from work to attend courses or conferences: Small Sample Discrete Inference based on Mid P- value: Group 1 is statistically significantly higher than Group 2 at the α = 0.10 level. (p = 0.094).
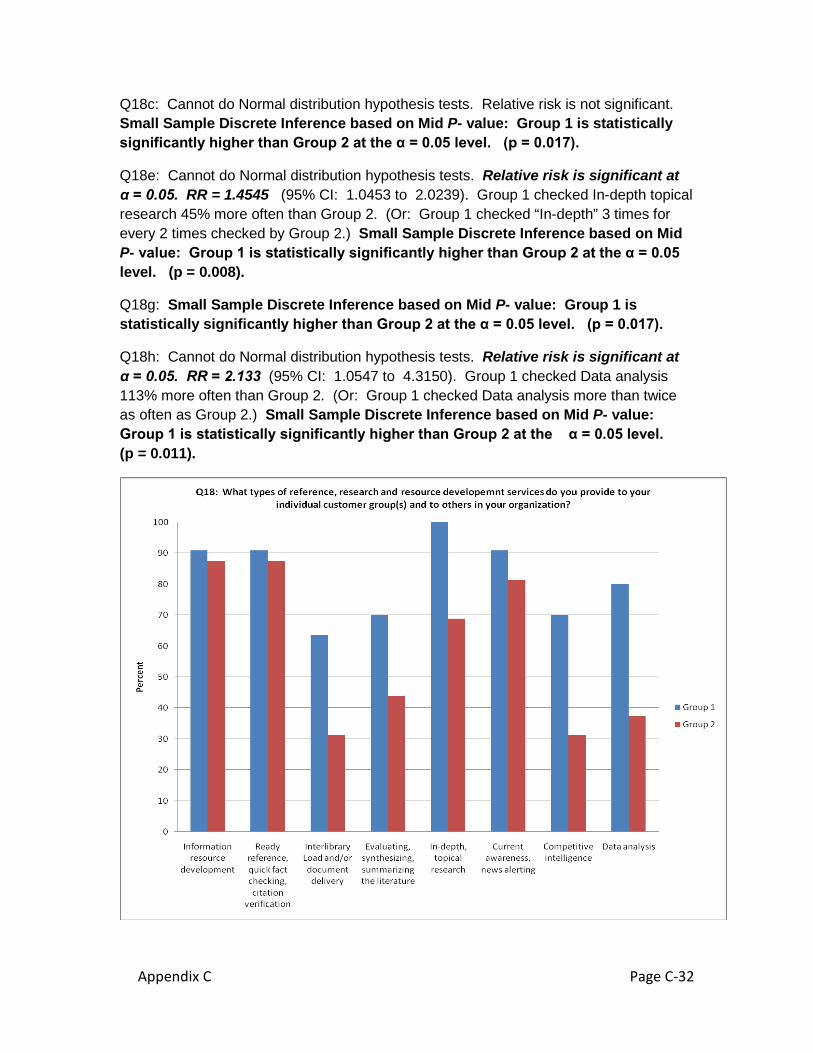
Q18: What types of reference, research, and resource development services do you provide to your individual customer group(s) and to others in your organization?
c) Interlibrary Loan and/or document delivery: Small Sample Discrete Inference based on Mid P- value: Group 1 is statistically significantly higher than Group 2 at the α = 0.05 level. (p = 0.017).
e) In-depth, topical research: Relative risk is significant at α = 0.05. RR = 1.4545 (95% CI: 1.0453 to 2.0239). Group 1 checked In-depth topical research 45% more often than Group 2. (Or: Group 1 checked “In-depth” 3 times for every 2 times checked by Group 2.) Small Sample Discrete Inference based on Mid P- value: Group 1 is statistically significantly higher than Group 2 at the α = 0.05 level. (p = 0.008).
g) Competitive Intelligence: Small Sample Discrete Inference based on Mid P- value: Group 1 is statistically significantly higher than Group 2 at the α = 0.05 level. (p = 0.017).
h) Data analysis (such as trends, industry, research: Relative risk is significant at α = 0.05. RR = 2.133 (95% CI: 1.0547 to 4.3150). Group 1 checked Data analysis 113% more often than Group 2. (Or: Group 1 checked Data analysis more than twice as often as Group 2. Small Sample Discrete Inference based on Mid P- value: Group 1 is statistically significantly higher than Group 2 at the α = 0.05 level. (p = 0.011).
Appendix C Page C-24
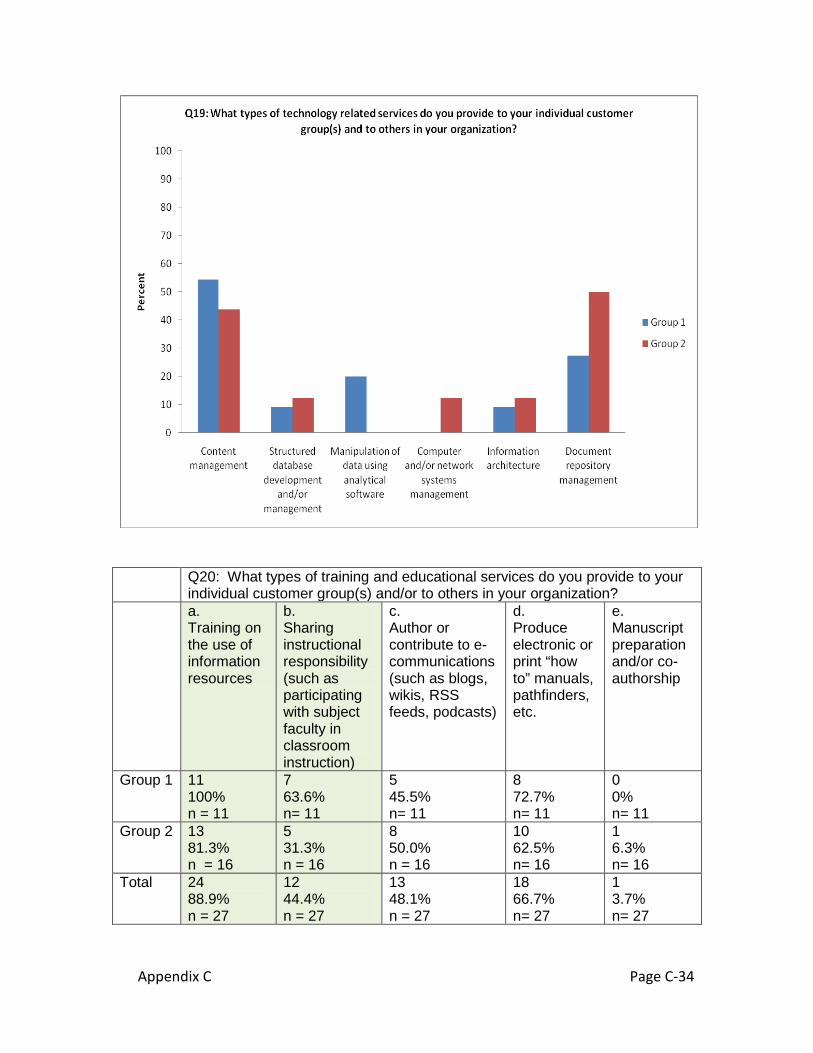
Q19: What type of technology related services do you provide to your individual customer group(s) and to others in your organization? f) Document repository management: Small Sample Discrete Inference based on Mid P- value: Group 1 is statistically significantly lower than Group 2 at the α = 0.10 level. (p = 0.073).
Q20: What types of training and educational services do you provide to your individual customer group(s) and/or to others in your organization? a) Training on the use of information resources: Small Sample Discrete Inference based on Mid P- value: Group 1 is statistically significantly higher than Group 2 at the α = 0.10 level. (p = 0.051). b) Sharing instructional responsibility (such as participating with subject faculty in classroom instruction): Small Sample Discrete Inference based on Mid P- value: Group 1 is statistically significantly higher than Group 2 at the α = 0.05 level. (p = 0.017).
Q24: To your knowledge, who made the first move to initiate specialized services to customer groups in your organization? b) Library/Information Services Group made the first move: Small Sample Discrete Inference based on Mid P- value: Group 1 is statistically significantly higher than Group 2 at the α = 0.10 level. (p = 0.073).
Q25: To your knowledge, was authorization from any level of management in your organization required prior to the initiation of specialized services to customer groups? Small Sample Discrete Inference based on Mid P- value: Group 1 is statistically significantly lower than Group 2 at the α = 0.05 level. (p = 0.007).
Q26: To your knowledge, who in your organization authorized the initiation of specialized services?
b) Authorization required from library/information group director/manager: Small Sample Discrete Inference based on Mid P- value: Group 1 is statistically significantly higher than Group 2 at the α = 0.05 level. (p = 0.039).
Q29: At the time you first began providing specialized services to a customer group, how were you integrated into that customer group?
a) a liaison, mentor, contact, etc., from the customer group was designated to facilitate integration: Small Sample Discrete Inference based on Mid P- value: Group 1 is statistically significantly higher than Group 2 at the α = 0.10 level. (p = 0.088).
b) A manager/leader of the customer group facilitated the integration of the service provider into the group: Small Sample Discrete Inference based on Mid P- value:
Appendix C Page C-25
Group 1 is statistically significantly higher than Group 2 at the α = 0.05 level. (p = 0.016).
f) Other method of facilitating integration: Small Sample Discrete Inference based on Mid P- value: Group 1 is statistically significantly higher than Group 2 at the α = 0.10 level. (p = 0.089).
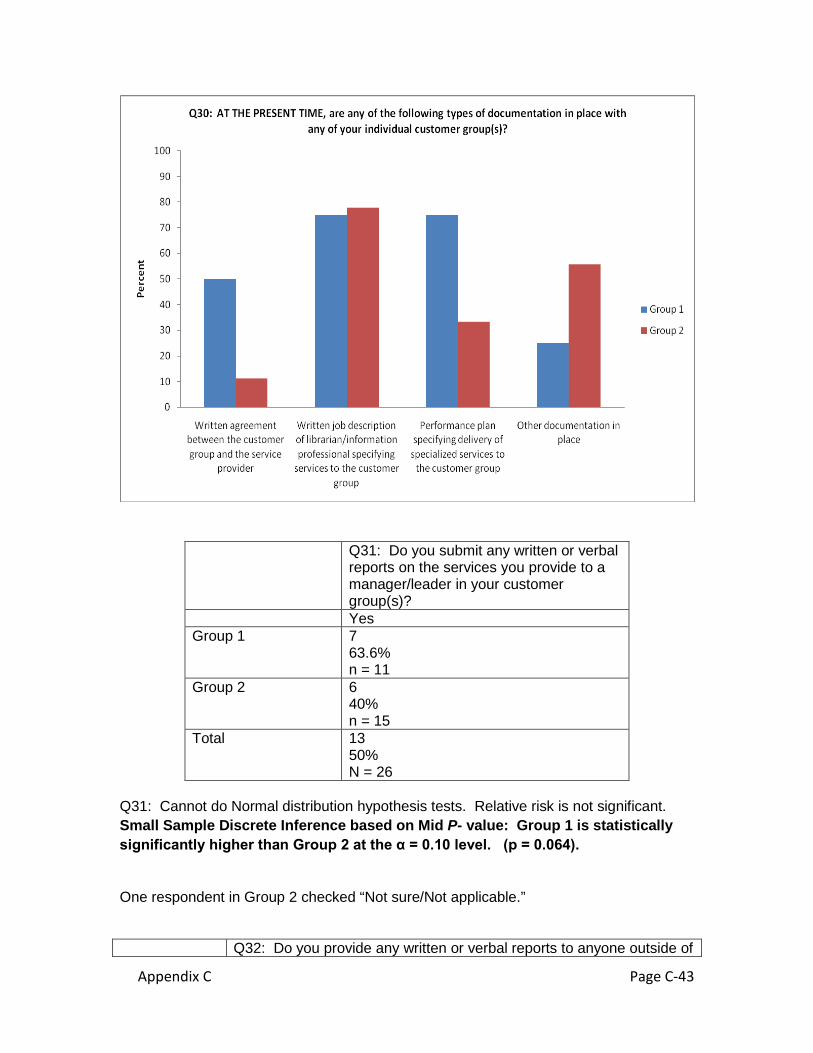
Q30: AT THE PRESENT TIME, are any of the following types of documentation in place with any of your individual customer group(s)?
a) Written agreement between the customer group and the service provider. Small Sample Discrete Inference based on Mid P- value: Group 1 is statistically significantly higher than Group 2 at the α = 0.05 level. (p = 0.034).
c) Performance plan specifying delivery of specialized services to the customer group. Small Sample Discrete Inference based on Mid P- value: Group 1 is statistically significantly higher than Group 2 at the α = 0.10 level. (p = 0.062).
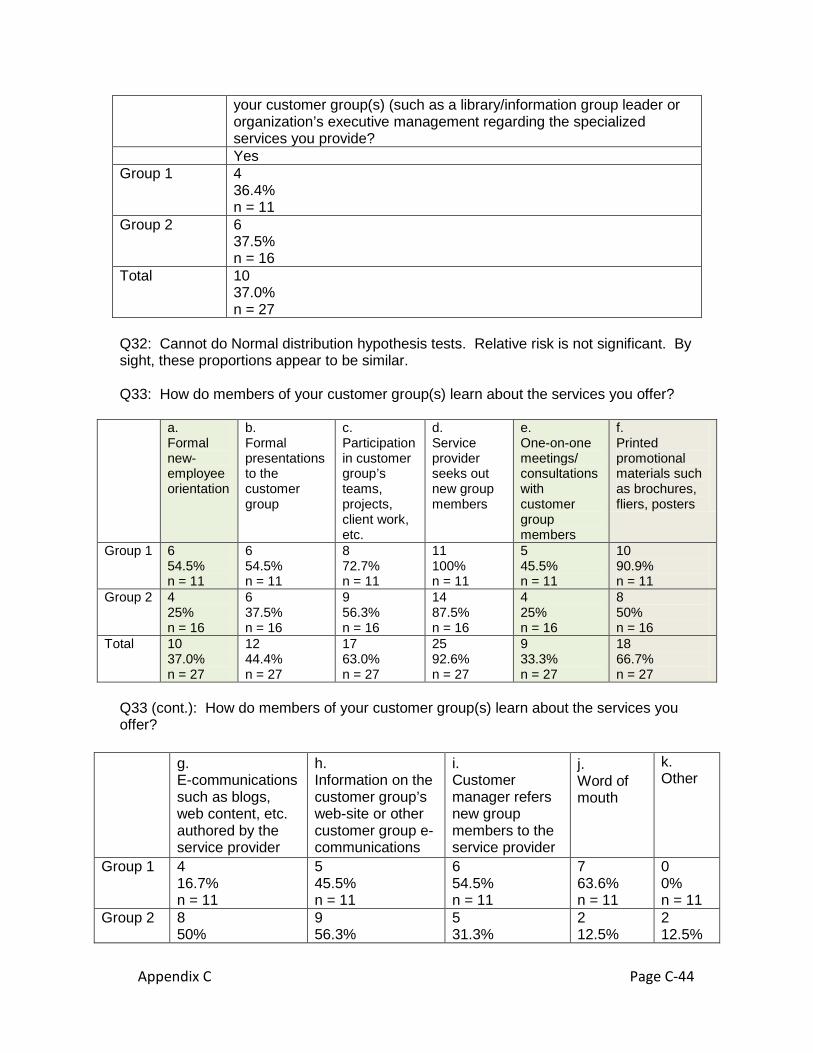
Q31: Do you submit any written or verbal reports on the services you provide to a manager/leader in your customer group(s)?
Small Sample Discrete Inference based on Mid P- value: Group 1 is statistically significantly higher than Group 2 at the α = 0.10 level. (p = 0.064).
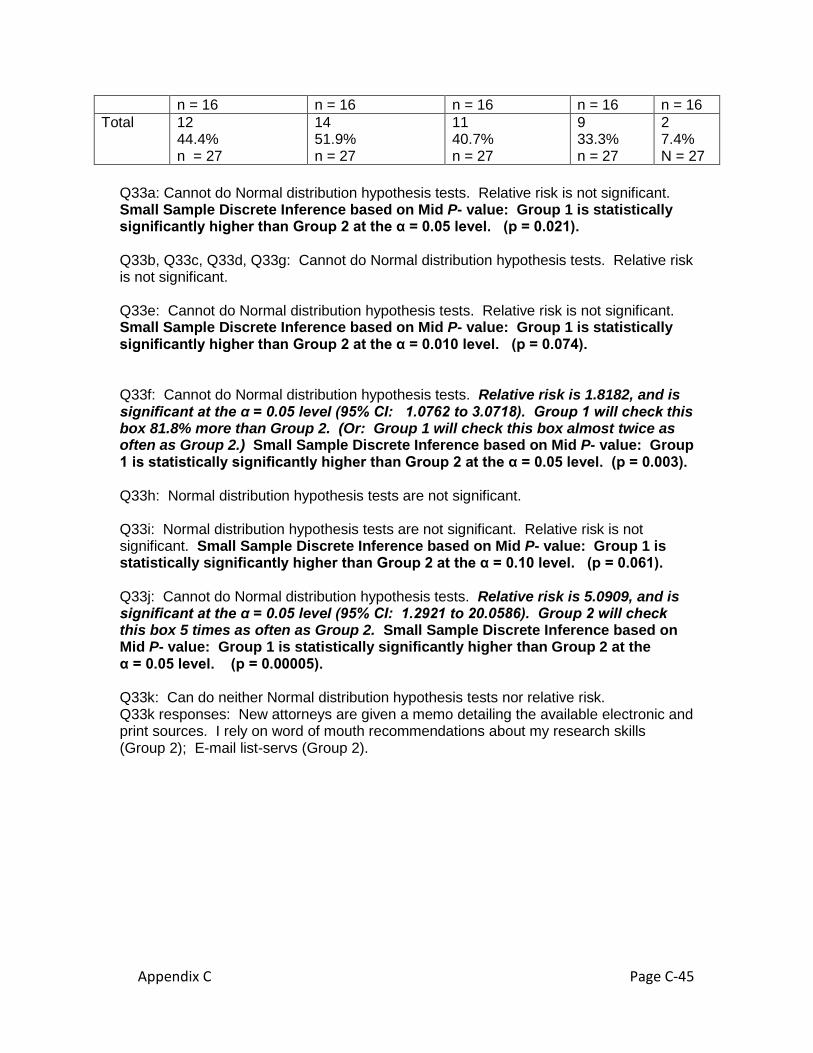
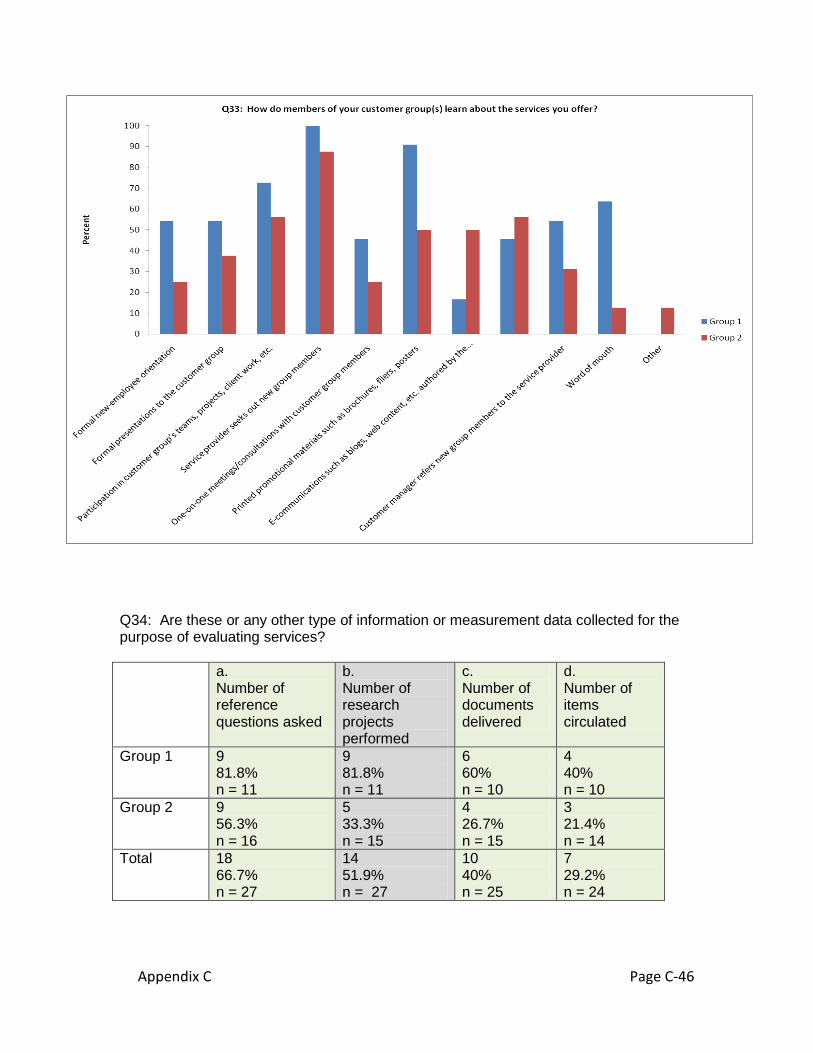
Q33: How do members of your customer group(s) learn about the services you offer? a) Formal new-employee orientation: Small Sample Discrete Inference based on Mid P- value: Group 1 is statistically significantly higher than Group 2 at the α = 0.05 level. (p = 0.021).
e) One-on-one meetings/consultations with customer group members: Small Sample Discrete Inference based on Mid P- value: Group 1 is statistically significantly higher than Group 2 at the α = 0.010 level. (p = 0.074). f) Printed promotional materials such as brochures, fliers, posters: Relative risk is 1.8182, and is significant at the α = 0.05 level (95% CI: 1.0762 to 3.0718). Group 1 will check this box 81.8% more than Group 2. (Or: Group 1 will check this box almost twice as often as Group 2.) Small Sample Discrete Inference based on Mid P- value: Group 1 is statistically significantly higher than Group 2 at the α = 0.05 level. (p = 0.003). i) Customer manager refers new group members to the service provider: Small Sample Discrete Inference based on Mid P- value: Group 1 is statistically significantly higher than Group 2 at the α = 0.010 level. (p = 0.061). j) Word of mouth : Relative risk is 5.0909, and is significant at the α = 0.05 level (95% CI: 1.2921 to 20.0586). Group 2 will check this box 5 times as often as Group 2. Small Sample Discrete Inference based on Mid P- value: Group 1 is statistically significantly higher than Group 2 at the α = 0.05 level. (p = 0.00005).
Appendix C Page C-26
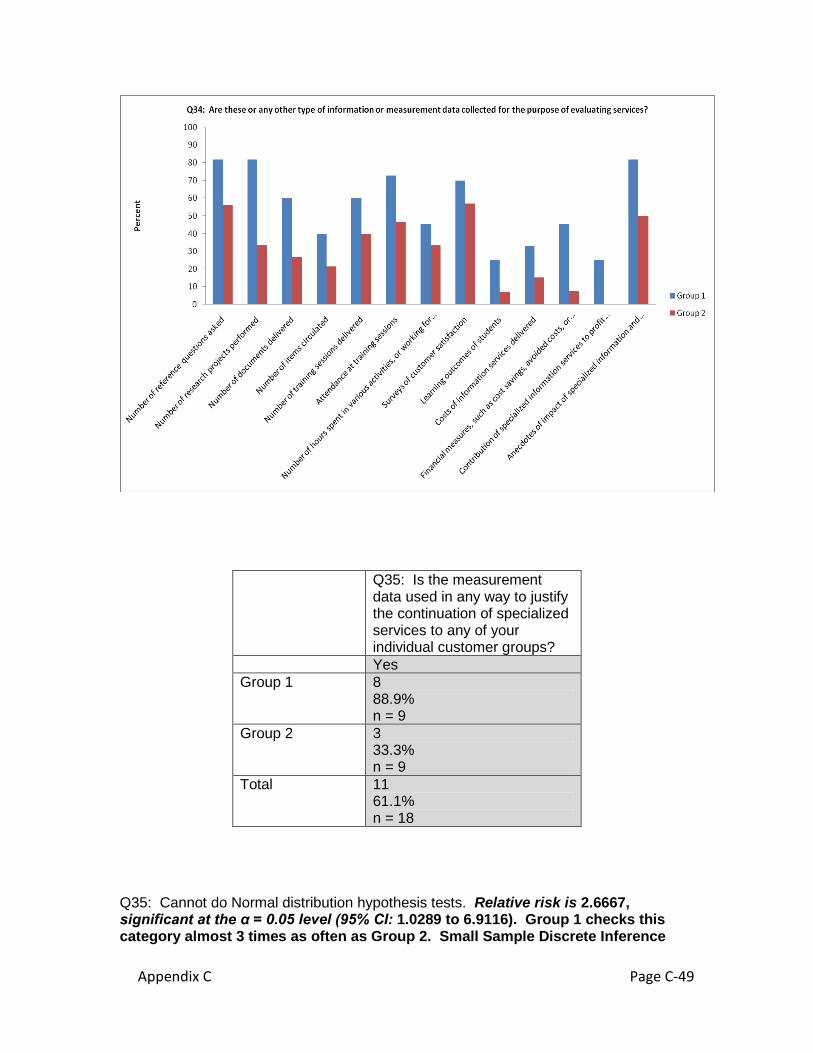
Q34: Are these or any other type of information or measurement data collected for the purpose of evaluating services? a) Number of reference questions asked: Small Sample Discrete Inference based on Mid P- value: Group 1 is statistically significantly higher than Group 2 at the α = 0.05 level. (p = 0.047). b) Number of research projects performed: Relative risk is 2.4545, significant at the α = 0.05 level (95% CI: 1.1388 to 5.2906). Group 1 checks this box 5 times to every 2 times Group 2 does. Small Sample Discrete Inference based on Mid P- value: Group 1 is statistically significantly higher than Group 2 at the α = 0.05 level. (p = 0.001). c) Number of documents delivered: Small Sample Discrete Inference based on Mid P- value: Group 1 is statistically significantly higher than Group 2 at the α = 0.05 level. (p = 0.016). d) Number of items circulated: Small Sample Discrete Inference based on Mid P- value: Group 1 is statistically significantly higher than Group 2 at the α = 0.10 level. (p = 0.095). f) Attendance in training sessions: Small Sample Discrete Inference based on Mid P- value: Group 1 is statistically significantly higher than Group 2 at the α = 0.05 level. (p = 0.048). i) Learning outcomes of students: Small Sample Discrete Inference based on Mid P- value: Group 1 is statistically significantly higher than Group 2 at the α = 0.10 level. (p = 0.061). j) Costs of information services delivered: Small Sample Discrete Inference based on Mid P- value: Group 1 is statistically significantly higher than Group 2 at the α = 0.10 level. (p = 0.093). k) Financial measures, such as cost savings, avoided costs, or return on investment or specialized information services: Small Sample Discrete Inference based on Mid P- value: Group 1 is statistically significantly higher than Group 2 at the α = 0.05 level. (p = 0.0005). m) Anecdotes of impact of specialized information and services on customer work and outcomes: Small Sample Discrete Inference based on Mid P- value: Group 1 is statistically significantly higher than Group 2 at the α = 0.05 level. (p = 0.014). Q35: Is the measurement data used in any way to justify the continuation of specialized services to any of your individual customer groups? Relative risk is 2.6667, significant at the α = 0.05 level (95% CI: 1.0289 to 6.9116). Group 1 checks this category almost 3 times as often as Group 2. Small Sample Discrete Inference based on Mid P- value: Group 1 is statistically significantly higher than Group 2 at the α = 0.05 level. (p = 0.0005).
Appendix C Page C-27
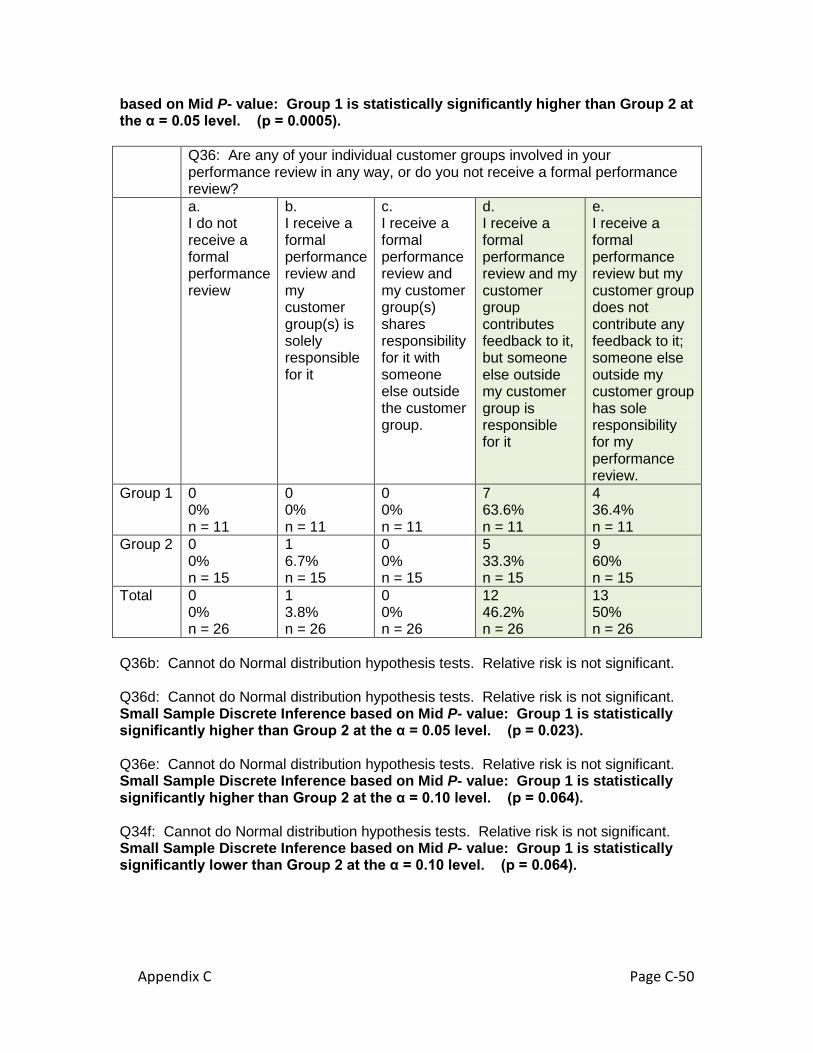
Q36: Are any of your individual customer groups involved in your performance review in any way, or do you not receive a formal performance review? d) I receive a formal performance review and my customer group contributes feedback to it, but someone else outside my customer group is responsible for it. Small Sample Discrete Inference based on Mid P- value: Group 1 is statistically significantly higher than Group 2 at the α = 0.05 level. (p = 0.024). e) I receive a formal performance review but my customer group does not contribute any feedback to it; someone else outside my customer group has sole responsibility for my performance review. Small Sample Discrete Inference based on Mid P- value: Group 1 is statistically significantly lower than Group 2 at the α = 0.10 level. (p = 0.064).
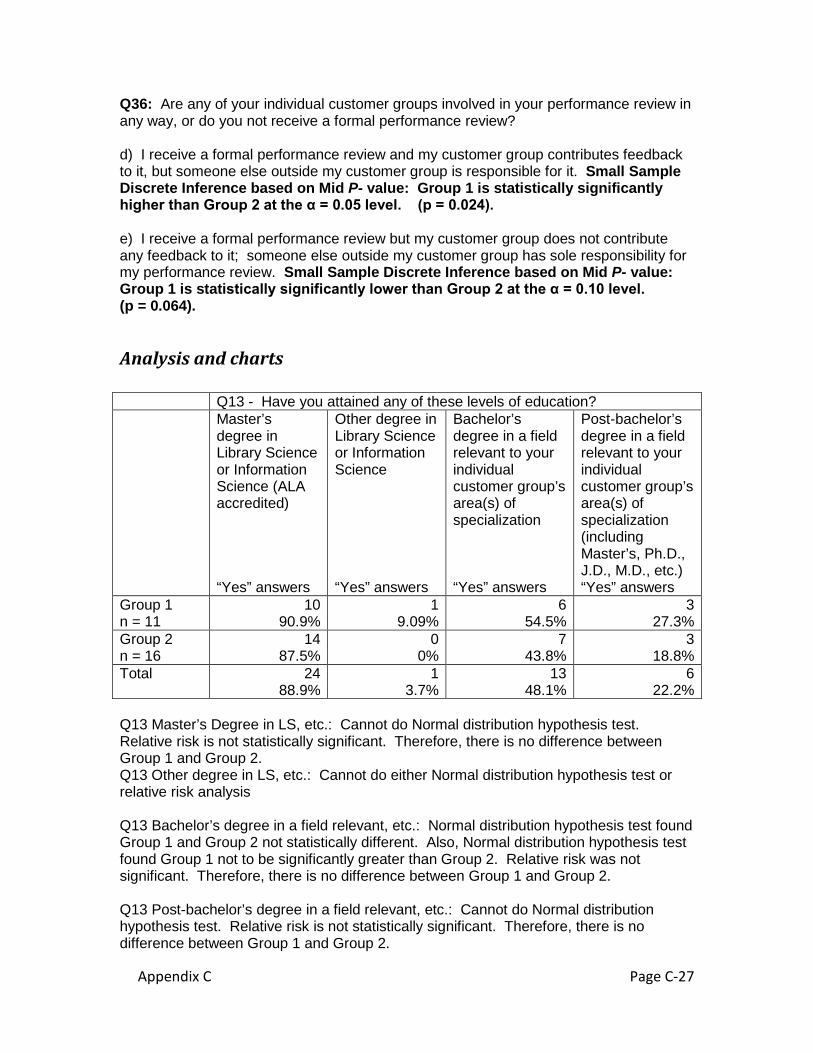
Analysis and charts Q13 - Have you attained any of these levels of education? Master’s
degree in Library Science or Information Science (ALA accredited) “Yes” answers
Other degree in Library Science or Information Science “Yes” answers
Bachelor’s degree in a field relevant to your individual customer group’s area(s) of specialization “Yes” answers
Post-bachelor’s degree in a field relevant to your individual customer group’s area(s) of specialization (including Master’s, Ph.D., J.D., M.D., etc.) “Yes” answers
Group 1 n = 11
10 90.9%
1 9.09%
6 54.5%
3 27.3%
Group 2 n = 16
14 87.5%
0 0%
7 43.8%
3 18.8%
Total 24 88.9%
1 3.7%
13 48.1%
6 22.2%
Q13 Master’s Degree in LS, etc.: Cannot do Normal distribution hypothesis test. Relative risk is not statistically significant. Therefore, there is no difference between Group 1 and Group 2. Q13 Other degree in LS, etc.: Cannot do either Normal distribution hypothesis test or relative risk analysis Q13 Bachelor’s degree in a field relevant, etc.: Normal distribution hypothesis test found Group 1 and Group 2 not statistically different. Also, Normal distribution hypothesis test found Group 1 not to be significantly greater than Group 2. Relative risk was not significant. Therefore, there is no difference between Group 1 and Group 2. Q13 Post-bachelor’s degree in a field relevant, etc.: Cannot do Normal distribution hypothesis test. Relative risk is not statistically significant. Therefore, there is no difference between Group 1 and Group 2.
Appendix C Page C-28
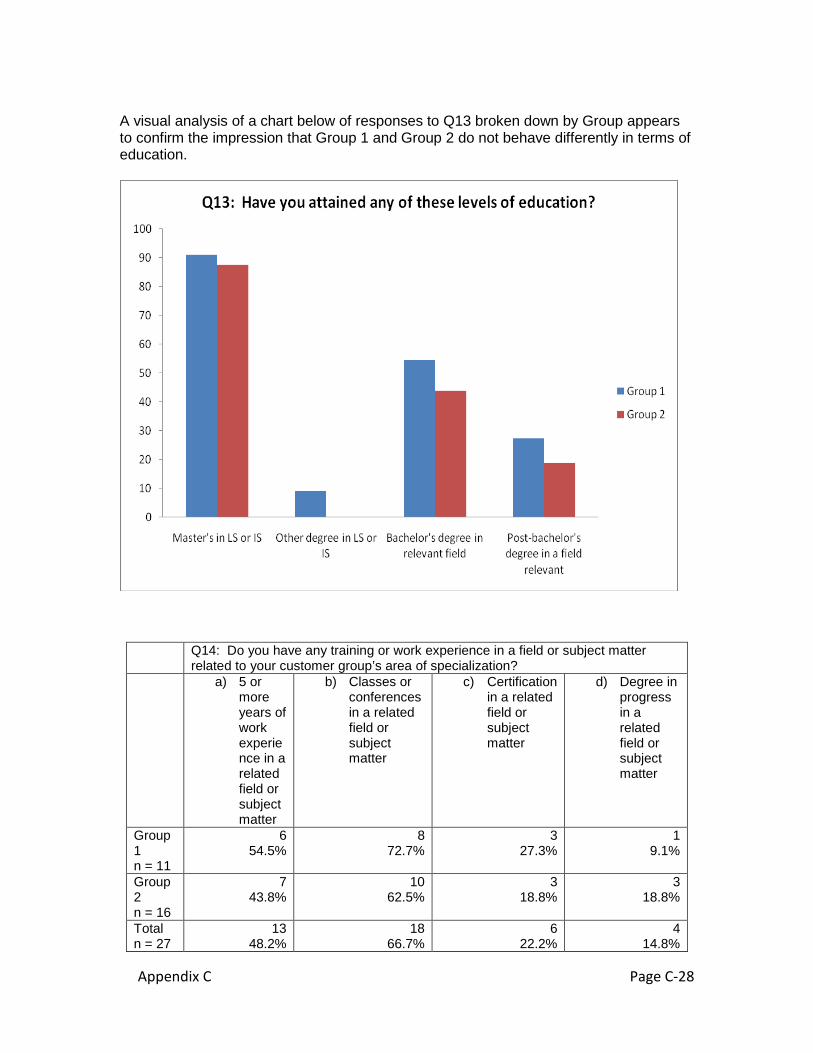
A visual analysis of a chart below of responses to Q13 broken down by Group appears to confirm the impression that Group 1 and Group 2 do not behave differently in terms of education.
Q14: Do you have any training or work experience in a field or subject matter related to your customer group’s area of specialization?
a) 5 or more years of work experience in a related field or subject matter
b) Classes or conferences in a related field or subject matter
c) Certification in a related field or subject matter
d) Degree in progress in a related field or subject matter
Group 1 n = 11
6 54.5%
8 72.7%
3 27.3%
1 9.1%
Group 2 n = 16
7 43.8%
10 62.5%
3 18.8%
3 18.8%
Total n = 27
13 48.2%
18 66.7%
6 22.2%
4 14.8%
Appendix C Page C-29
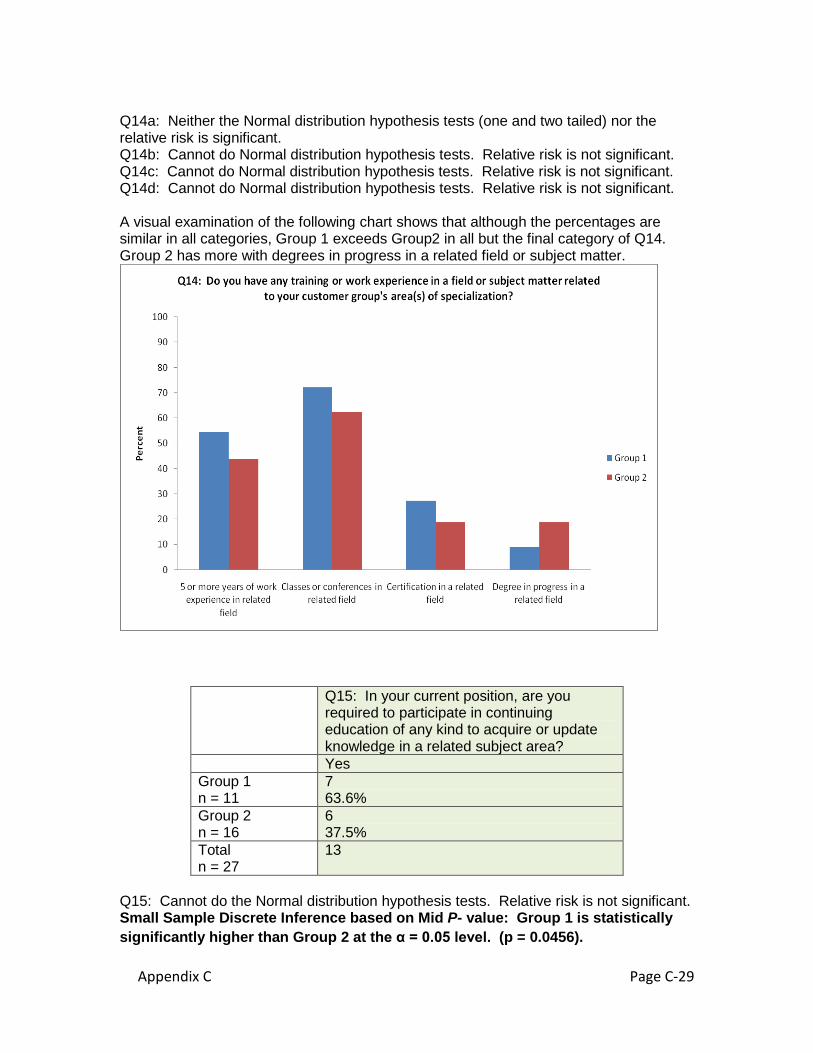
Q14a: Neither the Normal distribution hypothesis tests (one and two tailed) nor the relative risk is significant. Q14b: Cannot do Normal distribution hypothesis tests. Relative risk is not significant. Q14c: Cannot do Normal distribution hypothesis tests. Relative risk is not significant. Q14d: Cannot do Normal distribution hypothesis tests. Relative risk is not significant. A visual examination of the following chart shows that although the percentages are similar in all categories, Group 1 exceeds Group2 in all but the final category of Q14. Group 2 has more with degrees in progress in a related field or subject matter.
Q15: In your current position, are you required to participate in continuing education of any kind to acquire or update knowledge in a related subject area?
Yes Group 1 n = 11
7 63.6%
Group 2 n = 16
6 37.5%
Total n = 27
13
Q15: Cannot do the Normal distribution hypothesis tests. Relative risk is not significant. Small Sample Discrete Inference based on Mid P- value: Group 1 is statistically significantly higher than Group 2 at the α = 0.05 level. (p = 0.0456).
Appendix C Page C-30
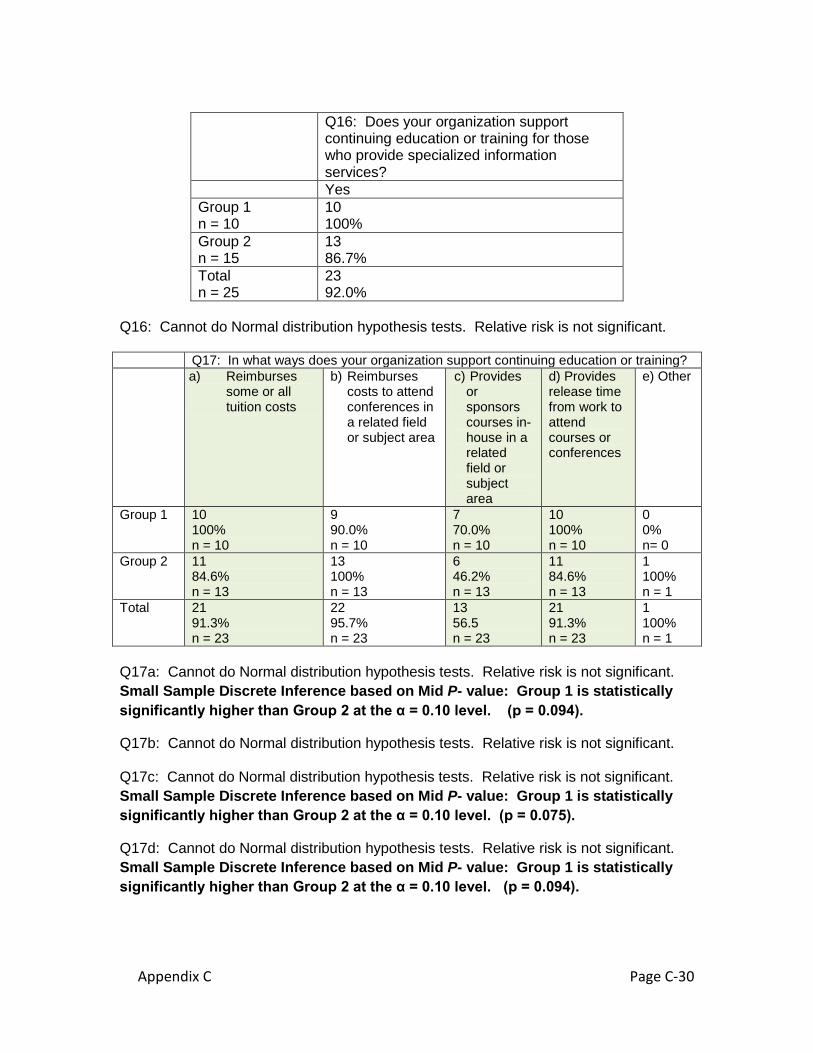
Q16: Does your organization support
continuing education or training for those who provide specialized information services?
Yes Group 1 n = 10
10 100%
Group 2 n = 15
13 86.7%
Total n = 25
23 92.0%
Q16: Cannot do Normal distribution hypothesis tests. Relative risk is not significant. Q17: In what ways does your organization support continuing education or training? a) Reimburses
some or all tuition costs
b) Reimburses costs to attend conferences in a related field or subject area
c) Provides or sponsors courses in-house in a related field or subject area
d) Provides release time from work to attend courses or conferences
e) Other
Group 1
10 100% n = 10
9 90.0% n = 10
7 70.0% n = 10
10 100% n = 10
0 0% n= 0
Group 2
11 84.6% n = 13
13 100% n = 13
6 46.2% n = 13
11 84.6% n = 13
1 100% n = 1
Total
21 91.3% n = 23
22 95.7% n = 23
13 56.5 n = 23
21 91.3% n = 23
1 100% n = 1
Q17a: Cannot do Normal distribution hypothesis tests. Relative risk is not significant. Small Sample Discrete Inference based on Mid P- value: Group 1 is statistically significantly higher than Group 2 at the α = 0.10 level. (p = 0.094).
Q17b: Cannot do Normal distribution hypothesis tests. Relative risk is not significant. Q17c: Cannot do Normal distribution hypothesis tests. Relative risk is not significant. Small Sample Discrete Inference based on Mid P- value: Group 1 is statistically significantly higher than Group 2 at the α = 0.10 level. (p = 0.075).
Q17d: Cannot do Normal distribution hypothesis tests. Relative risk is not significant. Small Sample Discrete Inference based on Mid P- value: Group 1 is statistically significantly higher than Group 2 at the α = 0.10 level. (p = 0.094).
Appendix C Page C-31
Q18: What types of reference, research, and resource development services do you provide to your individual customer group(s) and to others in your organization?
a. Information resource development (such as evaluating resource negotiating with vendor, etc.)
b. Ready reference, quick fact checking, citation verification
c. Interlibrary Loan and/or document delivery
d. Evaluating, synthesizing, summarizing the literature
e. In-depth, topical research
f. Current awareness, news alerting
g. Competitive intelligence
h. Data analysis (such as trends, industry, research)
Group 1
10 90.9% n = 11
10 90.9% n = 11
7 63.6% n = 11
7 70% n = 10
11 100% n = 11
10 90.9% n = 11
7 70% n = 10
8 80% n = 10
Group 2
14 87.5% n = 16
14 87.5% n = 16
5 31.3% n = 16
7 43.8% n = 16
11 68.8% n = 16
13 81.3% n = 16
5 31.3% n = 16
6 37.5% n = 16
24 88.9% n = 27
24 88.9% n = 27
12 44.4% n = 27
14 53.8% n = 26
22 81.5% n = 27
23 85.2% n = 27
12 46.2% n = 26
14 53.8% n = 26
Q18a, 18b, 18d, Q18f: Cannot do Normal distribution hypothesis tests. Relative risk is not significant.
Appendix C Page C-32
Q18c: Cannot do Normal distribution hypothesis tests. Relative risk is not significant. Small Sample Discrete Inference based on Mid P- value: Group 1 is statistically significantly higher than Group 2 at the α = 0.05 level. (p = 0.017).
Q18e: Cannot do Normal distribution hypothesis tests. Relative risk is significant at α = 0.05. RR = 1.4545 (95% CI: 1.0453 to 2.0239). Group 1 checked In-depth topical research 45% more often than Group 2. (Or: Group 1 checked “In-depth” 3 times for every 2 times checked by Group 2.) Small Sample Discrete Inference based on Mid P- value: Group 1 is statistically significantly higher than Group 2 at the α = 0.05 level. (p = 0.008).
Q18g: Small Sample Discrete Inference based on Mid P- value: Group 1 is statistically significantly higher than Group 2 at the α = 0.05 level. (p = 0.017).
Q18h: Cannot do Normal distribution hypothesis tests. Relative risk is significant at α = 0.05. RR = 2.133 (95% CI: 1.0547 to 4.3150). Group 1 checked Data analysis 113% more often than Group 2. (Or: Group 1 checked Data analysis more than twice as often as Group 2.) Small Sample Discrete Inference based on Mid P- value: Group 1 is statistically significantly higher than Group 2 at the α = 0.05 level. (p = 0.011).
Appendix C Page C-33
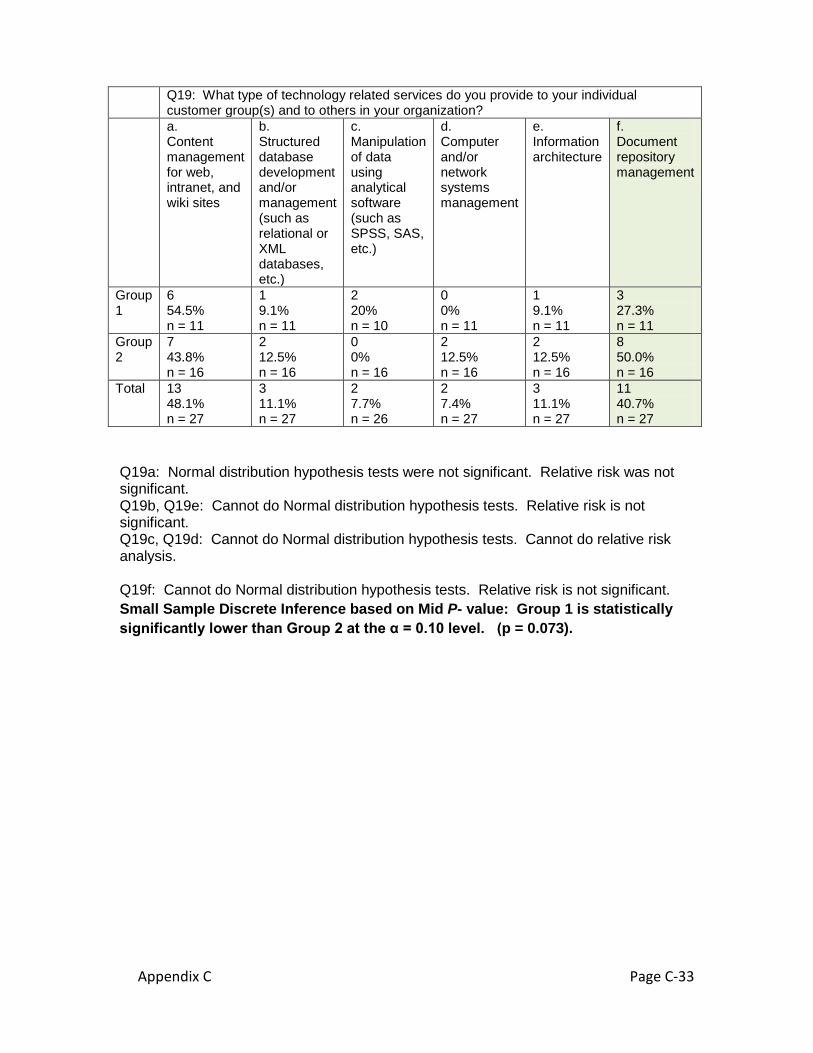
Q19a: Normal distribution hypothesis tests were not significant. Relative risk was not significant. Q19b, Q19e: Cannot do Normal distribution hypothesis tests. Relative risk is not significant. Q19c, Q19d: Cannot do Normal distribution hypothesis tests. Cannot do relative risk analysis. Q19f: Cannot do Normal distribution hypothesis tests. Relative risk is not significant. Small Sample Discrete Inference based on Mid P- value: Group 1 is statistically significantly lower than Group 2 at the α = 0.10 level. (p = 0.073).
Q19: What type of technology related services do you provide to your individual customer group(s) and to others in your organization?
a. Content management for web, intranet, and wiki sites
b. Structured database development and/or management (such as relational or XML databases, etc.)
c. Manipulation of data using analytical software (such as SPSS, SAS, etc.)
d. Computer and/or network systems management
e. Information architecture
f. Document repository management
Group 1
6 54.5% n = 11
1 9.1% n = 11
2 20% n = 10
0 0% n = 11
1 9.1% n = 11
3 27.3% n = 11
Group 2
7 43.8% n = 16
2 12.5% n = 16
0 0% n = 16
2 12.5% n = 16
2 12.5% n = 16
8 50.0% n = 16
Total 13 48.1% n = 27
3 11.1% n = 27
2 7.7% n = 26
2 7.4% n = 27
3 11.1% n = 27
11 40.7% n = 27
Appendix C Page C-34
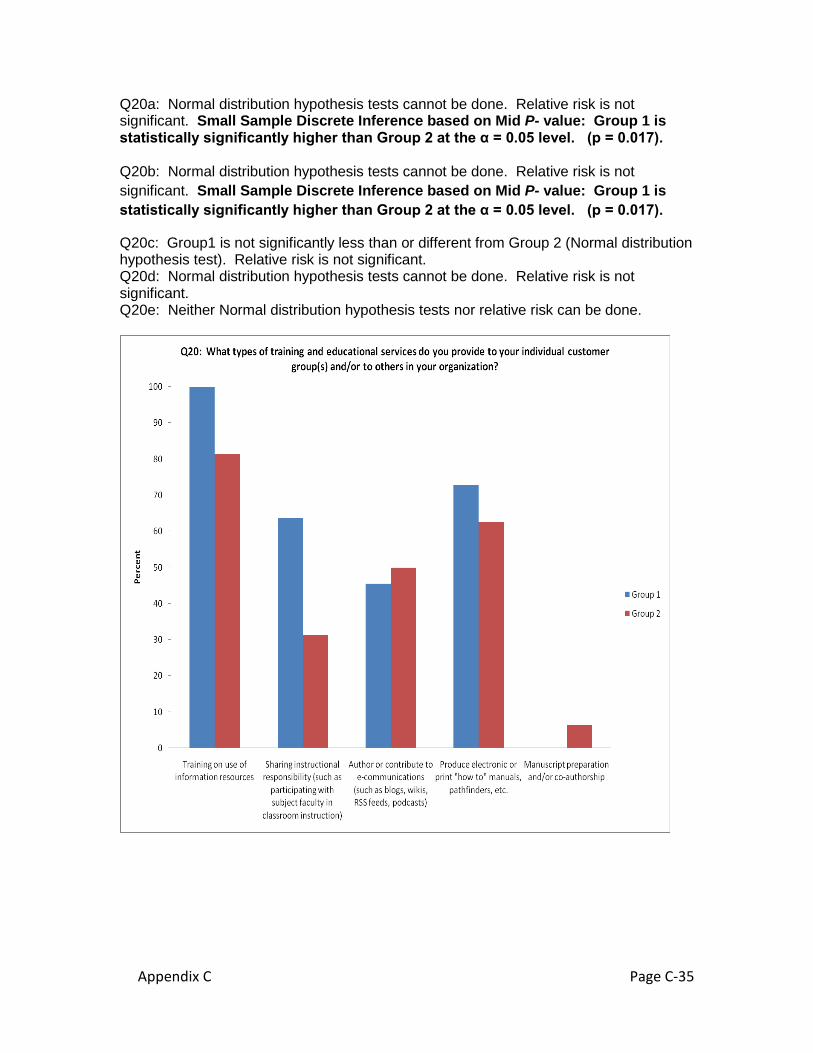
Q20: What types of training and educational services do you provide to your
individual customer group(s) and/or to others in your organization? a.
Training on the use of information resources
b. Sharing instructional responsibility (such as participating with subject faculty in classroom instruction)
c. Author or contribute to e-communications (such as blogs, wikis, RSS feeds, podcasts)
d. Produce electronic or print “how to” manuals, pathfinders, etc.
e. Manuscript preparation and/or co-authorship
Group 1 11 100% n = 11
7 63.6% n= 11
5 45.5% n= 11
8 72.7% n= 11
0 0% n= 11
Group 2 13 81.3% n = 16
5 31.3% n = 16
8 50.0% n = 16
10 62.5% n= 16
1 6.3% n= 16
Total 24 88.9% n = 27
12 44.4% n = 27
13 48.1% n = 27
18 66.7% n= 27
1 3.7% n= 27
Appendix C Page C-35
Q20a: Normal distribution hypothesis tests cannot be done. Relative risk is not significant. Small Sample Discrete Inference based on Mid P- value: Group 1 is statistically significantly higher than Group 2 at the α = 0.05 level. (p = 0.017). Q20b: Normal distribution hypothesis tests cannot be done. Relative risk is not significant. Small Sample Discrete Inference based on Mid P- value: Group 1 is statistically significantly higher than Group 2 at the α = 0.05 level. (p = 0.017).
Q20c: Group1 is not significantly less than or different from Group 2 (Normal distribution hypothesis test). Relative risk is not significant. Q20d: Normal distribution hypothesis tests cannot be done. Relative risk is not significant. Q20e: Neither Normal distribution hypothesis tests nor relative risk can be done.
Appendix C Page C-36
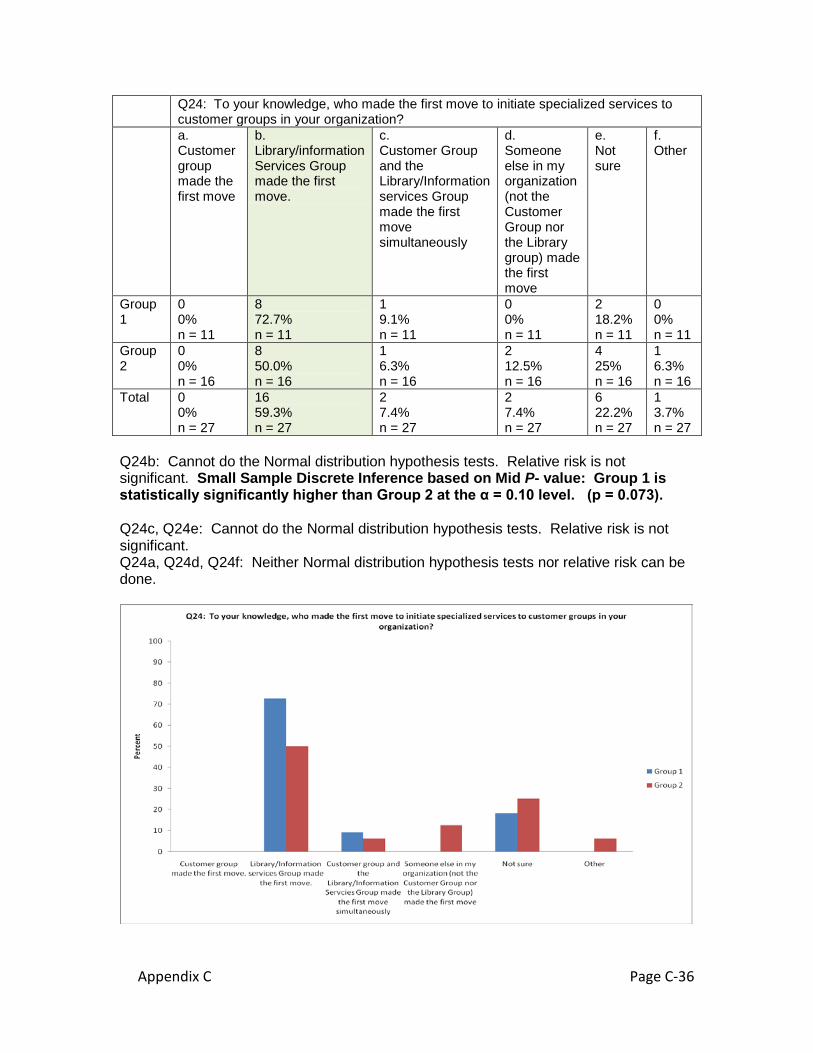
Q24: To your knowledge, who made the first move to initiate specialized services to customer groups in your organization?
a. Customer group made the first move
b. Library/information Services Group made the first move.
c. Customer Group and the Library/Information services Group made the first move simultaneously
d. Someone else in my organization (not the Customer Group nor the Library group) made the first move
e. Not sure
f. Other
Group 1
0 0% n = 11
8 72.7% n = 11
1 9.1% n = 11
0 0% n = 11
2 18.2% n = 11
0 0% n = 11
Group 2
0 0% n = 16
8 50.0% n = 16
1 6.3% n = 16
2 12.5% n = 16
4 25% n = 16
1 6.3% n = 16
Total 0 0% n = 27
16 59.3% n = 27
2 7.4% n = 27
2 7.4% n = 27
6 22.2% n = 27
1 3.7% n = 27
Q24b: Cannot do the Normal distribution hypothesis tests. Relative risk is not significant. Small Sample Discrete Inference based on Mid P- value: Group 1 is statistically significantly higher than Group 2 at the α = 0.10 level. (p = 0.073). Q24c, Q24e: Cannot do the Normal distribution hypothesis tests. Relative risk is not significant. Q24a, Q24d, Q24f: Neither Normal distribution hypothesis tests nor relative risk can be done.
Appendix C Page C-37
Q25: To your knowledge, was authorization from any level of management in your organization required prior to the initiation of specialized services to customer groups?
Group 1 3 37.5% n = 8
Group 2 7 77.8% n = 9
10 58.8% n = 17
Q25: Cannot do Normal distribution hypothesis tests. Relative risk is not significant. Small Sample Discrete Inference based on Mid P- value: Group 1 is statistically significantly lower than Group 2 at the α = 0.05 level. (p = 0.007).
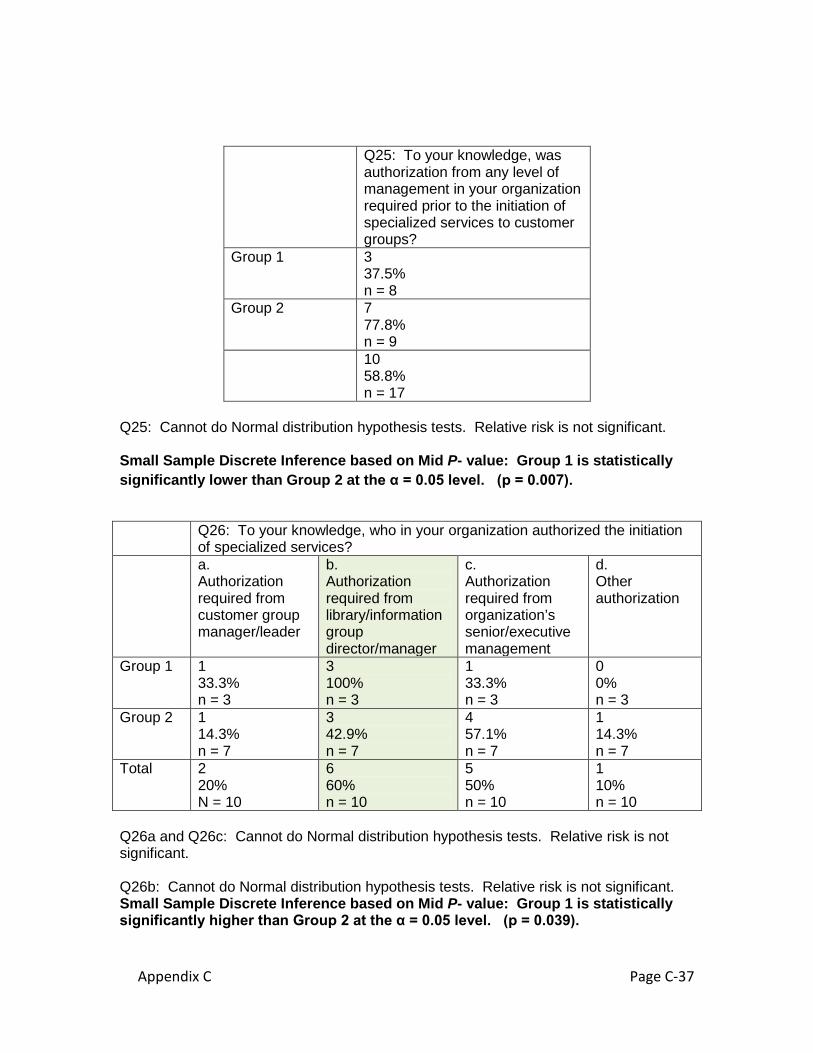
Q26: To your knowledge, who in your organization authorized the initiation
of specialized services? a.
Authorization required from customer group manager/leader
b. Authorization required from library/information group director/manager
c. Authorization required from organization’s senior/executive management
d. Other authorization
Group 1 1 33.3% n = 3
3 100% n = 3
1 33.3% n = 3
0 0% n = 3
Group 2 1 14.3% n = 7
3 42.9% n = 7
4 57.1% n = 7
1 14.3% n = 7
Total 2 20% N = 10
6 60% n = 10
5 50% n = 10
1 10% n = 10
Q26a and Q26c: Cannot do Normal distribution hypothesis tests. Relative risk is not significant. Q26b: Cannot do Normal distribution hypothesis tests. Relative risk is not significant. Small Sample Discrete Inference based on Mid P- value: Group 1 is statistically significantly higher than Group 2 at the α = 0.05 level. (p = 0.039).
Appendix C Page C-38
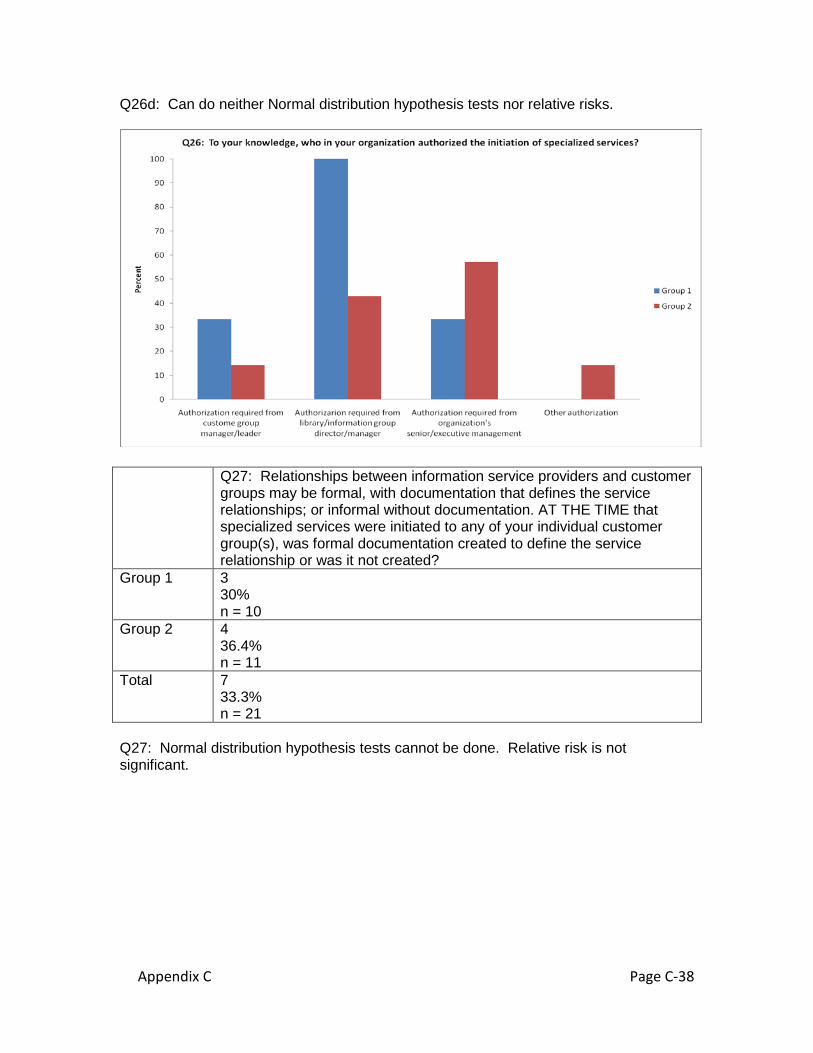
Q26d: Can do neither Normal distribution hypothesis tests nor relative risks.
Q27: Relationships between information service providers and customer
groups may be formal, with documentation that defines the service relationships; or informal without documentation. AT THE TIME that specialized services were initiated to any of your individual customer group(s), was formal documentation created to define the service relationship or was it not created?
Group 1 3 30% n = 10
Group 2 4 36.4% n = 11
Total 7 33.3% n = 21
Q27: Normal distribution hypothesis tests cannot be done. Relative risk is not significant.
Appendix C Page C-39
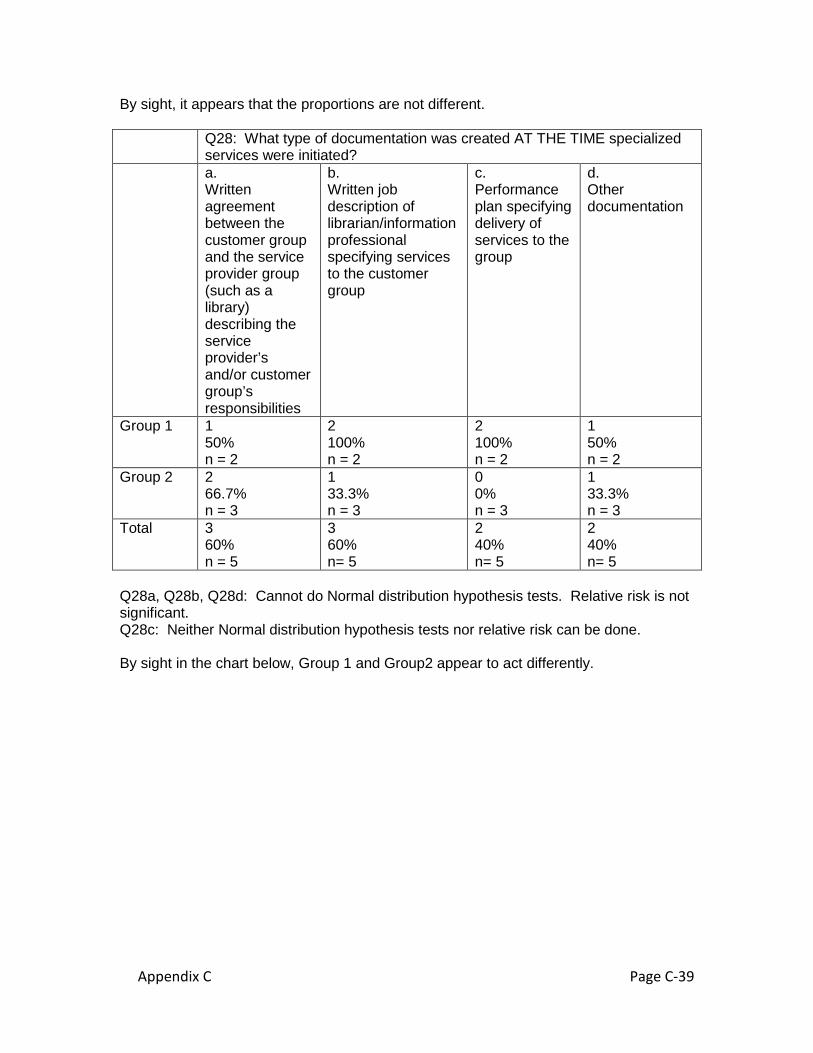
By sight, it appears that the proportions are not different. Q28: What type of documentation was created AT THE TIME specialized
services were initiated? a.
Written agreement between the customer group and the service provider group (such as a library) describing the service provider’s and/or customer group’s responsibilities
b. Written job description of librarian/information professional specifying services to the customer group
c. Performance plan specifying delivery of services to the group
d. Other documentation
Group 1 1 50% n = 2
2 100% n = 2
2 100% n = 2
1 50% n = 2
Group 2 2 66.7% n = 3
1 33.3% n = 3
0 0% n = 3
1 33.3% n = 3
Total 3 60% n = 5
3 60% n= 5
2 40% n= 5
2 40% n= 5
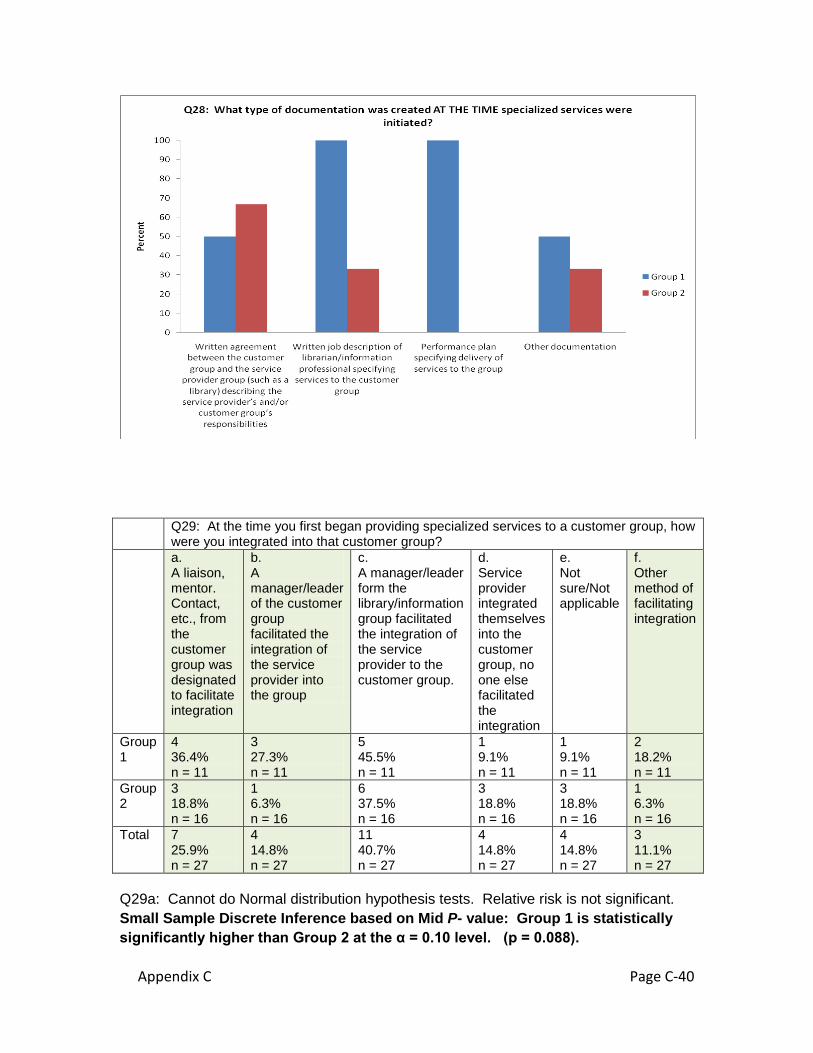
Q28a, Q28b, Q28d: Cannot do Normal distribution hypothesis tests. Relative risk is not significant. Q28c: Neither Normal distribution hypothesis tests nor relative risk can be done. By sight in the chart below, Group 1 and Group2 appear to act differently.
Appendix C Page C-40
Q29: At the time you first began providing specialized services to a customer group, how
were you integrated into that customer group? a.
A liaison, mentor. Contact, etc., from the customer group was designated to facilitate integration
b. A manager/leader of the customer group facilitated the integration of the service provider into the group
c. A manager/leader form the library/information group facilitated the integration of the service provider to the customer group.
d. Service provider integrated themselves into the customer group, no one else facilitated the integration
e. Not sure/Not applicable
f. Other method of facilitating integration
Group 1
4 36.4% n = 11
3 27.3% n = 11
5 45.5% n = 11
1 9.1% n = 11
1 9.1% n = 11
2 18.2% n = 11
Group 2
3 18.8% n = 16
1 6.3% n = 16
6 37.5% n = 16
3 18.8% n = 16
3 18.8% n = 16
1 6.3% n = 16
Total 7 25.9% n = 27
4 14.8% n = 27
11 40.7% n = 27
4 14.8% n = 27
4 14.8% n = 27
3 11.1% n = 27
Q29a: Cannot do Normal distribution hypothesis tests. Relative risk is not significant. Small Sample Discrete Inference based on Mid P- value: Group 1 is statistically significantly higher than Group 2 at the α = 0.10 level. (p = 0.088).
Appendix C Page C-41
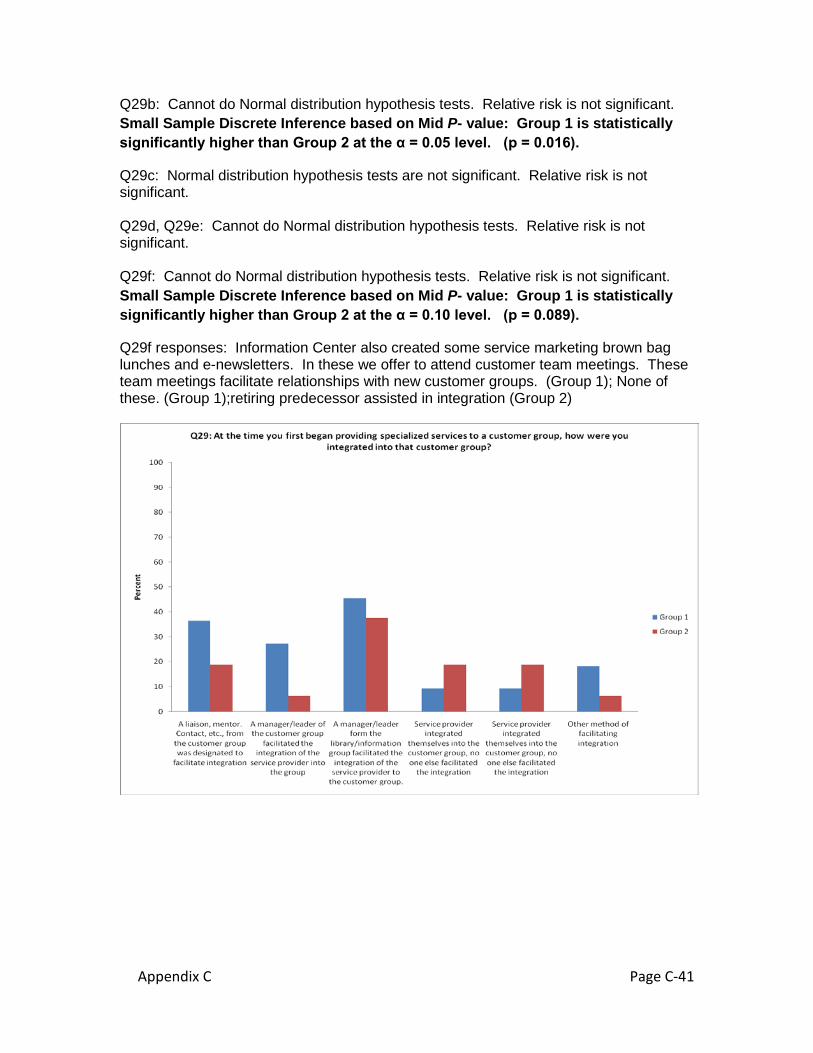
Q29b: Cannot do Normal distribution hypothesis tests. Relative risk is not significant. Small Sample Discrete Inference based on Mid P- value: Group 1 is statistically significantly higher than Group 2 at the α = 0.05 level. (p = 0.016).
Q29c: Normal distribution hypothesis tests are not significant. Relative risk is not significant. Q29d, Q29e: Cannot do Normal distribution hypothesis tests. Relative risk is not significant. Q29f: Cannot do Normal distribution hypothesis tests. Relative risk is not significant. Small Sample Discrete Inference based on Mid P- value: Group 1 is statistically significantly higher than Group 2 at the α = 0.10 level. (p = 0.089).
Q29f responses: Information Center also created some service marketing brown bag lunches and e-newsletters. In these we offer to attend customer team meetings. These team meetings facilitate relationships with new customer groups. (Group 1); None of these. (Group 1);retiring predecessor assisted in integration (Group 2)
Appendix C Page C-42
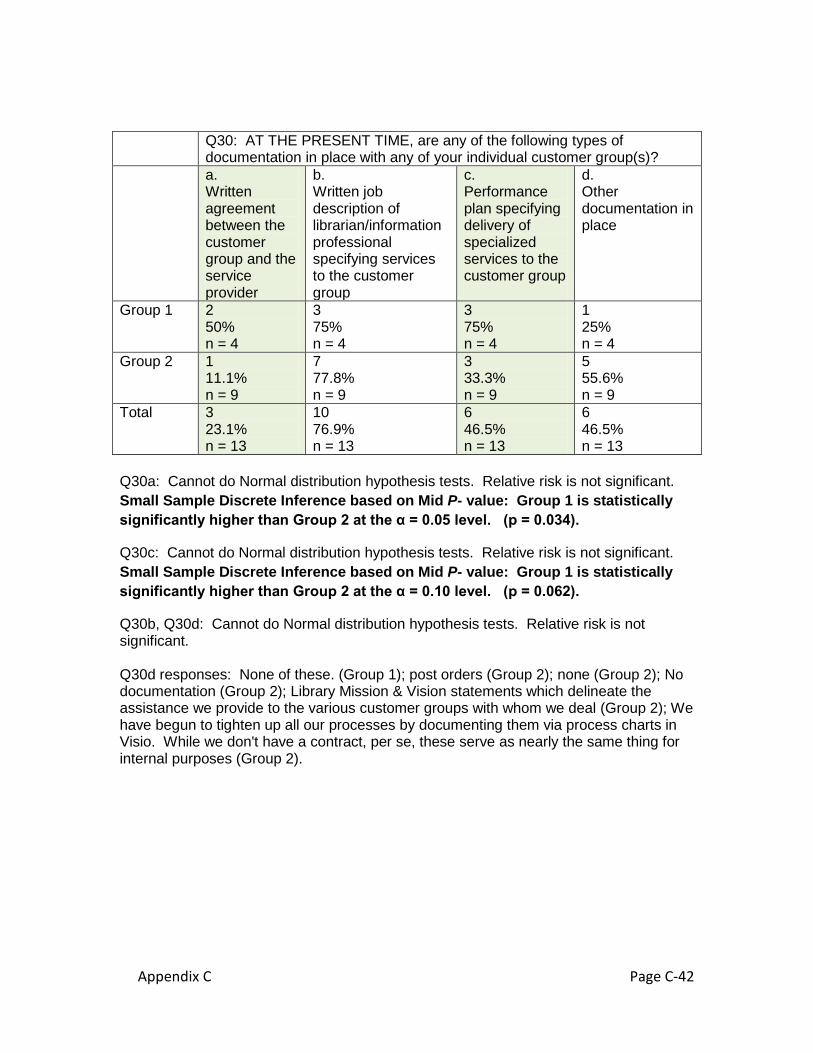
Q30: AT THE PRESENT TIME, are any of the following types of
documentation in place with any of your individual customer group(s)? a.
Written agreement between the customer group and the service provider
b. Written job description of librarian/information professional specifying services to the customer group
c. Performance plan specifying delivery of specialized services to the customer group
d. Other documentation in place
Group 1 2 50% n = 4
3 75% n = 4
3 75% n = 4
1 25% n = 4
Group 2 1 11.1% n = 9
7 77.8% n = 9
3 33.3% n = 9
5 55.6% n = 9
Total 3 23.1% n = 13
10 76.9% n = 13
6 46.5% n = 13
6 46.5% n = 13
Q30a: Cannot do Normal distribution hypothesis tests. Relative risk is not significant. Small Sample Discrete Inference based on Mid P- value: Group 1 is statistically significantly higher than Group 2 at the α = 0.05 level. (p = 0.034).
Q30c: Cannot do Normal distribution hypothesis tests. Relative risk is not significant. Small Sample Discrete Inference based on Mid P- value: Group 1 is statistically significantly higher than Group 2 at the α = 0.10 level. (p = 0.062).
Q30b, Q30d: Cannot do Normal distribution hypothesis tests. Relative risk is not significant. Q30d responses: None of these. (Group 1); post orders (Group 2); none (Group 2); No documentation (Group 2); Library Mission & Vision statements which delineate the assistance we provide to the various customer groups with whom we deal (Group 2); We have begun to tighten up all our processes by documenting them via process charts in Visio. While we don't have a contract, per se, these serve as nearly the same thing for internal purposes (Group 2).
Appendix C Page C-43
Q31: Do you submit any written or verbal reports on the services you provide to a manager/leader in your customer group(s)?
Yes Group 1 7
63.6% n = 11
Group 2 6 40% n = 15
Total 13 50% N = 26
Q31: Cannot do Normal distribution hypothesis tests. Relative risk is not significant. Small Sample Discrete Inference based on Mid P- value: Group 1 is statistically significantly higher than Group 2 at the α = 0.10 level. (p = 0.064).
One respondent in Group 2 checked “Not sure/Not applicable.” Q32: Do you provide any written or verbal reports to anyone outside of
Appendix C Page C-44
your customer group(s) (such as a library/information group leader or organization’s executive management regarding the specialized services you provide?
Yes Group 1 4
36.4% n = 11
Group 2 6 37.5% n = 16
Total 10 37.0% n = 27
Q32: Cannot do Normal distribution hypothesis tests. Relative risk is not significant. By sight, these proportions appear to be similar. Q33: How do members of your customer group(s) learn about the services you offer?
a. Formal new-employee orientation
b. Formal presentations to the customer group
c. Participation in customer group’s teams, projects, client work, etc.
d. Service provider seeks out new group members
e. One-on-one meetings/ consultations with customer group members
f. Printed promotional materials such as brochures, fliers, posters
Group 1 6 54.5% n = 11
6 54.5% n = 11
8 72.7% n = 11
11 100% n = 11
5 45.5% n = 11
10 90.9% n = 11
Group 2 4 25% n = 16
6 37.5% n = 16
9 56.3% n = 16
14 87.5% n = 16
4 25% n = 16
8 50% n = 16
Total 10 37.0% n = 27
12 44.4% n = 27
17 63.0% n = 27
25 92.6% n = 27
9 33.3% n = 27
18 66.7% n = 27
Q33 (cont.): How do members of your customer group(s) learn about the services you offer?
g. E-communications such as blogs, web content, etc. authored by the service provider
h. Information on the customer group’s web-site or other customer group e-communications
i. Customer manager refers new group members to the service provider
j. Word of mouth
k. Other
Group 1 4 16.7% n = 11
5 45.5% n = 11
6 54.5% n = 11
7 63.6% n = 11
0 0% n = 11
Group 2 8 50%
9 56.3%
5 31.3%
2 12.5%
2 12.5%
Appendix C Page C-45
n = 16 n = 16 n = 16 n = 16 n = 16 Total 12
44.4% n = 27
14 51.9% n = 27
11 40.7% n = 27
9 33.3% n = 27
2 7.4% N = 27
Q33a: Cannot do Normal distribution hypothesis tests. Relative risk is not significant. Small Sample Discrete Inference based on Mid P- value: Group 1 is statistically significantly higher than Group 2 at the α = 0.05 level. (p = 0.021). Q33b, Q33c, Q33d, Q33g: Cannot do Normal distribution hypothesis tests. Relative risk is not significant. Q33e: Cannot do Normal distribution hypothesis tests. Relative risk is not significant. Small Sample Discrete Inference based on Mid P- value: Group 1 is statistically significantly higher than Group 2 at the α = 0.010 level. (p = 0.074). Q33f: Cannot do Normal distribution hypothesis tests. Relative risk is 1.8182, and is significant at the α = 0.05 level (95% CI: 1.0762 to 3.0718). Group 1 will check this box 81.8% more than Group 2. (Or: Group 1 will check this box almost twice as often as Group 2.) Small Sample Discrete Inference based on Mid P- value: Group 1 is statistically significantly higher than Group 2 at the α = 0.05 level. (p = 0.003). Q33h: Normal distribution hypothesis tests are not significant. Q33i: Normal distribution hypothesis tests are not significant. Relative risk is not significant. Small Sample Discrete Inference based on Mid P- value: Group 1 is statistically significantly higher than Group 2 at the α = 0.10 level. (p = 0.061). Q33j: Cannot do Normal distribution hypothesis tests. Relative risk is 5.0909, and is significant at the α = 0.05 level (95% CI: 1.2921 to 20.0586). Group 2 will check this box 5 times as often as Group 2. Small Sample Discrete Inference based on Mid P- value: Group 1 is statistically significantly higher than Group 2 at the α = 0.05 level. (p = 0.00005). Q33k: Can do neither Normal distribution hypothesis tests nor relative risk. Q33k responses: New attorneys are given a memo detailing the available electronic and print sources. I rely on word of mouth recommendations about my research skills (Group 2); E-mail list-servs (Group 2).
Appendix C Page C-46
Q34: Are these or any other type of information or measurement data collected for the purpose of evaluating services? a.
Number of reference questions asked
b. Number of research projects performed
c. Number of documents delivered
d. Number of items circulated
Group 1 9 81.8% n = 11
9 81.8% n = 11
6 60% n = 10
4 40% n = 10
Group 2 9 56.3% n = 16
5 33.3% n = 15
4 26.7% n = 15
3 21.4% n = 14
Total 18 66.7% n = 27
14 51.9% n = 27
10 40% n = 25
7 29.2% n = 24
Appendix C Page C-47
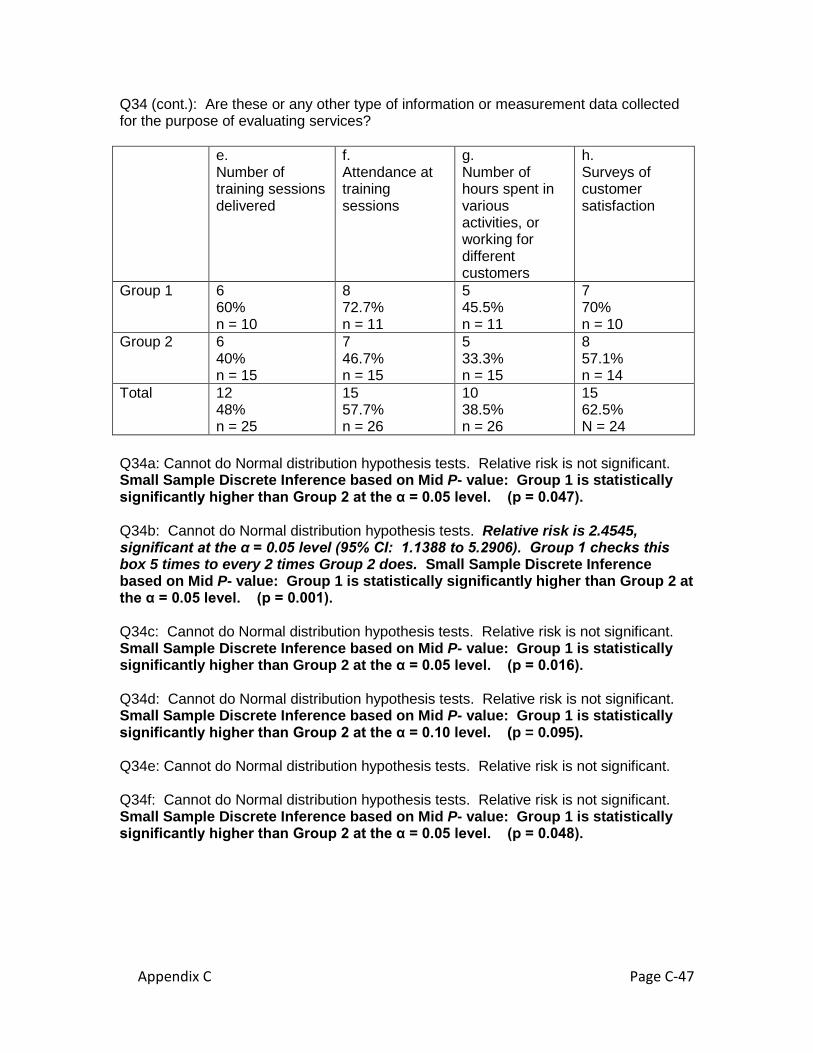
Q34 (cont.): Are these or any other type of information or measurement data collected for the purpose of evaluating services? e.
Number of training sessions delivered
f. Attendance at training sessions
g. Number of hours spent in various activities, or working for different customers
h. Surveys of customer satisfaction
Group 1 6 60% n = 10
8 72.7% n = 11
5 45.5% n = 11
7 70% n = 10
Group 2 6 40% n = 15
7 46.7% n = 15
5 33.3% n = 15
8 57.1% n = 14
Total 12 48% n = 25
15 57.7% n = 26
10 38.5% n = 26
15 62.5% N = 24
Q34a: Cannot do Normal distribution hypothesis tests. Relative risk is not significant. Small Sample Discrete Inference based on Mid P- value: Group 1 is statistically significantly higher than Group 2 at the α = 0.05 level. (p = 0.047). Q34b: Cannot do Normal distribution hypothesis tests. Relative risk is 2.4545, significant at the α = 0.05 level (95% CI: 1.1388 to 5.2906). Group 1 checks this box 5 times to every 2 times Group 2 does. Small Sample Discrete Inference based on Mid P- value: Group 1 is statistically significantly higher than Group 2 at the α = 0.05 level. (p = 0.001). Q34c: Cannot do Normal distribution hypothesis tests. Relative risk is not significant. Small Sample Discrete Inference based on Mid P- value: Group 1 is statistically significantly higher than Group 2 at the α = 0.05 level. (p = 0.016). Q34d: Cannot do Normal distribution hypothesis tests. Relative risk is not significant. Small Sample Discrete Inference based on Mid P- value: Group 1 is statistically significantly higher than Group 2 at the α = 0.10 level. (p = 0.095). Q34e: Cannot do Normal distribution hypothesis tests. Relative risk is not significant. Q34f: Cannot do Normal distribution hypothesis tests. Relative risk is not significant. Small Sample Discrete Inference based on Mid P- value: Group 1 is statistically significantly higher than Group 2 at the α = 0.05 level. (p = 0.048).
Appendix C Page C-48
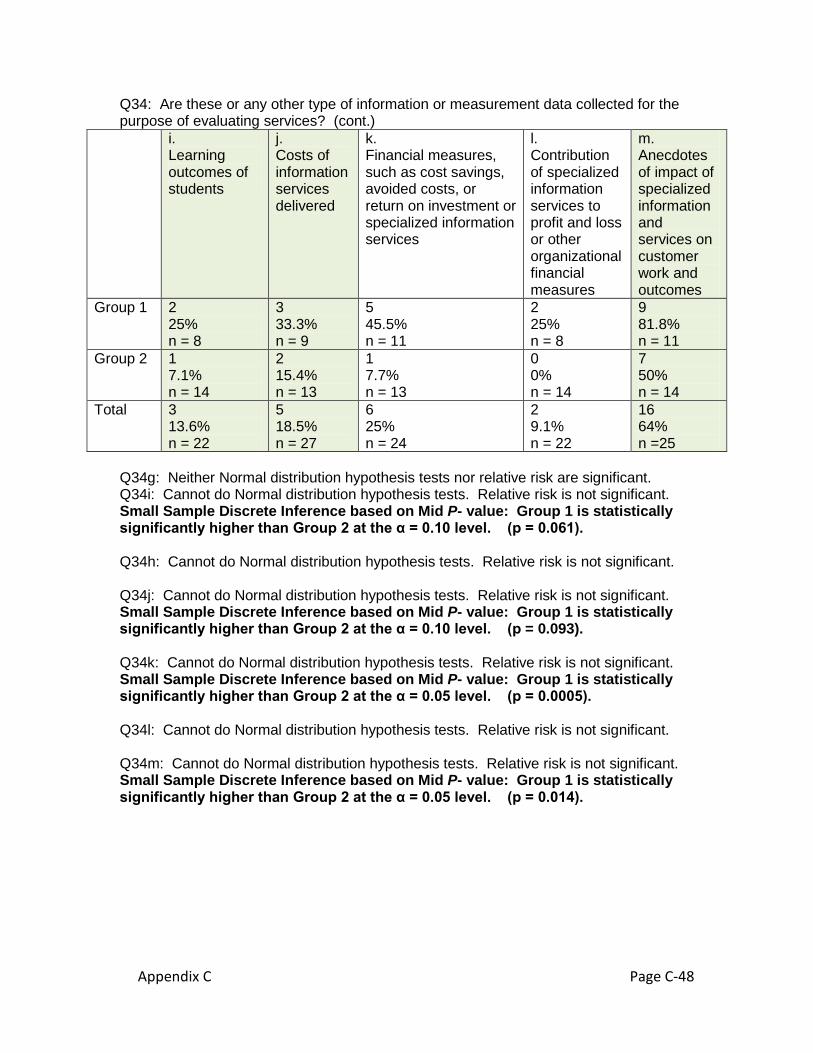
Q34: Are these or any other type of information or measurement data collected for the purpose of evaluating services? (cont.)
i. Learning outcomes of students
j. Costs of information services delivered
k. Financial measures, such as cost savings, avoided costs, or return on investment or specialized information services
l. Contribution of specialized information services to profit and loss or other organizational financial measures
m. Anecdotes of impact of specialized information and services on customer work and outcomes
Group 1 2 25% n = 8
3 33.3% n = 9
5 45.5% n = 11
2 25% n = 8
9 81.8% n = 11
Group 2 1 7.1% n = 14
2 15.4% n = 13
1 7.7% n = 13
0 0% n = 14
7 50% n = 14
Total 3 13.6% n = 22
5 18.5% n = 27
6 25% n = 24
2 9.1% n = 22
16 64% n =25
Q34g: Neither Normal distribution hypothesis tests nor relative risk are significant. Q34i: Cannot do Normal distribution hypothesis tests. Relative risk is not significant. Small Sample Discrete Inference based on Mid P- value: Group 1 is statistically significantly higher than Group 2 at the α = 0.10 level. (p = 0.061). Q34h: Cannot do Normal distribution hypothesis tests. Relative risk is not significant. Q34j: Cannot do Normal distribution hypothesis tests. Relative risk is not significant. Small Sample Discrete Inference based on Mid P- value: Group 1 is statistically significantly higher than Group 2 at the α = 0.10 level. (p = 0.093). Q34k: Cannot do Normal distribution hypothesis tests. Relative risk is not significant. Small Sample Discrete Inference based on Mid P- value: Group 1 is statistically significantly higher than Group 2 at the α = 0.05 level. (p = 0.0005). Q34l: Cannot do Normal distribution hypothesis tests. Relative risk is not significant. Q34m: Cannot do Normal distribution hypothesis tests. Relative risk is not significant. Small Sample Discrete Inference based on Mid P- value: Group 1 is statistically significantly higher than Group 2 at the α = 0.05 level. (p = 0.014).
Appendix C Page C-49
Q35: Is the measurement data used in any way to justify the continuation of specialized services to any of your individual customer groups?
Yes Group 1 8
88.9% n = 9
Group 2 3 33.3% n = 9
Total 11 61.1% n = 18
Q35: Cannot do Normal distribution hypothesis tests. Relative risk is 2.6667, significant at the α = 0.05 level (95% CI: 1.0289 to 6.9116). Group 1 checks this category almost 3 times as often as Group 2. Small Sample Discrete Inference
Appendix C Page C-50
based on Mid P- value: Group 1 is statistically significantly higher than Group 2 at the α = 0.05 level. (p = 0.0005). Q36: Are any of your individual customer groups involved in your
performance review in any way, or do you not receive a formal performance review?
a. I do not receive a formal performance review
b. I receive a formal performance review and my customer group(s) is solely responsible for it
c. I receive a formal performance review and my customer group(s) shares responsibility for it with someone else outside the customer group.
d. I receive a formal performance review and my customer group contributes feedback to it, but someone else outside my customer group is responsible for it
e. I receive a formal performance review but my customer group does not contribute any feedback to it; someone else outside my customer group has sole responsibility for my performance review.
Group 1 0 0% n = 11
0 0% n = 11
0 0% n = 11
7 63.6% n = 11
4 36.4% n = 11
Group 2 0 0% n = 15
1 6.7% n = 15
0 0% n = 15
5 33.3% n = 15
9 60% n = 15
Total 0 0% n = 26
1 3.8% n = 26
0 0% n = 26
12 46.2% n = 26
13 50% n = 26
Q36b: Cannot do Normal distribution hypothesis tests. Relative risk is not significant. Q36d: Cannot do Normal distribution hypothesis tests. Relative risk is not significant. Small Sample Discrete Inference based on Mid P- value: Group 1 is statistically significantly higher than Group 2 at the α = 0.05 level. (p = 0.023). Q36e: Cannot do Normal distribution hypothesis tests. Relative risk is not significant. Small Sample Discrete Inference based on Mid P- value: Group 1 is statistically significantly higher than Group 2 at the α = 0.10 level. (p = 0.064). Q34f: Cannot do Normal distribution hypothesis tests. Relative risk is not significant. Small Sample Discrete Inference based on Mid P- value: Group 1 is statistically significantly lower than Group 2 at the α = 0.10 level. (p = 0.064).
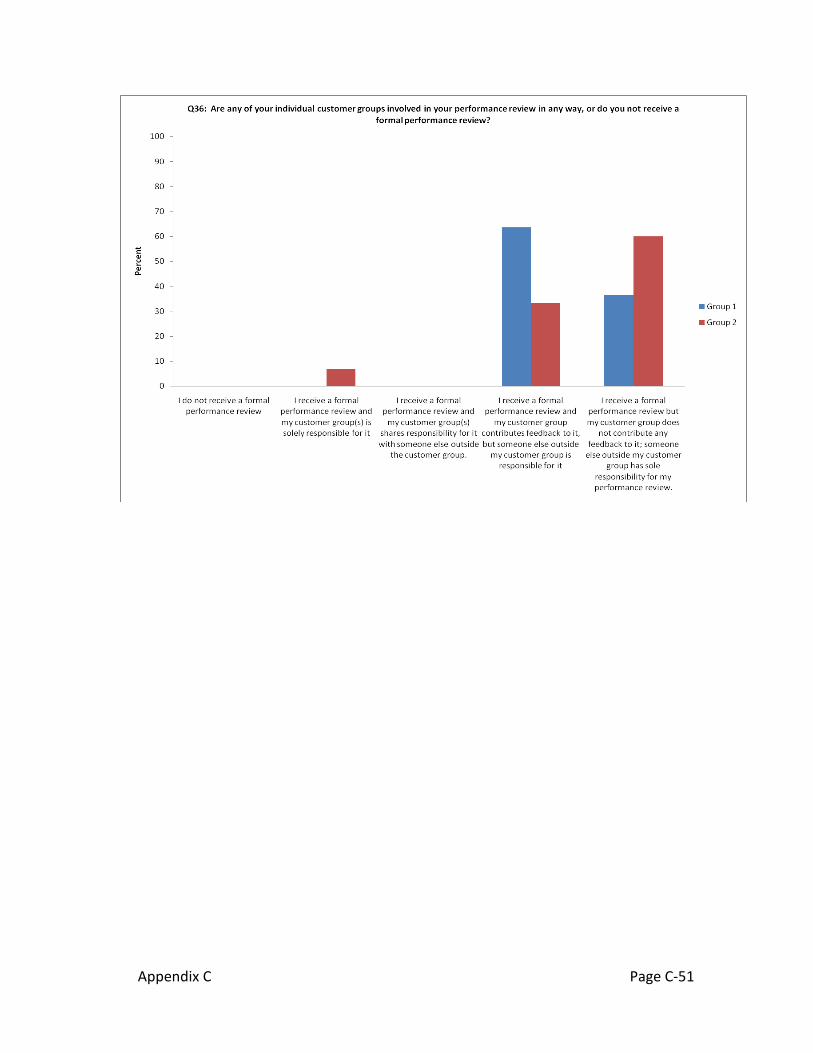
Appendix C Page C-51