Modelling intermediate age and old stellar populations in ... · PDF fileModelling...
14
Astron. Astrophys. 332, 135–148 (1998) ASTRONOMY AND ASTROPHYSICS Modelling intermediate age and old stellar populations in the Infrared A. Bressan 1 , G.L. Granato 1 , and L. Silva 2 1 Astronomical Observatory, Vicolo dell’Osservatorio 5, I-35122 Padova, Italy 2 ISAS, Trieste, Via Beirut n.2-4, I-34013 Trieste, Italy Received 9 July 1997 / Accepted 14 October 1997 Abstract. In this paper we have investigated the spectro- photometric properties of the Asymptotic Giant Branch (AGB) stars and their contribution to the integrated infrared emission in simple stellar populations (SSP). Adopting analytical relations describing the evolution of these stars in the HR diagram and empirical relations for the mass-loss rate and the wind terminal velocity, we were able to model the effects of the dusty enve- lope around these stars, with a minimal number of parameters. After deriving simple scaling relations which allow us to ac- count for the metallicity of the star, we computed isochrones at different age and initial metal content. We compare our models with existing infrared colors of M giants and Mira stars and with IRAS PSC data. The former data are fairly well reproduced by our models, though a possible inadequacy of the adopted at- mospheric models is indicated. Though being characterized by different metallicity, the isochrones follow a single path in the IRAS two color diagram, fixed by the composition and optical properties of the dust mixture. The bulk of the data in the latter diagram is delimited by the curves corresponding to a mixture of silicate grains and one of carbonaceous grains. We also dis- cuss the effects of detached shells of matter but we do not take into account this phenomenon in the present computations. Contrary to previous models, in the new isochrones the mass-loss rate, which establishes the duration of the AGB phase, also determines the spectral properties of the stars. The contri- bution of these stars to the integrated light of the population is thus obtained in a consistent way. We find that the emission in the mid infrared is about one order of magnitude larger when dust is taken into account in an intermediate age population, irrespective of the particular mixture adopted. The dependence of the integrated colors on the metallicity and age is discussed, with particular emphasis on the problem of age-metallicity de- generacy. We show that, contrary to the case of optical or near infrared colors, the adoption of a suitable pass-band in the mid infrared allows a fair separation of the two effects. We suggest intermediate redshift elliptical galaxies as possible targets of this method of solving the age-metallicity dilemma. Send offprint requests to: A. Bressan ([email protected]) The new SSP models constitute a first step in a more ex- tended study aimed at modelling the spectral properties of the galaxies from the ultraviolet to the far infrared. Key words: stars: fundamental parameters; mass-loss; AGB and post-AGB – dust, extinction – galaxies: stellar content – infrared: stars 1. Introduction Effects of dust in the envelopes of Mira and OH/IR stars are usually neglected in the spectrophotometric synthesis of a com- posite population, on the notion that the contribution of dust enshrouded stars to the integrated bolometric light is negligi- ble. While this can be justified in very old systems, it is not the case among intermediate age population clusters, whose bright- est tracers are indeed the asymptotic giant branch stars. In these stars, the light absorbed by the dust at optical wavelengths is reemitted in a broad region from a few to a few hundred mi- crons, where it overwhelms the stellar component. In addition to the thermal emission from the dust particles there are char- acteristic lines from molecules and often maser emission. Dust and molecular emission from these stars have been interpreted as a signature of an expanding circumstellar envelope, where gas particles reach the escape velocity giving rise to signifi- cant mass-loss (Salpeter 1974a,b, Goldreich & Scoville 1976, Elitzur et al. 1976). Mass loss measurements made by differ- ent authors and different techniques all agree with the notion that Mira and OH/IR stars constitute the final nuclear evolu- tionary phase where low and intermediate mass stars lose the whole envelope and turn toward the fate of a white dwarf. The process responsible of such a huge mass-loss is still unknown but, nowadays, there is a growing amount of evidence from both the observational and the theoretical point of view, that large amplitude pulsations coupled with radiation pressure on dust grains play a major role in determining the observed high mass-loss rates. From the observational side there exists a tight
Transcript of Modelling intermediate age and old stellar populations in ... · PDF fileModelling...
Astron. Astrophys. 332, 135–148 (1998) ASTRONOMYAND
ASTROPHYSICS
Modelling intermediate age and old stellar populationsin the InfraredA. Bressan1, G.L. Granato1, and L. Silva2
1 Astronomical Observatory, Vicolo dell’Osservatorio 5, I-35122 Padova, Italy2 ISAS, Trieste, Via Beirut n.2-4, I-34013 Trieste, Italy
Received 9 July 1997 / Accepted 14 October 1997
Abstract. In this paper we have investigated the spectro-photometric properties of the Asymptotic Giant Branch (AGB)stars and their contribution to the integrated infrared emission insimple stellar populations (SSP). Adopting analytical relationsdescribing the evolution of these stars in the HR diagram andempirical relations for the mass-loss rate and the wind terminalvelocity, we were able to model the effects of the dusty enve-lope around these stars, with a minimal number of parameters.After deriving simple scaling relations which allow us to ac-count for the metallicity of the star, we computed isochrones atdifferent age and initial metal content. We compare our modelswith existing infrared colors of M giants and Mira stars and withIRAS PSC data. The former data are fairly well reproduced byour models, though a possible inadequacy of the adopted at-mospheric models is indicated. Though being characterized bydifferent metallicity, the isochrones follow a single path in theIRAS two color diagram, fixed by the composition and opticalproperties of the dust mixture. The bulk of the data in the latterdiagram is delimited by the curves corresponding to a mixtureof silicate grains and one of carbonaceous grains. We also dis-cuss the effects of detached shells of matter but we do not takeinto account this phenomenon in the present computations.
Contrary to previous models, in the new isochrones themass-loss rate, which establishes the duration of the AGB phase,also determines the spectral properties of the stars. The contri-bution of these stars to the integrated light of the population isthus obtained in a consistent way. We find that the emission inthe mid infrared is about one order of magnitude larger whendust is taken into account in an intermediate age population,irrespective of the particular mixture adopted. The dependenceof the integrated colors on the metallicity and age is discussed,with particular emphasis on the problem of age-metallicity de-generacy. We show that, contrary to the case of optical or nearinfrared colors, the adoption of a suitable pass-band in the midinfrared allows a fair separation of the two effects. We suggestintermediate redshift elliptical galaxies as possible targets ofthis method of solving the age-metallicity dilemma.
Send offprint requests to: A. Bressan ([email protected])
The new SSP models constitute a first step in a more ex-tended study aimed at modelling the spectral properties of thegalaxies from the ultraviolet to the far infrared.
Key words: stars: fundamental parameters; mass-loss; AGBand post-AGB – dust, extinction – galaxies: stellar content –infrared: stars
1. Introduction
Effects of dust in the envelopes of Mira and OH/IR stars areusually neglected in the spectrophotometric synthesis of a com-posite population, on the notion that the contribution of dustenshrouded stars to the integrated bolometric light is negligi-ble. While this can be justified in very old systems, it is not thecase among intermediate age population clusters, whose bright-est tracers are indeed the asymptotic giant branch stars. In thesestars, the light absorbed by the dust at optical wavelengths isreemitted in a broad region from a few to a few hundred mi-crons, where it overwhelms the stellar component. In additionto the thermal emission from the dust particles there are char-acteristic lines from molecules and often maser emission. Dustand molecular emission from these stars have been interpretedas a signature of an expanding circumstellar envelope, wheregas particles reach the escape velocity giving rise to signifi-cant mass-loss (Salpeter 1974a,b, Goldreich & Scoville 1976,Elitzur et al. 1976). Mass loss measurements made by differ-ent authors and different techniques all agree with the notionthat Mira and OH/IR stars constitute the final nuclear evolu-tionary phase where low and intermediate mass stars lose thewhole envelope and turn toward the fate of a white dwarf. Theprocess responsible of such a huge mass-loss is still unknownbut, nowadays, there is a growing amount of evidence fromboth the observational and the theoretical point of view, thatlarge amplitude pulsations coupled with radiation pressure ondust grains play a major role in determining the observed highmass-loss rates. From the observational side there exists a tight
136 A. Bressan et al.: Modelling intermediate age and old stellar populations in the Infrared
correlation between the mass-loss rate and the period of pul-sation, even if the role of the amplitude of pulsations has notyet been exploited (see Habing 1996 for a thorough review onthe subject). On the other hand hydrodynamic models show thatlarge amplitude pulsations may levitate matter out to a radiuswhere radiation pressure on dust accelerates the gas beyond theescape velocity (Bowen & Willson 1991). Luminosity functionsof AGB stars in well studied populous clusters and fields of theLarge Magellanic Cloud (LMC) indicate that the mass loss alongthis phase is far larger than that predicted by the usual Reimerslaw which, on the contrary, successfully describes the evolu-tion along the red giant branch in old systems. A super-windphase (Fusi-Pecci & Renzini 1976) is often invoked to accountfor the paucity of bright AGB stars. A mass-loss rate exponen-tially increasing with time, naturally evolving into a super-windphenomenon, is obtained both by the hydrodynamic models ofBowen & Willson (1991), due to the growth rate of the densityscale height at the sonic point in the envelope, as well as by thesemiempirical treatment of Vassiliadis and Wood (1993-VW),as a consequence of the growth rate of the period of pulsationas the star climbs along the AGB losing its mass. Finally onlymass loss rates that include a super-wind phase, like those de-scribed above, can account for the relation between the initialstellar and final white dwarf mass (e.g. Weidemann 1987).
In spite of the tight link between the mass–loss rate andthe infrared emission among these objects very few attemptshave been made in providing a coherent picture of the photo-metric evolution of an AGB star toward its final fate. In partic-ular existing isochrones do not account for the effects of dustand molecules around AGB stars and are inadequate to studythe photometric properties of star clusters and galaxies whenand/or where these stars contribute a significant fraction of thelight. To cope with this difficulty we constructed a set of theo-retical models which account for the effects of the circumstellarenvelope and obtained a new set of theoretical isochrones par-ticularly suited for the analysis of the infrared and mid infrareddata.
We stress in advance that our viewpoint is different fromthat adopted in several previous studies devoted to the subject.Usually a physically sound model is constructed and fitted tothe available observations in order to obtain the characteristicparameters of the model such as the dust mass-loss rate, theeffective temperature, the grain composition and so on. Thegas mass–loss rate follows from the assumption of a value ofthe dust–to–gas ratio, or alternatively this latter quantity is ob-tained when the gas mass–loss rate is directly estimated fromother measurements. Models are thus applied and tuned to ob-servations of specific objects. This ensemble of data constitutesa statistical basis for the parameterization of the mass–loss rateas a function of the period of the stars, a relation that has recentlybeen widely adopted in model computations.
Here we will proceed along the opposite direction. We willassume that the mass–loss rate of AGB stars is known as a func-tion of the basic stellar parameters (mass, luminosity, radius) ei-ther from hydrodynamic models (e.g. Bowen & Willson 1991)or from empirical relations (VW). For a given dust to gas ratio
the mass-loss rate in dust is derived, and the spectrophotometricproperties of the envelope are computed from the given stellarspectrum and from the geometry and velocity of the matter flow.A series of photometric envelope models is then computed forseveral different basic parameters and adopted whenever nec-essary in the construction of the isochrones, in order to obtainboth the colors of the single stars and the integrated spectra.
The paper is organized as follows. Sect. 2 describes the en-velope model. Adopting a spherically symmetric stationary flowof matter the radiative transport equation is solved to derive theextinction and the emission of the dust as a function of the wave-length. The reliability of the model is tested by comparing it todata assembled from the literature. A monoparametric class ofmodels is constructed as a function of the optical depth of theenvelope τ at 1µm (thereinafter τ1) and a relation between theoptical depth τ1 and the basic stellar quantities (mass-loss rate,expansion velocity and luminosity) is obtained, in order to allowthe interpolation between two different stellar envelopes.
Sect. 3 describes the construction of the isochrones in thetheoretical HR diagram. Relations providing the mass-loss rateand the expansion velocity are adapted from Vassiliadis & Wood(1993) with some minor modifications suggested by the com-parison of our envelope model with existing observations ofstars in the Magellanic Clouds and in our galaxy: in both thesuper-wind mass-loss rate and the velocity period relation weinclude a suitable dependence on the metallicity.
In Sect. 4 we describe the spectrophotometric properties ofthe isochrones. For the evolutionary phases before the AGB,the method is identical to the one adopted by Bressan et al.(1994). Along the AGB the suitable envelope model is appliedto the otherwise unaffected stellar spectrum and absorption andreemission by dust is then included in the model as it movesalong the AGB phase. In this way we are able to obtain con-sistent isochrones and corresponding integrated spectra in themid infrared dominion. We compare our isochrones of differ-ent ages and metallicity with the IRAS two color diagram anddiscuss the reliability of our sequence of envelope models. Webriefly discuss the difficulty of a monoparametric sequence ofenvelopes with varying optical depth τ1 to interpret the IRAStwo color diagram, already encountered by other authors (Be-dijn 1987, Ivezic & Elitzur 1995). The comparison with nearinfrared colors of a sample of M giants and Miras shows thatthe inclusion of the dust constitutes a significant improvementwith respect to previous models.
Sect. 5 is devoted to the spectro-photometric integratedproperties of the simple stellar populations (SSP). In particu-lar we stress the difficulty to disentangle age and metallicityeffects from the analysis of the optical and near IR colors alone.However we show that extending the colors to the mid infraredmay solve the age-metallicity degeneracy at least in intermedi-ate age systems. Possible targets where the new models shouldexploit their highest capabilities are thus intermediate redshiftelliptical galaxies where the stellar populations are only few Gyrold.

A. Bressan et al.: Modelling intermediate age and old stellar populations in the Infrared 137
2. The dust envelope model
Radiative transfer in dusty shells around “windy” stars has beenpreviously considered by many authors (see Habing, 1996 andreferences therein). The most advanced approaches couple theradiative transfer and the hydrodynamic equations of motionfor the two interacting fluids of the wind, the gas and the dust(Habing et al. 1994; Ivezic & Elitzur 1995). This is necessary toachieve a fully consistent solution, because the radiation pres-sure on dust grains is widely believed to be the main driver ofthe high M observed in OH/IR stars.
However our interest here is to “correct” the stellar spec-tra predicted by standard evolutionary tracks by including theeffects of dusty envelopes associated with AGB mass-loss. Weneed therefore a recipe, consistent with available observations,to associate the fundamental parameters of the star, such asmass-loss, escape-velocity, luminosity, radius and metallicity,with the geometrical parameters of its dusty shell most rele-vant in determining the spectral effects. Along an isochrone thestellar parameters will change according to some specified rela-tions that will be discussed in the following section, along withthe procedure of assigning each point of the isochrone the mostadequate envelope model. Here we will assume that the lumi-nosity, the radius, the mass-loss rate, the escape velocity and thedust to gas ratio of the model are known, and we will derive thecorresponding spectral properties of the dust envelope.
We adopt spherical symmetry and, in a first order picture,an outflow velocity vexp independent of radius. Thus for a givenM , the dust density outside the sublimation radius rin whereinthe grains are supposed to form suddenly, scales as r−2:
ρd(r) =Mδ
4πvexp
1r2
(1)
where δ is the assumed dust–to–gas mass ratio. The envelopeextends out to a radius rout = 1000 rin.
We also test the effects of the presence of an expanding0.02 M shell of matter superimposed to the standard r−2 law.However these effects will not be taken into account in our SSPmodels and are only meant to illustrate uncertainties broughtabout by transient phenomena. Adopting a gaussian profile forthe density enhancement due to the annulus alone, centered atra < rout (the outer radius of the dust distribution) and withcharacteristic width ∆ra, the total dust density becomes
ρd(r) =Mδ
4πvexp
1r2
[1 + f × e
−(r−ra∆ra
)2]. (2)
It is straightforward to relate the constant f to the mass ∆Ma
(=0.02 M) in the annulus:
∆Ma =M f
vexp
∫ rout
rin
e−(r−ra∆ra
)2
dr (3)
To mimic an outward moving density enhancement, we com-puted three models with ∆ra = 0.1 rout and ra = 0.2 rout,ra = 0.5 rout and ra = 0.8 rout. Note that the correspond-ing density enhancement barely affects the optical depth of the
Table 1. Parameters of the adopted grain mixture.
Type a [µm] D [gr/cm3] X Ts [K]Mixture A
Amorph. Sil. . . 0.1 2.50 0.781 1000Silicate . . . . . . . 0.03 2.50 0.189 1000Silicate . . . . . . . 0.01 2.50 0.030 1000
Mixture BAmorph. Carb. 0.1 2.26 0.398 1500Graphite . . . . . . 0.03 2.26 0.258 1500Graphite . . . . . . 0.01 2.26 0.344 1500
envelope, though it may affect the emission in a given spec-tral region. Indeed the fraction of column density due to theenhancement in the annulus is ' 3 × 10⁻²f , ' 7 × 10⁻⁴fand ' 3× 10⁻⁴f , respectively, for the three adopted values ofra/rout. On the other hand the mass–loss rates relevant for thispaper are >∼ 10−5M/yr while typical values of the outflow
velocity are ≤ 20 km/s. Eq. 2 yields then f ≤ 5 which meansthat the optical depth is always dominated by the standard r−2
term.The parameters M and vexp entering into Eq. 2 are derived
from the fundamental stellar parameters as described in Sect. 3.The remaining problem is to estimate the dust to gas mass frac-tion δ. It is widely believed that the high mass loss rates in theAGB phase are driven by the transfer of momentum of photonsto the dust grains and then to the gas. Therefore a close relation-ship between the dust abundance and the velocity of the flowis expected. The problem has been studied carefully by Habinget al. (1994), who confirmed that the terminal velocity of thegas flow vexp depends rather strongly on δ. On the other handthey found also that the flow reaches rather quickly a velocityclose to vexp, in keeping with our previous assumption, and thatthe difference between the dust and the gas velocity is positiveand decreases with increasing M . At the high mass loss ratesmostly relevant for this work the two velocities are within 10%, and the results by Habing et al. can be well approximated bythe simple equation
(vexp
21 km/s
)'(
L
104L
)0.35 (δ
10−2
)0.5
(4)
which can be inverted to yield
δ ' 0.015 v2exp[km/s]
(L
L
)−0.7
(5)
This set of equations gives the dust density at each positionin the dusty shell as a function of the stellar parameters. Dustgrains absorb and scatter the stellar radiation, with an efficiencymuch greater in the optical-UV regime than in the IR, and rera-diate the absorbed energy at IR wavelengths. At the high massloss rates achieved in the super-wind phase, the involved densi-ties imply that the dust emission is self-absorbed, and thereforeto compute the emitted spectrum the radiative transfer problemmust be solved. The numerical code we use is described in detail
138 A. Bressan et al.: Modelling intermediate age and old stellar populations in the Infrared
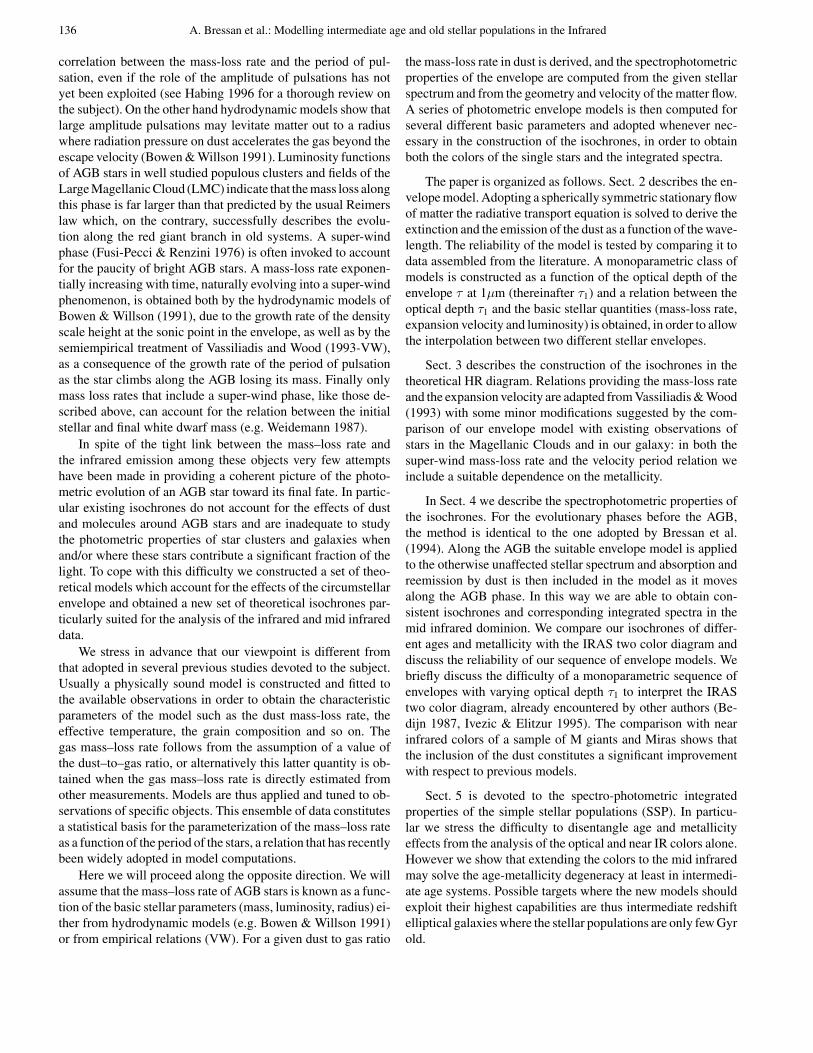
Fig. 1. A fit to the star AFGL230 (data from Justtanont & Tielens1992). The parameters of the fit are shown in Table 2. Continuousline: emerging spectrum; dotted line, coinciding with the continuousline in this case: dust emission; long dashed line: original photosphericspectrum (Teff=2500 K); short dashed line: extinguished photosphericspectrum.
by Granato & Danese (1994) and we summarize here only itsmain features. The transfer of radiation originating from a cen-tral source in an axisymmetric dust distribution is solved withthe lambda-iteration method: at each iteration the local temper-ature of dust grains is computed from the condition of thermalequilibrium with the radiation field estimated at the previousiteration. The convergence is speeded up with respect to thissimple scheme following the prescriptions given by Collison& Fix (1991). Moreover, in the present case, taking advantageof the spherical symmetry, the computing times are reduced byabout two orders of magnitude. The dust consists in a mixtureof different species of grains, which can be specified accordingto the needs. In this paper, when dealing with OH/IR stars, weuse the three silicate grains of the six-grain (three silicates plusthree carbonaceous) model defined by Rowan-Robinson (1986)(mixture A). This model provides a very simple but reasonablygood description of the absorption law of our Galaxy and offar-IR emission of galactic dust clouds. As for carbon stars, weused the three carbonaceous grains of the same model (mixtureB). The characteristics of the dust grains, type, dimension, den-sity, mass fraction and sublimation temperature are displayedin Table 1.
Our numerical code has been widely used in a different con-text, namely models of dusty tori around AGNs (see Granato etal. 1997 and references therein). Thus it is pretty well tested inthe more complex situation where spherical symmetry breaksdown. As a further check, we compared our results to the fitsprovided by other authors to OH/IR stars spectra such as Just-
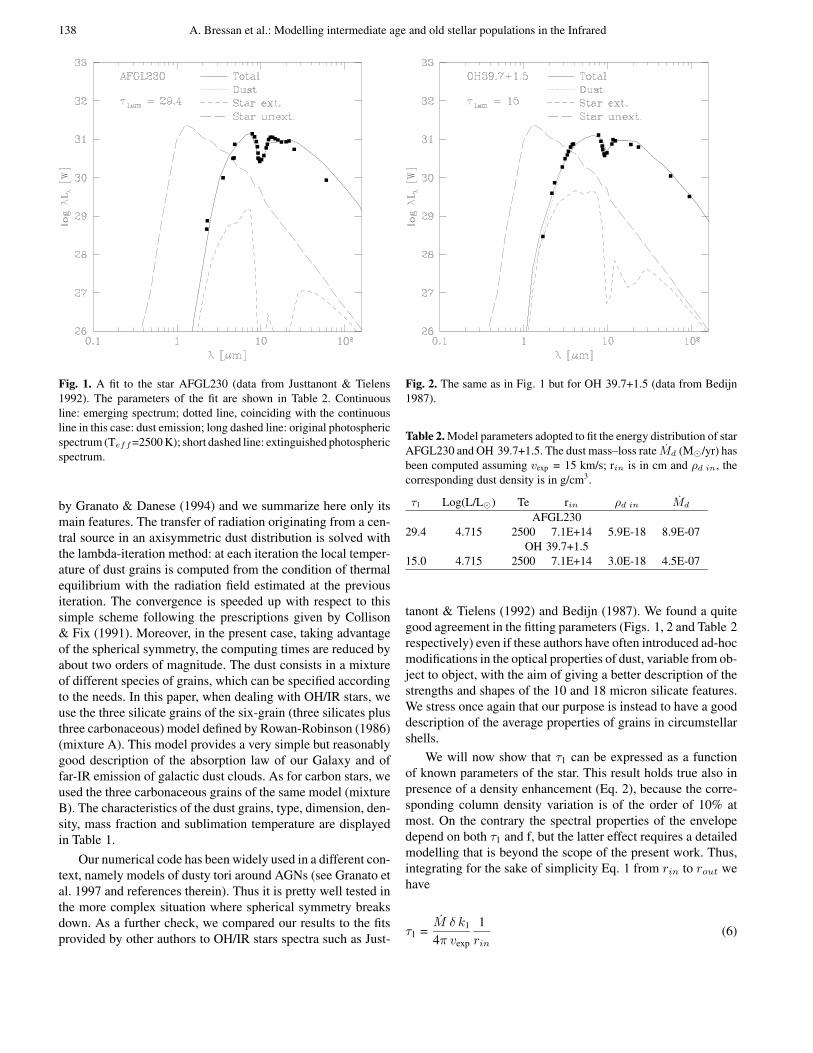
Fig. 2. The same as in Fig. 1 but for OH 39.7+1.5 (data from Bedijn1987).
Table 2. Model parameters adopted to fit the energy distribution of starAFGL230 and OH 39.7+1.5. The dust mass–loss rate Md (M/yr) hasbeen computed assuming vexp = 15 km/s; rin is in cm and ρd in, thecorresponding dust density is in g/cm3.
τ1 Log(L/L) Te rin ρd in Md
AFGL23029.4 4.715 2500 7.1E+14 5.9E-18 8.9E-07
OH 39.7+1.515.0 4.715 2500 7.1E+14 3.0E-18 4.5E-07
tanont & Tielens (1992) and Bedijn (1987). We found a quitegood agreement in the fitting parameters (Figs. 1, 2 and Table 2respectively) even if these authors have often introduced ad-hocmodifications in the optical properties of dust, variable from ob-ject to object, with the aim of giving a better description of thestrengths and shapes of the 10 and 18 micron silicate features.We stress once again that our purpose is instead to have a gooddescription of the average properties of grains in circumstellarshells.
We will now show that τ1 can be expressed as a functionof known parameters of the star. This result holds true also inpresence of a density enhancement (Eq. 2), because the corre-sponding column density variation is of the order of 10% atmost. On the contrary the spectral properties of the envelopedepend on both τ1 and f, but the latter effect requires a detailedmodelling that is beyond the scope of the present work. Thus,integrating for the sake of simplicity Eq. 1 from rin to rout wehave
τ1 =M δ k1
4π vexp
1rin
(6)

A. Bressan et al.: Modelling intermediate age and old stellar populations in the Infrared 139
where the term 1/rout has been neglected with respect to 1/rinand k1 is the dust opacity at 1 µm. On the other hand the dustsublimation radius is (Granato & Danese 1994)
rin = b L1/2 (7)
where the factor b depends mainly on the dust composition(through its melting temperature ∼ 1000 K for silicates and∼ 1500 K for graphite), the size distribution and only weaklyon the shape of the stellar spectrum. Typical values of b are 2–3×10¹² for silicates mixture and 1–2×10¹² for carbonaceousmixture.
Using this equation and Eq. 5 into Eq. 6 we get
τ1 = αM vexp
L1.2(8)
where vexp is in km/s, M in M/yr and L in L. The quantityα, which incorporates the dependence upon k1 and b, is affectedonly weakly by the spectrum of the illuminating star. For hotstars emitting mainly in optical UV regime, where the opticalproperties of dust do not show orders of magnitude variationswith the wavelength, the latter dependence would be quite negli-gible for practical purposes. By converse in our case (cold AGBstars) the situation is a bit less simple. We checked however withthe code that adopting α = 2.32× 10⁹ for the silicates mixtureand α = 9.85× 10⁹ for the carbonaceous mixture, the errors inτ1 estimated from Eq. 8 are kept within 5 % for stars with Teff
in the range 2500-4000. This is a fair approximation becausemodels with τ1 differing by less than 5-10 % produce almostidentical spectra.
In conclusion, with the machinery described in this section,we computed a sequence of envelope models, providing boththe extinction (τλ) and emission (Dλ) figures, as a function ofτ1 for two different dust mixtures.
We also derived a relation between τ1 and the luminosity,the expansion velocity vexp and the mass loss rate M of the star.How we obtain these quantities along an isochrone, is describedin the next section.
3. The isochrones
To investigate the infrared properties of SSPs we coupled thedusty envelope model described in the previous section with thelarge library of stellar evolutionary tracks existing in Padova.These tracks are computed for different values of the initialmetallicity, keeping constant and equal to the solar partition therelative proportion of the metals. The initial mass of the evolu-tionary tracks is in the range 0.6 to 120 M corresponding toages from few million yr. to several billion yr. Since the maininterest of this paper is to focus on the photometric properties ofAGB stars, isochrones have been computed only for intermedi-ate age and old stellar populations, thus between say 108 yr to16 · 109yr. The initial chemical composition of the evolutionarysequences adopted here (Bressan at al. 1993 and Fagotto et al.1994a, b), is [Z=0.004, Y=0.24], [Z=0.008, Y=0.25], [Z=0.02,Y=0.28], and [Z=0.05, Y=0.352], respectively.
The evolution of low mass stars is computed at constant massand mass loss is applied during the procedure of isochrones con-struction. The mass-loss rate along the RGB is parameterizedby the usual Reimers formulation with η=0.45.
Since the Padova models do not extend into the thermallypulsating AGB phase (TP-AGB), an analytic description isadopted to complete the isochrones up to the phase of the for-mation of the planetary nebula. We adopt the analytic proce-dure of Bertelli et al. (1994) which rests on some well definedrelations provided by full numerical calculations, namely thecore-mass luminosity relation and the reference AGB locus inthe Hertzsprung-Russell (HR) diagram as a function of the massand metallicity of the star (see e.g. VW).
3.1. Mass-loss rate along the AGB
The mass-loss rate along the AGB is a key parameter for theevolution of these stars because it affects the lifetime and theaverage luminosity of the phase. Both these quantities bear onthe contribution of the whole phase to the integrated light be-cause the larger the mass-loss rate the shorter the lifetime of thephase, the dimmer its brightest stars and finally the lower thecontribution to the total light of the population. The mass-lossrate also affects the core mass of the subsequent post-AGB stars,hence the ultraviolet properties of the stellar population.
A great effort has been recently devoted to clarify the roleof the mass-loss on the evolution of stars along the AGB. Ithas been shown (Bowen & Willson 1991, VW, Blocker 1995a,Groenewegen & De Jong 1994, Marigo et al. 1996, 1997) thatthe mass-loss rate rises almost exponentially with time duringthe AGB phase and that sooner or later it turns into a superwindthat completely evaporates the envelope of the star, leaving abare core which then evolves toward very high temperatures.All bright AGB stars are known to be variables with ampli-tudes that may reach about a couple of magnitudes, and infraredobservations of Mira and OH/IR stars show the characteristicemission features of a dusty envelope suggesting that pulsationsand dust may play an important role in the mass-loss process.However the actual mechanism which drives the mass-loss isstill presently not well understood. Moreover mass-loss rate de-terminations, derived mainly from IR and millimetric measure-ments, are characterized by a significant uncertainty, related tothe unknown distance of the source, the assumed dust to gasratio and the expansion velocity.
Recent hydrodynamic calculations (Bowen & Willson 1991,Willson et al. 1995) show that the shock waves generated bylarge amplitude pulsations of AGB stars levitate matter out toa radius where dust grains can condensate; from this point, ra-diation pressure on grains and subsequent energy redistributionby collisions, accelerate the matter beyond the escape velocity.In this model, the exponential growth of the mass-loss rate isentirely due to the variation of the density scale height below theacceleration region (Bowen & Willson 1991) as the star climbsalong the AGB. On the other hand a simple fit to the relationbetween the mass–loss–rate and the period along with the ana-lytical relations between period, mass, luminosity and effective
140 A. Bressan et al.: Modelling intermediate age and old stellar populations in the Infrared
temperature of an AGB star (see e.g. VW) show that the mass-loss rate increases exponentially with the luminosity and, abovea critical threshold, turns into a superwind limited only by thereservoir of the momentum in the radiation field.
Here we adopt the formalism of VW. Following their em-pirical relation, the mass loss rate M grows exponentially withthe pulsation period P until a constant upper limit is reached ata period of about 500 days, which corresponds to the superwindphase. The relation between the mass-loss rate and the periodhas been derived from observational determinations of mass-loss rates for Mira variables and pulsating OH/IR stars both inthe Galaxy and in the LMC. The two regimes are equivalent fora period of about 500 days for the solar composition.
The adopted relations are:
log M = −11.4 + 0.0123P (9)
Here and in the following, M is given in units of M yr−1,the stellar luminosityL is expressed inL, the pulsation periodP in days, c is the speed of light (in km s−1) and vexp (in kms−1) is the terminal velocity of stellar wind.
VW express the mass-loss rate in the superwind phase byequating the final mass momentum fluxMvexp to the momentumflux of the entire stellar luminosity, according to the radiation-driven-wind theory (Castor et al. 1975):
M = 6.07023 10−3βL
cvexp(10)
adopting β = 1. While the Galactic OH/IR stars suggest avalue of the order unity (Wood et al. 1992), there is no reasonwhy the same value should hold true for other environmentssuch as the LMC because, as clarified by Netzer and Elitzur(1993), the momentum transfer cannot constrain the value ofβ. Furthermore Wood et al. (1992) found that the expansionvelocity is clearly lower in more metal poor stars and concludedthat by adopting a constant value forβ one would predict that themass-loss increases at decreasing metallicity, contrary to whatis observed.
We thus included a metallicity dependence of the mass-lossrate in the superwind phase by imposing that β scales linearlywith the metallicity Z and calibrated this dependence by fittingthe infrared spectrum of the OH/IR star TRM 60 in the LMC(Groenewegen et al. 1995). With our envelope model we estimatea value of τ1 of 8. Assuming a distance modulus for LMC (m-M) 0=18.5, the luminosity of the star is 5.4 104 L. Since theobserved expansion velocity of TRM 60 is 12 km s−1 (Woodet al. 1992) we get a dust mass-loss rate of 1.1 10−7M/yr. Toconvert it in gas mass-loss rate we derive from our scaling law(Eq. 5) a dust to gas ratio of 10−3 so that, assuming that thisobject is in a superwind phase, we get β = 1.13. If we furtheradopt a metallicity of Z=0.008 for this star (an average valuefor the LMC) we have:
M = 6.07023 10−3 L
cvexp× 1.13
Z
0.008(11)
For the Galactic OH/IR stars this relation implies that β ∼2,which is a suitable value (Wood et al. 1992).
As far as the expansion velocity is concerned, VW providethe following relation between the velocity vexp, (in km s−1) andthe period of the star
vexp = −13.5 + 0.056P (12)
with the additional constraint that vexp is greater than 3 km s−1,a lower limit typical of Mira and OH/IR stars. Furthermore VWconstrain the velocity to be less than the average value of 15km s−1, again a typical value for such stars. However, as shownby Wood et al. (1992), there seems to be a trend between theexpansion velocity and the period even for P ≥ 500 days (theperiod corresponding to vexp=15 km s−1 in the above equation)and, perhaps more important, there seems to be a trend withthe metallicity of the star, because the observations suggest thatvexp(LMC)=0.5-0.6 ×vexp(Galaxy). We thus let the maximumvelocity to depend on the period and the metallicity of the staraccording to the relation
vexp ≤ 6.5Z
0.008+ 0.00226P (13)
The slope of this relation has been derived from a linear fit to thedata for the Galactic OH/IR stars within 1o of the Galactic plane(Fig. 6 of Wood et al. 1992), while the metallicity dependenceof the zero point rests on the assumption that the few data forthe LMC OH/IR stars in the same figure obey the same relation-ship, however scaled to a lower metallicity Z=0.008 instead ofZ=0.02.
Finally the pulsation period P is derived from the period-mass-radius relation (see Eq. 4 in VW) which is obtained byassuming that variable AGB stars are pulsating in the funda-mental mode:
logP = −2.07 + 1.94 logR− 0.9 logM (14)
where the period P is given in days and the stellar radius R andmass M are expressed in solar units.
A final comment concerns the validity of the core-mass lu-minosity relation, which has been assumed here as one of therelations adopted to compute the analytic TP-AGB phase. It iswell known that hot bottom burning in stars of initial mass largerthan about 4 M causes a brightening of about 20% with re-spect to the usual core-mass luminosity relation. However theabove effect disappears when the star reaches the superwindphase (see e.g. VW) which is the most relevant for the presentpurpose. We also neglected the modulation of the luminosityintroduced by thermal pulses (e.g. Marigo et al. 1996, 1997)on the notion that also this effect constitutes a higher degree ofapproximation which is beyond the current scope as we need tokeep only a minimum number of free parameters at work.
3.2. The PAGB stars
As a consequence of the superwind phase the star eventuallyreaches a maximum luminosity after which it loses most of itsenvelope and rapidly evolves toward the so called Post-AGB

A. Bressan et al.: Modelling intermediate age and old stellar populations in the Infrared 141
path (PAGB). Thereafter the star reaches a maximum temper-ature at almost constant luminosity and then it cools and dimsalong the White Dwarf cooling sequence. The observed initial-final mass relation of PAGB stars (Weidemann 1987) constitutesa further test for the AGB phase and supports the kind of mass-loss rate adopted here (VW, Bertelli et al. 1994)
PAGB stars have been suggested as one of the main con-tributors to the integrated ultraviolet light of nearby ellipticalgalaxies. In the bulge of M31 their estimated contribution toUV light amounts to' 20%. However in M32 their number perunit UV light, as seen from the same HST FOC 1550 opticalcombination, is an order of magnitude lower. This indicates thatage and metallicity effects may significantly affect the contri-butions of the PAGB stars that are ultimately related to the AGBevolution.
Characteristic evolutionary paths of PAGB stars of dif-ferent mass and composition have been computed byPaczynski (1971), Schonberner (1981), Iben (1984), Blocker& Schonberner (1991), Fagotto et al. (1994) and Blocker(1995b). For the present isochrones we assembled the data fromSchonberner (1981), Blocker & Schonberner (1991), Fagotto etal. (1994), and Blocker (1995b).
4. Isochrones in the Infrared
Transformations from the theoretical to the observational planewere performed by making use of the stellar spectral library ofBressan et al. (1994), Silva (1995) and Tantalo et al. (1996).The core of the spectral library is the atlas by R. Kurucz (1993).At temperatures higher than Teff = 50, 000 K pure black-bodyspectra are adopted, whereas for stars cooler than Teff = 3500K the catalog of stellar fluxes by Fluks et al. (1994) is imple-mented. The latter library is based on stars of solar metallicity(Z ∼ 0.02) whereas the library of SSPs presented here spans therange of metallicity 0.004 ≤ Z ≤ 0.05. To account for a depen-dence on the metal content even for M giants, we adopted thesame library at different metallicities but assigned the spectralclass, identified by the (V-K) color, adopting the (V-K)-Teff re-lation of Bessell et al. (1991) which depends on the metallicity.
To account for the effect of dust along the TP-AGB weproceed in the following way. For a given temperature, lumi-nosity, mass and metallicity, making use of Eqs. 8 (and 3, whenrequired), we derive the value of τ1 and interpolate in our se-quence of envelope models, obtaining both the extinction (τλ)and emission (Dλ) figures. The characteristic stellar spectrumis then modified according to the relation
Fλ = Fλ × e−τλ + Dλ × L (15)
where the first factor in the RHS represents the extinction whilethe second one represents the dust emission. A final renormal-ization of the whole spectrum to the σT 4 relation is performedbut it usually amounts to a negligible correction, indicating thatthe whole procedure is sufficiently accurate.
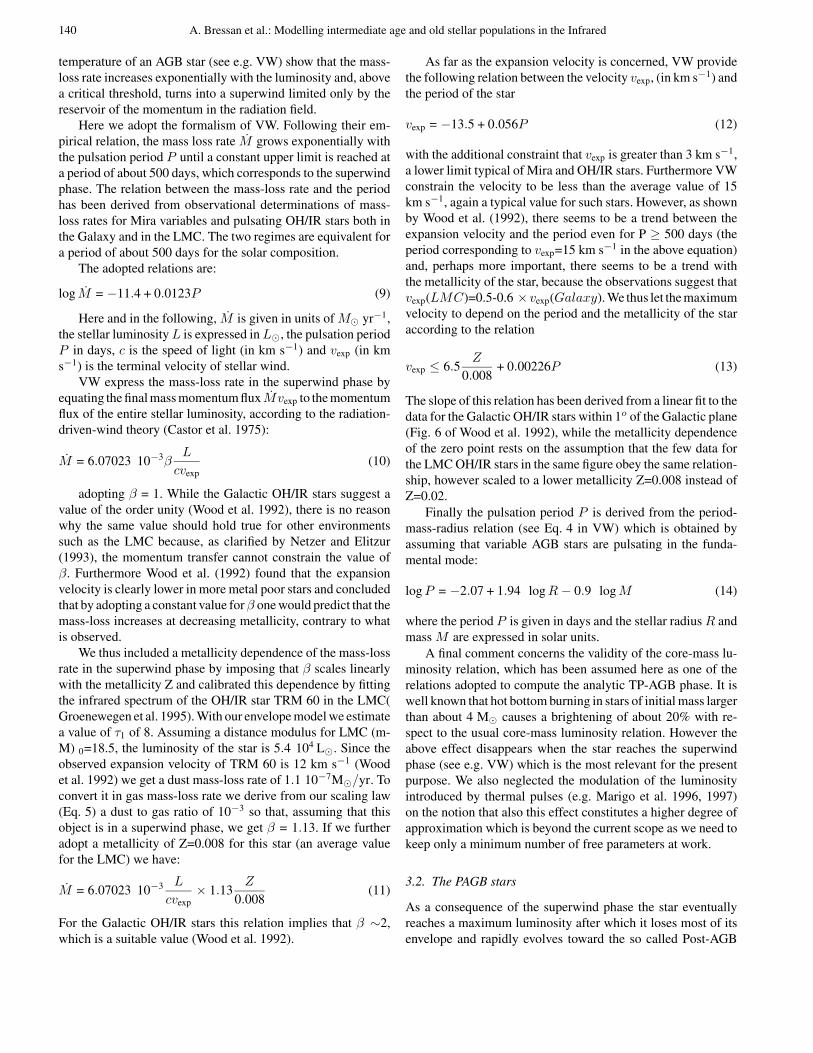
Before proceeding further we compare our results with theinfrared colors of Mira and OH/IR stars and discuss the reliabil-ity of our selected circumstellar envelope models. Fig. 3 shows
several isochrones of 1.5 Gyr and different metal content in thetwo color IRAS diagram, superimposed to the sample of IRASsources defined by Van der Veen & Habing (1988). The originalsample includes about 1400 sources for which [60]− [25] < 0and [25]− [12] < 0.6, these limits define the regions occupiedby galactic late type stars in the IRAS two color diagram. Inthe above notation [λ2]-[λ1]=log(Fλ2 /Fλ1 ). However, in orderto minimize contamination by cirrus emission, we excluded allthe sources with cirr3/F(60)>2 (Ivezic and Elitzur, 1995). Thesample plotted in Fig. 3 reduces to about 300 sources.
A thorough discussion of this diagram together with the re-gions occupied by galactic Mira and OH/IR stars can be found inHabing (1996). Fig. 3 reports data and models in form of mag-nitudes. Theoretical IRAS monochromatic fluxes were obtainedby convolving the stellar spectral energy distributions with theproper transmission curve as detailed in Bedijn (1987). IRASmagnitudes were thus derived according to
Mi = −2.5× Log(Si) + 2.5× Log(S0i) (16)
where Si is the flux in Jansky and the constants S0i are de-rived from the IRAS PSC-explanatory supplement (1988) andare 28.3 Jy, 6.73 Jy, 1.19 Jy and 0.43 for the 12, 25, 60 and 100µm passband respectively. This procedure is adopted to facili-tate the construction of mixed optical-IR two color diagrams asdescribed below.
Turning now to Fig. 3 we notice that, before reaching theAGB phase, the isochrones are confined in a small region delim-ited by two open circles, with both (m12-m25) and (m25-m60)'0. These figures correspond to the Rayleigh-Jeans spectralregime and indicate that this approximation is fairly accurate tillthe most advanced phases of the isochrone, where dust comesinto play. As the star reaches the thermally pulsating AGB phasethe effect of mass-loss suddenly increases and the circumstellarenvelope starts to modify the spectral emission. The first enve-lope model corresponds to τ1=0.01 and it is indicated by a filledsquare at (m12-m25)'0.6 and (m25-m60)'-0.1 for the case ofthe silicate mixture and by a filled triangle at (m12-m25) '0.2and (m25-m60) '0.35 for the carbonaceous mixture, respec-tively.
Fig. 3 depicts isochrones of different metallicity but theyare barely distinguishable in this diagram. This is because ourenvelope models are characterized by a single parameter, theoptical depth, so that different conditions resulting in the samevalue of τ1, such as metallicity, mass-loss rate and expansionvelocity, provide the same dust envelope and in turn give riseto the same overall spectrum. In contrast, a noticeable featureof this diagram is the dispersion of the data. Ivezic & Elitzur(1995) thoroughly discussed this problem and they were ableto show that the bulk of the data are delimited by the τ1 curvescorresponding to grains of either pure silicates or graphite. Thethick dashed line in Fig. 3 refers to an isochrone we computedaccounting for carbonaceous grains only, characteristic of Crich stars, and it is meant to illustrate the effects of the variationof the chemical composition of the dust. Thus we confirm theresults of Ivezic & Elitzur (1995). Fig. 3 also depicts the pathan AGB star would follow during a shell ejection of 0.02 M,
142 A. Bressan et al.: Modelling intermediate age and old stellar populations in the Infrared
Fig. 3. Two color diagram of the sam-ple of IRAS sources defined by Vander Veen & Habing (1988). FollowingIvezic and Elitzur (1995) the sources withcirr3/F(60)>2 have been excluded in or-der to minimize contamination by cir-rus emission. Superimposed are 1.5 Gyrisochrones of different metallicity and amodel of an AGB star with Teff=2500K,LogL/L=4, τ1=1 and vexp=15 km/s(empty star), surrounded by an expand-ing shell of 0.02M at 0.2, 0.5 and 0.8rout (arrows). See text for more details.
and it is meant to illustrate additional effects possibly at workwhich however, are difficult to predict on the basis of simplestellar parameters.
It is remarkable that isochrones of different metallicity andage reach different maximum values of τ1. The larger the metal-licity the higher the value of τ1 and the further the isochroneextends in the IRAS two color diagram. The largest value of τ1
reached by models of different metallicity are indicated in Fig. 3by a filled square (τ1=4.4), a filled circle (τ1=11.1), an open tri-angle (τ1=22.3) and an open square (τ1=57.5) for the metallicityZ=0.004, Z=0.008, Z=0.02, Z=0.05 respectively. The filled tri-angle at (m12-m25)'1.7 and (m25-m60)'0.9 refers to the caseof Z=0.02 and a mixture of carbonaceous dust grains (τ1=99).
In summary, while we analyzed both the case of a differentmixture and a shell enhancement, we consider the ability of oursimple models to reproduce the bulk of the data in the IRAS twocolor diagram as a meaningful test of reliability, also in viewof the errors on the quoted fluxes (' 5%) reported in the IRASPSC-explanatory supplement (1988).
To check the behavior of our models in the near infraredregion of the spectrum, we have also compared our isochroneswith a sample of M giants and Miras in the Southern Polar Cap,for which Whitelock et al. (1994, 1995) obtained J, H, K and Lmagnitudes. Fig. 4 shows the two color (J-H)–(H-K) diagramof M giants (filled squares) and Miras (filled triangles) in the
Southern Polar Cap (Whitelock et al. 1994, 1995) superimposedto some selected isochrones at different age and metallicity. Boththe bulk of the M giants at (J-H) '1 and (H-K)'0.3 and thoseof Miras sample are well reproduced by the models. The fit tothe latter sample however depends on the adopted temperaturescale, in particular to the temperature assigned to the more ad-vanced M spectral types of the Fluks atlas. Only by reachingthe most advanced spectral types during the superwind phasewe are able to match the Miras in Fig. 4, as can be seen from thelocation of our adopted M giant spectra (large filled circles inthe figure). Assigning a metallicity on the basis of the isochronefitting of near infrared colors is thus a quite delicate process,whose reliability must be clearly improved by more accurateatmospheric models. Note that in our case the bulk of Mira starsare well fitted by models of solar metallicity, while it is impos-sible to assign a metallicity to the M giants. Finally notice thatthe highly reddened data are relatively well fitted by our dustymodels. On the contrary isochrones based on pure photosphericmodels would never be able to fit the data, as can be seen fromthe location of late type giants of our spectral library.
Fig. 5 is analogous to Fig. 4 but for the colors (J-K)–(K-L).Here the fit to the Mira sample is poor, suggesting that the prob-lem for the latter stars may be related to the adopted atmosphericmodels (see also Bessell et al. 1991 and Whitelock et al. 1994).

A. Bressan et al.: Modelling intermediate age and old stellar populations in the Infrared 143
Fig. 4. (J-H)-(H-K) two color diagram of a sample of galactic M(squares) and Mira (triangles) stars from Whitelock et al. (1994, 1995).Superimposed are some selected isochrones of 1.5 Gyr with metallicityZ=0.004 (long-dashed line), Z=0.008 (short-dashed line), Z=0.02 (con-tinuous line) and Z=0.05 (dotted line) for the mixture A, and Z=0.02(long-short dashed line) for the mixture B. Large filled dots indicatethe location of the adopted M giant atmospheric models.
However, as in the previous case, the fit improves significantlyat high optical depth.
5. Integrated colors: the age-metallicity degeneracy
Once the spectrum of a single star is obtained it is weightedby the appropriate number of stars in the elemental interval ofthe isochrone and summed up to obtain the integrated spectrumof the SSP. Throughout this paper we adopted a Salpeter initialmass function
φ(M )dM ∝M−xdM (17)
with x=2.35. The integration is performed from Minf=0.15 upto the largest initial mass which still contributes to the integratedspectrum of the isochrone.
5.1. Integrated spectra
The integrated spectra Fν vs. λ in µm of SSP of 0.2 1.5 and5 Gyr are shown in Fig. 6. In each panel three cases are de-picted. In the standard SSP (dot-dashed line) the effects of dustycircumstellar envelopes around Mira and OH/IR stars are ne-glected. In the other two cases the circumstellar envelopes havebeen included in modelling the AGB phase. The continuous linerefers to the mixture of silicate grains (mixture A) and it is wellsuited for an AGB dominated by M giants, while the dashedline represents models computed with the mixture of carbona-ceous grains (mixture B) and should be more appropriate for
Fig. 5. Same as in Fig. 4 but for the (J-K) and (K-L) colors
a population rich in C-stars. In the latter case the mid infraredspectra are featureless as it is expected from the optical proper-ties of the carbonaceous grains (note however that our mixturedo not include PAH molecules, whose possible formation in thephotosphere of C-stars is discussed by Helling et al. 1996).
Differences with respect to the standard SSP appear beyonda few µm where the contribution of the brightest AGB stars tothe integrated light of the stellar population is large. After a de-crease of the flux in the region from 1 to 3µm because the bright-est stars are heavily obscured by their circumstellar envelopes,at larger wavelengths the contribution of the dust dominates,reaching an order of magnitude at 10 µm over the pure photo-spheric models. While there are clear differences between thetwo selected dust mixtures, they constitute a modulation overthe main effect brought about by the inclusion of the dust in theenvelope. At increasing age the relative contribution of AGBstars to the integrated light decreases and, correspondingly, theinclusion of a proper circumstellar envelope becomes less andless important.
Metallicity effects are depicted in Fig. 7 where we plotSSPs of 3 Gyr for Z=0.008, Z=0.02 and Z=0.05 as indicated inthe corresponding panels. It can be noticed that the dust emis-sion progressively shifts toward larger wavelengths as the metalcontent increases, indicating that the spectra are dominated bycooler dust envelopes. The metallicity affects the properties ofthe dust envelope through Eq. 8. By combining this equationwith Eq. 11, describing the super-wind phase, it is easy to showthat the optical depth of the envelope is a linear function of themetallicity Z and the maximum value of τ attainable at a givenmetallicity scales as L−0.2. Thus in the superwind phase, moremetal rich isochrones are characterized by a larger value of theoptical depth. Moreover at a given metallicity, older isochronesreach a larger value of the maximum optical depth, but this ef-

144 A. Bressan et al.: Modelling intermediate age and old stellar populations in the Infrared
Fig. 6. Integrated spectrum Fν vs. λ in µm of SSPs of 0.2 Gyr 1.5 Gyrand 5 Gyr and solar composition. Three cases are depicted. In the firstcase dust is not taken in to account (dot-dashed line), in the seconddust is a mixture of silicates grains (continuous line), and in the thirddust is a mixture of carbonaceous grains (dashed line).
fect is compensated by the lower contribution of the AGB phaseto the integrated light of the population.
5.2. Integrated colors
Accurate analysis of the integrated properties of SSPs at opti-cal wavelengths have been done in a number of recent studies(Bertelli et al. 1994, Bressan et al. 1994, Tantalo et al. 1996,Charlot et al. 1996). Fig. 8 depicts optical and near IR two colorplots of SSPs at different age and metallicity and reveals one ofthe major problems encountered when working with integratedproperties: age and metallicity vectors are almost superimposedin these diagrams and it is virtually impossible to disentanglethe two effects. In particular, because one of the applications ofthe concept of SSP is concerned with the age derivation of earlytype galaxies, this means that once a set of observed colors ornarrow band indices are fitted with models of a given metal-licity, there is always the possibility that either a younger butmore metal rich population or an older but more metal poor oneprovides an equally acceptable fit. This effect has been knownfor a long time and it is the main source of uncertainty in de-riving absolute ages of early-type galaxies (Bressan et al. 1994,Gonzales 1993 , Charlot et al. 1996). Therefore finding a pairof indices whose age and metallicity behavior is orthogonal,would allow a separation of these effects and would provide
Fig. 7. The same as in Fig. 6 but for a fixed age of 3 Gyr and metallicityZ=0.008, Z=0.02 and Z=0.05, respectively.
an unambiguous estimate of both the age and metallicity of acomplex stellar system.
Worthey et al. (1994) were able to show that one such pairis provided by Hβ and MgFe indices. In the plane defined byHβ and MgFe indices the field elliptical galaxies analyzed byWorthey et al. occupy a narrow band characterized by a smallrange in MgFe (an index mainly related to the global metallicity)and a range in Hβ corresponding to a significant dispersion inage (from 15 to few Gyr). Bressan et al. (1996) however pointedout that the Hβ index is very sensitive to recent episodes of starformation that may have interested only a tiny fraction of thegalaxy mass, so that the age of the bulk of the population is stillinaccessible through this method, implying that our view of theevolution of these objects still remains obscure. The degeneracyhas a major impact on the age determination of the high redshiftgalaxies, since one of the major challenges offered by nowa-days observations is to look at galaxies when their age is only afraction of that of the universe. Bender et al. (1995) measurednarrow band indices of early-type galaxies in clusters down toredshift z ≤0.3 finding that those systems are compatible withonly a passive evolution of their stellar populations. RecentlyFranceschini et al. (1997a) combining HST magnitudes withJHK and ISO 6.7 µm magnitude for a typical early-type galaxyin the Hubble Deep Field at redshift z'1 concluded that thebulk of the stellar population is about 4 Gyr old and as massiveas 4×10¹¹ M. A major episode of star formation must haveoccurred at redshift z = 1 + ∆ z4Gyr, which for a flat universe

A. Bressan et al.: Modelling intermediate age and old stellar populations in the Infrared 145
Fig. 8. Optical and near infrared two color diagrams of SSPs at varying age and metal content illustrating the problem of the age-metallicitydegeneracy. Age runs from 0.5 Gyr (top left) to 15 Gyr (bottom right) in steps of 0.5 Gyr up to 7 Gyr and thereafter in steps of 1 Gyr.
and H0=50 km/s/Mpc corresponds to z≥5 and for an open Ω=0universe and H0=50 km/sec/Mpc to z≥2.5. Our new SSP mod-els show that adopting a metal content larger by about the 50%would decrease the age from 4 Gyr to about 2 Gyr, and thecorresponding formation redshift would be z≤2 in both cases.While the obvious settling of the problem is on a statistical ba-sis, this example clearly illustrates a feasible test for the modelsof galaxy formation. Indeed, solar or even larger metallicities,as suggested by local observations of narrow band indices andultraviolet upturn (Bressan et al. 1994, 1996) in elliptical galax-ies and ages of few Gyr as determined by fitting the broad bandcolors of intermediate redshift objects, constitute the space ofparameters where the AGB population keeps its maximum ef-fect upon the integrated star light and it is possible that, becauseof the effect of the dust, the new SSP models are most indi-cated for solving the age metallicity degeneracy, provided thatsuitable pass-bands are selected.
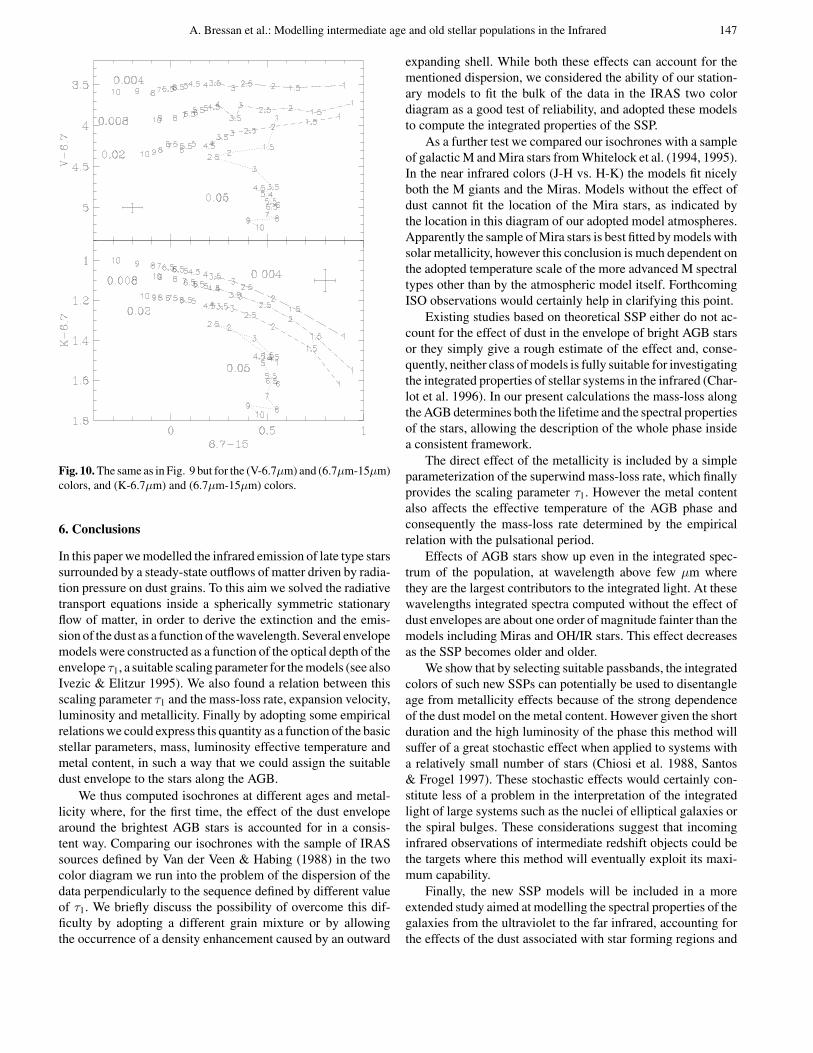
To illustrate the point, Fig. 9 and Fig. 10 show combinedoptical, near IR and mid IR two color diagrams of several SSPscomputed adopting the silicate mixture. The 6.7µm and 15µmmagnitudes are obtained by adopting a zero point flux of 94.7Jy and 17 Jy respectively and have been selected for compar-ison with ISO data. Fig. 9 depicts the run of the color (V-K)against the color (K-6.7) for different metallicities (Z=0.004,0.008, 0.02 and 0.05) and some selected ages. Above 1.5 Gyr the
different sequences are well separated, with leftmost sequencecorresponding to the lowest metal content and the rightmostone corresponding to Z=0.05. At intermediate ages the effectof the metallicity is clearly at odd with that of the age becauseAGB stars drive the mid IR fluxes of the composite populations.Younger isochrones are bluer in the (V-K) color but redder inthe (K-6.7) due to the effect of the dust, while more metal richisochrones are redder in both colors. This causes the breakingof the age-metallicity degeneracy. Such a behavior can be com-pared with that of optical and near infrared colors in order toappreciate the power of the diagnostic tool we are suggesting.Plotting the (V-K) color against (K-15µm) or (K-25µm) wouldprovide similar results, so that the corresponding figures are notshown here for sake of conciseness.
The (V-6.7) vs. (6.7-15) two color plot (upper panel ofFig. 10) is also a suitable diagnostic diagram. Note that there isa variation of more than half a magnitude in the (V-6.7) colorgoing from Z=0.004 to Z=0.02 at intermediate ages. In con-trast, optical colors change by less than 0.1 mag in the same agerange. Plotting an optical magnitude (e.g. V) seems required inorder to obtain useful diagnostic diagrams. Indeed inspectionof intermediate age SSPs show that while optical, near and midIR absolute magnitudes display the same trend with the age(they increase by about one magnitude going from 2 to 6 Gyr,irrespective of the metallicity), they behave differently with re-

146 A. Bressan et al.: Modelling intermediate age and old stellar populations in the Infrared
Fig. 9. A mixed optical (V), near (K) andmid (6.7µm) infrared two color diagramof SSPs. The metallicity Z is indicated inthe figure. Numbers along the curves in-dicate the age in Gyr. The error bar corre-sponds to a 5% and 10% uncertainty in theflux measurement in the near and mid IRrespectively. Due to dust effects in the en-velope of AGB stars, age and metallicitydifferences may be fairly well recognizedin intermediate age populations.
spect to the metallicity. Optical magnitudes become fainter asthe metallicity increases, but the trend inverts when near IRbands are considered and at 6.7µm, 15µm and 25µm there isa remarkable brightening with the metallicity (dust makes theSSP more bright at increasing metallicity). The lower panel ofFig. 10 contrasts the (K-6.7) color instead of the (V-6.7) one.Disentangling age and metallicity effects becomes now moredifficult, because the fluxes in the selected passbands show thesame behavior with respect to the metallicity.
While both the (V-K) vs. (K-6.7) and the (V-6.7) vs. (6.7-15)two color plots seem well suited for the purpose of disentanglingage and metallicity effects, some cautionary notes are necessaryat this point.
First of all we have assumed a linear dependence on themetallicity of the fraction of the momentum carried out by ra-diation responsible for the dust acceleration in the superwindphase. This affects, in particular, τ1 for the most metal richpopulations and it is responsible of the odd behavior of the cor-responding models in the two color plots. Such a relation shouldbe tested against forthcoming ISO observation of AGB stars.
Furthermore, SSPs with different dust mixture display dif-ferent IR spectra (Figs. 6 and 7); in particular the SSPs withthe silicates mixture show features around 10-20 µm. Leavingaside the problem of the dust composition in real cool stellarenvelopes, it is clear that the relative percentage of O-rich and
C-rich stars may affect the mid IR shape of the integrated spec-trum. When an O star becomes a C star (III dredge-up) andeventually turns again into an O star (hot bottom burning), andhow it depends on the metallicity of the environment is stilla matter of debate. We neglected transient phenomena such asshell ejection or luminosity dip, that may also affect the infraredcolors of the star (e.g. Fig. 3). Detailed modelling of such effectsis underway (Marigo et al., in preparation).
Some sort of dilution due to a range in age and metal contentshould be present in the spectrum of a composite system, how-ever this could be of minor importance for early type galaxies iflow metallicity stars are practically absent (Bressan et al. 1994)and the formation time is short, as suggested by the observedenhanced composition (Bressan et al. 1996, Tantalo et al. 1997).
Finally, environmental effects should be considered whenadopting these models to interpret the colors of galaxies. Thepresence of a low level star formation activity could mask theinfrared AGB emission. But the opposite is also true: the modelsindicate that the mid IR emission of an intermediate age popu-lation alone is up to an order of magnitude larger than predictedby pure photospheric models. Also the presence of a diffuse gasphase, the cirrus component, could dominate the galactic spec-trum beyond 20 µm. All these phenomena are the subject of aforthcoming investigation (Silva et al. 1997).
A. Bressan et al.: Modelling intermediate age and old stellar populations in the Infrared 147
Fig. 10. The same as in Fig. 9 but for the (V-6.7µm) and (6.7µm-15µm)colors, and (K-6.7µm) and (6.7µm-15µm) colors.
6. Conclusions
In this paper we modelled the infrared emission of late type starssurrounded by a steady-state outflows of matter driven by radia-tion pressure on dust grains. To this aim we solved the radiativetransport equations inside a spherically symmetric stationaryflow of matter, in order to derive the extinction and the emis-sion of the dust as a function of the wavelength. Several envelopemodels were constructed as a function of the optical depth of theenvelope τ1, a suitable scaling parameter for the models (see alsoIvezic & Elitzur 1995). We also found a relation between thisscaling parameter τ1 and the mass-loss rate, expansion velocity,luminosity and metallicity. Finally by adopting some empiricalrelations we could express this quantity as a function of the basicstellar parameters, mass, luminosity effective temperature andmetal content, in such a way that we could assign the suitabledust envelope to the stars along the AGB.
We thus computed isochrones at different ages and metal-licity where, for the first time, the effect of the dust envelopearound the brightest AGB stars is accounted for in a consis-tent way. Comparing our isochrones with the sample of IRASsources defined by Van der Veen & Habing (1988) in the twocolor diagram we run into the problem of the dispersion of thedata perpendicularly to the sequence defined by different valueof τ1. We briefly discuss the possibility of overcome this dif-ficulty by adopting a different grain mixture or by allowingthe occurrence of a density enhancement caused by an outward
expanding shell. While both these effects can account for thementioned dispersion, we considered the ability of our station-ary models to fit the bulk of the data in the IRAS two colordiagram as a good test of reliability, and adopted these modelsto compute the integrated properties of the SSP.
As a further test we compared our isochrones with a sampleof galactic M and Mira stars from Whitelock et al. (1994, 1995).In the near infrared colors (J-H vs. H-K) the models fit nicelyboth the M giants and the Miras. Models without the effect ofdust cannot fit the location of the Mira stars, as indicated bythe location in this diagram of our adopted model atmospheres.Apparently the sample of Mira stars is best fitted by models withsolar metallicity, however this conclusion is much dependent onthe adopted temperature scale of the more advanced M spectraltypes other than by the atmospheric model itself. ForthcomingISO observations would certainly help in clarifying this point.
Existing studies based on theoretical SSP either do not ac-count for the effect of dust in the envelope of bright AGB starsor they simply give a rough estimate of the effect and, conse-quently, neither class of models is fully suitable for investigatingthe integrated properties of stellar systems in the infrared (Char-lot et al. 1996). In our present calculations the mass-loss alongthe AGB determines both the lifetime and the spectral propertiesof the stars, allowing the description of the whole phase insidea consistent framework.
The direct effect of the metallicity is included by a simpleparameterization of the superwind mass-loss rate, which finallyprovides the scaling parameter τ1. However the metal contentalso affects the effective temperature of the AGB phase andconsequently the mass-loss rate determined by the empiricalrelation with the pulsational period.
Effects of AGB stars show up even in the integrated spec-trum of the population, at wavelength above few µm wherethey are the largest contributors to the integrated light. At thesewavelengths integrated spectra computed without the effect ofdust envelopes are about one order of magnitude fainter than themodels including Miras and OH/IR stars. This effect decreasesas the SSP becomes older and older.
We show that by selecting suitable passbands, the integratedcolors of such new SSPs can potentially be used to disentangleage from metallicity effects because of the strong dependenceof the dust model on the metal content. However given the shortduration and the high luminosity of the phase this method willsuffer of a great stochastic effect when applied to systems witha relatively small number of stars (Chiosi et al. 1988, Santos& Frogel 1997). These stochastic effects would certainly con-stitute less of a problem in the interpretation of the integratedlight of large systems such as the nuclei of elliptical galaxies orthe spiral bulges. These considerations suggest that incominginfrared observations of intermediate redshift objects could bethe targets where this method will eventually exploit its maxi-mum capability.
Finally, the new SSP models will be included in a moreextended study aimed at modelling the spectral properties of thegalaxies from the ultraviolet to the far infrared, accounting forthe effects of the dust associated with star forming regions and

148 A. Bressan et al.: Modelling intermediate age and old stellar populations in the Infrared
with the diffuse interstellar gas (Silva et al. 1997, Franceschiniet al. 1997b)
Acknowledgements. We thank Paola Marigo, Alberto Franceschini andLeo Girardi for helpful discussions. We also thank our referee, A.Lancon for her useful comments and suggestions. This research wassupported by the European Community under TMR grant ERBFMRX-CT96-0086
References
Bedijn P. J. 1987, A&A 186, 136Bender R., Ziegler B., Bruzual G. 1996, ApJ 463, 51Bertelli G., Bressan A., Chiosi C., Fagotto F., Nasi E. 1994, A&AS
106, 275Bessell M.S., Wood P.R., Brett J.M., Scholtz M., 1991, A&AS 89, 335Blocker T. 1995a, A&A 297, 727Blocker T. 1995b, A&A 299, 755Blocker T., Schonberner D. 1991, A&A 244, L43Bowen G.H., Willson L.A. 1991, ApJ 375, L53Bressan A., Fagotto F., Bertelli G., Chiosi C. 1993, A&AS 100, 647Bressan A., Chiosi C., Fagotto F. 1994, ApJS 94, 63Bressan A., Chiosi C., Tantalo R. 1996, A&A 311, 425Castor J.J, Abbot D.C., Klein R.I. 1975, ApJ 195, 157Charlot S., Worthey G., Bressan A. 1996, ApJ 457, 625Chiosi C., Bertelli G., Bressan A. 1988, A&A 196, 84Collison A.J., Fix J.D. 1991, ApJ 368, 545Elitzur M., Goldreich P., Scoville N. 1976, ApJ 205, 384Fagotto F., Bressan A., Bertelli G., Chiosi C. 1994a, A&A 104, 365Fagotto F., Bressan A., Bertelli G., Chiosi C. 1994b, A&A 105, 369Fluks M.A., Plez B., The P.S. at al. 1994, A&AS 105, 311Franceschini A., Bressan A., Granato G.L. et al. 1997a, in ESA SP-401Franceschini A., Silva L., Granato G.L., Bressan A., Danese L. 1997b,
ApJ, submittedFreedman W. 1992, AJ 104, 1349Fusi Pecci F., Renzini A. 1976, A&A 46, 447Goldreich P., Scoville N. 1976, ApJ 205, 144Gonzales J.J. 1993, Ph. D. thesis, Univ. California, Santa CruzGranato G.L., Danese L. 1994, MNRAS 268, 235Granato G.L., Danese L., Franceschini A. 1997, ApJ 486, 147Groenewegen M.A.T., De Jong T. 1994, A&A 283, 463Groenewegen M.A.T., Smith C.H., Wood P.R., Omont A., Fujiyoshi T.
1995, ApJ 449, L119Habing H.J. 1996, A&AR 7, 97Habing H.J., Tignon J., Tielens A.G.G.M. 1994, A&A 286, 523Helling C., Jorgensen U.G., Pletz B., Johnson H.R. 1996, A&A 315,
194Iben I.J. 1984, ApJ 277, 333IRAS Science Team, 1988, IRAS PSC explanatory supplementIvezic Z., Elitzur M. 1995, ApJ 445, 415Justtanont K., Tielens A.G.G.M. 1992, ApJ 389, 400Kurucz R.L. 1993, Kurucz CD-ROM, Cambridge, MA: Smithsonian
Astrophysical Observatory, December 4, 1993Marigo P., Bressan A., Chiosi C. 1996, A&A 313, 545Marigo P., Bressan A., Chiosi C., 1997 A&A acceptedNetzer N., Elitzur M. 1993, ApJ 410, 701Paczynski B. 1971, Acta Astron. 21, 417Rowan-Robinson M. 1986, MNRAS 219, 737Salpeter E.E. 1974a, ApJ 193, 579Salpeter E.E. 1974b, ApJ 193, 585Santos J. F. C. Jr., Frogel Jay A. 1997, ApJ 479, 764
Schonberner D. 1981, A&A 103, 119Silva L., 1995, Degree thesis, Univ. Padova, ITSilva L., Granato G.L., Bressan A. & Danese L. 1998, ApJ, submittedTantalo R., Chiosi C., Bressan A., Fagotto F. 1996, A&A 311, 361Tantalo R., Bressan A., Chiosi C. 1997, A&A submitted,Van Der Veen W.E.C.J., Habing H.J. 1988, A&A 194, 125Vassiliadis E., Wood P.R. 1993, ApJ 413, 641Weidemann V. 1987, A&A 188, 74Willson L.A., Bowen G.H., Struck C. 1995, BAAS 187, 103.18Whitelock P., Menzies J., Feast M. et al. 1994, MNRAS 267, 711Whitelock P., Menzies J., Feast M. et al. 1995, MNRAS 276, 219Wood P.R., Whiteoak J. B., Hughes S. M. G et al. 1992, ApJ 397, 552Worthey G., Faber S.M., Gonzalez J.J., Burstein D. 1994, ApJS 94,
687
This article was processed by the author using Springer-Verlag LaTEXA&A style file L-AA version 3.