Modeling Traveling Waves Using Mode Superpositionweb.mit.edu/shear7/papers/OMAE2010-20807.pdf ·...
7
Modeling Traveling Waves using Mode Superposition Vivek Jaiswal Granherne, Inc Houston, Texas, USA Aditi Sheshadri Metacomp Technologies Agoura Hills, California, USA J. Kim Vandiver Massachusetts Institute of Technology Cambridge, Massachusetts, USA ABSTRACT Analysis of the data from two Vortex-Induced Vibration (VIV) experiments conducted in the Gulf Stream on a 500- foot-long, 1.43 inches diameter, flexible, tension dominated riser model revealed that the response is predominantly characterized by the presence of traveling waves. It was also observed that the location of the VIV excitation region (power-in) affects the characteristics of the response. The conventional method of modeling the excitation force as a standing wave was found inadequate to predict the location of the peak measured response accurately, especially in the cases where the excitation region is close to a boundary (the ends of the riser model). A modified excitation force model consisting of a combination of standing and traveling wave excitation regions is demonstrated to predict the location of the peak response more accurately. This work presents the idea of modifying the VIV excitation model to include traveling wave characteristics and using mode superposition method for computing the response to this modified force. Examples of the implementation of this method are shown for the two distinct cases of the location of the power-in region - the power-in region adjacent to the boundary and the power-in region away from the boundary. Depending on the location of the power-in region, different proportions of standing and traveling wave excitations are used to yield predicted responses that match the measured response characteristics. INTRODUCTION Offshore marine risers and pipelines, exposed to ocean currents, are susceptible to VIV. These vibrations lead to fatigue which can limit the functional life of the offshore structures. Depleting oil and gas resources on land and in shallow water offshore have forced the oil and gas industry to explore further offshore in deeper waters. The exploration depth, which stood at 5000 ft in the early 1980's, has doubled since. The production depth has gone up from 1000 ft to nearly 7000 ft in the same time period. The increased water depth necessitates the use of risers and pipelines with high aspect ratio (length to diameter ratio). The VIV of high aspect ratio structures is relatively less understood. These structures, due to their high aspect ratio, have a higher shedding frequency to first natural frequency ratio. Therefore, for a given current environment, high aspect ratio structures respond at higher-mode frequencies compared to low aspect ratio structures. The authors refer to modes numbers above the tenth mode as high mode numbers. A DEEPSTAR sponsored VIV experiment campaign on a high aspect ratio riser model was conducted in the Gulf Stream. The objective of the experiment was to obtain data from a densely instrumented riser model that can Proceedings of the ASME 2010 29th International Conference on Ocean, Offshore and Arctic Engineering OMAE2010 June 6-11, 2010, Shanghai, China OMAE2010- 1 Copyright © 2010 by ASME
Transcript of Modeling Traveling Waves Using Mode Superpositionweb.mit.edu/shear7/papers/OMAE2010-20807.pdf ·...

Modeling Traveling Waves using Mode Superposition
Vivek Jaiswal Granherne, Inc
Houston, Texas, USA
Aditi Sheshadri Metacomp Technologies
Agoura Hills, California, USA
J. Kim Vandiver Massachusetts Institute of Technology
Cambridge, Massachusetts, USA
ABSTRACT
Analysis of the data from two Vortex-Induced Vibration
(VIV) experiments conducted in the Gulf Stream on a 500-
foot-long, 1.43 inches diameter, flexible, tension dominated
riser model revealed that the response is predominantly
characterized by the presence of traveling waves. It was also
observed that the location of the VIV excitation region
(power-in) affects the characteristics of the response. The
conventional method of modeling the excitation force as a
standing wave was found inadequate to predict the location
of the peak measured response accurately, especially in the
cases where the excitation region is close to a boundary (the
ends of the riser model).
A modified excitation force model consisting of a
combination of standing and traveling wave excitation
regions is demonstrated to predict the location of the peak
response more accurately. This work presents the idea of
modifying the VIV excitation model to include traveling
wave characteristics and using mode superposition method
for computing the response to this modified force. Examples
of the implementation of this method are shown for the two
distinct cases of the location of the power-in region - the
power-in region adjacent to the boundary and the power-in
region away from the boundary. Depending on the location
of the power-in region, different proportions of standing and
traveling wave excitations are used to yield predicted
responses that match the measured response characteristics.
INTRODUCTION Offshore marine risers and pipelines, exposed to ocean
currents, are susceptible to VIV. These vibrations lead to
fatigue which can limit the functional life of the offshore
structures. Depleting oil and gas resources on land and in
shallow water offshore have forced the oil and gas
industry to explore further offshore in deeper waters. The
exploration depth, which stood at 5000 ft in the early
1980's, has doubled since. The production depth has gone
up from 1000 ft to nearly 7000 ft in the same time period.
The increased water depth necessitates the use of risers
and pipelines with high aspect ratio (length to diameter
ratio).
The VIV of high aspect ratio structures is relatively less
understood. These structures, due to their high aspect
ratio, have a higher shedding frequency to first natural
frequency ratio. Therefore, for a given current
environment, high aspect ratio structures respond at
higher-mode frequencies compared to low aspect ratio
structures. The authors refer to modes numbers above the
tenth mode as high mode numbers.
A DEEPSTAR sponsored VIV experiment campaign on a
high aspect ratio riser model was conducted in the Gulf
Stream. The objective of the experiment was to obtain
data from a densely instrumented riser model that can
Proceedings of the ASME 2010 29th International Conference on Ocean, Offshore and Arctic Engineering OMAE2010
June 6-11, 2010, Shanghai, China
OMAE2010-20807
1 Copyright © 2010 by ASME
lead to a better understanding of VIV of long flexible
cylinders and its prediction.
GULF STREAM EXPERIMENTS The Gulf Stream Experiments were conducted on the
Research Vessel F. G. Walton Smith from the University of
Miami using a fiber glass composite pipe, 500.4-foot-long
and 1.43 inches in outer diameter. The experiment consisted
of towing the pipe in the Gulf Stream. The set-up of the
experiment is shown in Figure 1. A railroad wheel weighing
805 lbs (dry weight, 725 lbs in water), was attached to the
bottom of the pipe to provide tension. Strain gauges were
used to measure the VIV response of the pipe. 8 optical
fibers containing 35 strain gauges each were embedded in
the outer layer of the composite pipe. Each quadrant of the
pipe had two fibers embedded so that in all there were 70
strain gauge measurements available. The spacing between
the adjacent strain gauges in a quadrant was 7 ft. An ADCP
was used to record the current velocity and direction along
the length of the pipe. More details about the experiment
can be found in [1,2,5].
Figure 1 Set-up for the Gulf Stream Experiments.
CHARACTERISTICS OF HIGH MODE NUMBER VIV RESPONSE DATA
Analysis of the data from the Gulf Stream experiments
reveals that the cross-flow response is characterized by the
presence of traveling waves [1,3]. Another interesting
feature of the measured response is that the maximum strain
is not at the same spatial location as the maximum incident
current. Figure 2 shows the current profile and the root
mean square (RMS) strain from one of the test cases
(20061023205557) and illustrates the above mentioned
point. This unexpected response behavior is partially
explained by the significant presence of odd higher
harmonic 3X frequency (three times the primary cross-
flow response frequency which is denoted as 1X) in the
cross-flow direction [4].
Figure 2 Current profile and RMS strain for test case
20061023205557. Strain data from all 4 quadrants of
the pipe is shown.
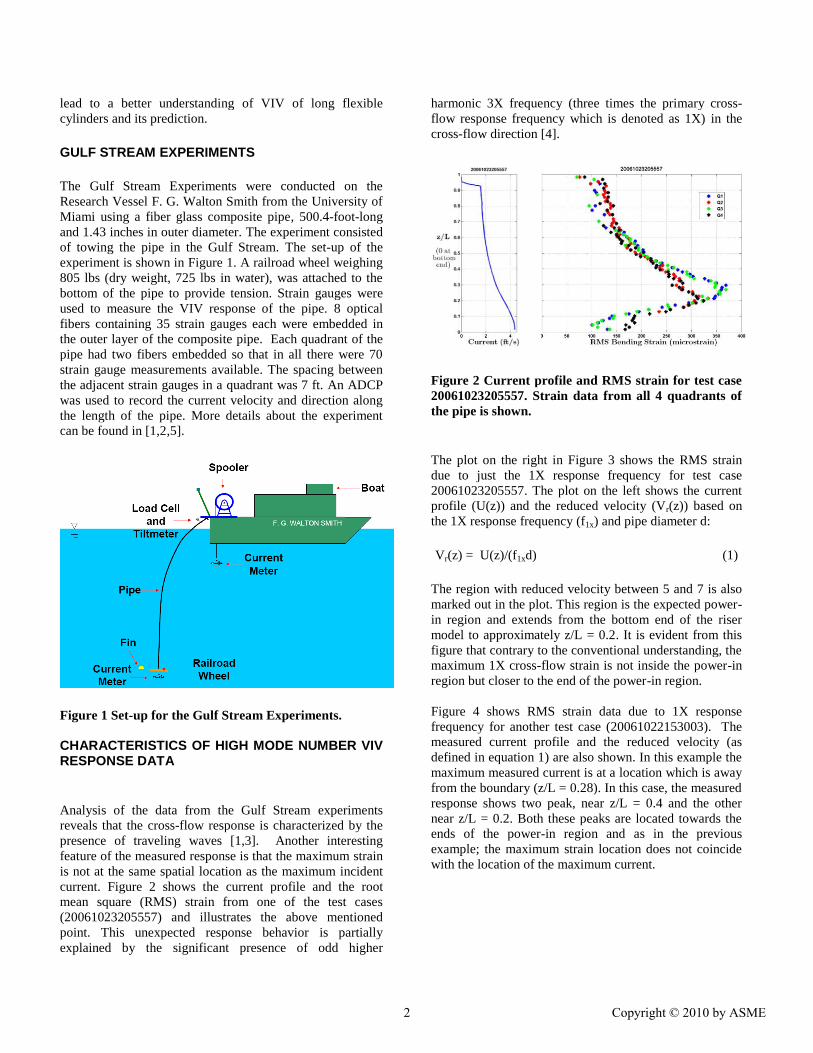
The plot on the right in Figure 3 shows the RMS strain
due to just the 1X response frequency for test case
20061023205557. The plot on the left shows the current
profile (U(z)) and the reduced velocity (Vr(z)) based on
the 1X response frequency (f1x) and pipe diameter d:
Vr(z) = U(z)/(f1xd) (1)
The region with reduced velocity between 5 and 7 is also
marked out in the plot. This region is the expected power-
in region and extends from the bottom end of the riser
model to approximately z/L = 0.2. It is evident from this
figure that contrary to the conventional understanding, the
maximum 1X cross-flow strain is not inside the power-in
region but closer to the end of the power-in region.
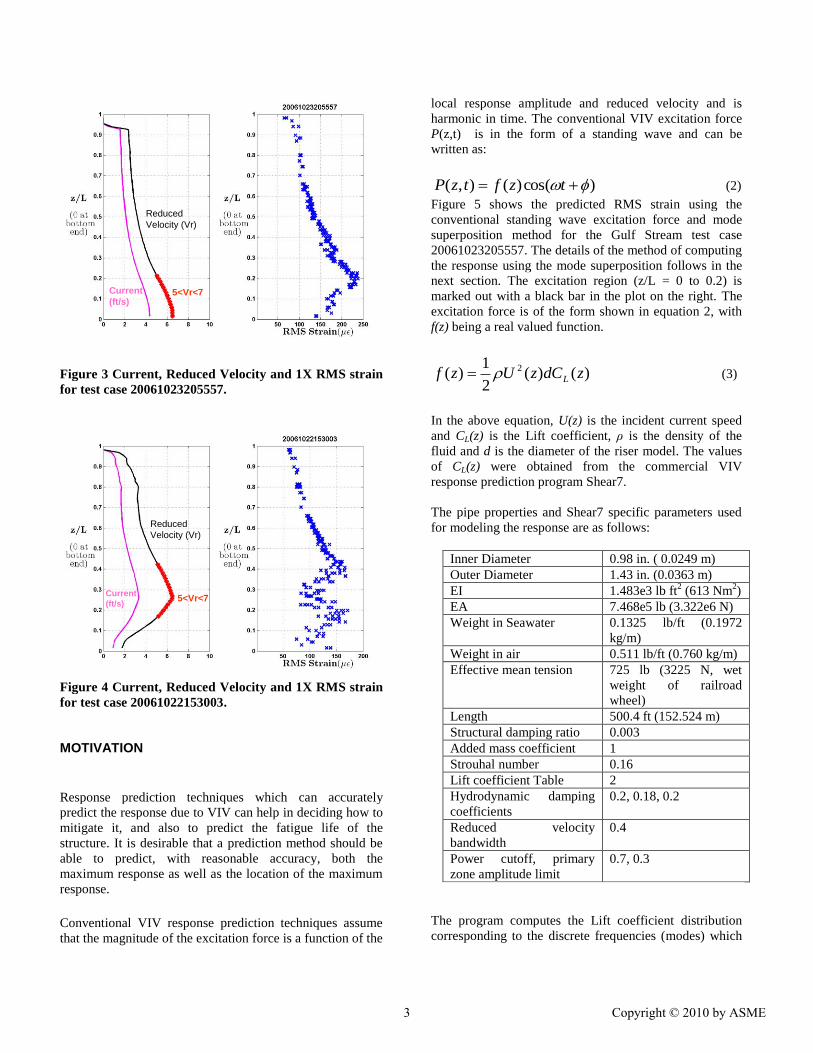
Figure 4 shows RMS strain data due to 1X response
frequency for another test case (20061022153003). The
measured current profile and the reduced velocity (as
defined in equation 1) are also shown. In this example the
maximum measured current is at a location which is away
from the boundary (z/L = 0.28). In this case, the measured
response shows two peak, near z/L = 0.4 and the other
near z/L = 0.2. Both these peaks are located towards the
ends of the power-in region and as in the previous
example; the maximum strain location does not coincide
with the location of the maximum current.
2 Copyright © 2010 by ASME
Reduced
Velocity (Vr)
Current
(ft/s)5<Vr<7
Figure 3 Current, Reduced Velocity and 1X RMS strain
for test case 20061023205557.
Reduced
Velocity (Vr)
Current
(ft/s)5<Vr<7
Figure 4 Current, Reduced Velocity and 1X RMS strain
for test case 20061022153003. MOTIVATION
Response prediction techniques which can accurately
predict the response due to VIV can help in deciding how to
mitigate it, and also to predict the fatigue life of the
structure. It is desirable that a prediction method should be
able to predict, with reasonable accuracy, both the
maximum response as well as the location of the maximum
response.
Conventional VIV response prediction techniques assume
that the magnitude of the excitation force is a function of the
local response amplitude and reduced velocity and is
harmonic in time. The conventional VIV excitation force
P(z,t) is in the form of a standing wave and can be
written as:
)cos()(),( tzftzP (2)
Figure 5 shows the predicted RMS strain using the
conventional standing wave excitation force and mode
superposition method for the Gulf Stream test case
20061023205557. The details of the method of computing
the response using the mode superposition follows in the
next section. The excitation region (z/L = 0 to 0.2) is
marked out with a black bar in the plot on the right. The
excitation force is of the form shown in equation 2, with
f(z) being a real valued function.
)()(2
1)( 2 zdCzUzf L (3)
In the above equation, U(z) is the incident current speed
and CL(z) is the Lift coefficient, ρ is the density of the
fluid and d is the diameter of the riser model. The values
of CL(z) were obtained from the commercial VIV
response prediction program Shear7.
The pipe properties and Shear7 specific parameters used
for modeling the response are as follows:
Inner Diameter 0.98 in. ( 0.0249 m)
Outer Diameter 1.43 in. (0.0363 m)
EI 1.483e3 lb ft2 (613 Nm
2)
EA 7.468e5 lb (3.322e6 N)
Weight in Seawater 0.1325 lb/ft (0.1972
kg/m)
Weight in air 0.511 lb/ft (0.760 kg/m)
Effective mean tension 725 lb (3225 N, wet
weight of railroad
wheel)
Length 500.4 ft (152.524 m)
Structural damping ratio 0.003
Added mass coefficient 1
Strouhal number 0.16
Lift coefficient Table 2
Hydrodynamic damping
coefficients
0.2, 0.18, 0.2
Reduced velocity
bandwidth
0.4
Power cutoff, primary
zone amplitude limit
0.7, 0.3
The program computes the Lift coefficient distribution
corresponding to the discrete frequencies (modes) which
3 Copyright © 2010 by ASME
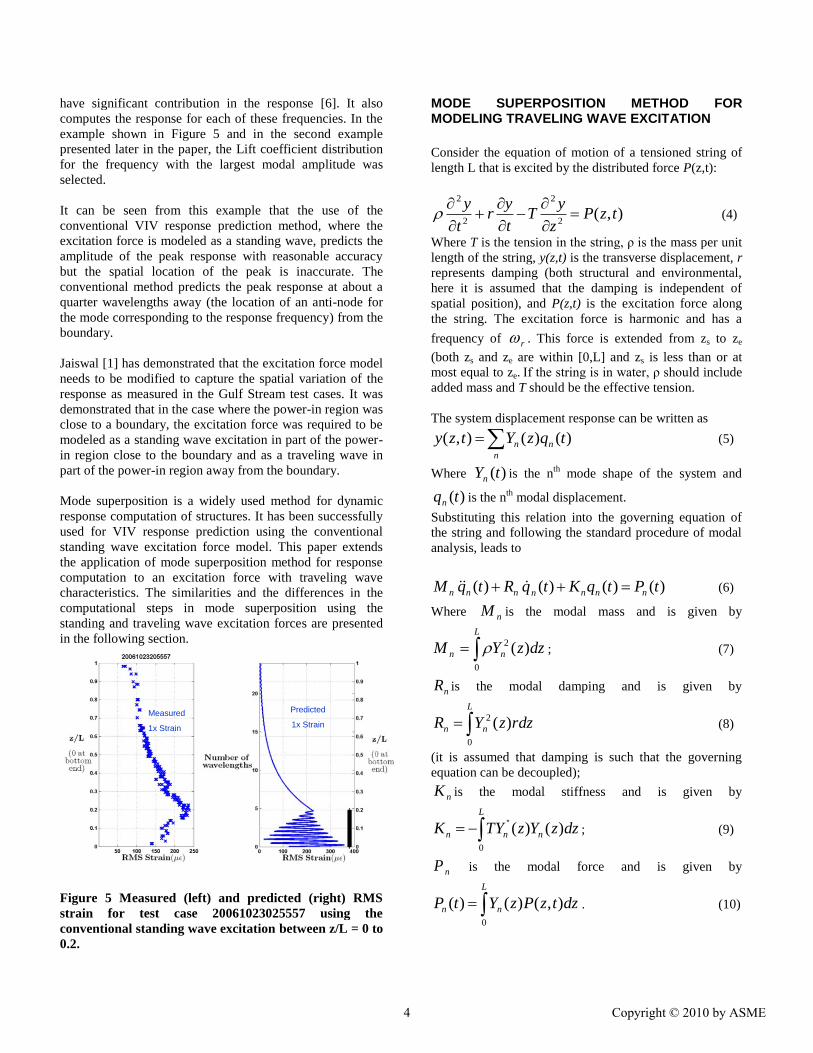
have significant contribution in the response [6]. It also
computes the response for each of these frequencies. In the
example shown in Figure 5 and in the second example
presented later in the paper, the Lift coefficient distribution
for the frequency with the largest modal amplitude was
selected.
It can be seen from this example that the use of the
conventional VIV response prediction method, where the
excitation force is modeled as a standing wave, predicts the
amplitude of the peak response with reasonable accuracy
but the spatial location of the peak is inaccurate. The
conventional method predicts the peak response at about a
quarter wavelengths away (the location of an anti-node for
the mode corresponding to the response frequency) from the
boundary.
Jaiswal [1] has demonstrated that the excitation force model
needs to be modified to capture the spatial variation of the
response as measured in the Gulf Stream test cases. It was
demonstrated that in the case where the power-in region was
close to a boundary, the excitation force was required to be
modeled as a standing wave excitation in part of the power-
in region close to the boundary and as a traveling wave in
part of the power-in region away from the boundary.
Mode superposition is a widely used method for dynamic
response computation of structures. It has been successfully
used for VIV response prediction using the conventional
standing wave excitation force model. This paper extends
the application of mode superposition method for response
computation to an excitation force with traveling wave
characteristics. The similarities and the differences in the
computational steps in mode superposition using the
standing and traveling wave excitation forces are presented
in the following section.
Measured
1x Strain
Predicted
1x Strain
Figure 5 Measured (left) and predicted (right) RMS
strain for test case 20061023025557 using the
conventional standing wave excitation between z/L = 0 to
0.2.
MODE SUPERPOSITION METHOD FOR MODELING TRAVELING WAVE EXCITATION
Consider the equation of motion of a tensioned string of
length L that is excited by the distributed force P(z,t):
),(2
2
2
2
tzPz
yT
t
yr
t
y
(4)
Where T is the tension in the string, ρ is the mass per unit
length of the string, y(z,t) is the transverse displacement, r
represents damping (both structural and environmental,
here it is assumed that the damping is independent of
spatial position), and P(z,t) is the excitation force along
the string. The excitation force is harmonic and has a
frequency of r . This force is extended from zs to ze
(both zs and ze are within [0,L] and zs is less than or at
most equal to ze. If the string is in water, ρ should include
added mass and T should be the effective tension.
The system displacement response can be written as
n
nn tqzYtzy )()(),( (5)
Where )(tYn is the nth
mode shape of the system and
)(tqn is the nth
modal displacement.
Substituting this relation into the governing equation of
the string and following the standard procedure of modal
analysis, leads to
)()()()( tPtqKtqRtqM nnnnnnn (6)
Where nM is the modal mass and is given by
L
nn dzzYM0
2 )( ; (7)
nR is the modal damping and is given by
L
nn rdzzYR0
2 )( (8)
(it is assumed that damping is such that the governing
equation can be decoupled);
nK is the modal stiffness and is given by
L
nnn dzzYzTYK0
'' )()( ; (9)
nP
is the modal force and is given by
L
nn dztzPzYtP0
),()()( . (10)
4 Copyright © 2010 by ASME

The displacement response at any location z to the excitation
with frequency r (in complex form) will be
1
2
21
)(1;
n
n
rn
n
r
nn
n
r
j
zYP
Kzy
(11)
Where e
x
z
z
nn dzzfzYP )()( , n is the nth
natural
frequency, and n is the nth
damping ratio.
n
rn
n
rn
jK
21
112
is the frequency response
function for mode n. The magnitude of the displacement at
location z is then given by
);();( rr zyzy . (12)
In solving for the response using mode superposition, the
only assumption that has been made is that the response is
harmonic in time.
The excitation force is of the form
})(Re{),( tjezftzP (13)
When f(z) is a real valued function, such as )cos( kz ,
the excitation force is:
)cos()cos(),( tkztzP (14)
which is the standard form for a standing wave excitation.
As mentioned in the previous section, in order to add the
traveling wave characteristic to the response, it is necessary
to modify the excitation force model and introduce a
function which models a traveling wave. Traveling waves in
general have the form
)(),( tkzgtzP
or
(15)
)(),( tkzgtzP
depending on whether the wave is a left to right traveling or
a right to left traveling wave respectively. From equation 13,
it can be seen that P(z,t) is of the form shown in equation 15
if f(z) is complex i.e. it is of the form
)sin()cos()( kzjkzzf (16)
The introduction of the second term, )sin( kzj adds a
traveling wave characteristic to the term on the right hand
side of equation 13. This modifying term is just the
orthogonal function of the original function f(z) multiplied
by the complex number j.
In the more general case where f(z) is not sinusoidal, it
needs to be first represented as a sum of its Fourier
components, i.e.
)sin()cos()( zkbzkazf nnnn (17)
This can also be represented as follows:
)2/cos()cos()( zkbzkazf nnnn (18)
Where kn = (nπz/Lin), Lin is the length of the excitation
region and the Fourier coefficients an and bn are evaluated
in the conventional way as follows:
inL
n
in
n dzzkzfL
a0
)cos()(2
(19)
inL
n
in
n dzzkzfL
b0
)sin()(2
(20)
The traveling wave excitation can then be written as
follows:
)2/sin()2/cos(
)sin()cos()(
zkjbzkb
zkjazkazf
nnnn
nnnn (21)
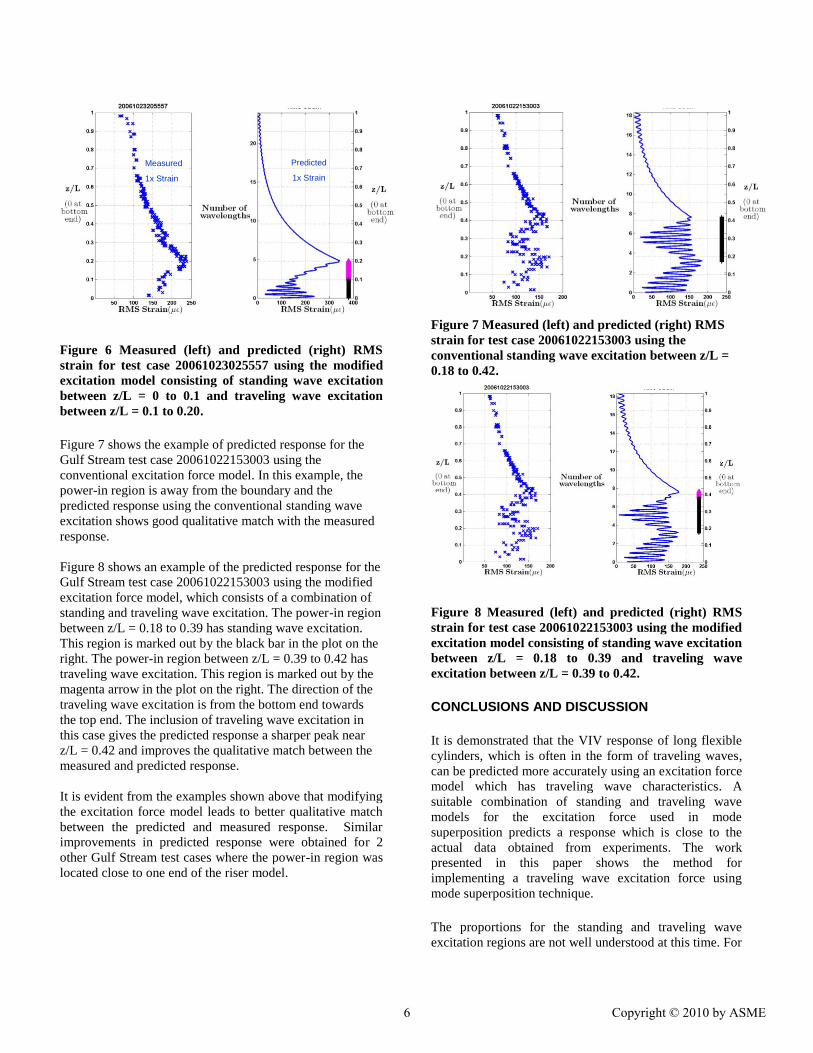
Figure 6 shows an example of the predicted response for
the Gulf Stream test case 20061023205557 using the
modified excitation force model, which consists of a
combination of standing and traveling wave excitation.
The power-in region between z/L = 0 to 0.1 has a standing
wave excitation. This region is marked out by the black
bar in the plot on the right. The power-in region between
z/L = 0.1 to 0.2 has a traveling wave excitation. This
region is marked out by the magenta arrow in the plot on
the right. The direction of the traveling wave excitation is
from the bottom end towards the top end. The response
predicted using this combined standing and traveling
wave excitation shows good qualitative match with the
measured response.
5 Copyright © 2010 by ASME
Measured
1x Strain
Predicted
1x Strain
Figure 6 Measured (left) and predicted (right) RMS
strain for test case 20061023025557 using the modified
excitation model consisting of standing wave excitation
between z/L = 0 to 0.1 and traveling wave excitation
between z/L = 0.1 to 0.20.
Figure 7 shows the example of predicted response for the
Gulf Stream test case 20061022153003 using the
conventional excitation force model. In this example, the
power-in region is away from the boundary and the
predicted response using the conventional standing wave
excitation shows good qualitative match with the measured
response.
Figure 8 shows an example of the predicted response for the
Gulf Stream test case 20061022153003 using the modified
excitation force model, which consists of a combination of
standing and traveling wave excitation. The power-in region
between z/L = 0.18 to 0.39 has standing wave excitation.
This region is marked out by the black bar in the plot on the
right. The power-in region between z/L = 0.39 to 0.42 has
traveling wave excitation. This region is marked out by the
magenta arrow in the plot on the right. The direction of the
traveling wave excitation is from the bottom end towards
the top end. The inclusion of traveling wave excitation in
this case gives the predicted response a sharper peak near
z/L = 0.42 and improves the qualitative match between the
measured and predicted response.
It is evident from the examples shown above that modifying
the excitation force model leads to better qualitative match
between the predicted and measured response. Similar
improvements in predicted response were obtained for 2
other Gulf Stream test cases where the power-in region was
located close to one end of the riser model.
Measured
1x Strain
Predicted
1x Strain
Figure 7 Measured (left) and predicted (right) RMS
strain for test case 20061022153003 using the
conventional standing wave excitation between z/L =
0.18 to 0.42.
Measured
1x Strain
Predicted
1x StrainMeasured
1x Strain
Predicted
1x Strain
Figure 8 Measured (left) and predicted (right) RMS
strain for test case 20061022153003 using the modified
excitation model consisting of standing wave excitation
between z/L = 0.18 to 0.39 and traveling wave
excitation between z/L = 0.39 to 0.42.
CONCLUSIONS AND DISCUSSION It is demonstrated that the VIV response of long flexible
cylinders, which is often in the form of traveling waves,
can be predicted more accurately using an excitation force
model which has traveling wave characteristics. A
suitable combination of standing and traveling wave
models for the excitation force used in mode
superposition predicts a response which is close to the
actual data obtained from experiments. The work
presented in this paper shows the method for
implementing a traveling wave excitation force using
mode superposition technique.
The proportions for the standing and traveling wave
excitation regions are not well understood at this time. For
6 Copyright © 2010 by ASME

this study, the proportions were obtained from a Green’s
function based response prediction program. In the Green’s
function approach, the response at each location along the
riser model is the sum of waves traveling in opposite
directions. At each location within the power-in region, it is
possible to compare the amplitudes of the waves traveling in
opposite direction. At a location where the amplitude of the
wave traveling in one direction is twice as large as the
amplitude of the wave traveling in opposite direction, that
location is assumed to have a traveling wave excitation. The
direction of the traveling wave excitation is assumed to be
the same as the direction of the traveling wave whose
amplitude is larger at the location. It is not possible to
implement this approach of comparing amplitudes of
opposite traveling waves with the mode superposition
method; more work is needed to develop the method for
determining the regions with traveling wave excitation for
the mode superposition method.
ACKNOWLEDGEMENTS This research was sponsored by the DEEPSTAR
Consortium, the Office of Naval Research Ocean
Engineering and Marine Systems program (ONR 321OE)
and the SHEAR7 JIP.
REFERENCES [1] Jaiswal, V., "Effect of Traveling Waves on Vortex-
Induced Vibration of Long Flexible Cylinders", PhD
thesis, Department of Ocean Engineering, Massachusetts
Institute of Technology, Cambridge, USA. [2] Jaiswal, V. and Vandiver J. K., “VIV Response
Prediction for Long Risers with Variable Damping”,
OMAE2007-29353, 26th International Conference on
Offshore Mechanics and Engineering, June 2007, San
Diego, California, USA. [3] Marcollo, H., Chaurasia, H., and Vandiver, J. K.,
“Phenomena observed in VIV bare riser field tests” , 26th
International Conference on Offshore Mechanics and
Engineering, June 2007, San Diego, California, USA.
[4] Vandiver J. K., Jaiswal, V. And Jhingran V.,
“Insights on vortex-induced, traveling waves on long
risers”, Journal of Fluids and Structures 25 (2009) pp 641-
653. [5] VIV Data Repository data download page
http://oe.mit.edu/VIV/downloadpage.html accessed on 1st
of February 2010.
[6] Vandiver, J.K., Leverette, S., Wajnikonis, C.J.,
Marcollo, H. (2007). “User Guide for SHEAR7 Version
4.5.” MIT. Cambridge, Massachusetts, USA
7 Copyright © 2010 by ASME