MODELING THE PHENOLOGY AND MONITORING THE ACTIVITY …
121
MODELING THE PHENOLOGY AND MONITORING THE ACTIVITY OF THE PLUM CURCULIO CONOTRACHELUS NENUPHAR (HERBST) (COLEOPTERA: CURCULIONIDAE) WITH NOVEL METHODS AND TECHNOLOGY By Roger Duncan Selby A DISSERTATION Submitted to Michigan State University in partial fulfillment of the requirements for the degree of Entomology - Doctor of Philosophy 2014
Transcript of MODELING THE PHENOLOGY AND MONITORING THE ACTIVITY …

MODELING THE PHENOLOGY AND MONITORING THE ACTIVITY OF THE PLUM
CURCULIO CONOTRACHELUS NENUPHAR (HERBST) (COLEOPTERA:
CURCULIONIDAE) WITH NOVEL METHODS AND TECHNOLOGY
By
Roger Duncan Selby
A DISSERTATION
Submitted to
Michigan State University
in partial fulfillment of the requirements
for the degree of
Entomology - Doctor of Philosophy
2014

ABSTRACT
MODELING THE PHENOLOGY AND MONITORING THE ACTIVITY OF THE PLUM
CURCULIO CONOTRACHELUS NENUPHAR (HERBST) (COLEOPTERA:
CURCULIONIDAE) WITH NOVEL METHODS AND TECHNOLOGY
By
Roger Duncan Selby
Increasing legal restrictions on chemical pesticide use in stone and pome fruit orchards
have stimulated research into developing better management and monitoring tools for the
northern strain of the plum curculio, Conotrachelus nenuphar (Herbst).
Plum curculio larvae may be targeted with management tactics as they emerge from fruit,
so existing models for larval emergence from fruit were evaluated for accuracy while examining
the effect of multiple larvae and fruit type upon emergence timing. Larval emergence timing,
quantified as degree days (base 11.1°C), was recorded in tart cherries on trees, and emergence
timing was recorded in multiple apple varieties both in cyclical field conditions and in constant
laboratory conditions. Adult emergence from pupation in soil was recorded in the laboratory and
compared with existing model predictions. Model predictions did not always accurately reflect
the timing of larval or adult emergence. Colder conditions and changing host fruit type had no
significant effect on larval emergence timing but changing host fruit type correlated with a
shorter pupation interval. Results suggested that females preferred to oviposit on multiple fruit
rather than lay multiple eggs in one fruit. More larvae per fruit resulted in a significantly longer
emergence period in apples.
Incorporating camera systems into insect traps potentially benefits not only plum curculio
monitoring, but insect phenology modeling, non-lethal insect monitoring, and research into the
automated identification of traps counts. Cameras originally for monitoring mammals were

adapted to monitor the entrance to pyramid traps designed to capture adult plum curculios. With
field tests, two new trap designs (v.I and v.II) traps were evaluated on the basis of battery power,
ease-of-maintenance, adaptability, required-user-skills, cost (including labor), and accuracy-of-
results. The v.II design surpassed five of the six criteria used to evaluate success. Significantly
more adults entered the camera traps between six in the evening and midnight. When compared
with conventional pyramid traps, the v.I traps collected a similar number of adults. Two
observed but not significant trends were that the v.I traps collected twice as many adults as the
v.II traps while at the same time the v.II traps collected more than twice as many photos per adult
as the v.I traps.
The responses of adult plum curculios to contrasts in color and illuminance were assessed
in field and laboratory conditions. Results from four field sites showed that significantly more
adults exhibited positive taxis towards traps with woods behind than to traps in an open field.
Laboratory tests showed that significantly more females and males exhibited positive taxis
towards areas of black. The color black correlated with lower reflected illuminance (<110 lux),
and when environmental lux was reduced to ten or less, the significant adult positive taxis
towards black was not evident. The combined results suggest that adults will move towards the
largest areas of low illuminance in the environment. Low illuminance should be the standard for
future plum curculio traps, and applications of materials reflecting illuminance to an orchard
could be explored as a means to manipulate adult behavior.

iv
ACKNOWLEDGEMENTS
Thank you so much to the many people who helped in the creation of this dissertation,
either by supporting the research or by supporting me.
I am very grateful that Drs. Stuart Gage and Mark Whalon gave me the opportunity to
study at Michigan State University. As a team they fostered my ideas, supported my efforts, and
encouraged me when research was frustrating. In particular, I thank Dr. Gage for teaching me to
see the long-term potential of ideas and technology and I thank Dr. Whalon for his many insights
on pesticide policy and for his advice on personal development.
Thank you to Drs. Matthew Grieshop and Daniel Guyer for taking the time to serve on
my advisory committee. I very much appreciate their valuable input on my research design,
analysis and writing style. Thank you to Willye Bryan for all her help and advice with the
administrative side of laboratory operations, and thank you to Peter Nelson for our many
research discussions and for being an excellent conference travel companion on many occasions.
While completing my dissertation, I worked both in the Manly Miles Building, Suite 101,
and in Laboratory B-11, Center for Integrated Plant Systems. Thank you to Dr. David Skole and
his staff for all their help while in the Manly Miles Building. In particular, Dr. Eric Kasten and
David Kandow were great sources of advice when designing the automated trap electronics. I
also am very grateful for the many research assistants employed in the B-11 laboratory that
helped the research come to fruition. A particular thank you goes to Masaki Takahashi for all his
assistance with automated trap repair and field work. Joshua Iamurri assisted with and helped
design the laboratory experiments of plum curculio movement and through his teachings and
advice, Dr. Jim Miller encouraged the work to continue in times of frustration. Amy Selby,
Andre Holgate, Marcel Rich and many others helped to manage the plum curculio colony. Tyler

v
Ash, Brittany Harrison, Diamond Garrett and Sean McKinnon helped with larval phenology
experiments. Michael Strongman and Brandon Betz helped with trap construction and
photograph analysis. Alexandra van Sickle and Rosemary Bolton assisted with the ELISA
analysis. Dylan Tauzer and many others assisted with field experiments.
Under the direction of Mark Whalon, Alex Johnson and Renee Pereault Larsen were
responsible for the data concerning larval development in Empire thinning apples and their
unpublished work is reproduced with written permission (see Appendix B).
Thank you to the many agencies and their staff who financially supported my research
resources, travel or stipend in some form, particularly Michigan State University’s Office of
Campus Sustainability, the United States Environmental Protection Agency, the United States
Department of Agriculture, the Michigan Cherry Research Committee and the Michigan Apple
Committee. Several Michigan orchards and gardens made highly-appreciated contributions to
the research efforts: the Clarksville Research Center, the Trevor Nichols Research Center, the
Clarence E. Lewis Landscape Arboretum, and a private farm of Coloma, MI that wished for
anonymity.
Last but definitely not least, I wish to thank my family for their invaluable emotional
support throughout my PhD program. The steadfastness and love of my parents, Roger and
Hilary Selby, gave me the fortitude I needed in the early years. After I met and married her, the
love and encouragement from my wife, Amy, inspired and motivated me as I overcame the final
research and writing obstacles. This dissertation represents a period of great growth in my life -
not only in my skills and knowledge, but in my character and faith - and I thank you all for being
such a positive part of the process.

vi
TABLE OF CONTENTS
LIST OF TABLES .......................................................................................................................x
LIST OF FIGURES .....................................................................................................................xi
INTRODUCTION .......................................................................................................................1
A SHORT REVIEW OF PLUM CURCULIO MANAGEMENT AND DISSERTATION
OBJECTIVES ..............................................................................................................................1
Distribution ..........................................................................................................1
Life Cycle.............................................................................................................1
Damage ................................................................................................................2
Historical Control.................................................................................................3
Select Options for the Future Management of Plum Curculio ............................3
Limited Canopy Insecticides and Repellents ...........................................3
Soil-Based Control ...................................................................................4
Monitoring Tools .................................................................................................5
Dissertation Objectives ........................................................................................6
First Objective ..........................................................................................6
Second Objective .....................................................................................6
Third Objective ........................................................................................7
CHAPTER 1 ................................................................................................................................8
COMPARING THE EMERGENCE OF NORTHERN STRAIN PLUM CURCULIO LARVAE
FROM MULTIPLE FRUIT VARIETIES ...................................................................................8
Abstract ............................................................................................................................8
Introduction ......................................................................................................................9
Methods............................................................................................................................10
Overall Approach .................................................................................................10
Larval Development and Head Size Correlation .................................................11
General Rearing Procedures ................................................................................12
Fruit Host Selection and Measurement ....................................................12
Plum Curculio Source ..............................................................................12
Equipment and Procedures Common to All Larval Rearing Experiments
..................................................................................................................13
Equipment and Procedures Common to All Pupae Rearing Experiments
..................................................................................................................14
Rearing Larvae in Growing Fruit on Trees ..........................................................15
Cherries ....................................................................................................15
Apples ......................................................................................................15
Rearing Larvae in Harvested Fruit .......................................................................16
Outdoors ...................................................................................................16
Indoors .....................................................................................................16
Pupation in the Laboratory...................................................................................17
Degree-Day Calculations .....................................................................................17

vii
Emergence Analysis.............................................................................................18
Data Organization ....................................................................................18
Overall Statistical Approach ....................................................................19
Degree Day Comparisons ....................................................................................19
Other Analyses .....................................................................................................20
Correlation between Larva-per-Apple and Fruit Volume ........................20
Oviposition Experiment ...........................................................................20
Results ..............................................................................................................................21
Larval Development and Head Size Correlation .................................................21
Environmental Conditions in All Experiments ....................................................23
Larvae Reared in Growing Fruit on Trees ...........................................................24
Cherries ....................................................................................................24
Smoothee Golden Delicious Apples ........................................................24
Larvae Reared in Harvested Fruit ........................................................................24
Outdoors ...................................................................................................24
Indoors .....................................................................................................25
Oviposition Reliability .........................................................................................25
Adults Reared through Pupation in the Laboratory .............................................25
Model Predictions ................................................................................................25
Data Distribution ..................................................................................................26
Comparisons of Emergence Timings (Degree Days) ..........................................26
Results from Other Analyses ...............................................................................32
Correlation between Larvae-per-Fruit and Fruit Volume ........................32
Oviposition Experiment Results ..............................................................32
Discussion ........................................................................................................................32
CHAPTER 2 ................................................................................................................................37
PRECISE AND LOW-COST MONITORING OF PLUM CURCULIO PEST ACTIVITY IN
PYRAMID TRAPS WITH CAMERAS ......................................................................................37
Abstract ............................................................................................................................37
Introduction ......................................................................................................................38
Methods............................................................................................................................41
Trap Modification to Incorporate the Motion-Sensor System .............................41
Collecting Container Modification ..........................................................42
Camera Modifications ..............................................................................44
The Motion Sensor Circuits .....................................................................44
Battery Requirements...............................................................................45
Field Demonstration Methods..............................................................................46
Camera Reliability Analysis ....................................................................49
Statistical Approach .............................................................................................49
Cost-Benefit Analysis ..........................................................................................49
Results ..............................................................................................................................50
Motion Sensor and Camera Reliability in 2012 ...................................................50
Comparing Different Trap Versions ....................................................................51
Patterns in Overall Plum Curculio Capture .............................................54
Cost-Benefit Analysis ..........................................................................................56

viii
Discussion ........................................................................................................................57
Timing of Plum Curculio Captures ......................................................................57
Evaluating the System with the Six Criteria ........................................................58
Improving Camera Trap Plum Curculio Capture.................................................59
Version II Motion Sensor versus Other Automated Trap Designs ......................60
Improving Battery Life and Adding New Trap Capabilities ...............................60
Conclusions ..........................................................................................................61
CHAPTER 3 ................................................................................................................................63
RESPONSE OF ADULT PLUM CURCULIOS TO CONTRASTS IN COLOR AND
ILLUMINANCE IN FIELD AND LABORATORY EXPERIMENTS ......................................63
Abstract ............................................................................................................................63
Introduction ......................................................................................................................64
Methods............................................................................................................................66
Rearing Plum Curculio Adults .............................................................................66
Field Experiments ................................................................................................66
Overall Approach .....................................................................................66
Site Layout ...............................................................................................66
Pyramid Trap Visual Standardization ......................................................67
Pyramid Trap Lure Standardization .........................................................68
Quantifying the Contrast Value of Trap Visual Silhouette ......................68
Adult Release and Collection...................................................................70
Laboratory Experiments.......................................................................................70
Overall Approach .....................................................................................70
Laboratory Environment ..........................................................................71
Boxes and Lighting ..................................................................................71
Tub Patterns and Side Orientation ...........................................................72
Illuminance ..............................................................................................74
Experiment Procedure ..............................................................................76
Sequence Record ......................................................................................76
Statistical Analyses ..............................................................................................76
Sorting Laboratory Data ..........................................................................76
Statistical Tests ........................................................................................77
Results ..............................................................................................................................78
Field Experiments ................................................................................................78
Laboratory Experiments.......................................................................................81
Responding and Non-Responding Category Sorting ...............................81
Location Stability within Periods.............................................................82
Location Differences and Changes ..........................................................82
Discussion ........................................................................................................................89
CHAPTER 4 ................................................................................................................................93
SYNTHESIS AND FUTURE RESEARCH ................................................................................93
APPENDICES .............................................................................................................................95
Appendix A: Record of Deposition of Voucher Specimens ............................................96

ix
Appendix B: A Copy of Permission to Use Results Collected by Alex Johnson and Renee
Pereault Larsen for Chapter 1 ..........................................................................................97
Appendix C: A Copy of Copyright Permission for Chapter 2 .........................................98
REFERENCES ............................................................................................................................99

x
LIST OF TABLES
Table 1. Temperature variations in outdoor larval rearing environments. ..................................23
Table 2. Degree-days (base 11.1°C) required for larval emergence, according to larvae per fruit
category.. ......................................................................................................................................29
Table 3. Mean degree-days (base 11.1°C) per fruit required for Pre-Dissection emergence of
larvae.. ..........................................................................................................................................30
Table 4. Mean degree-days (base 8.7°C) per pupation jar required for emergence of all adults in
each jar. ........................................................................................................................................31
Table 5. Mean degree-days (base 11.1°C) required for First emergence of larvae from each
different fruit and location. ..........................................................................................................31
Table 6. Photographic omissions determined from human observations along with likely causes
of omissions, 2012 field study. ....................................................................................................51
Table 7. Causes of motion-sensor trigger in 2012 as determined from the photographic record.
......................................................................................................................................................53
Table 8. Costs of camera trap operation for four days versus the cost of direct human
observation. ..................................................................................................................................57
Table 9. Tub pattern, illuminance and box color and used in each laboratory experiment. ........75
Table 10. Adult capture at 2013 field sites, sorted by trap Contrast value. .................................80
Table 11. Non-Responding Category sequences sorted by frequency and sex. ..........................82
Table 12. Percentage of Responding Category sequence adults found at different heights in the
tubs. ..............................................................................................................................................84
Table 13. Percentage of adults on Inner and Outer tub Sides from Responding Category
sequences. ....................................................................................................................................85
Table 14. Change in adult location frequency in Responding Category sequences. ...................87

xi
LIST OF FIGURES
Figure 1. Northern strain plum curculio annual life cycle in seven stages. .................................2
Figure 2. Relationship between ambient temperature and degree day accumulation in
experiments rearing larvae. ..........................................................................................................18
Figure 3. Mean ± SD larval head width recorded after dissecting ten apples once every 24 hours
in 2006. ........................................................................................................................................22
Figure 4. Mean ± SD larval head width recorded after dissecting five apples once every 12 hours
in 2007. ........................................................................................................................................22
Figure 5. Larvae count per fruit correlated with mean fruit volume. ..........................................32
Figure 6. Diagram of a conventional pyramid trap compared with a trap using a v.II collecting
container and camera. ..................................................................................................................42
Figure 7. Circuitry of the v.I and v.II collecting containers, showing how the motion sensor
triggered the camera’s pyroelectric sensor. .................................................................................45
Figure 8. Arrangement of traps and release areas in the September 2010 release-recapture study.
......................................................................................................................................................47
Figure 9. Arrangement of traps and the release point in the September 2012 release-recapture
study at one of the four sites. .......................................................................................................48
Figure 10. The total number of plum curculios recorded by trap camera photographs and by
human observation at the top of the trap in 2012.........................................................................55
Figure 11. Mean + SD number of plum curculios photographed at all sites in September 2012
according to the hour of day. .......................................................................................................56
Figure 12. Layout of traps at all sites in 2013..............................................................................67
Figure 13. Representation of pyramid trap appearance when photographed...............................69
Figure 14. Representation of a Transparent-With-Black-Lines tub.............................................72
Figure 15. Box color with tub and lid pattern used in each experiment. .....................................73
Figure 16. Field study adult capture per day by sex. ...................................................................79
Figure 17. Field study total adult capture per trap plotted according to Contrast value. .............81

1
INTRODUCTION
A SHORT REVIEW OF PLUM CURCULIO MANAGEMENT
AND DISSERTATION OBJECTIVES
Distribution. The plum curculio, Conotrachelus nenuphar (Herbst) (Coleoptera:
Curculionidae) is native to North America and although exotic hosts are planted near the Pacific
coast, the plum curculio range remains limited to the eastern United States and Canada (Leskey
and Wright 2007), with isolated colonies confirmed in Utah (Alston et al. 2005). Two behavioral
strains exist, a northern univoltine population and a southern multivoltine population (McGiffen
et al. 1987, Hoffman et al. 2004), with population ranges overlapping to some extent (Calkins et
al. 1976, Leskey and Wright 2004b, Leskey 2008). Crosses of northern and southern strains
have produced some viable offspring (Stevenson and Smith 1961, Padula and Smith 1971,
McClanan et al. 2004, Zhang and Pfeiffer 2008), and using mtCOI gene sequencing, Zhang et al.
(2008) hypothesized the existence of a northern haplotype, a southern haplotype, and a ‘Mid-
Atlantic’ haplotype (behaviorally southern), present from Virginia to New Jersey. In Michigan,
it is assumed that the short fruiting season and long winter ensures that only univoltine
populations of wild plum curculios survive.
Life Cycle. Univoltine plum curculio annual life cycle may be described in seven
consecutive stages, shown in Figure 1. In stage one, adults emerge in springtime and find hosts
and mates. Adult feeding includes fruit (when available), leaves and buds (Racette et al. 1992).
In stage two, gravid females oviposit in developing fruit as soon as it forms (Hoffman 2008). In
stage three, after egg hatch, larvae in the fruit feed and develop through four instars, with the

2
fruit likely detaching from the tree in this time (Levine and Hall 1977). In stage four and five,
larvae emerge from the fruit and burrow into the soil to pupate (Leskey et al. 2009). In stage six,
adults emerge and continue feeding until environmental cues motivate them to return to the
orchard floor and prepare for winter diapause (stage seven) (Leskey et al. 2009).
Figure 1. Northern strain plum curculio annual life cycle in seven stages.
Damage. The plum curculio is a major and persistent pest of stone and pome fruits, both
native and exotic (Maier 1990, Vincent et al. 1999, Jenkins et al. 2006, Leskey and Wright
2007). Le Blanc et al (1984) estimated that an unchecked population will damage between 25
and 85% of an apple crop. Lan et al. (2003) estimated that plum curculios annually caused 1.8
million dollars’ worth of damage to the peach industry in Georgia. For Michigan tart cherry
growers, zero-tolerance policies for white worms in red cherries (e.g. USDA 1941) has meant
that otherwise minor larval infestations render large crops being considered unfit for sale, both

3
domestically and internationally (Wise and Whalon 2009). Within an apple orchard, a plum
curculio population released from insecticide control efforts is capable of returning to levels
causing major economic damage within three years (Vincent et al. 1999).
Historical Control. The control method adopted by growers for many years was
orchard-wide applications organophosphates, particularly azinphos-methyl (AZM or Guthion®
),
beginning when fruit trees flower petals began to fall. This was for two reasons: first, plum
curculio adults begin to eat and oviposit on fruit as soon as it begins to develop (Piñero and
Prokopy 2006, Reissig et al. 1998, Hoffman 2008) and, second, the work of arthropod pollinators
(vital to fruit development but severely disrupted by insecticides) is finished by petal fall. AZM
works both as a contact poison against adults and penetrates fruit sufficiently to act as a larvicide
(Wise et al. 2007, Hoffman et al. 2009), and spray programs frequently recommended
subsequent applications of organophosphates after 10-14 days to ensure no pest survival
(Prokopy et al. 1996, Reissig et al. 1998). However, AZM use is being phased out in US cherry
and apple production in the wake of the U. S. Food Quality Protection Act (FQPA) (USEPA,
2009), so alternative strategies for plum curculio control are being developed.
Select Options for the Future Management of Plum Curculio. Limited Canopy
Insecticides and Repellents. There are multiple plum curculio management options, each with
advantages and drawbacks. A wide range of insecticides classes control the pest to some extent
but have variable negative effects on beneficial insects, the environment, and human health
(Wise and Whalon 2009). Integrated pest management strategies for plum curculio are limited,
so alternative strategies rely on full-orchard insecticide sprays at petal fall and then use limited
sprays to target adults as they enter an orchard’s perimeter, reducing the need for sprays in an
orchard’s center (Leskey et al. 2009). These sprays can target either the entire perimeter

4
(Chouinard et al. 1992, Vincent et al. 1997, Piñero et al. 2011) or trap trees designed to attract
adults (Leskey et al. 2008). Effective use of these strategies relies upon growers being willing to
both evaluate orchard risk via trapping (Chouinard et al. 2001) and accept some fruit damage
(Leskey et al. 2008).
Light-colored particle films like kaolin clays are known to provide partial control of plum
curculios (Lalancette et al. 2005). These are known to affect the visual appearance of fruit
(Lemoyne et al. 2008), which likely reduces the host-finding success of arthropods (Glenn and
Puterka 2005) with some potential negative effects on non-target arthropods (Sackett et al. 2007,
Markó et al. 2008). Kaolin effectiveness is reduced in wet and windy conditions, and it is
important to get proper fruit coverage for full protective effect against arthropod damage (Glenn
and Puterka 2005).
Soil-Based Control. Plum curculio pupation in the soil may be affected by several
control strategies. Insect growth regulators such as novaluron (Wise et al. 2007) and
pyriproxyfen (Hoffman et al. 2007) may be used to negatively influence plum curculio
development and reproduction. Plum curculios are also susceptible to insect pathogens and
parasites to while in the soil. These agents are particularly attractive as FQPA-compliant control
tools because they are arthropod-specific and are not considered toxic so can be used at any time
without fear of environmental or crop contamination (Lacey and Shapiro-Ilan 2008).
Known effective entomopathogenic agents include fungi and nematodes. Isolate varieties
of the fungal agents Beauveria bassiana (Balsamo) Vuillemin and Metarhizium anisopliae
(Metschnikoff) Sorokin reduce plum curculio survival (Tedders et al. 1982, Alston et al. 2005,
Jenkins et al. 2006, Pereault et al. 2009). The nematodes Heterorhabditis bacteriophora
(Poinar), Steinernema feltiae (Filipjev), S. carpocapsae (Weiser) and S. riobrave (Cabanillas,

5
Poinar, and Raulston) all reduce plum curculio survival (Alston et al. 2005, Shapiro-Ilan et al.
2004, Shapiro-Ilan et al. 2008, Pereault et al. 2009, Shapiro-Ilan et al. 2013), with S. riobrave the
most effective, consistently reducing pupae survival in the referenced field tests by 77 to 100%.
However, although aqueous solutions containing pathogens for soil-based control are easily
applied to soil (Bateman et al. 2007), the efficacy of many entomopathogenic fungi and
nematodes rapidly degrades if exposed to unfavorable abiotic conditions. Ultra-violet light
destroys exposed fungi and nematodes in a few minutes, and drier soil conditions limit nematode
motility and the opportunities for fungal sporulation and spore germination (Wraight et al. 2007,
Koppenhöfer 2007). Biotic factors may also reduce nematode concentration and effectiveness,
such as natural predators of nematodes (Kaya 2002). Therefore, if soil-based pathogens are to be
effectively used against plum curculio larvae with minimal pathogen waste, it will be necessary
to predict the timing of larval emergence from fruit and entrance into the soil.
Monitoring Tools. A major reason why plum curculio control currently relies on
insecticides is that, historically, monitoring technology was inadequate (Leskey et al. 2009).
Historically, plum curculio presence could not be reliably detected without examining fruit or
jarring the insects out of trees (e.g. Le Blanc et al. 1984). Since 1994, a number of trap designs
have been created which capture adults prior to petal fall. These include pyramid traps, Plexiglas
panel and other screen traps, and on-tree traps that either mimic branches or intercept adults
walking up the trunk (Leskey et al. 2009). Unfortunately, trap captures in all these devices are
not reliable enough to predict subsequent fruit damage and infestation (Prokopy et al. 2003,
Leskey and Wright 2004b). An insecticide-spray threshold of 0.1 adults per pyramid trap was
established for the southern strain by Johnson et al. (2002), but this value is so low that

6
employing it for management decisions will likely result in sprays as soon as adults are detected
in the traps.
To improve the monitoring of plum curculio, new trap technology needs to capture more
adults, so that population sample size per trap is sufficient to reliably determine the size of the
wild population. An added benefit of higher trap capture rates is that more of the potential pest
will be removed from the orchard environment. Also, new trap technology needs to provide
more information about plum curculios so that the activity of the adults, not just their presence,
can be predicted. Finally, new trap technology cannot place extraordinary burdens upon
growers, either in terms of cost or labor.
Dissertation Objectives. The preceding review demonstrates how two factors - poor
application timing for soil-based control methods and poor extant monitoring technology – limit
soil-based control options for plum curculio management. The research focus in this dissertation
was to elucidate ways to overcome these two limitations so that minimal-pesticide options for
plum curculio management may become more commercially viable.
First Objective. The first dissertation objective was to examine environmental factors
influencing larval plum curculio emergence from fruit. To make efficient use of resources, this
effort focused on determining if a phenological model developed for southern-strain plum
curculio by Lan et al. (2004) accurately predicted development of the northern strain. While
investigating this model’s potential, other factors potentially influencing the development of
larvae were examined, including fruit host, the presence of other larvae in fruit, and variable
temperature conditions.
Second Objective. The second dissertation objective was to develop technology to
observe plum curculio field activity while also improving the logistical feasibility of intense

7
monitoring. This effort focused on developing an automated trap that could continuously record
the timing of plum curculio captures. Included with this study was an economic analysis of the
technology’s costs and benefits. A broader goal was to develop a system that permitted
researchers both to monitor the activity of multiple insect species and to precisely correlate this
activity with local weather phenomena.
Third Objective. The third dissertation objective was to determine the response of adult
curculios to contrasts in color and illuminance. This effort focused on evaluating hypotheses
explaining plum curculio movement in both field and laboratory conditions. A broader goal was
to develop knowledge that would permit improvement in the visual appeal of traps, subsequently
increasing trap captures to the point where season-long samples would be considered robust
representations of wild plum curculio adult populations.

8
CHAPTER 1
COMPARING THE EMERGENCE OF NORTHERN STRAIN
PLUM CURCULIO LARVAE FROM MULTIPLE FRUIT VARIETIES
This chapter is intended for submission as an article to the Journal of Economic Entomology.
Abstract
Increasing restrictions on chemical pesticide use in orchards have encouraged the
employment of alternative strategies to control the northern strain of the plum curculio,
Conotrachelus nenuphar (Herbst). Some of these strategies target larvae as they emerge from
fruit, so existing models for larval emergence from fruit were evaluated for accuracy while
examining the effect of multiple larvae and fruit type upon emergence timing. Larval head width
growth rate was established and used to gauge larval development. Larval emergence timing,
quantified as degree days (base 11.1°C), was recorded in tart cherries on trees, and emergence
timing was recorded in multiple apple varieties both in cyclical field conditions and in constant
laboratory conditions. Ovipositing females and fruit were isolated, so larvae in a fruit were all
siblings. Adult emergences from pupation in soil were recorded in the laboratory and compared
with existing model predictions. Model predictions did not accurately reflect the timing of larval
or adult emergence, and future incorporation of factors that could improve models are discussed.
Colder conditions and changing host fruit type had no significant effect on larval emergence
timing but changing host fruit type correlated with a shorter pupation interval. Results suggested
that females preferred to oviposit on multiple fruit rather than lay multiple eggs in one fruit.

9
Higher numbers of larvae per fruit did not significantly alter the timing of first larval emergence,
although more larvae per fruit resulted in a significantly longer emergence period in apples.
Introduction
Plum curculios are a major pests of stone and pome fruit (Leskey et al. 2009), including
tart cherries and apples in Michigan. In the spring, eggs are laid in developing fruit; the larvae
develop through four instars in the fruit and then pupate in soil (Racette et al. 1992). Fruit
infestation potentially ruins market value via damage or premature fruit abscission (Vincent et al.
1999). Integrated pest management strategies are limited by inadequate trapping technology, and
conventional control recommends broad-spectrum insecticides at fruit set (Reissig et al. 1998,
Leskey et al. 2009). Among the alternatives to conventional methods, control of larvae and
pupae using soil applications of entomopathogenic agents like fungi and nematodes has shown
some promise (e.g. Alston et al. 2005, Pereault et al. 2009, Shapiro-Ilan et al. 2013).
Adult northern strain plum curculio activity correlates with temperature (e.g. Owens et al.
1982, Racette et al. 1991, Chouinard et al. 1992, 1993), and can be used to predict oviposition
activity (Reissig et al. 1998, Chouinard et al. 2001, Hoffman et al. 2004, Akotsen-Mensah et al.
2011). Armstrong (1958) examined northern strain plum curculio larval and pupation times.
Using southern strain plum curculio reared on Golden Delicious thinning apples, Lan et al.
(2004) modeled larval and pupal development according to degree days, base 11.1°C and 8.7°C,
respectively. Larvae develop on many different hosts (Maier 1990, Brown 2005, Jenkins et al.
2006, Leskey et al. 2007), but little is known about the influence of the fruit host upon the time
required for larval development. Intraspecific crowding is also known to influence the size of
southern-strain larvae and subsequent adults reared on Red Delicious apples (Jacklin et al. 1968,

10
Jacklin and Yonce 1970), although its effect the development rate of larvae in individual fruit is
unclear.
The purpose of this research was three-fold. First, research was undertaken to determine
if the development models of Lan et al. (2004) could predict northern strain plum curculio
emergence as larvae or adults. It was hoped this approach would allow for efficient use of
limited resources by focusing on phenological model evaluation for future adaptation rather than
on model construction. Second, the effects of three factors that could influence larval emergence
timing were investigated - larval crowding, cyclical vs constant conditions, and variable fruit
host. Third, the research aimed to determine if the presence of multiple larvae per fruit was
likely an artifact of laboratory rearing procedure.
Methods
Overall Approach. Plum curculio larvae were allowed to develop in cherries and
several apple varieties, and fruit were kept in either cyclical (outdoor) or constant (indoor)
environmental conditions. Emergence timing, always expressed as temperature accumulation in
degree days, was recorded for each larva. In some experiments, larvae were placed in jars of soil
and reared to adulthood, with emergence timing again recorded as degree days. The emergence
data from all experiments were used in five different comparisons. The Larval Crowding
Comparison grouped apple fruit according to the number of larvae in each fruit and determined if
increased larvae per fruit affected emergence timing. The Larval Model Comparison determined
if the emergence timing predicted by the Lan et al. (2004) model correlated with observed
emergence timing of larvae reared in different fruit hosts and conditions. The Pupation Model
Comparison determined if the emergence timing predicted by the Lan et al. (2004) model

11
correlated with observed emergence timing of adults reared from different fruit hosts. The
Condition Comparison determined if larval rearing in cyclical or constant conditions affected
emergence timing, while the Variety Comparison determined if rearing larvae on a different
variety of apple affected emergence timing. Two other analyses were conducted; one examined
the effect of fruit size upon the number of larvae per fruit and the other, called the Oviposition
experiment, determined whether gravid females presented with multiple fruit laid enough eggs
that the larvae consumed all fruit flesh. Female oviposition was unreliable in all experiments
where females were isolated with fruit, so the Oviposition experiment also helped to determine if
isolation with fruit likely affected female oviposition behavior.
Larval Development and Head Size Correlation. Larvae emerging from fruit in
outdoor conditions were expected to experience desiccation. It was assumed that the relatively
inflexible larval head capsule would be a measure of individual size resistant to desiccation
(Esperk et al. 2007), and experiments were conducted to correlate growth in maximum larval
head capsule width with degree days (base 11.1°C, from the Lan et al. 2004 model) and
emergence. In 2006, 250 Empire thinning apples (4.5 ± 1 SD cm diameter) were exposed to 250
plum curculio females for six hours at 24 ± 2°C. After oviposition, adults were removed and
apples were held in ventilated plastic containers. At 24-h intervals, both loose larvae and the
larvae from ten dissected apples were counted and their head capsule widths recorded by taking
photographs of larvae under an ocular micrometer installed on a stereo dissecting microscope
(Nikon SMZ1000, Mager Scientific, Inc., Dexter, MI) and then counting image pixels to
determine head width in μm. The procedure was repeated in 2007, except that five apples were
dissected once every twelve hours instead of ten every twenty-four hours.

12
General Rearing Procedures. Fruit Host Selection and Measurement. Lan et al. (2004)
reared larvae on Golden Delicious apples. For this study, Smoothee Golden Delicious apples
and Montmorency cherries were used in field experiments. Trees were subject to routine
phthalimide fungicide applications. Larvae were not reared on cherries in laboratory conditions
rearing protocols have only been established for apple fruit (e.g. Jacklin et al. 1968, Lan et al.
2004, Hoffman et al. 2007). On-tree fruit was scarce in Michigan in 2012 due to widespread
frost damage, so field sites could not provide sufficient apples of the same variety for laboratory
experiments. Instead, Honeycrisp thinning apples from a private farm near Coloma, MI, were
used. In 2013, crab apples were harvested from a Malus hybrid cultivar “Blanche Ames” tree
and a Malus x robusta cultivar “Persicifolia” tree which were part of the W. J. Beal botanical
gardens on the Michigan State University campus. Apples were also harvested from an
unidentified tree in these gardens, and were referred to as the Hybrid apples.
All fruit was stored at 5°C prior to use. In all experiments, maximum fruit diameter was
measured across the pericarp, not from pedicel to blossom end. Diameter was measured at time
of oviposition and, for still-growing fruit, at time of larval emergence where possible. Volume
was calculated from diameter assuming fruit were spherical.
Plum Curculio Source. A colony of plum curculio was sustained at the Michigan State
University (MSU) insectary adults in mesh-topped containers (40 cm by 25 cm by 13 cm height).
Adults fed and oviposited on Liberty thinning apples which had been treated with fungicide
(98.698% water, 0.188% Captan 80DG, 0.045% Benlate 50W, 0.013% Latron B-1956, and
1.057% Diphenylamine (1500 ppm)) and with a 0.026% solution of pyriproxyfen (Esteem,
Valent Biosciences, Libertyville, IL) which, when ingested, removed the requirement for
diapause in adults (Hoffman et al. 2007). Wild adults from Michigan’s Leelanau, Benzie and

13
Manistee counties were added annually to supplement colony genetics. The colony room was
kept at 25°C with a sixteen hour daily photoperiod and no natural light. Larvae developed in the
apples, and after they emerged, they were transferred to mason jars (8 cm diameter, 16 cm
height) full with 750 mL dry sterile potting soil and 125 mL water of soil for pupation to
adulthood. Jars were covered with the funnel top from a pyramid trap to capture emerging
adults. In field experiments in 2012, females were 71-82 post-pupation days old. In the other
apple experiments in 2012, females were 1-44 days old. In 2013, females used in rearing
experiments were 1-55 days old and in the Oviposition experiment they were 1-69 days old. No
damaged or sluggish females were used in the studies and new females were used for each
separate study.
Equipment and Procedures Common to All Larval Rearing Experiments. Data loggers
placed next to the bags recorded temperatures at 30 minute intervals in both the field, laboratory
and insectary studies (WatchDog™ Model 1000s or 425, Spectrum Technologies, Inc.,
Plainfield, IL). All indoor environments used fluorescent lights set for a 16 hr photoperiod.
Square bags were sewn from white mesh (24 by 20 threads per inch, Bioquip product 7250A)
with a draw-string of 24 gauge wire. When flat, the 200 small bags for cherries were 6 by 8 cm
while the 200 large bags for apples were 14 by 15 cm. In all experiments, each bag contained a
single fruit.
For on-tree experiments, bag openings were drawn around the stem while excess wire
was tied around the branch to be a support for bag weight. In experiments using harvested fruit,
all bags were kept in wooden crates originally used to store harvested apples. The wooden crates
(44 by 38 by 30 cm height) had gaps between side slats permitting air exchange, and a white,
opaque plastic lid covered the open top of the crate. Harvested fruits were placed in bags, and

14
bags openings were drawn closed and then hung by their wire from the slats of each crate. Bags
were hung inside the crate and were evenly distributed between all upper and lower slats. Fruit
in the bags either rested at the bottom or was suspended by a hammock of green-coated plant-
training wire (insectary experiments only).
A female was introduced to each bag and the fruit was checked regularly for oviposition
scars. Dead females found were replaced with fresh ones. Once scars were present, the female
was removed and the bag was checked regularly for the presence of larvae. If females repeatedly
died or refused to leave scars, they were removed but the apple remained part of the experiment.
If living larvae were found in bags, it was assumed that the larvae emerged in 30 minutes prior to
observation. Larvae found living were either returned to the colony population or used in
pupation timing experiments. Dead larvae found shriveled and hard were assumed to have
emerged 24 hours before observation and dead but still soft larvae were assumed to have
emerged six hours before observation. Head widths of dead larvae in tenths of a millimeter were
visually determined using just the ocular micrometer on the Nikon microscope. Experiments
ended when no larvae had emerged from any fruit for at least one week. At this point, fruit was
dissected and the status and size of any larvae in the fruit was recorded, as was the general
condition of the fruit.
Equipment and Procedures Common to All Pupae Rearing Experiments. Larvae from
one fruit variety which emerged on a single day were isolated in one jar on the same day they
were collected. Each jar was a mason jar (8 cm diameter, 16 cm height) full with 750 mL dry
sterile potting soil and 125 mL water. Jars were always kept in the MSU insectary. A funnel
trap was placed over the jar opening to capture all adults that later emerged from the soil.

15
Emerging adults trapped by the funnel were counted daily until no adults emerged for week and
the soil was then frozen and discarded.
Rearing Larvae in Growing Fruit on Trees. Cherries. In May 2012, 50 small bags
were placed over undamaged Montmorency variety tart cherry fruit growing on trees at each of
four locations in southwest Michigan. Three sites were MSU research facilities (the East
Lansing Campus (EL), Clarksville Research Center (CRC) and Trevor Nichols Research Center
(TNRC)) and one was a private farm near Coloma, MI. Five cherries from ten trees were used
at CRC and TNRC, but scarcity of usable cherries meant that 25 cherries from two trees were
used on the private farm and all 50 bags were placed on the cherries of one tree in EL. Cherry
diameter was measured (on 29 May for MSU, on 26 May for other sites) and the diameters of 80
cherries still in good, plump condition were measured before final fruit dissection (10-11 July).
Females oviposited from 29 May to 1 June at the MSU site; all the other three sites they
oviposited from 26 May to 1 June. Sites were revisited on the following days: 14 June, every
day from 19 June to 23 June, and then every other day until 1 July. If larvae emerged or if
cherries detached from the tree, bags were taken off trees. Indoors in the laboratory, the
detached bags were kept in trays above paper towels which were regularly dampened, and the
trays were tightly covered in translucent plastic sheet to keep interior humidity high. Bags were
observed daily and emerged larvae recorded. All bags remaining on the tree were cut down on 1
July. Last larval emergence in the laboratory was on 3 July, final dissection was 10-11 July.
Apples. In June 2012, 200 bags were placed over undamaged Smoothee Golden
Delicious cultivar apples growing on two rows of trees at CRC. Cut quarters of thinning apples
were placed in every bag as an alternative food source for females. Female oviposition began
between 3 to 6 June and ended on 12 June. All apple trees were revisited every two to four days

16
from 27 June to 7 August. If larvae emerged or if apples detached from the tree, the bag was
taken off the tree and hung in a crate placed under the trees of an untended pear orchard in
Lansing, MI. Crates were revisited every day from 27 July to 6 August and all emerged larvae
counted. All apples remaining at CRC were cut down on 7 August and all apples in the crates
were dissected on 13 August, 21 days after the last larva had emerged.
Rearing Larvae in Harvested Fruit. Outdoors. The two outdoor Honeycrisp apple
experiments occurred in autumn 2012, termed Autumn Shade and Autumn Sun. Each
experiment used one crate of 50 bagged apples. In the MSU insectary, females oviposited from
22 to 28 August. The Autumn Shade experiment crate was then placed in the shade of the
untended pear orchard. The Autumn Sun experiment crate was placed in a corridor between two
glass houses on the MSU campus. For both experiments, emerged larvae were counted from 18
September and 6 October, with final dissection on 8 November.
Indoors. The two indoor Honeycrisp apple experiments occurred in summer 2013, termed
Insectary A and Insectary B. Each experiment used one crate of 50 bagged apples always kept in
the MSU Insectary. In the Insectary A experiment, apples were dissected within a few days of
first larval emergence. Females oviposited from 17 May to 23 May; emerged larvae were
counted from 27 May to 12 June, 14 June, 17 June and 20 June. Fruit were put into cooler
storage until dissection on 1 July. In the Insectary B experiment, females oviposited from 12 to
20 June and emerged larvae were counted from 26 June to 1 August. Final dissection was on 9
August, one week after the last larval emergence.
Two indoor Hybrid apple experiments also occurred in summer 2013. Each experiment
used one crate of 50 bagged apples always kept in the MSU insectary. Females oviposited from
9 to 16 July, emerged larvae were counted from 23 July to either 5 August or 12 August, with

17
final dissection on either 12 or 19 August, one week after the last larval emergence. For
analysis, study results from both crates were combined and termed the Insectary C results.
Pupation in the Laboratory. In 2013, freshly-emerged larvae were transferred to soil
jars and were reared to adulthood in four experiments. In two of these experiments, larvae
emerged from Insectary B and C experiments. In the other two experiments, larvae emerged
from either the Blanche Ames crab apples or the Persicifolia crab apples. The larvae from each
of these latter two hosts were reared from a tray containing 150 apples, with oviposition and
larvae-rearing procedures being the same as the Oviposition experiment described later in these
Methods.
Degree-Day Calculations. Degree day accumulation for each emergence was calculated
according the parameters of the Lan et al. (2004) model. All degree days were calculated after
first removing the lower threshold, which Lan et al. (2004) specified was 8.7°C for any pupation
to occur. For larval development, the lower and upper thresholds beyond which no development
occurred were 11.1°C and 35°C. The model also incorporated a correcting factor for effective
temperature above 30°C, which multiplied ambient temperature by six and subtracted the result
from 210 before subtracting the lower threshold. When factoring in the subtraction of the lower
threshold, however, it was found that between 33°C (effective temperature of 12°C) and 35°C,
the suggested correcting factor predicted no development despite the fact that some larval
development was recorded by Lan et al. (2004) at 35°C. Temperatures exceeded 33°C in several
of the environments where larvae were reared in this experiment, so to ensure that these
temperatures had some effect without substantially altering the model, between 33 and 35°C, the
effective temperature was calculated by multiplying temperature by 0.45 and subtracting the

18
result from 26.85. Figure 2 shows the relationship between temperature and degree day when
the model and all correcting factors were combined.
Figure 2. Relationship between ambient temperature and degree day accumulation in
experiments rearing larvae. Equations to determine degree days (DD) for different ranges of
temperature (T): T ≤ 11.1°C: DD = 0, 11.1°C < T ≤ 30°C: DD = T - 11.1, 30°C < T ≤ 33°C: DD
= 210 – 6T – 11.1, 33°C < T < 35°C: DD = 26.85 – 0.45T, T ≥ 35°C: DD = 0.
Emergence Analysis. Data Organization. For both outdoor and indoor experiments,
each fruit was isolated with eggs laid by one unique female so each fruit was considered an
individual sample replicate. The emergence timings of individual larvae from a fruit were
recorded in degree days and were grouped into two categories. The First Emergence category
contained only data from the first larva to emerge from each fruit. The Pre-Dissection category
contained data from all larvae that emerged pre-fruit-dissection. Larvae found at dissection only
contributed to the larval total per fruit, not to emergence timing. For each fruit, the exact timing
of oviposition could not be determined, so two degree day totals were calculated for each fruit,

19
one excluding and one including the degree days belonging to the female oviposition period.
This approach allowed the results to present the widest range of possible degree day
accumulation for each emerging larvae, and separate analyses were performed on each of the two
degree day totals.
Overall Statistical Approach. Emergence timings from each fruit were compared with
the normal distribution using a Ryan-Joiner test (Ryan and Joiner, 1976). Data both including
and excluding the oviposition period was subject to the Ryan-Joiner test, and experimental data
was only used in analysis if both data sets passed the test. Skew in distribution was determined
using the adjusted Fisher-Pearson standardized moment coefficient (G) available with Minitab
14.1 (Minitab, Inc., 2004). Mean degree day results from experiments were always compared
with one-way analyses of variance (ANOVA), and when significant differences were found,
analyses were followed up with a Tukey-Kramer test of minimum significant differences to
account for uneven sample sizes (Hayter 1984). All tests were conducted with Minitab 14.1.
Degree Day Comparisons. The timings of each larval or post-pupation emergence were
always recorded as total degree days accumulated from when an individual was first introduced
to a rearing environment. The Larval Crowding Comparison determined if, in constant
conditions, multiple larvae in an apple influenced subsequent larval emergence timing. Results
from the Insectary B and Insectary C experiments were separated into three different categories –
apples with one to five larvae, apples with six to ten larvae, and apples with eleven or more
larvae. Mean timing of First emergence and all emergence were compared among categories
using an ANOVA. Comparisons of First and Pre-Dissection larval emergence from fruit with
different categories of larvae per fruit were performed using paired t tests.

20
To determine if the Lan et al. (2004) models for both larvae (Larval Model Comparison)
and pupation (Pupation Model Comparison) matched the observed data, the mean degree days
per fruit or per pupation jar were compared with the model’s prediction using an ANOVA.
Larval observations were taken from outdoor and indoor rearing experiments, while pupation
observations only came from indoor rearing.
The Condition Comparison determined if larval emergence was influenced by varying
environmental conditions, using an ANOVA to compare results from experiments using
Honeycrisp apples in different environments (Autumn Sun, Insectary A and Insectary B). The
Variety Comparison determined if larval emergence was influenced by varying fruit type, using
an ANOVA to compare results from all the Insectary experiments (A, B and C) were compared
using ANOVAs. As the Larval Crowding Comparison results showed that larvae-per-fruit
affected mean emergence timing of Pre-Dissection larvae, only the First emergence of larvae was
used in the Condition and Variety Comparisons.
Other Analyses. Correlation between Larvae-per-Fruit and Fruit Volume. For the
Montmorency tart cherries and the Insectary B and C apples, fruit size was first correlated with
the mean number of larvae recorded per fruit type and then with the maximum number larvae
recorded per fruit type. For cherries, size used was size at time of dissection, with damaged or
shrinking fruit excluded from the mean total. Each correlation was fitted to both a linear and a
logarithmic function, and the best correlation was determined by calculating and comparing the
second-order Akaike Information Criteria (AIC) for each data fit (Akaike, 1974).
Oviposition Experiment. To ascertain the number of larvae which emerge from larger
fruit when females have a choice of multiple fruit, 1,920 Liberty apples (picked in June 2013)
were evenly distributed among twenty trays. This experiment occurred in mid-summer 2013

21
when 2012 thinning Honeycrisp apple stocks were exhausted. The diameters of fifty fruits were
recorded. Apples were covered with a netting bag and ten female and three male adult plum
curculios were sealed in the bag for one week. Bag netting was black plastic (7 by 6 threads per
cm) and trays were disposable aluminum roasting trays (52 by 32 by 8 cm). Tray room
temperature was 23°C and a light timer maintained a daily 16-hour photoperiod. Bags were
wetted with 125 mL of water daily. When adults were removed, fruits without feeding or
oviposition scars were also removed and fruit were then transferred to wire cages above metal
trays lined with damp paper towel. Emerging larvae which dropped onto the towels were
counted every day. After a week without any emergence, apples were dissected, their flesh
examined, and remaining larvae counted. Total larval count was divided by the number of fruit
per tray to estimate of the number of larvae per fruit. This estimate was compared with the
number of larvae emerging from other fruit varieties.
Results
Larval Development and Head Size Correlation. In 2006, 107 larvae were collected
from Empire apples and in 2007, 132 larvae were collected. Their respective head widths were
plotted according to degree day (base 11.1°C) accumulation (Figure 3 and Figure 4). In Figure
3, the right-most eight observation periods recorded 29 larvae voluntarily emerging from apples,
with a mean head width of 998.63 ± 44.54 SD μm. In Figure 4, the right-most two observation
periods recorded 5 larvae voluntarily emerging from apples, with a mean head width of 1048.22
± 45.78 SD μm. From these two studies, it was concluded that any larvae emerging with a head
width approximating 1000 μm had developed to full size within the fruit.

22
Figure 3. Mean ± SD larval head width recorded after dissecting ten apples once every 24
hours in 2006.
Figure 4. Mean ± SD larval head width recorded after dissecting five apples once every 12
hours in 2007.

23
Environmental Conditions in All Experiments. Differences among environmental
conditions at all 2012 outdoor sites used in analysis of larval emergence timings are displayed in
Table 1. The table shows the percentage of hours at each site where, according to Lan et al.
(2004) model parameters, degree days either did not accumulate (temperature ≤ 11.1°C or
temperature ≥ 35°C) or accumulation decreased with increasing temperature (between 30°C and
35°C). For indoor experiments, the MSU insectary was a mean of 24.98 ± 0.60 SD °C, ranging
from 23.28 to 27.94°C, and the laboratory space used was a mean of 26.23 ± 1.02 SD°C, ranging
from 22.89 to 28.33°C.
Table 1. Temperature variations in outdoor larval rearing environments. All temperatures
in °C.
Fruit a
Location, bag
status
Date / Time
Window
Mean
± SD
Range
Min-Max
% hrs
< 11.1 b
% hrs
> 30 b
% hrs
> 35 b
M tart
cherry
CRC, on tree 1800 30-May
to 1530 1-Jul
20.56
± 6.46
5.28-
37.06
11.47% 10.63% 0.45%
M tart
cherry
TNRC, on tree 1900 31-May
to 1630 1-Jul
20.07
± 6.58
7.72-
32.78
9.50% 5.26% 0.00%
SGD
apple
CRC, on tree 2000 3-Jun to
1530 28-Jul
24.53
± 7.10
5.72-
44.28
3.00% 24.05% 7.37%
HC
apple
Autumn Sun, in
crate
0000 22-Aug
to 1100 6-Oct
19.41
± 6.62
5.28-
40.61
10.95% 6.83% 1.42%
a M: Montmorency variety, SGD: Smoothee Golden Delicious variety, HC: Honeycrisp variety.
b Percentage of hours in the time window below or above the listed temperature.

24
Larvae Reared in Growing Fruit on Trees. Cherries. From 74 cherries on trees, 78
larvae emerged (CRC: 20 larvae from 19 cherries, Coloma: 17 larvae from 16 cherries, MSU: 26
larvae from 25 cherries, TNRC: 15 larvae from 14 cherries) and 10 more emerged from 9
detached cherries kept indoors (CRC: 1 larvae from 1 cherry, Coloma: 1 larvae from 1 cherry,
MSU: 4 larvae from 4 cherries, TNRC: 4 larvae from 3 cherries). A further 44 larvae were
counted at dissection (CRC: 9, Coloma: 18, MSU: 4, TNRC: 13). Combining emergence and
dissection counts, mean larvae per cherry was 1.21 ± 0.43. One cherry contained three larvae, 21
cherries contained two larvae, and 87 cherries contained one larva. All emerging larvae were the
expected size for fourth instar larvae. Among the 44 dead larvae recovered from the cherries, the
head widths ranged from 0.8 (3 larvae) to 1.1 mm (1 larvae); mean width was 0.982 ± 0.058 SD
mm and mode was 1.0 mm (37 larvae).
Smoothee Golden Delicious Apples. One larva emerged from one on-tree apple at CRC
and eleven subsequently emerged from eight apples in the outdoor crate. No larvae were found
at dissection. The maximum larvae count from a single apple was four and mean larvae per fruit
was 1.2 ± 0.63 SD.
Larvae Reared in Harvested Fruit. Outdoors. In the Autumn Shade experiment,
larvae emerged from 23 apples with 59 more found in 17 apples upon dissection. Mean larvae
per fruit was 6.92 ± 5.08, with a maximum of 20. In the Autumn Sun experiment, 92 larvae
emerged from 24 apples with 40 more found in 16 apples upon dissection. Mean larvae per fruit
was 5.28 ± 3.16 with a maximum of 13. From 108 larvae counted at dissection, head widths
ranged from 0.5 mm (1 larvae) to 1.1 mm (1 larvae); mean width was 0.968 ± 0.082 SD mm and
mode was 1.0 mm (83 larvae) with only 11 larvae having a width of 0.8 mm or less.

25
Indoors. In the Insectary A experiment, 62 larvae emerged from 15 Honeycrisp apples,
with 65 more in 13 apples at early dissection. Mean larvae per fruit was 7.94 ± 5.46 SD with a
maximum of 21. In the Insectary B experiment, 127 larvae emerged from 18 Honeycrisp apples,
with 44 more in 13 apples at dissection. Mean larvae per fruit was 8.55 ± 4.48 with a maximum
of 16. From both experiments, 47 dead larvae were collected. Among these, head width ranged
from 0.8 mm (2 larvae) to 1.1 mm (2 larvae); mean width was 0.953 ± 0.065 SD and mode was
1.0 mm (23 larvae). In the Insectary C experiments, 72 larvae emerged from 15 Hybrid apples,
with 69 more in 14 apples at dissection. Mean larvae per fruit was 8.29 ± 4.03 SD with a
maximum of 14. The experiment collected 66 dead larvae and head widths ranged from 0.6 mm
(1 larvae) to 1.0 mm (55 larvae); mean width was 0.977 ± 0.063 SD, with only two larvae having
a head width of 0.8 mm or less.
Oviposition Reliability. Less than 60% of cherries had larva in them in all of the cherry
rearing experiments. There was successful oviposition in a maximum of 48% of apples in the
Autumn Sun experiment. However, four crates of 50 apples put out to replicate or expand the
scope of experiments described in this research produced no larvae despite being placed in the
insectary and following the same oviposition procedures as used for the other crates.
Adults Reared through Pupation in the Laboratory. Larvae reared on Honeycrisp
apples produced 115 adults (92.74% survival from larvae to adult) in 21 jars. Larvae reared on
Hybrid apples produced 72 adults (84.71% survival) from 16 jars. Larvae reared on Blanches
Ames crab apples produced 76 adults (77.55% survival) from 16 jars. Larvae reared on Hybrid
apples produced 72 adults (72.78% survival) from 19 jars.
Model Predictions. The Lan et al. (2004) model predicted peak larval emergence at
215.50 ± 33.54 SD degree days (base 11.1°C) and peak adult emergence from pupation at 442.40

26
± 112.77 degree days (base 8.7°C). The standard deviation about the mean was calculated from
published confidence intervals (Lan et al. 2004). For these calculations, sample size was
considered to be 80 for the larval mean and 61 for the pupation mean. These totals represented
the maximum number of rearing experiments which contributed to the model and thus ensured
the maximum standard deviation around the mean was used in all comparative analyses.
Data Distribution. In indoor experiments, the distribution of degree days totals for
emergence per fruit or jar were not significantly different from the normal distribution (Ryan-
Joiner test: P > 0.05). There was also no significance difference from the normal distribution
when indoor results were grouped according to larvae-per-fruit. The exception was the skewed
data (G = 2.01) from the eleven-or-more-larvae-per-fruit category of the Pre-Dissection larvae
reared on Hybrid apples (Ryan-Joiner test: P = 0.01). The results from CRC cherries and CRC
on-tree apples were not significantly different from the normal distribution (Ryan-Joiner test: P >
0.10). The distributions of data from the TNRC cherry and Autumn Sun apple experiments
exhibited positive skew (G ≥ 2.25) and were significantly different from the normal distribution
(Ryan-Joiner test: P < 0.05). To correct for skew, results were edited to remove the last two
larvae to emerge from each experiment or category. The edited result distributions were not
significantly different from normal (Ryan-Joiner test: P > 0.05) and Table 2, Table 3 and Table 5
show the edited data and subsequent analysis. The distributions of emergence timings from
Autumn Shade apples, MSU cherries and Coloma cherries were significantly different from the
normal distribution even with the last two larvae to emerge omitted (Ryan-Joiner test: P ≤ 0.042)
so these data were not used in analysis.
Comparisons of Emergence Timings (Degree Days). The Larval Crowding
Comparison results are shown in Table 2, including the fruit and total larvae assigned to each of

27
the three larvae-per-fruit categories, along with their respective mean emergence timings.
Results were separated into the First Emergence and Pre-Dissection categories, and analyses
were performed to exclude and include the oviposition period. There were no significant
differences in emergence timing when comparing separated results according to larvae-per-fruit
(multiple ANOVAs: P > 0.05 in all comparisons). However, significant differences were found
among paired First Emergence and Pre-Dissection results in each larvae-per-fruit category
(paired t tests: P < 0.05), as shown in Table 2.
Table 3 shows the results from the Larval Model Comparison between peak larval
emergence timing predicted by the Lan et al. (2004) model and observed Pre-Dissection larval
emergence timing. Analyses were performed to exclude and include the oviposition period, and
in each set of results there were significant differences in mean emergence timing (Excluding
oviposition period: ANOVA: F = 32.56; df = 5; P < 0.001, Including oviposition period:
ANOVA: F = 77.78; df = 5; P < 0.001). Emergence timing from cherries at all sites was
significantly less than the model predicted when oviposition period was excluded (Tukey-
Kramer test: P < 0.05). For apples, only the emergence timings of larvae from the Insectary C
Hybrid apples (excluding the oviposition period) were not significantly different from the
model’s prediction. All other larval emergence timings in apple experiments were significantly
greater than the model predicted (Tukey-Kramer test: P < 0.05).
Table 4 shows the results from the Pupation Model Comparison between post-pupation
adult emergence timing predicted by the Lan et al. (2004) model and observed adult emergence
timing. There was a significant difference between predicted and observed mean emergence
timings (ANOVA; F = 5.81; df = 3; P < 0.001). With the exception of results from adults whose
larval stages were reared on Hybrid apples, all post-pupation emergence timings observed were

28
significantly different from the Lan et al. (2004) model’s prediction (Tukey-Kramer test: P <
0.05).
Table 5 shows the results from the Condition Comparison correlating larval emergence
timing with environmental conditions. Analyses were performed to exclude and include the
oviposition period, and in each set of results there were no significant differences in mean
emergence timing (Excluding oviposition period: ANOVA: F = 1.51; df = 2; P = 0.22, Including
oviposition period: ANOVA: F = 3.01; df = 2; P = 0.056). Table 5 also shows the data from the
Variety Comparison of emergence timing from experiments Insectary A, B, and C. When both
excluding and including the oviposition period, ANOVAs did not reveal any significant
differences between the three results (Excluding oviposition period: ANOVA: F = 0.08; df = 2;
P = 0.92, Including oviposition period: ANOVA: F = 1.04; df = 2; P = 0.36).

29
Table 2. Degree-days (base 11.1°C) required for larval emergence, according to larvae-per-
fruit category. First Emergence and Pre-Dissection Emergence degree day (DD) results are
presented, both excluding and including the oviposition period. P – values are from paired t tests
comparing DD columns. Asterisks indicate significance (P < 0.05).
Apple variety
Larvae
per
fruita
Apples, Pre-
Dissection
larvae
Mean ± SD DD,
First Emergence
Mean ± SD DD,
Pre-Dissection
Emergence
P -
value
Honeycrisp,
excluding
oviposition
1 to 5 3, 7 192.35 ± 54.99 209.60 ± 44.51 0.423
6 to 10 8, 54 187.54 ± 52.88 270.02 ± 58.27 <0.001*
11+ 7, 66 204.61 ± 39.38 321.16 ± 86.10 0.001*
Honeycrisp,
including
oviposition
1 to 5 3, 7 303.43 ± 54.99 320.69 ± 44.51 0.423
6 to 10 8, 54 277.62 ± 20.23 360.10 ± 29.99 <0.001*
11+ 7, 66 279.70 ± 33.18 396.24 ± 59.35 0.001*
Hybrid,
excluding
oviposition
1 to 5 4, 10 213.80 ± 17.76 238.81 ± 23.30 0.242
6 to 10 5, 24 218.06 ± 17.93 244.38 ± 41.72 0.128
11+ 6, 36 198.90 ± 24.41 224.47 ± 15.55 0.026*
Hybrid,
including
oviposition
1 to 5 4, 10 265.41 ± 44.55 290.42 ± 35.43 0.242
6 to 10 5, 24 255.31 ± 17.93 281.64 ± 41.72 0.128
11+ 6, 36 236.16 ± 24.41 261.73 ± 15.55 0.026*
a Total included larvae found at dissection for each fruit.

30
Table 3. Mean degree-days (base 11.1°C) per fruit required for Pre-Dissection emergence
of larvae. Degree day (DD) results excluding and including the oviposition period are
presented. Means with the same letter in the same column are not significantly different from
each other (Tukey–Kramer test, P < 0.05).
Fruit a
Rearing location
or experiment
Fruit, Larvae
analyzed
Mean ± SD DD
excluding
oviposition period
Mean ± SD DD
including
oviposition period
GD apple Lan et al. 2004
Model
80 rearing
experiments
215.50b ± 33.54 215.50x ± 33.54
M tart cherry TNRC 15, 17 167.55a ± 15.74 206.10x ± 19.12
M tart cherry CRC 20, 21 164.04a ± 15.07 202.76x ± 15.07
Hybrid apple Insectary C 15, 72 243.51bc ± 40.27 284.60y ± 42.18
HC apple Insectary B 18, 127 279.84c ± 76.59 367.59z ± 50.98
SGD apple CRC 9, 12 316.43cd ± 54.43 346.36z ± 63.60
a GD: Golden Delicious variety, M: Montmorency variety, HC: Honeycrisp variety, SGD:
Smoothee Golden Delicious variety.

31
Table 4. Mean degree-days (base 8.7°C) per pupation jar required for emergence of all
adults in each jar. Mean degree days (DD) with the same letter in the same column are not
significantly different from each other (Tukey–Kramer test, P < 0.05).
Apple variety
of larval host
Experiment Source
Jar, Adult
counts
Mean ± SD DD to
adult emergence
Golden
Delicious
Lan et al. 2004
Model
61 rearing
experiments
442.40b ± 112.77
Honeycrisp Insectary B 21, 115 375.95a ± 17.63
Blanche Ames Tray Rearing 16, 76 375.85a ± 21.64
Persicifolia Tray Rearing 19, 72 365.02a ± 14.78
Hybrid Insectary C 16, 72 408.74b ± 36.84
Table 5. Mean degree-days (base 11.1°C) required for First emergence of larvae from each
different fruit and location. Degree day (DD) results excluding and including the oviposition
period are presented. The insectary studies were conducted at separate times. Mean degree days
(DD) in the same column were not significantly different from each other (ANOVA, P > 0.05).
Apple variety
of larval host
Experiment
Fruit
count
Mean ± SD DD
excluding
oviposition period
Mean ± SD DD
including
oviposition period
Honeycrisp Autumn Sun 22 189.45 ± 3.38 262.07 ± 3.24
Honeycrisp Insectary A 15 208.03 ± 25.56 266.43 ± 38.67
Honeycrisp Insectary B 18 204.02 ± 56.25 282.55 ± 31.52
Hybrid Insectary C 15 209.25 ± 21.25 269.88 ± 32.29
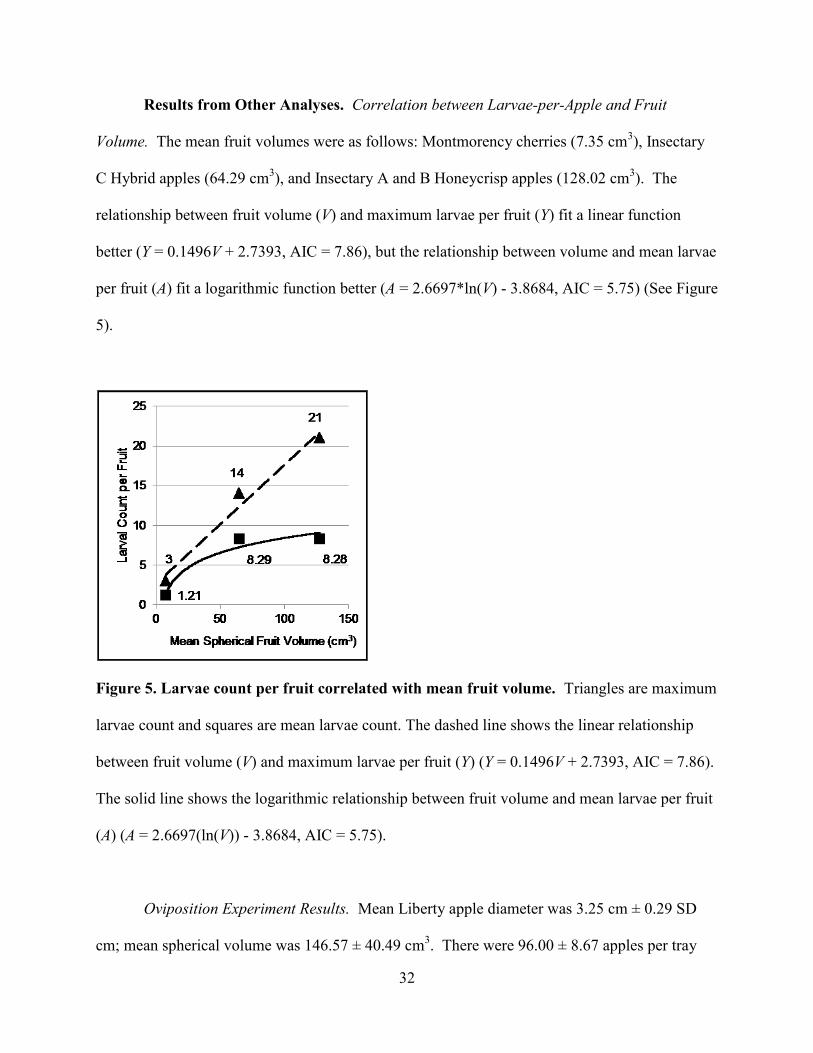
32
Results from Other Analyses. Correlation between Larvae-per-Apple and Fruit
Volume. The mean fruit volumes were as follows: Montmorency cherries (7.35 cm3), Insectary
C Hybrid apples (64.29 cm3), and Insectary A and B Honeycrisp apples (128.02 cm
3). The
relationship between fruit volume (V) and maximum larvae per fruit (Y) fit a linear function
better (Y = 0.1496V + 2.7393, AIC = 7.86), but the relationship between volume and mean larvae
per fruit (A) fit a logarithmic function better (A = 2.6697*ln(V) - 3.8684, AIC = 5.75) (See Figure
5).
Figure 5. Larvae count per fruit correlated with mean fruit volume. Triangles are maximum
larvae count and squares are mean larvae count. The dashed line shows the linear relationship
between fruit volume (V) and maximum larvae per fruit (Y) (Y = 0.1496V + 2.7393, AIC = 7.86).
The solid line shows the logarithmic relationship between fruit volume and mean larvae per fruit
(A) (A = 2.6697(ln(V)) - 3.8684, AIC = 5.75).
Oviposition Experiment Results. Mean Liberty apple diameter was 3.25 cm ± 0.29 SD
cm; mean spherical volume was 146.57 ± 40.49 cm3. There were 96.00 ± 8.67 apples per tray

33
was and 87.42 ± 13.45% of the 13 plum curculios in each tray were still alive after the
oviposition week. A mean of 82.66 ± 15.22% of apples had scars. After unscarred apples were
removed, mean apple count per tray was 79.00 ± 14.08, and these apples subsequently produced
2974 larvae, a mean of 148.70 ± 72.67 larvae per tray. Mean larval production per female was
14.87 ± 7.27 and mean larvae per fruit was calculated as 1.84 ± 0.80. When dissected in late
August 2013, none of the apples in any tray were hollow shells consisting of only skin and
inedible core remains; many were shriveled but all still had edible flesh. In contrast, in the
Insectary B experiments, ten apples had ten or more larvae per apple, and nine of these apples
were noted as being fleshless husks of inedible skin, core and frass at time of dissection.
Discussion
Although the Lan et al. (2004) model over-estimates the temperature accumulation
needed for northern-strain larval emergence from tart cherries in Michigan, the model may still
provide useful phenological information. When the oviposition period was included, the model’s
prediction and observed mean larval emergence were only different by a maximum of nine
degree days (base 11.1°C) at one site. In a hot Michigan summer, this degree day accumulation
could happen in a day, so the existing model could reasonably estimate first emergence of larvae.
Zavalloni et al. (2006) developed a precise model for tart cherry flower and fruit development in
Michigan based upon degree day accumulation. This model could be used to estimate the timing
of plum curculio oviposition, and the Lan et al. (2004) model could be used to estimate the
timing of larval development in field conditions, giving tart cherry growers and pest managers a
method for reasonably knowing when larvae would be entering the soil without requiring direct

34
monitoring of falling fruit. However, other possible factors affecting larval development,
discussed below, should be considered before the model is used in cherry management decisions.
In contrast to cherries, the 100+ degree day differences between the model’s predictions
and the recorded larval emergence times from on-tree apples make it inadequate for decision-
making in Michigan apple management. The Lan et al. (2004) model was based upon peak
emergence, not first emergence, so the Insectary A and B experiments also indicated that the
model significantly underestimated development time. Thus, to be useful, the model will have to
be adjusted to account for either larval diet or strain of plum curculio. The Variety Comparison
of the larvae emerging from Honeycrisp and Hybrid apples in the insectary did not indicate that
apple variety significantly affected the emergence timing of the larvae, but in the Pupation
Model Comparison, the model significantly overestimated the emergence timing of adults reared
on three of the four apple varieties in insectary conditions. Future research is needed to
understand why host did not affect larval emergence timing but apparently influenced pupation
timing.
Insect development is commonly observed to proceed more rapidly at fluctuating
temperatures than at constant temperatures (Wagner 1984). Lan et al. (2004) acknowledged that
the model may not properly estimate larval development when temperatures are below 11.1°C or
above 30°C. This study’s apple results support this claim for hotter temperatures; Larval Model
Comparison results indicated that Pre-Dissection larvae in the hottest environment (CRC apples
in June) accumulated more degree days before emergence than the Lan et al. (2004) model
predicted. For colder temperatures, the Condition Comparison results indicated that the model
predicted larval emergence with reasonable accuracy. If the model or one like it is to function in
Michigan in the middle of summer, future research should focus on improving model portrayal

35
of development at hotter temperatures. Temperatures both below 11.1°C and above 30°C were
recorded at all cherry sites, so the fact that the Lan et al. (2004) model adequately predicted
larval emergence from cherries may have been due to coincidence rather than the model
accurately portraying larval development rate.
The model relied on ambient temperature and did not account for temperature penetration
into fruit, as acknowledged by Lan et al. (2004). Daily fluctuations common in ambient
temperature may not be transmitted to the interior of the fruit, and the effect of solar radiation on
fruit surface in field conditions is also not likely accounted for in the model. An additional
future challenge will be to account for plum-curculio-infested fruit abscising and falling to the
orchard floor (Levine and Hall 1977), which will change the exterior environment influencing
fruit interior temperature. Also, the behavioral and other factors that guide larval emergence
from fruit are unknown. In both this study and others (e.g. Quaintance and Jenne 1912), a small
number of dissected apples contained plum curculio pupae, indicating that the larvae either did
not or could not leave the fruit environment. A better understanding of what motivates larval to
emerge may be necessary to correctly predict when larvae are entering the soil.
Head width measurements of dead larvae indicated that most larval head widths were the
expected size (1.0 mm) for larvae at 150+ degree days (base 11.1°C) according to the 2006 and
2007 studies. Despite having larger individual fruit available, the absence of hollowed-out
Liberty apples in the Oviposition experiment suggests that females did not lay ten or more eggs
per fruit as they did when isolated with Honeycrisp apples in the Insectary B experiment.
Butkewich et al. (1987) found that the presence of wounds on fruit had the effect of both
increasing and decreasing the likelihood of female plum curculio oviposition on apples, so what
motivates females to lay multiple eggs in one fruit is unclear. Overall, the Oviposition

36
experiment results suggest that while it may be possible for enough eggs to be laid by one female
that the larvae completely consume the fruit, if given many fruit options, females apparently
oviposit in multiple fruit rather than multiple times in one fruit.
Jacklin et al. (1968) determined that mean plum curculio larval weight decreased with an
increase in the number of larvae per fruit, and Jacklin and Yonce (1970) showed that lower-
weight larvae were less fecund in adulthood. Larval Crowding Comparison results do not
suggest that the first factor would affect first larval emergence from each fruit. However, the
results did suggest that multiple larvae will not emerge all at once, but will emerge over time,
significantly increasing the window of emergence.
The similarity of mean larvae from both Honeycrisp and Hybrid apples suggests that
when isolated with fruit, females laid a maximum number of eggs per fruit apples despite the
difference in volume. Also, at dissection, no partial larval remains were discovered and
undersized larvae were found alongside larger larvae. It is therefore unlikely that larvae ate their
siblings, which agrees with Jacklin et al. (1968). When combined with Oviposition experiment
data, the results instead suggest that unless isolated with fruit in laboratory conditions, eggs-laid-
per-fruit by females on average is not proportional to the available flesh in the fruit.
In conclusion, the results suggest that models like that described by Lan et al. (2004)
need to incorporate additional variables if the emergence of plum curculio larvae from fruit is to
be predicted in field conditions. The causes of multiple larvae-per-fruit also needs further
investigation, but results so far suggest that females lay a limited number of eggs per fruit even
when fruit can support more, reducing the potential effect of multiple-larvae-per-fruit on any
subsequent larval emergence window.

37
CHAPTER 2
PRECISE AND LOW-COST MONITORING OF PLUM CURCULIO
PEST ACTIVITY IN PYRAMID TRAPS WITH CAMERAS
This chapter was published in the journal Environmental Entomology, volume 43 (2), pages 421-
431. Article authors were R. D. Selby, S. H. Gage and M. E. Whalon. Copyright was
transferred to the Entomological Society of America and permission to submit the document as
part of this dissertation was granted by the Entomological Society of America (see Appendix C).
Abstract
Incorporating camera systems into insect traps potentially benefits insect phenology
modeling, non-lethal insect monitoring, and research into the automated identification of traps
counts. Cameras originally for monitoring mammals were instead adapted to monitor the
entrance to pyramid traps designed to capture the plum curculio, Conotrachelus nenuphar
(Herbst). Using released adults, two new trap designs (v.I and v.II) were field-tested alongside
conventional pyramid traps at one site in autumn 2010 and at four sites in autumn 2012. The
traps were evaluated on the basis of battery power, ease-of-maintenance, adaptability, required-
user-skills, cost (including labor), and accuracy-of-results. The v.II design fully surpassed
expectations except that some trapped adults were not photographed. In 2012, thirteen of the
twenty-four traps recorded every adult entering the traps during the eighteen day study period,
and in the traps where some adults were not photographed, over ninety percent of the omissions
could be explained by component failure or external interference with the motion sensor.

38
Significantly more adults entered the camera traps between six in the evening and midnight.
When compared with conventional pyramid traps, the v.I traps collected a similar number of
adults. Two observed but not significant trends were that the v.I traps collected twice as many
plum curculios as the v.II traps while at the same time the v.II traps collected more than twice as
many photos per plum curculio as the v.I traps. The research demonstrates that low-cost, precise
monitoring of field insect populations is feasible without requiring extensive technical expertise.
Introduction
Assessing the status of insect populations in the field is a major component of
entomological research; ecologists and conservationists track and analyze changes in insect
populations (Southwood 2000, Stewart 2012) and the monitoring of pests and their natural
enemies by agricultural crop scouts is a cornerstone of integrated pest management (IPM)
(Kogan 1998, Maredia 2003). Sampling programs to estimate insect population size or activity
frequently have to choose between 1) using extensive sampling programs that cover a large area
but subsequently limit the number of samples taken per site or 2) using intensive sampling
programs that study a small area with a greater number of samples to increase the precision of
analyses (Pedigo 1994, Southwood 2000). However, low-cost electronic devices that
automatically collect insect samples have the potential to negate the need for this choice by
permitting researchers to intensively record numerous samples from a large number of sites
every day without requiring human presence at all sites.
Across the globe in recent years, researchers have been investigating approaches that
combine insect traps with modern information technology to automatically monitor insect
populations under field conditions. Recently published promising approaches to counting insects

39
include the use of motion sensors (Liao et al. 2012), cameras (Fukatsu et al. 2011, Guarnieri et
al. 2011, Tirelli et al. 2011, López et al. 2012), and sound recognition (Blumstein et al 2011,
Mankin et al. 2011).
Automated traps offer multiple potential benefits to field entomology. Automated
intensive sampling would permit continuous insect activity monitoring throughout the diurnal
and nocturnal cycles which, when combined with the near-continuous data already recorded by
modern automated weather stations, would greatly increase the precision of phenological
modeling. The latter would be of particular importance in hot environments where daily records
of insect activity correlate poorly with degree-day totals due to high daily temperature
accumulation (Worner 1998). Affordable systems that could deploy multiple sensors would also
permit assessment of variations in insect population activity on a large spatial scale in both short-
term studies (e.g. daily movement patterns) and long-term monitoring (e.g. precisely recording
small phenological shifts in response to climate variations). Monitoring traps with wireless
technology (either Wi-Fi intranet or cell-phone signal) potentially reduces the need for travel by
permitting trap data, status, setting and data-processing to be monitored in real time from a
distant location (Tirelli et al. 2011, López et al. 2012). If wireless infrastructure is either not
available or is an unnecessary expense, recording data locally will still provide intensive
sampling options at remote locations.
The advent of affordable motion-sensor-triggered cameras has greatly expanded
zoological researchers’ ability to monitor the abundance of elusive or nocturnal vertebrate
species at remote locations without resorting to trapping (Rowcliffe and Carbone 2008). In
entomology, non-destructive systems taking only photographs or sound recordings as samples
could also be used study insect populations as part of conservation efforts. Furthermore, digital

40
samples from insect populations have the potential to be examined and interpreted very rapidly
via image recognition software. Although still in the early stages of development, digital
systems are capable of identifying trapped insects to species via photographs (Larios et al. 2008,
Wen et al. 2009) or sound recordings (Hao et al. 2013), so potentially offer a method for
automating the counting of trap collections and improving both species-specific and overall
arthropod biodiversity assessment. If focused on pests, these types of systems would complement
the ongoing development of online and hand-held device software designed to provide decision
support to practitioners of IPM.
The overall goal of this study was to design an electronic insect monitoring system which
could be used in a wide variety of entomological research projects. The attainment of this goal
was determined by six criteria which the system design had to surpass. First, the design had to
deliver an accurate record of insect activity in the traps, and prototype success had to be
transferable to mass-produced units. Second, the design had to have a useful battery life. Third,
the field-ready design needed to be robust with most system problems both easily diagnosable
and easily repairable. Fourth, the design had to be potentially adaptable to multiple research
projects. Fifth, the expertise required for constructing and maintaining the final system had to be
minimal. Finally, the cost of system construction wages, material costs, and batteries had to be
less than the cost of a human observer visually monitoring a field site. Meeting these last two
criteria meant that a system had to be made from widely available parts with common tools, had
to run on inexpensive batteries, and could not require extensive construction time.
The system was demonstrated under field conditions using the plum curculio,
Conotrachelus nenuphar (Herbst) (Coleoptera: Curculionidae) as the model insect for the
following four reasons. First, trapping wild populations of this insect and sustaining a lab colony

41
were already part of an on-going pest research program at Michigan State University. The plum
curculio is a native of eastern North American, where it is a major and persistent pest of stone
and pome fruits (Vincent et al. 1999), and a better understanding of the pest’s daily interactions
with its environment will aid in the effective deployment of new, alternative controls (Wise and
Whalon 2009). Second, the pyramid traps used conventionally to catch this insect required them
to crawl upwards into a trap rather than flying or falling, and if the traps were modified to take a
camera, there was good potential for the insects to be clearly photographed. Third, specimens of
plum curculios in Michigan could be identified with certainty from photographs alone thanks to
extensive prior photographic documentation of their elytra patterns, including standardized
comparisons with lookalike species (Whalon, unpublished). Fourth, previous research on plum
curculio trapping and activity patterns permitted comparison between the new camera-carrying
trap and a conventional trap design.
Methods
Trap Modification to Incorporate the Motion-Sensor System. Pyramid traps
(originally conceived for pecan weevil, Curculio caryae (Horn) (Tedders and Wood 1994)) have
proven adequate for collecting plum curculios away from the host trees (Maleckas 1996,
Prokopy et al. 1999, Pinero et al. 2001) (Figure 6). A conventional pyramid trap attracts plum
curculios with a lure (e.g. plum essence (Coombs 2001) and benzaldehyde (Leskey et al. 2005))
hung above the trap that attracts the insects to the vicinity. After alighting on the pyramid base,
the insect crawls upwards into a funnel with a 0.4 cm diameter hole at its vertical apex. The
funnel is surrounded by a collecting container from which there is no escape apart from the
entrance hole. Once inside, the insect is unlikely to retrace its steps and thus is trapped.

42
Figure 6. Diagram of a conventional pyramid trap compared with a trap using a v.II
collecting container and camera. The callout shows the inside of the container.
Collecting Container Modification. The conventional pyramid trap’s collecting container
was redesigned to incorporate a motion sensor and camera monitoring the funnel apex. The
design was based upon the narrow-tube-and-motion-sensor system concept which has
successfully been used for recording insects as they enter a trap (Beerwinkle 2001, Liao et al.
2012), with a camera triggered by the motion sensor to permit multiple species’ identification
(Larios et al. 2008). Commercial plum curculio pyramid traps (Whalon-modified Tedder’s
pyramid trap, Great Lakes IPM Inc., Vestaburg, MI) formed the base. To create the narrow tube,

43
the collecting container space was extended upward using polyvinylchloride (PVC) pipe (Figure
6). This extension was open on one side to permit an attached camera to observe the funnel
apex, and additional waterproof compartments attached to pipe exterior enclosed batteries and
circuits. A second funnel and collecting container (with all contents visible from outside the
container) were attached on top of the pipe. Whenever an arthropod entered the lower container
via the lower funnel apex, the motion sensor was triggered and activated a camera that
photographed the photo space at the funnel apex. Once past the photo space, arthropods
typically kept climbing upwards until they passed through the second funnel apex and became
stuck in the upper container.
Two versions of a camera-incorporating trap (termed the v.I trap and v.II trap) were
created. They used identical circuit designs but different collecting container designs. The v.I
trap containers were made using PVC pipe 9.8 cm in diameter, 24 cm long and funnels with a
similar base width. Two super-bright white light-emitting diodes (LEDs) running on two AA
batteries were pointed at the photo space to provide constant light. The photo space was above a
drinking straw that extended the funnel apex upwards by 1 cm. The two motion sensor diodes
were held in place on either side by polypropylene, glue and drinking straws. While not robust,
the use of these materials in the initial stages of design did permit multiple modifications of the
photo space following tests with adult plum curculios. After the v.I containers proved successful
in the 2010 field tests, the v.II trap container was created to increase system robustness, enhance
lighting, use less material in construction, improve circuit efficiency via reduced wiring, and
reduce production time and cost. The v.II container used smaller PVC pipe and funnels (6.7 cm
in diameter, 14 cm long) and 1.6 cm PVC pipe to hold the motion sensor diodes immediately on
either side of the funnel apex. A single white LED for lighting was positioned closer to the

44
funnel apex (within 2 cm) but was put behind a glue layer so that the light was not too bright.
The upper collecting container was adapted to use a trap design created by Jim Laubach (at Hort
Systems Inc. of Honor, MI) that permitted an easy check of container contents. The v.I container
was painted black to match the pyramid base; the v.II container was not painted.
Camera Modifications. The cameras incorporated into the collecting container designs
were originally created to monitor mammals via a pyroelectric sensor. These cameras already
had a motion-trigger mechanism, had the capability to both shoot and store excellent
photographs of wildlife, had long battery life, were widely available, and were low cost.
Wildview cameras were used in the 2010 demonstration (Extreme 2 model, GSM Outdoors,
Grand Prairie, TX). Moultrie cameras were used in the 2012 demonstration (L-20 model,
Moultrie Feeders, Alabaster, AL). The latter unit’s rear-facing control panel allowed for easy
access when the unit was attached to the trap top. A limitation common to all cameras tested
was that, when triggered once, a camera would take multiple shots in quick succession but then
could not be triggered for sixty seconds, leaving a potential gap in the photo record. All
photographs taken were 0.3 megapixels (Wildview units) or 2.0 megapixels (Moultrie units) in
resolution and had a time and date stamp. Arthropods could be identified in photos despite the
low resolution and the cameras could store nearly five thousand photos on a single four gigabyte
memory card. To use both types of cameras, the Fresnel lens covering the pyroelectric sensor
was removed and by adjusting the internal lens, the focal length of the camera was reduced from
several meters to 9 cm.
The Motion Sensor Circuits. In the motion sensor, an invisible, non-heat, 940 nm
infrared (IR) beam was emitted from the emitter diode and received by a detector diode. When
the beam was interrupted, the detector diode activated a heat emitter adjacent to the camera’s

45
pyroelectric sensor and subsequently activated the camera. Layouts of both the IR emitter circuit
and IR detector circuit are presented in Figure 7.
Figure 7. Circuitry of the v.I and v.II collecting containers, showing how the motion sensor
triggered the camera’s pyroelectric sensor.
Battery Requirements. The camera unit required four C batteries, the pair or single white
LEDs and the IR emitter required two AA batteries each, and the IR detector required a nine volt
battery. Lab and field tests indicated that a single set of camera and white LED batteries would
last for more than a month of field study. The IR emitter reliably lasted for at least five
continuous days on one set of batteries (but was changed once every four days), while the IR
detector reliably operated for at least two continuous days on one battery. All batteries used
were conventional, disposable alkaline batteries, which were most cost effective when compared
with lithium and rechargeable batteries of similar voltages. Solar and other battery options are
considered in the discussion section.

46
Field Demonstration Methods. The 2010 demonstration site was on the Michigan State
University farm, and three more on-farm sites were used in 2012. Each site was at least one
kilometer away from all other sites. Each site was an open field next to mixed-deciduous
woodland with the juncture of field and forest approximating a straight line. Broad-bladed
grasses covered all sites and were mowed pre-trial so that grass height never exceeded 30 cm.
Plum curculio adults and thinning apples collected in Michigan during the summer were
used to rear new adults in a laboratory colony for release-recapture trials in autumn. Successful
releases and demonstrations of trap operation occurred in autumn 2010 and autumn 2012. An
autumn release was attempted in 2011 but insufficient insects were recovered for meaningful
analysis. Daily checks by an observer were ended when plum curculio capture rate per day was
near zero but cameras remained operational for a few days after daily checks ceased. Two
marker solutions were made, one using five percent egg white (remainder water) and the other
using ten percent soy milk (remainder water) for later detection and analysis using sandwich
enzyme-linked immunosorbent assay (ELISA) in the manner described by Jones et al. (2006). In
2010, all released adults were marked with egg and those released on the forest side were also
marked with soy. In 2012, the first release of adults was marked with egg and the second release
marked with soy.
In 2010, three rows of eight traps combining twelve v.I traps and twelve conventional
traps were arranged at Site 1 (Figure 8). Approximately 650 colony-reared plum curculios were
released 2.4 m from either side of the trap line by simply emptying a container of adults into the
grass. Release occurred at 2200 hours 9 September with traps visited and contents observed by a
researcher every day until 20 September. Traps were disassembled on 25 September. In 2012,
the possibility of a low recapture rate like in 2011 meant that conventional pyramid traps were

47
not used in order to maximize the number of plum curculios recorded by the cameras. To
increase the number of study sites while reducing the adults needed for release at each site, three
v.I and three v.II traps were placed in an equal-angled hexagon shape, with each side being 1.2 m
long, and with a side running parallel to the field-forest juncture (Figure 9). Wood-to-field
orientation was different at each site, so that each site pointed in a unique compass direction
(northwest, northeast, southeast, southwest). Adults were released in the middle of the hexagon
by staking down a bucket and then removing the lid. All traps were set up by 1900 hours 9
September and 200 colony-reared adults were released at each site at 0100 hours 12 September.
A subsequent release of 100 adults at each site took place at 1800 hours 17 September. Traps
were visited by an observer every day except two until the last trap check at 1930 hours 24
September when batteries were changed to long-life lithium batteries and then allowed to run
down. Traps were disassembled on 30 September.
Figure 8. Arrangement of traps and release areas in the September 2010 release-recapture
study.

48
Figure 9. Arrangement of traps and the release point in the September 2012 release-
recapture study at one of the four sites.
It was anticipated that low numbers of wild plum curculios would occur at all sites. Site
1 was 200 m from a sprayed conventional orchard and less than 100 m from the site where an
abandoned orchard had been removed earlier in the year. The woodland of Site 3 had a fruit tree
that may have been able to support adult feeding. However, conventional pyramid trapping at all
sites in spring and summer 2012 collected only five adults captured at all sites and did not
suggest that sites had large native plum curculio populations. One wild plum curculio was
captured in the traps prior to the first 2012 release so the examined study period for insect
capture was extended to 0300 hours 10 September until 1800 hours 30 September. The
comprehensive comparison of all 2012 trap photographic records (not just plum curculios)
between trap versions remained limited to only those photographs taken between 0100 hours 12
September and 2100 hours 24 September, when the traps were fully operational and regularly
checked.

49
Camera Reliability Analysis. Camera reliability in 2010 was poor because of inadequate
camera waterproofing, so the 2010 data were only used to compare the total plum curculios
collected by conventional and v.I traps. In 2012, the specimen and the photograph count were
compared across all sites. A trap was considered reliable if the number and timing of
photographs of plum curculios were in synchrony with the total specimens recorded by
observation in the upper collecting containers during daily checks.
Statistical Approach. The photograph and observation record of plum curculios and
other arthropods varied between individual traps to the point where the data did not conform to
any sort of normal distribution. Traps with zero plum curculios or arthropods collected were
omitted from comparative analyses, but the presence of traps with near-zero collection totals
meant that the standard deviation within a sample was frequently similar to the sample mean
while different from other sample deviations. Trap collections therefore were compared using
non-parametric Kruskal-Wallis and Mann-Whitney U-tests which compared sample ranks rather
than means. Significance was always when P ≤ 0.05. All tests were conducted using Minitab
14.1 (Minitab, Inc., 2004).
Cost-Benefit Analysis. Overnight studies of plum curculio movement have occurred in
the past using human observers (e.g. Chouinard et al. 1994). For the cost-benefit analysis, the
hypothetical cost of building and deploying a single v.II camera trap was compared with the cost
for overnight observation of a pyramid trap by a human observer using a flashlight. For the
comparison, it was assumed that there were no travel costs or research site fees, and that all
necessary hand tools needed for constructing the v.II trap were freely available. All labor was
assumed to cost eight dollars per hour, including all benefits.

50
Results
Motion Sensor and Camera Reliability in 2012. For thirteen of the traps, the
photograph and observer records of plum curculio capture were synchronous all twelve times
when the traps were checked by observer during the eighteen day study. Photographs deduced to
be missed after review of the observer record and their determined causes are displayed in Table
6. The term sensor-wire-failure refers to weak, broken or wet circuit connections that were
discovered when checking the traps. These breaks were immediately repaired, but insects may
have entered the traps undetected prior to the discovery. The causes of the long-term failure of
Trap 13 (Site 3) could not be confirmed in the field; post-study, the electronics were working
normally, but the photo space structure of this unit was fragile and prone to disruption through
jarring by the wind (subsequently leaving the motion sensor beam permanently interrupted).
This is also assumed to be the cause of the one-day problem in Trap 11 (Site 3). The camera unit
in Trap 6 (Site 1) recorded a corrupted photograph file early in the study and subsequently
stopped recording photographs; a later clearing of the camera memory and a reset of the system
restored camera functions. Water leakage was not a major problem in 2012 like in 2010, but
water on one of the IR detector circuits temporarily compromised a battery.
In both trap versions, the cameras did not record any plum curculios obviously leaving
the traps. However, the observer data showed that plum curculios were able to move from the
upper container to the lower container, with six plum curculios evidently escaping from the
containers altogether. Both during and after the study, any trap with a broken component was
easily repaired, and apart from the described repair cases, all traps were functioning normally
when thoroughly examined post-study.

51
Table 6. Photographic omissions determined from human observations along with likely
causes of omissions, 2012 field study.
Trap ID,
site
Plum curculio
photo events
missed / expected
Trap
design Cause of missing photograph
7, Site 1 2 / 13 (15%) v.I Uncertain ID (1), Unknown (1)
11, Site 3 7 / 36 (19%) v.I Sensor failure for 1 day
16, Site 4 1 / 5 (20%) v.I Unknown
15, Site 4 6 / 13 (46%) v.I Uncertain ID
14, Site 4 7 / 8 (88%) v.I Sensor wire failure
13, Site 3 9 / 9 (100%) v.I Sensor failure for unknown reasons
25, Site 4 1 / 2 (50%) v.II Unknown
19, Site 1 7 / 11 (64%) v.II Plum curculio in sensor (4), Unknown (3)
24, Site 3 12 / 13 (92%) v.II Spiders in sensor, sensor wire failure
20, Site 2 2 / 2 (100%) v.II Sensor short circuit due to moisture
26, Site 4 0 / 0 (0%) v.II Camera stopped logging photographs
Comparing Different Trap Versions. In 2010, 110 plum curculio specimens were
collected by the conventional pyramid traps and 95 collected by the v.I traps. In 2012, 167 plum
curculios were observed in the trap tops, 111 plum curculios in the v.I traps and 56 in the v.II
traps. A total of 161 specimens were collected, 107 by the v.I traps and 54 by the v.II traps. The
activities of all plum curculios were recorded in 298 photographs, excluding duplicates; the v.I
traps recorded 161 photographs and the v.II traps recorded 137 photographs.

52
In 2010, mean plum curculio count per trap was higher in conventional traps (9.83 ±
10.92 standard deviation) than v.I traps (7.92 ± 8.83). In 2012, mean plum curculio count per
trap was higher in v.I traps (8.92 ± 8.87) than v.II traps (4.5 ± 4.40). Mann-Whitney U-tests
comparing combined plum curculio counts for each trap design revealed no significant
differences between trap designs in either year (n = 12 per trap design, 2010 comparison of
conventional and v.I: W = 138.5; P = 0.53, 2012 comparison of v.I and v.II: W = 178.5, P =
0.11). Results in 2012 were likely skewed by one v.I trap which collected 36 plum curculios, 23
more individuals than the next-highest trap count. If photographic duplicates, photographs
without corroborating human observation, and traps without any plum curculio data were all
excluded from analysis, the trend in 2012 was that the mean count of photographs per plum
curculio captured per trap was greater for v.II traps (5.21 ± 4.34) than v.I traps (2.05 ± 1.20)
(difference not statistically significant, Mann-Whitney U-test: n = 11 for v.I design; n = 8 for v.II
design; W = 87.5; P = 0.07).
Aside from the activities of plum curculios, cameras were triggered by other arthropod
movement and events. All photographs were sorted into event categories and the daily
frequency of each of these events between 0100 hours 12 September 2012 and 2100 hours 24
September 2012 are compared in Table 7. The total non-plum curculio specimens counted in the
traps on 30 September 2012 was 67, and non-plum curculio activity triggered a total of 2,417
photograph events. The smallest recognizable organisms photographed entering the traps were
small ants (Hymenoptera: Formicidae) and moth flies (Diptera: Psychodidae). Common larger
organisms included earwigs (Dermaptera: Forficula) and jumping spiders (Araneae: Salticidae,
Phidippus species), both of which tended to linger in the trap entrance and generate multiple

53
photo events. Human disturbance events occurred when the process of battery change during a
daily check subsequently triggered the camera.
Table 7. Causes of motion-sensor trigger in 2012 as determined from the photographic
record. Columns list the mean recorded triggers per day per trap design (twelve traps per
design) with standard deviation. All differences between v.I and v.II results in each category
were tested with Mann-Whitney U-tests.
Cause of photo event v.I trap v.II trap
Plum curculio trigger 0.96 ± 1.10 1.12 ± 1.50
Other animal trigger 9.06 ± 19.39 7.28 ± 8.38
Human disturbance 0.44 ± 0.22 0.68 ± 0.50
Trigger not identifiable 2.06 ± 4.29 No data
No visible trigger animal 4.88 ± 7.99 28.76 ± 24.27 a
Photos per camera 17.40 ± 21.99 37.84 ± 26.62
a v.II mean significantly greater than v.I mean (Mann-Whitney U-test: W = 107; P = 0.0141).
A particular problem of the v.I traps was that sometimes arthropods entering the traps
could not be identified with certainty (see Table 6 and Table 7). The white LEDs provided night
lighting but when battery power was too low or the circuits were compromised, arthropods at the
funnel apex could not be identified with certainty. Eight of the v.I traps had 317 photograph
events (85% from just two traps) with this problem. The v.II traps recorded significantly more
photographs without an obvious trigger than the v.I traps (Mann-Whitney U-test: v.I: n = 12
traps; v.II: n = 11 traps; W = 107; P = 0.0141).

54
A particular problem of the v.II traps was that smaller arthropods often attempted to hide
in the motion sensor housing, blocking the sensor (see Table 6 and Table 7). Over time, this
typically resulted in an excess of shots of one arthropod. This problem also exacerbated the
problem of the camera’s one minute reset period in which arthropods may have entered the trap
undetected. A second problem of the v.II traps was that there was a wiring hole in the side of the
traps that possibly could have been used by plum curculios to gain entrance to the traps without
photographic record. Pre-study, this hole was assumed to be too small for plum curculios and
filling the hole would have made repairs more complicated, but the one plum curculio found in
the wiring compartment discredits this assumption.
Patterns in Overall Plum Curculio Capture. Unfortunately, post-fieldwork ELISA
results demonstrated enough protein mark cross-contamination that the marker data were not
considered a reliable indicator of an individual plum curculio’s time or location of release.
However, given the low number of wild plum curculios caught in conventional traps before the
releases, it is likely that all plum curculios caught in the field studies were from the releases.
Figure 10 shows the total number of plum curculios observed in the traps on 12, 13, 14,
16, 17, 18, 19, 20, 21, 22, and 24 September 2012, and at final count on 30 September. It also
shows the accumulated photograph total from 1900 hours 9 September 2012 until 2300 hours 30
September 2012. The first plum curculio was a wild adult photographed at 0302 hours 10
September, and the last adult was photographed at 1024 hours 28 September. The number of
observed plum curculios declined on three occasions, presumably because the insects moved
from the upper to the lower collecting container.
Using combined totals from all four sites, Figure 11 shows the distribution of plum
curculio counts via photographs according to hour of day in 2012. Local time observed daylight

55
savings time. Sunset was between 1920 and 1954 hours, sunrise was between 0714 and 0735
hours. Plum curculio counts per quarter were determined by separating the counts from the four
sites according to one-hour periods and then re-combining the data into six-hour blocks (n = 24
per block). When plum curculio counts per quarter were compared with a Kruskal-Wallis test,
there were significant differences (df = 3; P < 0.01), with the 1800 to midnight quarter having
the highest ranked plum curculio count (average rank of 70.5 out of 96 possible ranks).
Figure 10. The total number of plum curculios recorded by trap camera photographs and
by human observation at the top of the trap in 2012. Photograph count is the solid line;
observation count is the dashed line. The final increase in the dashed line represents recording
the final specimen count (161) at trap disassembly. Vertical grid lines indicate midnight at the
start of each new day.

56
Figure 11. Mean + SD number of plum curculios photographed at all sites in September
2012 according to the hour of day. Each column indicates the photos collected in the sixty
minutes after the marked hour. The graph shows the twenty-four hours of the day, from 1200 to
1159 hours. Letters assign hour columns to quarters of the day.
Cost-Benefit Analysis. Overall, using the v.II trap would cost 78% less than employing a
human observer (Table 8). While the v.II trap was initially more expensive, on a per-hour basis,
using the camera would cost 99.47% less than human observation, so if a study was extended for
more than four days, the cost difference of using the v.II trap when compared to human
observation would widen further.
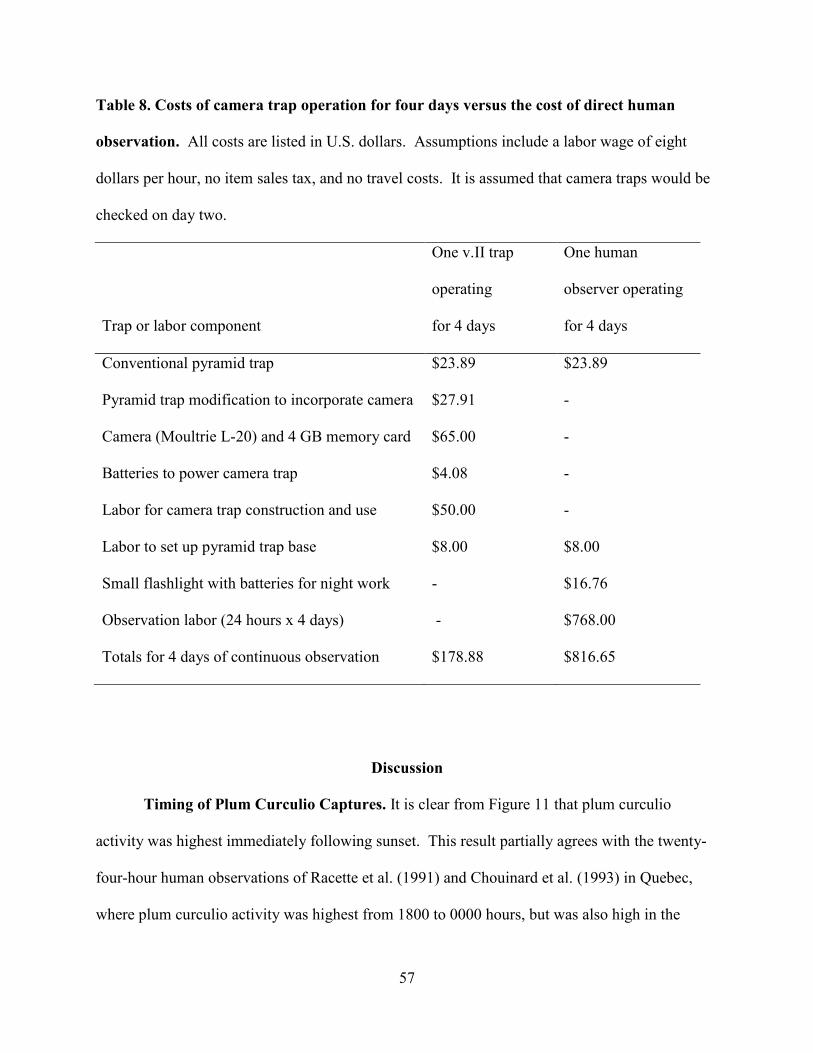
57
Table 8. Costs of camera trap operation for four days versus the cost of direct human
observation. All costs are listed in U.S. dollars. Assumptions include a labor wage of eight
dollars per hour, no item sales tax, and no travel costs. It is assumed that camera traps would be
checked on day two.
Trap or labor component
One v.II trap
operating
for 4 days
One human
observer operating
for 4 days
Conventional pyramid trap $23.89 $23.89
Pyramid trap modification to incorporate camera $27.91 -
Camera (Moultrie L-20) and 4 GB memory card $65.00 -
Batteries to power camera trap $4.08 -
Labor for camera trap construction and use $50.00 -
Labor to set up pyramid trap base $8.00 $8.00
Small flashlight with batteries for night work - $16.76
Observation labor (24 hours x 4 days) - $768.00
Totals for 4 days of continuous observation $178.88 $816.65
Discussion
Timing of Plum Curculio Captures. It is clear from Figure 11 that plum curculio
activity was highest immediately following sunset. This result partially agrees with the twenty-
four-hour human observations of Racette et al. (1991) and Chouinard et al. (1993) in Quebec,
where plum curculio activity was highest from 1800 to 0000 hours, but was also high in the

58
preceding six hours. Dixon et al. (1999) also found that trap counts were greatest when checked
at 9 pm in springtime Massachusetts (no other night time assessments were conducted).
Although this camera trap study was conducted in autumn instead of springtime, the results
suggest that the camera traps obtained similar conclusions about daily plum curculio behavior as
human observation.
Evaluating the System with the Six Criteria. Criterion one was that the system units
had to be reliable, and while there is considerable room for improvement, both the v.I and the
v.II design arguably met this criterion. Overall, v.I system recorded photographs of 71% of the
plum curculios entering the traps while the v.II system recorded photographs of 59%. The
problems of lighting failure and sensor alignment in v.I traps were addressed via the v.II trap
design, but component failure and potential holes in the trap housing still need to be better
addressed in the v.II design. The challenge with building a system is that all components have to
work all the time, and continuous operation in field conditions regularly degrades parts. With
this in mind, it is encouraging that half of the traps that collected plum curculios kept a perfect
record of their activity for eighteen days. The problem of the one-minute camera reset is the
only problem which cannot be addressed at the moment, but may be possible given future
development in commercial wildlife camera design.
Both versions of the traps also surpassed criteria two through four. The power
requirements of the traps necessitated a battery change every two days, which was certainly not
ideal, but which was sufficient for local field system demonstration. System problems could be
diagnosed and repaired. The simple detector circuit could be adapted to multiple trap designs as
long as the target insect could be lured into the photo space. The system recorded other insects,
including very small ones. It was also possible to adapt new cameras to the detector circuit.

59
This is important not only for replacement of damaged cameras but also because it permits the
use of other existing commercial camera designs that have many features beyond those
employed by this study.
Criteria five and six focused on the properties of system production, and both new trap
designs met these criteria with the v.II design requiring less cost and construction time. Both
versions were made using readily available hand tools. The cost benefit analysis clearly
indicated that each new v.II trap only needed a few hours to construct and when deployed could
collect data similar to that from human observation for a small fraction of the cost.
Improving Camera Trap Plum Curculio Capture. Although not a statistically
significant difference, the results suggest that the v.II traps attracted fewer plum curculios than
v.I traps, and by extrapolation, conventional pyramid traps. In terms of camera effectiveness,
when working properly the v.II cameras took many more photographs per plum curculio than the
v.I cameras, which could indicate either that the cameras were more sensitive to their activity or
just that plum curculios were more active within the entrances of the v.II traps. The v.II traps did
not have lighting problems, but they were more prone to interference from insects obstructing the
operation of the motion detector. As described in the methods, the v.II design had many
advantages in terms of design cost, labor and durability. Therefore, future improvements will
focus on improving the plum curculio capture rate and prevention of interference with the motion
sensor of the v.II trap design. Three initial ideas for improving trap capture rate are to increase
the base funnel opening to 11 cm diameter rather than 6 cm diameter, to paint the exterior and
interior black, and to bore more tiny holes into the top of the traps to increase lure odor flowing
through the trap. Overall, the comparison of three trap designs demonstrates that multiple
adjustments to trap structure should be expected when designing a new automated trap because

60
behavioral response of an arthropod does not necessarily transfer from one trap design to
another.
Version II Motion Sensor versus Other Automated Trap Designs. The design most
similar to the v.II design was a modified boll weevil (Anthonomous grandis Boheman) trap
created by Beerwinkle (2001). This design did not employ a camera but a motion sensor did
trigger an air blast into the trap through a gate that ensured no weevil would escape. However,
even with this more complex and robust counting system and with a species-specific trap lure,
4.8% of trap captures were non-weevil arthropods and 3.7% of triggers were false positives.
This outcome suggests that even with an advanced motion sensor, a photographic record of what
triggered the sensor is essential to accurately assess insect activity.
Other designs have taken photographs of trap contents at regular intervals. This has been
demonstrated using custom systems (Fukatsu et al. 2011, López et al. 2012, Yao et al. 2012) and
modified cell phones (Tabuchi et al. 2006, Guarnieri et al. 2011). The power-saving benefits of
such designs have been clearly demonstrated; using a network for data transmission and storage
and a capture frequency of one 640 by 480 pixel photo per half-hour, López et al (2012)
estimated that a field camera would run for seven months without needing a battery change.
While excellent for long-term monitoring, a fixed-interval camera trap is limited in its ability to
distinguish the activities of individual insects and is yet to be effective in trap designs that do not
immobilize or kill the target insect. Furthermore, while a motion sensor device is limited in that
it requires insects to enter a trap sequentially, its total specimen capacity is not limited by the
photographic view of the trap collection area.
Improving Battery Life and Adding New Trap Capabilities. The challenge of reliably
powering a system off the grid for an extended period of time is typically the biggest challenge

61
when using remote electronics in research (Reynolds and Riley 2002). The current two-day
battery life of the motion sensor is very short, but when both circuits that make up the motion
sensor have been jointly connected to a pair of six volt Universal Battery 6120 batteries in series,
laboratory tests have estimated that the circuit will remain operational for 1000 hours (40 days).
This pair of batteries cost less than thirty dollars at time of writing and can be recharged. Solar
panel options for this type of battery are also widely available and will extend battery life further.
When combined with the fact that a single set of camera and white LED circuit batteries could
last for more than a month of field study, it is apparent that, for a higher initial cost, a reliable v.I
or v.II trap could independently record plum curculio capture for more than a month.
All the commercial cameras (Moultrie, Wildview and one IR5D model, Wildgame
Innovations, Grand Prairie, TX) were efficient in power use and were easily adapted to the
motion sensor. Other available camera models have night-vision, solar panels, wireless data
transmission options, and camera location tracking with mobile device applications. If further
adapted or specifically designed for entomological needs, commercial field monitoring cameras
will likely have widespread uses in entomological automated trapping.
Conclusions. Automated traps have widespread applications within entomology, and this
study has demonstrated the automated field recording of an insect population using low-cost,
easily-modified camera traps. The v.II system still needs improvement in several ways,
including increasing attractiveness to plum curculios, improving consistency in reliability and
extending battery life. However, the system demonstrated it could record accurate results while
keeping costs and labor low, particularly when compared with using human observation. The
simplicity and flexibility of the v.II system circuit will permit its adaptation to a variety of
research involving multiple study species or communities. It is hoped that the demonstration of

62
this design’s potential will facilitate future development of automated trapping, subsequently
improving the precision and speed of arthropod activity assessments along with facilitating
observation in remote areas. This in turn should lead to a much-needed greater understanding of
arthropod phenological patterns and their rate of change at both the local and global level.

63
CHAPTER 3
RESPONSE OF ADULT PLUM CURCULIOS TO CONTRASTS IN COLOR
AND ILLUMINANCE IN FIELD AND LABORATORY EXPERIMENTS
This chapter is intended for submission as an article to the journal Environmental Entomology.
Abstract
The responses of adult plum curculios, Conotrachelus nenuphar (Herbst), to contrasts in
color and illuminance were assessed in field and laboratory conditions. Release-recapture field
studies tested whether adult response to each trap was influenced by the trap’s visual contrast
with background on the horizon, and results at all four sites showed that significantly more adults
exhibited positive taxis towards traps with woods behind than to traps contrasted against the sky.
Laboratory tests in environmental conditions of 315 lux or less recorded the movement of adults
between intervals. These showed that significantly more females and males exhibited positive
taxis towards areas of black. This effect occurred when adults were presented with black
surfaces, stripes or lines. The color black correlated with lower reflected illuminance (<110 lux),
and when in conditions of ten lux or less, significant adult positive taxis towards black was not
observed. These results suggest that adults exhibit positive taxis towards areas of low
illuminance, and that adults will move towards the largest areas of low illuminance on the
horizon. In future management, low-illuminance should be the standard for traps. Applications
of materials reflecting illuminance to orchards could also be used as part of a visual push-pull
strategy to draw adults to trap trees or orchard perimeter for later destruction.

64
Introduction
Plum curculios, Conotrachelus nenuphar (Herbst) (Coleoptera: Curculionidae), are major
pests of stone and pome fruit (Vincent et al. 1999). For monitoring purposes, several trap types
capture adult plum curculios, including pyramid traps and branch-mimicking traps, although
capture rates decline after fruit set (Prokopy et al. 2003, Leskey and Wright 2004b, Piñero and
Prokopy 2006). Without reliable monitoring options, commercial growers typically apply broad-
spectrum insecticides at least once per season (Leskey et al. 2009). Trap trees and perimeter-
only insecticide applications can provide fruit protection while reducing insecticide volume, but
at the cost of some perimeter fruit (Vincent et al. 1997, Leskey et al. 2008, Piñero et al. 2011).
Conventional pyramid traps for plum curculios are 1.2 m high and were developed from a
design originally conceived to attract pecan weevils, Curculio caryae (Horn) (Coleoptera:
Curculionidae) to surfaces mimicking tree trunks and with low reflected illuminance (Tedders
and Wood 1994, Tedders and Wood 1995, Tedders et al. 1996). For plum curculios, it is known
that darker-colored pyramid traps (particularly black) collect more adults (Leskey 2006) and
increasing the size and visual profile of branch-mimicking traps also increases adult capture
(Leskey and Prokopy 2002). Insect visual systems are thought to be most sensitive in the green,
blue and ultraviolet spectrums (Briscoe and Chittka 2001) and curculionids have shown these
same preferences (Hollingsworth et al. 1964, Hausmann et al. 2004, Jeon et al. 2012). Green-
colored traps capture more plum curculios than clear surfaces (Butkewich and Prokopy 1997) but
do not produce better capture rates when compared with black traps (Leskey 2006). When plum
curculio response to ultraviolet, ambient and multiple colored lights was compared in field
conditions, adults exhibited positive taxis towards ultraviolet light (Payne et al. 1973).

65
Adult plum curculios show positive taxis towards higher shapes on the horizon (i.e. trees)
(Lafleur et al. 1987). Conventional traps placed under apple tree canopies capture more adults
than those further away from trees, possibly because adults show positive taxis towards the dark
presence of the tree, particularly the trunk (Prokopy and Wright 1998). This idea is supported by
the fact that too much competing stimuli from host trees reduces trap capture (Leskey and
Wright 2004a). All these results have led to speculation that, as with other insects (Prokopy and
Owens 1983, Möller 2002), adults show positive taxis towards objects which visually contrast
with a different background, such as the sky (Butkewich and Prokopy 1997, Whalon and
Coombs 2003, Leskey 2006). A challenge to this theory is the fact that extra-large pyramids
have caught fewer adults than conventional pyramids, but it is not known if this correlation was
affected by large pyramid size compromising the ability of adults to reach and be trapped at the
pyramid apex (Lafleur et al. 2007).
A four-site release-recapture study in 2012 by Selby et al. (2014) released plum curculio
adults in the middle of a hexagon of traps. Two traps were adjacent to woods, two were adjacent
to an open field, and two were to either side. Contradicting expectations that adults would be
captured in traps that were visually distinct against the sky, at all sites mean adult capture was
highest in the two traps adjacent to woods. This paper describes how a similar release
experiment was conducted in 2013 to determine if visual contrast between pyramid trap and
background affected adult capture rate. Subsequent laboratory investigations determined plum
curculio response to black and white color and illuminance.

66
Methods
Rearing Plum Curculio Adults. A colony of plum curculio was sustained at the
Michigan State University (MSU) insectary adults in mesh-topped containers (40 cm by 25 cm
by 13 cm height). Adults used in field and lab experiments were from the same colony. Adults
fed and oviposited on Liberty thinning apples which had been treated with fungicide (98.698%
water, 0.188% Captan 80DG, 0.045% Benlate 50W, 0.013% Latron B-1956, and 1.057%
Diphenylamine (1500 ppm)) and with a 0.026% solution of pyriproxyfen (Esteem, Valent
Biosciences, Libertyville, IL) which, when ingested, removed the requirement for diapause in
adults (Hoffman et al. 2007). Wild adults from Michigan’s Leelanau, Benzie and Manistee
counties were added annually to supplement colony genetics. The colony room was kept at 25°C
with a sixteen hour daily photoperiod and no natural light. Larvae developed in the apples, and
after they emerged, they were transferred to mason jars (8 cm diameter, 16 cm height) full with
750 mL dry sterile potting soil and 125 mL water of soil for pupation to adulthood. Jars were
covered with the funnel top from a pyramid trap to capture emerging adults.
Field Experiments. Overall Approach. Field experiments presented released adults with
pyramid traps with different visual backgrounds behind the traps on the horizon. The sizes of
objects other than sky in the backgrounds were quantified as a value termed Contrast because of
their expected effect in reducing trap visual silhouette. The captures in each trap were assumed
to represent each adult’s positive response to the visual stimuli provided by each trap and
background. Post-experimental analysis sorted results according to Contrast value and compared
observed adult captures with the captures expected if adult movement to the traps was random.
Site Layout. An equiangular hexagon of pyramid traps (1.2 m among trap centers) was
used at four sites on the Michigan State University campus (Figure 12), East Lansing, Michigan.

67
The Hancock Turfgrass Research Center (42.7110°N, 84.4760°W, 257 m elevation) was less
than 3 km from all sites and its automated weather station recorded daily conditions during the
field experiment. Each hexagon was seven meters from the edge of a wood in a grass field at
least 400 m2 in size. Woods did not contain tree species known to be plum curculio hosts.
Within the hexagon, grass was mowed to 20 cm high. Wood-to-field orientation at each site
pointed in a unique compass direction; woods were on the southeast side of Site 1, on northeast
side of Site 2, on the northwest side of Site 4, and on the southwest site of Site 4. Trap hexagons
were deployed 30 August 2013.
Figure 12. Layout of traps at all sites in 2013. Four sites were used, and each site was oriented
towards a different compass point.
Pyramid Trap Visual Standardization. The black base of each pyramid trap was 1.2 m
high, 0.5 m wide at the base, and made of matte-black, corrugated plastic (Whalon-modified
Tedder’s pyramid trap, Great Lakes IPM Inc., Vestaburg, MI). The funnel under the collecting
container at the top was 10.5 cm wide at maximum diameter. Each base was cleaned with soap

68
and water prior to use. The pyramid shape was created by slotting together four right-angled
triangle pieces with tabs at the center. Two zip ties attached each trap to a 1.2 m green metal
stake in the ground, and two 30 cm brown plastic pegs kept the trap base adjacent with the
ground. A trap side with no visible tabs faced the center of the hexagon, the green stakes faced
the outside, and thus all traps were positioned to be visually identical to the human eye when
viewed from the central release point. A strip of white tape ran the full length of all outer
pyramid edges to provide uniform visual edge contrast (Whalon and Coombs 2003).
Pyramid Trap Lure Standardization. Hanging trap lures, deployed on 30 August 2013
and replaced on 6 September, used 30 ml of lure (1 part ethyl alcohol with 3 parts plum essence
(Milne Fruit Products, Prosser, WA); 0.2% greed food coloring) in a 15 x 5 x 2 cm bag with
three string wicks and a vial of benzadlehyde with a loose cap. Adults release an aggregation
pheromone, grandisoic acid (Eller and Barteld 1996), and may make sounds that attract
conspecifics (Mampe and Neunzig, 1966), so to minimize the chance of adult captures
influencing subsequent trap capture, a pair of live adults (male and female, 1-4 days old as
adults) were added as lures to each trap on 6 September. A second collecting container was
glued on top of the lid of the existing container for each trap. The pair of live adults and an
eighth of a Liberty thinning apple were placed in this second container. Containers were
checked daily, and pairs with a dead adult were replaced with a fresh pair. A second fresh apple
eighth was added 10 September.
Quantifying the Contrast Value of Trap Visual Silhouette. A camera lens was raised 20
cm above the ground with a tripod. At each site, this camera was placed at the base of each trap,
photographing directly across the hexagon to record the trap and its visual background. Using
Photoshop 7 (Adobe Systems Incorporated, 2002), each photograph image was cropped so that

69
the base of the funnel atop of the pyramid was in the center, and the horizontal and vertical
distance to the photo edge was the same as half the height of the trap in the image (Figure 13).
This crop standardized image dimensions and removed all objects on the far distant horizon from
each image, focusing only on objects near enough and tall enough to affect the visual silhouette
of the top of the trap. After the crop, the trap and lure were edited out of each image, leaving
only background. These images were reduced to luminosity only (shades of gray) and converted
to a uniform palette, transforming all pixels into either black or white depending on their shade
relative to the darkest and lightest shades in each image. When backgrounds had no dark
objects, any relatively darker areas of blue sky erroneously transformed into black pixels were
edited back to white. Using each transformed background image, a trap’s Contrast value
between 0 and 1 was determined by dividing the number of white pixels by the total number of
pixels (black and white) in the image. Thus, a low Contrast value denoted a dark background
while a high Contrast value denotes a lighter background relative to the black pyramid traps.
Figure 13. Representation of pyramid trap appearance when photographed. Dashed line
indicates perimeter of area determining Contrast value. Grass edge indicates base horizon.

70
Adult Release and Collection. Two hundred adults of mixed ages post-pupation were
released at each site; 50 were 4-8 days old, 50 were 9-12 days old, 50 were 13-18 days old, and
50 were 19-25 days old. A release device was two transparent containers (15.5 cm L & W x 8.5
cm H, Rubbermaid Takealongs® Squares, 1.2 L capacity) attached at their base so that the upper
container stood on the lower container. Release containers were secured between two 30 cm
brown plastic pegs in the middle of each hexagon. Release container lids were removed between
8:00 and 8:30 pm on 6 September 2013. Traps were checked every day until experiment
disassembly at 3:00 pm on 12 September, with all daily adult captures transferred to vials and
later sexed with a dissecting microscope.
Laboratory Experiments. Overall Approach. Adult movement and location were
recorded inside tubs divided into two halves (called Sides), with the tubs placed inside either
black or white boxes. In each experiment, adult response to an all-transparent tub (control) with
a white or black surrounding box was compared with their response to a tub with a white or
black pattern on one side. Five experiments were conducted (Table 9). Experiment One tested
adult response to solid black color, and Experiments Two through Five repeated the procedure to
determine if the trend observed in Experiment One was influenced by factors other color or
illuminance. Experiment Two used a black-striped tub to permit more light on the contrasting
side and also gave adults on that side the option of being on a black or transparent stripe.
Experiment Three observed whether adult response to the black stripes on a tub changed when
each tub was rotated by 180° prior to the experiment, changing the orientation of the black
stripes relative to the light and box corners. Experiment Four observed response when adults
were put in a tub with black stripes before being moved to all-transparent tub. Experiment Five
observed adult response when all black and white colors were inverted (black became white and

71
vice versa), subsequently reducing illuminance in the tub. Post-experimental analysis
determined the frequency of locations where adults were observed in the tubs and compared this
with the frequency expected if locations were randomly distributed.
Laboratory Environment. Every day, adults emerging from soil jars were collected and
sexed under a dissecting microscope. To get sufficient adults for a trial, sexed adults were
sometimes given water and kept overnight so as to combine adult emergence from two or three
days. Whenever not being handled, the clear containers holding adults were kept in a white-
interior container with the lid ajar to permit some light. The inside of a second white-interior
container was used as the handling space when moving individual adults into and between tubs.
Up to three trials a day were conducted between 8 October and 31 December 2013 in a
basement laboratory with no natural light. A data logger with an ultraviolet light sensor
monitored laboratory conditions (Watchdog 1000s with LightScout, Spectrum Technologies Inc.,
Aurora, IL). Temperature was consistent in all trials (25.16 ± 0.76 SD °C), mean relative
humidity was 19.39 ± 10.57%, and there was no measurable ultraviolet light.
Boxes and Lighting. Four cardboard boxes (dimensions 51 cm L x 38 cm W x 38 cm H)
had their top flaps removed and fashioned into a pair of intersecting walls that divided the box
interior into four equal, rectangular recesses 19 cm deep. All interior surfaces of two boxes were
painted white (Rust-oleum Painter’s Touch Ultra Cover Flat White, latex). All interior surfaces
of the other two boxes were painted black (same brand, Flat Black), and a white paper circle (7
cm diameter) was attached to the center of each recess. Two side-by-side sheets of white,
translucent polypropylene (dimensions 61 cm L x 30 cm W x 0.2 cm H) were used as the box
cover. During a trial, a pair of Philips F40T12/DX Alto fluorescent light tubes were hung side-
by-side 3 cm above the box covers, over the middle of the box and parallel to the shorter side.

72
Tub Patterns and Side Orientation. Each experiment used cylindrical, transparent
polypropylene tubs with the lids on (Fabri-Kal Pro-Kal® PK32T-C, 14.2 cm H x 11.7 cm Top
Diameter x 8.6 cm Bottom Diameter, 0.95 L capacity). Two bisecting lines were drawn on all
tub exteriors. One line horizontally divided the tub, creating four heights per tub: Bottom, Low
Side (7.1 cm in height), High Side (5.8 cm in height), and Under Lid (Figure 14). The 1 cm
sloped edge between flat bottom and side was considered Bottom. The other line vertically
bisected all locations into two halves. The lid bisection line always aligned with the tub line.
The term Side was used to collectively refer to the Low Side, High Side and Under Lid of one
half of a tub, so each tub had two Sides and a Bottom area.
Figure 14. Representation of a Transparent-with-Black-Lines tub. In reality, the lid was
transparent. Heights are labeled, bisecting lines are shown.
The exteriors of tubs and lids were marked with five different color patterns
(Transparent-with-Black-Lines, Black Solid, Black Stripe, Transparent-with-White-Lines and
White Solid) that with the Box in which they were used (See Figure 15).

73
Figure 15. Box color with tub and lid pattern used in each experiment. The side view of
tubs and the underside of circular lids are presented. Dotted lines represent edges of transparent
surfaces, and the displayed color of these surfaces is the background box color.
Eight tubs were painted in each pattern. The tub Bottom remained transparent apart from
the bisecting line in every pattern. The bisecting lines on the Transparent-with-Black-Lines,
Black Solid, and Black Stripe patterns were drawn with a Sharpie black fine point permanent
marker pen (1 mm tip). Transparent-with-Black-Lines only had bisecting lines. Black Solid had
one Side painted entirely black and the other Side matching a Transparent-with-Black-Lines
Side. Instead of solid black, seven vertical black stripes were painted on a Black Stripe tub Side.
Near the bottom of the tub, stripes and the gaps between were each approximately 1 cm in width,
with gaps widening nearer the top of the tub. The lid of this Side had stripes; a black paint stripe
bisected the lid and perpendicular to this, three stripes ran to the lid edge. A curved black stripe
also followed half the lid circumference. The bisecting lines on the Transparent-with-White-
Lines and White Solid patterns were drawn with a Sharpie white medium point oil-based paint
pen. Apart from lid which was painted entirely black on either side of the bisecting line, both

74
Sides of Transparent-with-White-Lines only had bisecting lines. Solid White had one Side
painted white (same brand, Flat White, latex), including the lid; the other Side matched a
Transparent-with-White-Lines Side.
To keep adults exposed to the same lighting orientation in Experiments One through
Four, one tub Side was closest to the White Box center where the interior recess walls intersected
(termed the Inner Side), while the other Side was closest to the outer corner of the box (termed
the Outer Side). The observations in Experiments Two and Three suggested that lighting
orientation had no effect on trends in adult location. Therefore, in Experiment Five, tubs were
turned so that the divide between tub Sides was parallel to the shortest wall of the Black Box.
The Side closest to the light tubs was termed the Inner Side while the other was the Outer Side.
This adjustment ensured that when using a Solid White tub pattern on the Inner Side, the only
light penetrating the tub was reflected light from the Black Box’s exterior wall.
Illuminance. The illuminance of each tub pattern (in lux) was measured with a digital lux
meter (Dr. Meter LX1330B, Mastech, Taipei, Taiwan) for both tub Sides in all patterns. Tub lids
were cut and repaired with clear tape so that the photo detector probe could hang from the tub
ceiling. Probe direction was perpendicular to the lid’s bisecting line, pointing at only one tub
Side, and the convex, circular probe surface received all light from across a 120° angle. When
recording illuminance, a tub with the probe was positioned in a box like it would be in an
experiment, with cover closed. Maximum lux per tub Side for each pattern is shown in Table 9.

75
Table 9. Tub pattern, illuminance and box color and used in each laboratory experiment.
Inner Side and Outer Side refer to the orientation of tub Sides within each Box. Maximum
illuminance recorded by the sensor directed at each tub pattern is shown in lux.
First Period Pattern Second Period Pattern
Experiment Box
Inner Side,
Maximum Lux
Outer Side,
Maximum Lux
Inner Side,
Maximum Lux
Outer Side,
Maximum Lux
1 White Transparent
with Black
Lines, 315
Transparent
with Black
Lines, 285
Transparent
with Black
Lines, 315
Solid Black,
11
2 White Transparent
with Black
Lines, 315
Transparent
with Black
Lines, 285
Transparent
with Black
Lines, 315
Black Stripe,
93
3 White Transparent
with Black
Lines, 315
Transparent
with Black
Lines, 285
Black Stripe,
107
Transparent
with Black
Lines, 285
4 White Black Stripe,
107
Transparent
with Black
Lines, 285
Transparent
with Black
Lines, 315
Transparent
with Black
Lines, 285
5 Black Transparent
with White
Lines, 10
Transparent
with White
Lines, 9
Solid White,
2
Transparent
with White
Lines, 4

76
Experiment Procedure. An experiment had twenty trials, ten trials per sex, four
individuals per trial. Prior to each trial, all equipment was washed with soap and water. For
each trial, four adults were dropped into four tubs. Tubs were jarred when necessary to ensure
adults in White Box experiments began in Bottom location underneath the Outer Side of the tub
and, in Black Box experiments, began on Bottom location underneath the Inner Side of the tub.
Each tub was placed in the center of a separate box recess, either on the white paint or on
the white paper circle. Two boxes were typically observed together, one box with four males
and one with four females. After the cover was closed, adults were left alone for a ten minute
interval. Half the box cover was then removed, the location and movement status of adults in all
tubs were recorded (termed observations), and the cover was reclosed. After another ten
minutes, observations were recorded again. Then all adults were transferred into new tubs and
these tubs were put in the box in the same corner. Observations were again recorded after two
ten minute intervals.
Sequence Record. A sequence of four observations was recorded for each adult, two
recorded in the first tub (first period) followed by two in the second tub (second period).
Location observations recorded the height and the tub Side occupied by the adult. If an adult’s
body straddled locations, it was recorded as being in the location its head was facing. It was
noted if adults were on black stripes or between them. It was noted if any part of an adult’s body
on a transparent Side was resting on a bisecting line. Movement status recordings noted whether
the adult was stationary (crouching, standing, or on its back) or walking.
Statistical Analyses. Sorting Laboratory Data. Sequences were sorted into two
Categories, Responding or Non-Responding, based upon whether a change in adult location
could be unambiguously determined. At least once per period in a Responding Category

77
sequence, stationary adults were observed in a location different from starting height (Bottom),
indicating a change in location. In Non-Responding Category sequences, adults were observed
either on tub Bottom or walking throughout entire periods. Thanatosis is a common plum
curculio behavior (Racette et al. 1990), so the cause of Bottom location observations could not
be unambiguously determined. Walking adults also did not make an unambiguous selection of
location. If one period met Non-Responding Category criteria, the whole sequence was assigned
to the Non-Responding Category. When comparing period results within a single Category, the
observation after twenty minutes represented the whole period in the comparison. For
Responding Category analyses, if an observation after twenty minutes recorded the adult on the
Bottom or walking, observations from after the ten minute interval were substituted.
Statistical Tests. With field results, a linear regression was used to distinguish if there
was a correlation between adult capture and trap Contrast value. Trap captures were also sorted
into two categories, those with Contrast value higher than 0.5 and those with Contrast value
lower than 0.5. Number of traps per category out of total traps per site determined the expected
frequency of captures, while total observed captures per site out of total captures per site
determined observed capture frequency. Observed and expected captures were compared using
exact two-tailed Binomial tests.
Expected and observed results for each experiment were also compared with Binomial
tests. Responding Category results compared in this way included observed adult location
frequencies from all experiments, line occupancy frequencies from all experiments, and stripe
occupancy frequencies from Experiments Two, Three and Four. Responding Category
sequences were also sorted into two subcategories: adults observed on the same Inner or Outer
Side in both periods per sequence, and adults that changed Side. Adults that stayed on the same

78
Side may have moved in response to factors other than tub pattern, so a Binomial test was used
to determine if the two counts of adults observed moving from one Side to another when tub
pattern changed was significantly different from the equal frequency of counts expected. This
procedure was repeated in Experiment Four only to show that a trend in observed adults in the
first period was absent in the second period; it was not statistically possible to prove that the
change in tubs prompted a random distribution of adult locations in the second period.
A Pearson χ2 test compared the frequency of Non-Responding Category sequence
occurrence in each experiment. The frequency Bottom height in the first and second periods of
the Non-Responding Category sequences were compared with a one-way analysis of variance,
and the proportion of sequences assigned to the Non-Responding Category were compared
between all experiments with two-proportion z tests. The proportion of each sex on black stripes
in Experiment Two, Three and Four were analyzed using Fisher’s exact test instead of two-
proportion z tests to account for small sample size. Freund and Wilson (2003) describe all tests
used and all tests were conducted with Minitab 14.1 (Minitab, Inc., 2004).
Results
Field Experiments. Mean ambient temperature was 21.8 ± 4.6 SD °C and relative
humidity was 71.3 ± 12.8%. Mean wind speed was 2.1 ± 1.1 m/s, with wind blowing from the
west (48% of time), south (32%) or east (20%). Rain fell on 7 September (2 mm total) and 9
September (8 mm total) and other days had no cloud overcast or rain.
Traps collected no wild adults between 30 August and 6 September 2013, so all
subsequent adult captures were presumed to be recaptured releases. From 7 to 12 September, 86
of 200 adults were collected at Site 1 (43.0% recapture), 95 at Site 2 (47.5%), 102 at Site 3

79
(51.0%), and 62 at Site 4 (31.0%). Mean daily adult captures sorted by sex from 7 to 12
September are shown in Figure 16, with significantly more females being collected per trap only
on 7 September (paired t test: t = 2.20; n = 13; P = 0.048). Examining all results, reliability of
the linear relationship between trap Contrast value (x) and adult capture (y) in all traps was poor
but increased Contrast value was a significant predictor of lower capture (y = 35.888 - 32.128x,
r2 = 0.5536, P < 0.001) (See Figure 17). When sorted according to background image contrast,
the two traps nearest the wood at each site were also those with Contrast value less than 0.5,
while all other traps had Contrast values equal or higher than 0.5. The two traps nearest the wood
at each site were expected to capture 33.3% of adults at each site, but their capture was
significantly higher than expected at each site (see Table 10) (For all four sites: Binomial tests:
expected frequency = 0.333; P < 0.001).
Figure 16. Field study adult capture per day by sex. Significantly more females than males
were captured on 7 September (paired t test: t = 2.20; n = 13; P = 0.048).

80
Table 10. Adult capture at 2013 field sites, sorted by trap Contrast value. Binomial tests
compared observed capture frequencies of adults in the traps with Contrast value less than 0.5
with the expected capture frequency of 33.3% at all sites. Asterisks indicate significance (P <
0.05).
Contrast value ≥ 0.50 Contrast value <0.50 Binomial Test
P - Value Site Capture Percentage Capture Percentage
1 32 37.21% 54 62.79% <0.001*
2 17 17.89% 78 82.11% <0.001*
3 27 26.47% 75 73.53% <0.001*
4 20 32.26% 42 67.74% <0.001*
Total 96
249
Percent of Total 27.83%
72.17%

81
Figure 17. Field study total adult capture per trap plotted according to Contrast value.
Square points mark all traps closest to woods; X-points mark all other traps. Displayed linear
relationship: y = 35.888 - 32.128x, r2 = 0.5536, P < 0.001.
Laboratory Experiments. Responding and Non-Responding Category Sorting. A total
of 98 female and 73 male sequences were assigned to the Responding Category, and 102 female
and 127 male sequences were assigned to the Non-Responding Category. Most Non-Responding
Category assignments were due to adults not leaving the Bottom location (Table 11). When
Non-Responding Category adults remained on Bottom in only one period in a sequence,
significantly more did so in second period (ANOVA: df = 1, 8; females: F = 17.2, P = 0.0032,
males: F = 8.1, P = 0.03). For each sex, the frequency of Non-Responding Category sequences
did not significantly differ between experiments (χ2 test: each experiment expected to contribute
to 20% of total excluded data; df = 4; females: χ2 = 2.02; P = 0.73, males: χ
2 = 1.07; P = 0.90).
In Experiment Four, a significantly greater proportion of males were assigned to the Non-
Responding Category than females (Two-proportion z test: H0: p1 - p2 = 0; H1: p1 - p2 ≠ 0; z =
2.69; P = 0.007).

82
Table 11. Non-Responding Category sequences sorted by frequency and sex. Results
marked with the same letters in the same column were not significantly different (ANOVA, df =
1, 8; females: F = 17.2, P = 0.0032; males: F = 8.1, P = 0.03).
Frequency of causes
Causes of excluded sequences Females Mean ± SD Males Mean ± SD
Adult always at Bottom height, both periods 26.3 ± 7.7% 33.0 ± 13.1%
Always at Bottom height, 1st period only 17.8a ± 8.7% 14.5a ± 6.8%
Always at Bottom height, 2nd period only 50.9b ± 15.6% 40.1b ± 19.0%
Adult always walking, both periods - 1.5 ± 3.3%
Always walking, 1st period only 3.2 ± 3.1% 0.8 ± 1.8%
Always walking, 2nd period only 0.9 ± 2.0% 4.1 ± 4.9%
Both walking and no upward movement 0.9 ± 1.9% 6.0 ± 4.2%
Location Stability within Periods. In the Responding Category sequences, 11.7% of
females and 12.3% of males had one period with adults walking or being on Bottom. In the
remaining Responding Category periods, 85.5% of females and 78.9% of males sat or stood in
the same location for both observations.
Location Differences and Changes. The Low Side, High Side and Under Lid locations of
a tub were calculated to respectively represent 39%, 42% and 19% of the interior surface area of
a tub, excluding the Bottom location. These were considered the expected frequency of
Responding Category adult distribution by height within the tubs. The Responding Category
results for each experiment were separated by period and sex into four groupings, resulting in
sixteen groupings for White Box experiments and four for Black Box experiments. Table 12

83
shows the percentage of Responding Category adults observed at each height, including Bottom,
separated by grouping with the White Box groupings combined. The Binomial test compared
the expected and observed frequency of adults recorded in each height location for each
grouping. Among the White Box groupings, only the male results from Experiment Two, second
period did not conform to any trends. In fourteen of the fifteen remaining White Box groupings,
significantly fewer adults than expected were found on the Low Side (Binomial tests: expected
frequency = 0.39; P < 0.025). The exception was the Experiment One second period males (P =
0.073). In thirteen of the White Box groupings, significantly more adults than expected were
found on the High Side (Binomial tests: expected frequency = 0.42; P < 0.01). The exceptions
were the Experiment One males (first period: P = 0.103, second period: P = 0.077).
Significantly fewer females than expected were found Under Lid in three of the fifteen White
Box experiments (Binomial tests: expected frequency = 0.19; P < 0.04): Experiment One second
period, Experiment Three first period, and Experiment Four second period. Unlike in White Box
experiments, it was found that the Black Box groupings showed no consistent pattern in height
location. No significant differences in female location were evident, and in both periods
significantly fewer males were found on the Low Side (Binomial test: expected frequency =
0.39; P < 0.025). Significantly more males were found Under Lid in the second period
(Binomial test: expected frequency = 0.19; P < 0.001) with the majority of these males (13 of 20
observations) recorded under the part of the lid painted black.

84
Table 12. Percentage of Responding Category sequence adults found at different heights in
the tubs. The four White Box experiments provided 80 female and 60 male sequences,
combined to produce mean percentage per location. The Black Box experiment provided 18
female and 13 male sequences.
Mean Females ± SD % Mean Males ± SD %
Box Location First Period Second Period First Period Second Period
White Low Side 3.9 ± 4.5% 6.8 ± 5.3% 9.5 ± 5.8% 17.0 ± 6.9%
White High Side 74.8 ± 13.0% 73.1 ± 9.2% 67.65 ± 6.9% 57.1 ± 12.4%
White Under Lid 16.9 ± 8.3% 13.3 ± 13.4% 19.7 ± 4.0% 16.6 ± 2.3%
White Excluded a 4.4 ± 3.7% 6.7 ± 4.0% 3.2 ± 2.3% 9.3 ± 7.9%
Black Low Side 27.8% 36.1% 15.4% 11.5%
Black High Side 36.1% 33.3% 53.9% 34.6%
Black Under Lid 25.0% 19.4% 23.1% 50.0%
Black Excluded a 11.1% 11.1% 7.7% 3.9%
a Isolated observations where adults were on Bottom or were walking.
In experiments in the White Box, significantly more adults of both sexes were observed
on tub Sides with black patterns than transparent Sides (Binomial test: expected frequency = 0.5;
P < 0.05) (See Table 13). In Experiments One, Two and Three, the results also showed the trend
that adults which changed Sides between periods tended to switch to Sides with black patterns,
with this trend being significant for females in Experiment Two (See Table 14) (Binomial test:
expected frequency = 0.5; P = 0.002). In Experiment Four, significantly more males (Binomial
test: expected frequency = 0.5; P = 0.03) moved to the Outer Side after the Black Stripe Inner

85
Side was replaced with the Transparent-with-Black-Lines pattern. There was no significant
difference in Side preference in any of the Transparent-with-Black-Lines tubs or Black Box
experiments.
Table 13. Percentage of adults on Inner and Outer tub Sides from Responding Category
sequences. Binomial tests (expected equal frequency) compared Inner and Outer Side adult
counts (shown as percentages) for each period. Asterisks indicate significance (P < 0.05).
Experiment Sex n Period
Inner
Side
Outer
Side
Binomial Test
P-Value
1: White Box, First Period =
Transparent-with-Black-
Lines, Second Period = Outer
Side Black Solid
Female 17 First 58.82% 41.18% 0.63
Second 23.53% 76.47% 0.049*
Male 13 First 38.46% 61.54% 0.58
Second 7.69% 92.31% 0.003*
2: White Box, First Period =
Transparent-with-Black-
Lines, Second Period = Outer
Side Black Stripe
Female 20 First 40.00% 60.00% 0.50
Second 10.00% 90.00% <0.001*
Male 15 First 60.00% 40.00% 0.61
Second 20.00% 80.00% 0.04*
3: White Box, First Period =
Transparent-with-Black-
Lines, Second Period = Inner
Side Black Stripe
Female 18 First 66.70% 33.33% 0.24
Second 94.44% 5.56% <0.001*
Male 19 First 63.16% 36.84% 0.36
Second 89.47% 10.53% 0.001*

86
Table 13 (cont’d).
Experiment Sex n Period
Inner
Side
Outer
Side
Binomial
Test P-Value
4: White Box, First Period =
Inner Side Black Stripe,
Second Period =
Transparent-with-Black-
Lines
Female 25 First 84.00% 16.00% 0.001*
Second 64.00% 36.00% 0.23
Male 13 First 92.31% 7.69% 0.003*
Second 46.15% 53.85% 1.0
5: Black Box, First Period =
Transparent-with-White-
Lines, Second Period = Outer
Side White Solid
Female 18 First 50.00% 50.00% 1.0
Second 44.44% 55.56% 0.82
Male 13 First 61.54% 38.46% 0.58
Second 46.15% 53.85% 1.0

87
Table 14. Change in adult location frequency in Responding Category sequences. In each 2
x 2 matrix, binomial tests (expected equal frequency) compared the bottom left count with the
top right count (counts shown as percentages). Asterisks indicate significance (P < 0.05).
First
Period
Side
Second Period Side Binomial
Test P-
Value Experiment Sex n Inner Outer
1: White Box, First Period
= Transparent-with-Black-
Lines, Second Period =
Outer Side Black Solid
Female 17 Inner 17.6% 41.2% 0.07
Outer 5.9% 35.3%
Male 13 Inner 7.7% 30.8% 0.13
Outer 0.0% 61.5%
2: White Box, First Period
= Transparent-with-Black-
Lines, Second Period =
Outer Side Black Stripe
Female 20 Inner 10.0% 50.0% 0.002*
Outer 0.0% 40.0%
Male 15 Inner 13.3% 46.7% 0.07
Outer 6.7% 33.3%
3: White Box, First Period
= Transparent-with-Black-
Lines, Second Period =
Inner Side Black Stripe
Female 18 Inner 66.7% 0.0% 0.06
Outer 27.8% 5.6%
Male 19 Inner 57.9% 5.3% 0.13
Outer 31.6% 5.3%

88
Table 14 (cont’d).
First
Period
Side
Second Period Side
Binomial
Test P-Value Study Sex n Inner Outer
4: White Box, First Period =
Inner Side Black Stripe,
Second Period =
Transparent-with-Black-
Lines
Female 25 Inner 56.0% 28.0% 0.18
Outer 8.0% 8.0%
Male 13 Inner 46.2% 46.2% 0.03*
Outer 0.0% 7.7%
5: Black Box, First Period =
Transparent-with-White-
Lines, Second Period = Outer
Side White Solid
Female 18 Inner 22.2% 27.8% 1.00
Outer 22.2% 27.8%
Male 13 Inner 38.5% 23.1% 0.63
Outer 7.7% 30.8%
Responding Category data from the three experiments using the Black Stripe tubs
recorded that in 55 of 56 periods with females and in 36 of 42 periods with males, adults found
on the black stripe Sides of the tubs were on the black stripes, not on the transparent stripes in
between the black stripes. Excluding Bottom location, the black stripes represented an estimated
60% of the surface area of one Side. The expected frequency of adults on the stripes was
therefore 0.6. Binomial tests comparing the expected frequency with observed frequencies
showed that significantly more females than expected were recorded on the black part of the
stripe Sides (Experiment Two: n = 18 sequences; 100% of females on black, Experiment Three:
n = 17; 100% on black, Experiment Four: n = 21; 95.24% on black, P < 0.001 for all

89
experiments). The trend was also for more males than expected on the black stripes, with the
result being significant in Experiment Three (Experiment Two: n = 13 sequences; 84.62% of
males on black; P = 0.09, Experiment Three: n = 17; 88.24% on black; P = 0.015, Experiment
Four: n = 12; 83.33% on black; P = 0.14). Using the results from all three black stripe
experiments, Fisher’s Exact Test did not show that sex correlated with significant differences in
the proportions of adults on the black part of the stripes (expected frequency = 0.5 for all
experiments: Experiment One: P = 0.485, Experiment Two: P = 0.168, Experiment Three: P =
0.538).
Twenty of 80 females and 17 of 60 males were stationary on the black bisecting lines in
Responding Category periods from the four experiments using the Transparent-with-Black-Lines
tubs. One of 18 females and two of 13 males were sitting or standing on the white bisecting
lines in the Responding Category periods recorded in the Transparent-with-White-Lines tubs.
Bisecting lines made up 13.1% of the potential interior surface area, excluding the Bottom
location, where a 5 mm long adult could potentially sit, yielding an expected frequency of 0.131.
Binomial tests indicated that significantly more adults than expected were recorded on the black
lines (females: P = 0.008, males: P = 0.004). There was no significant difference between
expected and actual frequency in tubs with white lines.
Discussion
Significantly more adults were recaptured in the traps adjacent to the woods and which
had the least contrast with their background in the visible spectrum. This result correlates with
studies showing positive plum curculio adult taxis towards larger opaque objects like taller
stands of trees (Lafleur et al. 1987) or the center of trees (Prokopy and Wright 1998), but also

90
suggests that visual contrast between pyramid trap and background sky does not improve trap
capture rates. The regression results do not indicate that exact adult response may be reliably
determined from Contrast value but Contrast value was still a significant predictor of adult
response. This study also suggests that, regardless of the direction of celestial objects, magnetic
north, and weather, adults perceived the visual stimuli of a tree line at a distance of 8 m. The
adult recapture rate at each site was higher than the recapture rates of other plum curculio
releases (e.g. Leskey and Wright 2004a, Selby et al. 2014).
In the laboratory experiments, the majority of sequences were assigned to the Non-
Responding Category because adults did not move from the Bottom of the tubs. Thanatosis
behavior can be prompted by disturbance (Racette et al. 1990), and the fact that Bottom location
occurred significantly more in the second period was likely a response to tubs and adults being
handled between periods. The majority of Responding Category adults sat on the High Side of
tubs when in White Boxes, which correlates with the fact that vertical plum curculio traps have
higher capture rates than traps at other angles (Leskey and Prokopy 2002).
Plum curculios are most active in the evening and night (Racette et al. 1991, Chouinard et
al. 1993, Selby et al. 2014) when the eye’s ability to detect contrast is poor (Land 1997). Plum
curculio adults have shown positive taxis towards ultraviolet light (Payne et al. 1974), but in the
laboratory experiments, no ultraviolet light was recorded as present, and all field experiments
were exposed to the same nighttime sky conditions. In the lab experiment, the illuminance in the
brightest tubs was similar to the 360 lux estimated for a sunset with the sun one degree below the
horizon (Nielsen 1963). Analysis clearly showed that adults had a significant preference for
siting on black surfaces, stripes and lines. When measured, tub sides with black surfaces had
low illuminance relative to the transparent surfaces, so the adults exhibited positive taxis towards

91
objects of low illuminance. When combined with the fact that varying pyramid trap color has
resulted in few significant differences in curculionid capture rate (Tedders et al. 1996, Leskey
2006), the results suggest that illuminance rather than visible color is what influences adult taxis.
The trend to locate on black was absent in Experiment Five when there was minimal
difference in reflected lux between surfaces. It is possible that plum curculio adults did not
perceive differences between black and white at low illuminance, although this seems unlikely
for a species active at nighttime. In comparison, pecan weevil captures are greatest in pyramid
traps with low reflected illuminance (Tedders and Wood 1995, Tedders et al. 1996). Black
pyramid trap captures of pecan weevils also increase when tree trunks are made white (Tedders
and Wood 1994, Tedders et al. 1996) and the same practice is known to increase plum curculio
capture by 35% in stone fruit orchards in Florida (R. F. Mizell III, pers. comm.). Although the
reflected lux of the white trunks was not measured, these authors suggest that as the presumed
reflected illuminance of white was higher than that of natural trunks, visual competition between
the traps and trees was reduced. The results of Experiment Five therefore agree with other
studies in suggesting that a gradient in reflected lux is an important stimulus to plum curculio
taxis.
The laboratory experiments suggest positive taxis towards low illuminance, and the field
experiments demonstrated that adults show positive taxis towards the largest opaque objects on
the horizon. For plum curculio management, these results suggest that plum curculio traps or
trap trees do not need to be visually distinct, but instead need to be the largest objects reflecting
minimal illuminance in the orchard environment. Light-colored particle films like kaolin clays
are already known to provide some control of plum curculio (Lalancette et al. 2005) and are
known to affect the visual appearance of fruit (Lemoyne et al. 2008), which likely reduces the

92
host-finding success of arthropods (Glenn and Puterka 2005). Applications of kaolin to the
perimeter of orchards could reduce the crepuscular visual competition of the orchard with either
traps or trap trees, enhancing their plum curculio capture rates while minimizing potential
negative effects of the film on non-target arthropods (Sackett et al. 2007, Markó et al. 2008).
This approach could be used in conjunction with the perimeter-treatment and trap tree
approaches already suggested for plum curculio management (Vincent et al. 1997, Leskey et al.
2008, Piñero et al. 2011) as part of a visual push-pull strategy like those which have been
suggested for other beetle pests (Pawson et al. 2009). Finally, when designing plum curculio
traps, the black stripe and line results seem to suggest that even small amounts of low
illuminance stimuli may be used to arrest or perhaps guide adult movement between trap
components.

93
CHAPTER 4
Synthesis and Future Research
This dissertation investigated the improvement of plum curculio larval emergence models
and monitoring technology. While an accurate model for predicting plum curculio larval
emergence in Michigan was not attainable, many of the factors that influence larval and adult
emergence were elucidated. In addition, a prototype automated trap was developed and tested.
Finally, plum curculio’s response to visually contrasting backgrounds was quantified, providing
interesting opportunities to improve trap design and behavioral pest management.
From the Chapter 2 results it was clear that the nightly activity of plum curculio patterns
could be assessed by the automated traps, and if left out for a longer period of time, these traps
could provide both researchers and growers with a better understanding of curculio population
response in terms of circadian rhythm and immediate response to weather conditions. Although
automating the traps is important, new trap technology ultimately needs to capture more adults
(Prokopy et al. 2003, Leskey and Wright 2004b), so that population sample size per trap is
sufficient to reliably determine relative population densities over time. An added benefit of
higher trap capture rates is that more of the potential pest will be removed from the orchard
environment. Chapter 3 contributes a method for both improving trap capture and improving the
data benefits of the v.II design from Chapter 2. An immediate application of Chapter 3 would be
to reduce reflected illuminance of existing traps by painting all surfaces black. The
incorporation of ultraviolet light lures into the designs could further increase trapping efficiency
(Payne et al. 1973). Additional ultraviolet light-emitting diodes require little power and could

94
easily be incorporated into new automated trap designs. Chapter 3 results also indicate that care
should be taken to ensure that plum curculio traps represent the largest low-illuminance objects
in the area they are sampling. In the future, adult response to visual stimuli in nighttime
conditions needs to be better understood if traps are to be maximally effective.
Chapter 1 results confirm that the effect of fruit host and variable temperatures will need
further research to improve future larval and adult emergence model accuracy. This approach
has merit because fruit host type is a categorical effect and internal fruit temperature can be
predicted from ambient temperature (e.g. Wang et al. 2001). Furthermore, as discussed for the
cherry results, phenological model accuracy does not have to be perfect for the model to have
practical value in approximating when larvae emerge from fruit (McKinion 1992). The rearing
experiments also found that mean larval emergence timing from a single fruit can be
significantly increased by the presence of five or more larvae in an apple. Unlike fruit host or
temperature, the presence of multiple larvae in fruit would be difficult to quantify in field
conditions. However, the rearing experiments also demonstrated that if presented with multiple
fruit, each capable of supporting many larvae, abundant flesh remained in every fruit after larval
departure. These results suggest that the apples found with enough larvae inside to reduce them
to frass-filled shells were artifacts of female isolation with fruit rather than a common
occurrence. Lower than expected rates of female oviposition in the laboratory experiments
provides further evidence that isolating females with a single host affects their normal
oviposition behavior. Therefore overall it is likely that a practical model predicting Michigan
plum curculio larval emergence from fruit could be constructed. Such a model would provide
growers with improved timing for soil-based plum curculio management tactics.

95
APPENDICES

96
APPENDIX A
Record of Deposition of Voucher Specimens
The specimens listed below have been deposited in the named museum as samples of the insect
species used in this research. Voucher recognition labels bearing the voucher number have been
attached.
Voucher Number: 2014-05
Author, Title of Dissertation: Roger Duncan Selby, Modeling the phenology and monitoring the
activity of the plum curculio Conotrachelus nenuphar (Herbst) (Coleoptera: Curculionidae) with
novel methods and technology
Museum where Specimens Deposited: Albert J. Cook Arthropod Research Collection, Michigan
State University (MSU)
List of Specimens:
Family Genus-Species Life Stage,
Quantity
Preservation
Curculionidae Conotrachelus nenuphar Adult ♀, 10 Glued to card point on pin
Curculionidae Conotrachelus nenuphar Adult ♂, 10 Glued to card point on pin

97
APPENDIX B
A Copy of Permission to Use Results Collected by Alex Johnson and Renee Pereault Larsen
for Chapter 1
From: <Alex Johnson>
To: [email protected] <Roger D Selby>
Date: Tue, 11 Mar 2014 12:03:07 -0400
Subject: Re: Permission to publish a study you conducted from 2006-2007
I fully agree with the below written statement.
Regards,
Alex Johnson
"I, Alex Johnson, under the supervision of M. E. Whalon, collected data from 2006-2007 in two
studies examining plum curculio larval head-width development in 500 Empire thinning apples.
This data was never published, and I, Alex Johnson, grant R. Duncan Selby permission to
include this data as part of his Ph.D. dissertation submitted to Michigan State University. I also
give Duncan and Mark E. Whalon permission to publish this data as part of a manuscript
submitted to a refereed journal of their choice. I grant this permission to publish on the
understanding that my contribution to the work will be acknowledged in each document."
***
From: <Renee Pereault Larsen>
To: [email protected] <Roger D Selby>
Date: Thu, 13 Mar 2014 17:01:16 -0400
Subject: Plum curculio research
I fully agree with the following statement:
"I, Renee Pereault Larsen, under the supervision of M. E. Whalon, collected data from 2006-
2007 in two studies examining plum curculio larval head-width development in 500 Empire
thinning apples. This data was never published, and I, Renee Pereault Larsen, grant R. Duncan
Selby permission to include this data as part of his Ph.D. dissertation submitted to Michigan
State University. I also give Duncan and Mark E. Whalon permission to publish this data as part
of a manuscript submitted to a refereed journal of their choice. I grant this permission to publish
on the understanding that my contribution to the work will be acknowledged in each document."
Signed,
Renee Pereault Larsen

98
APPENDIX C
A Copy of Copyright Permission for Chapter 2

99
REFERENCES

100
REFERENCES
Adobe Systems Incorporated. 2002. Adobe Photoshop 7 User Guide. Adobe Systems
Incorporated, San Jose, CA.
Alston, D. G., D. E. N. Rangel, L. A. Lacey, G. G. Hernani, J. J. Kim, and D. W. Roberts.
2005. Evaluation of novel fungal and nematode isolates for control of Conotrachelus
nenuphar (Coleoptera: Curculionidae) larvae. Biol. Control 35 (2): 163–171.
Akaike, H. 1974. A new look at the statistical model identification. IEEE T. Automat. Contr. 19
(6): 716–723.
Akotsen-Mensah, C., R. T. Boozer, A. G. Appel, and H. Y. Fadamiro. 2011. Seasonal
occurrence and development of degree-day models for predicting activity of Conotrachelus
Nenuphar (Coleoptera: Curculionidae) in Alabama peaches. Ann. Entomol. Soc. Am. 104 (2):
192–201.
Armstrong, T., 1958. Life-history and ecology of the plum curculio, Conotrachelus nenuphar
(Hbst.) (Coleoptera: Curculionidae), in the Niagara Peninsula, Ontario. Can. Entomol. 90 (1):
8–17.
Bateman, R. P., G. A. Matthews, and F. R. Hall. 2007. Ground-based application equipment,
pp. 73–98. In L. A. Lacey and H. K. Kaya (eds.), Field Manual of Techniques in Invertebrate
Pathology. Kluwer Academic Publishers, Netherlands.
Beerwinkle, K. R. 2001. An automatic capture-detection, time-logging instrumentation system
for boll weevil pheromone traps. Appl. Eng. Agric. 17 (6): 893–898.
Blumstein, D. T., D. J. Mennill, P. Clemins, L. Girod, K. Yao, G. Patricelli, J. L. Deppe, A.
H. Krakauer, C. Clark, K. A. Cortopassi, S. F. Hanser, B. McCowan, A. M. Ali and A.
N. G. Kirschel. 2011. Acoustic monitoring in terrestrial environments using microphone
arrays: applications, technological considerations and prospectus. J. Appl. Ecol. 48 (3): 758–
767.
Briscoe, A. D., and L. Chittka. 2001. The evolution of color vision in insects. Annu. Rev.
Entomol. 46: 471–510.
Brown, M. W. 2005. Host utilization and phenology of injury by plum curculio (Coleoptera:
Curculionidae) in West Virginia. J. Entomol. Sci. 40 (2): 149–57.
Butkewich, S. L., and R. J. Prokopy. 1997. Attraction of adult plum curculios (Coleoptera:
Curculionidae) to host-tree odor and visual stimuli in the field. J. Entomol. Sci. 32 (1): 1–6.

101
Butkewich, S. L., R. J. Prokopy, and T. A. Green. 1987. Discrimination of occupied host fruit
by plum curculio females (Coleoptera: Curculionidae). J. Chem. Ecol. 13 (8): 1833–1841.
Calkins, C.O., M. D. Huettel, and M. McKoy. 1976. Spatial and temporal distribution of
oviposition by plum curculios, Conotrachelus nenuphar. Fla. Entomol. 59 (2): 205-209.
Chouinard, G., C. Vincent, S. B. Hill, B. Panneton. 1992. Cyclic behavior of plum curculio,
Conotrachelus nenuphar (Herbst) (Coleoptera: Curculionidae), within caged dwarf apple
trees in spring. J. Insect Behav. 5 (3): 385–394.
Chouinard, G., S. B. Hill, and C. Vincent. 1993. Spring behavior of the plum curculio
(Coleoptera: Curculionidae) within caged dwarf apple trees. Ann. Entomol. Soc. Am. 86 (3):
333–340.
Chouinard, G., S. B. Hill, and C. Vincent. 1994. Spatial distribution and movements of plum
curculio adults within caged apple trees. Entomol. Exp. Appl. 70 (2): 129–142.
Chouinard, G., D. Cormier, and G. Bourgeois. 2001. A temperature dependent model
describing nocturnal activity of plum curculio in apple trees following bloom, pp. 201–205. In
VI International symposium on computer modelling in fruit research and orchard
management, Acta Hortic. 584.
Coombs, A.B. 2001. Trap designs and attractants for monitoring plum curculio, Conotrachelus
nenuphar (Herbst). M.Sc. thesis, Michigan State University, East Lansing.
Dixon, B. M., R. J. Prokopy, and B. B. Schultz. 1999. Influence of weather and time of day on
plum curculio (Coleoptera: Curculionidae) tree canopy entry behaviors and evaluation of traps
for predicting fruit injury. J. Entomol. Sci. 34 (2): 191–202.
Eller, F. J., and R. J. Bartelt. 1996. Grandisoic acid, a male-produced aggregation pheromone
from the plum curculio, Conotrachelus nenuphar. J. Nat. Prod. 59 (4): 451–53.
Esperk, T., T. Tammaru, and S. Nylin. 2007. Intraspecific variability in number of larval
instars in insects. J. Econ. Entomol. 100 (3):627-645.
Fukatsu, T., T. Watanabe, H. Hu, H. Yoichi, and M. Hirafuji. 2012. Field monitoring support
system for the occurence of Leptocorisa chinensis Dallas (Hemiptera: Alydidae) using
synthetic attractants, field servers, and image analysis. Comput. Electron. Agric. 80: 8–16.
Glenn, D. M., and G. J. Puterka. 2005. Particle films: a new technology for agriculture. Hortic.
Rev. 31: 1–44.
Guarnieri, A., S. Maini, G. Molari, and V. Rondelli. 2011. Automatic trap for moth detection
in integrated pest management. Bull. Insectol. 64 (2): 247–251.

102
Hao, Y., B. Campana, and E. Keogh. 2013. Monitoring and mining animal sounds in visual
space. J. Insect Behav. 26 (4): 466-493.
Hausmann, C., J. Samietz, and S. Dorn. 2004. Visual orientation of overwintered Anthonomus
pomorum (Coleoptera: Curculionidae). Environ. Entomol. 33 (5): 1410–15.
Hollingsworth, J. P., P. L. Wright, and D. A. Lindquist. 1964. Spectral response
characteristics of the boll weevil. J. Econ. Entomol. 57 (1): 38-41.
Hayter, A. J. 1984. A proof of the conjecture that the Tukey-Kramer multiple comparisons
procedure is conservative. Ann. Stat. 12 (1): 61-75.
Hoffman, E. J. 2008. Identification and characterization of key insecticide performance
mechanisms for control of plum curculio (Conotrachelus nenuphar) in Michigan tart cherries.
Ph.D. dissertation, Michigan State University, East Lansing, MI.
Hoffmann, E.J., A.B. Coombs, and M. E. Whalon. 2004. Reproductive development of
northern and southern strains of plum curculio (Coleoptera: Curculionidae). J. Econ Entomol.
97 (1): 27-32.
Hoffmann, E. J., J. VanderJagt, and M. E. Whalon. 2007. Pyriproxyfen activates
reproduction in prediapause northern strain plum curculio (Conotrachelus nenuphar Herbst).
Pest Manag. Sci. 63 (9): 835–40.
Hoffman, E. J., C. Vandervoort, and J. C. Wise. 2009. Curative activity of insecticides against
plum curculio (Coleoptera: Curculionidae) in tart cherries. J. Econ. Entomol. 102 (5): 1864–
73.
Jacklin, S.W., C. E. Yonce, and J. P. Hollon. 1968. Crowding effects on plum curculios reared
at several densities on two sizes of green apple. J. Econ. Entomol. 61 (3): 816–819.
Jacklin, S.W., and C. E. Yonce. 1970. Emergence, longevity and fecundity of adult plum
curculio reared from two sizes of larvae at two temperatures in soil with a range of moisture.
J. Econ. Entomol. 63 (2): 673–674.
Jeon, J.-H., M.-S. Oh, K.-S. Cho, and H.-S. Lee. 2012. Phototactic response of the rice weevil,
Sitophilus oryzae Linnaeus (Coleoptera: Curculionidae), to light-emitting diodes. J. Korean.
Soc. Appl. Biol. Chem. 55 (1): 35-39.
Jenkins, D., T. Cottrell, D. Horton, A. Hodges, and G. Hodges. 2006. Hosts of plum curculio,
Conotrachelus nenuphar (Coleoptera: Curculionidae), in central Georgia. Environ. Entomol.
35 (1): 48–55.
Johnson, D. T., Jr Mulder, B. D. McCraw, B. A. Lewis, B. Jervis, B. Carroll, and P. J.
McLeod. 2002. Trapping plum curculio Conotrachelus nenuphar (Herbst) (Coleoptera:
Curculionidae) in the southern United States.” Environ. Entomol. 31 (6): 1259–67.

103
Jones, V. P., J. R. Hagler, J. F. Brunner, C. C. Baker, and T. D. Wilburn. 2006. An
inexpensive immunomarking technique for studying movement patterns of naturally occuring
insect populations. Environ. Entomol. 35 (4): 827–836.
Kaya, H.K. 2002. Natural enemies and other antagonists, pp. 189–203. In Gaugler, R. (ed.),
Entomopathogenic nematology. CABI Publishing, Wallingford, UK.
Kogan, M. 1998. Integrated pest management: historical perspectives and contemporary
developments. Annu. Rev. Entomol. 43: 243–270.
Koppenhöfer, A.M. 2007. Nematodes, pp. 249–264. In L. A. Lacey and H. K. Kaya (eds.), Field
manual of techniques in invertebrate pathology. Kluwer Academic Publishers, Netherlands.
Lacey, L. A, and D. I. Shapiro-Ilan. 2008. Microbial control of insect pests in temperate
orchard systems: potential for incorporation into IPM.” Ann. Rev. Entomol. 53: 121–44.
Lafleur, G., S. B. Hill, and C. Vincent. 1987. Fall migration, hibernation site selection, and
associated winter mortality of plum curculio (Coleoptera: Curculionidae) in a Quebec apple
orchard. J. Econ. Entomol. 80 (6): 1152–72.
Lafleur, G, G. Chouinard, C. Vincent, and D. Cormier. 2007. Impact of trap architecture,
adjacent habitats, abiotic factors, and host plant phenology on captures of plum curculio
(Coleoptera : Curculionidae) adults. J. Econ. Entomol. 100 (3): 737–44.
Lalancette, N., R. D. Belding, P. W. Shearer, J. L. Frecon, and W. H. Tietjen. 2005. Evaluation of hydrophobic and hydrophilic kaolin particle films for peach crop, arthropod and
disease management. Pest Manag. Sci. 61 (1): 25–39.
Lan, Z., H. Scherm, and D. L. Horton. 2003. Reduced midseason pesticide program for control
of scab and plum curculio in peach. Plant Dis. 87 (6): 699–706.
Lan, Z., H. Scherm, and D. L. Horton. 2004. Temperature-dependent development and
prediction of emergence of the summer generation of plum curculio (Coleoptera:
Curculionidae) in the southeastern United States. Environ. Entomol. 33 (2): 174–181.
Land, M. F. 1997. Visual acuity in insects. Annu. Rev. Entomol. 42: 147–77.
Larios, N., H. Deng, W. Zhang, M. Sarpola, J. Yuen, R. Paasch, A. Moldenke, D. Lytle, R.
C. Salvador, E. Mortensen, L. Shapiro, and T. Dietterich. 2008. Automated insect
identification through concatenated histograms of local appearance features. Mach. Vision
Appl. 19 (2): 105–123.
Le Blanc, J. P. R., S. B. Hill, and R. O. Paradis. 1984. Oviposition in scout-apples by plum
curculio, Conotrachelus nenuphar (Herbst) (Coleoptera: Curculionidae), and its relationship
to subsequent damage. Environ. Entomol. 13 (1): 286-291.

104
Lemoyne, P., C. Vincent, S. Gaul, and K. Mackenzie. 2008. Kaolin affects blueberry maggot
behavior on fruit. J. Econ. Entomol. 101 (1): 118–25.
Leskey, T. C. 2006. Visual cues and capture mechanisms associated with traps for plum curculio
(Coleoptera: Curculionidae). J. Entomol. Sci. 41 (2): 97–106.
Leskey, T. C. 2008. Reproductive development of female plum curculio (Coleoptera :
Curculionidae) in the mid-Atlantic: presence of multivoltine populations. J. Entomol. Sci. 43
(2): 208–16.
Leskey, T. C., and R. J. Prokopy. 2002. Developing a branch-mimicking trap for adult plum
curculios. Entomol. Exp. Appl. 102 (3): 253–59.
Leskey, T. C., and S. E. Wright. 2004a. Influence of host tree proximity on adult plum curculio
(Coleoptera: Curculionidae) responses to monitoring traps. Environ. Entomol. 33 (2): 389–96.
Leskey, T. C., and S. E. Wright. 2004b. Monitoring plum curculio, Conotrachelus nenuphar
(Coleoptera: Curculionidae), populations in apple and peach orchards in the Mid-Atlantic. J.
Econ. Entomol. 97 (1): 79–88.
Leskey, T. C., and S. E Wright. 2007. Host preference of the plum curculio. Entomol. Exp.
Appl. 123 (3): 217–27.
Leskey, T. C., A. Zhang, and M. Herzog. 2005. Nonfruiting host tree volatile blends: novel
attractants for the plum curculio (Coleoptera: Curculionidae). Environ. Entomol. 34 (4): 785–
793.
Leskey, T. C., J. C. Piñero, and R. J. Prokopy. 2008. Odor-baited trap trees: a novel
management tool for plum curculio (Coleoptera: Curculionidae). J. Econ. Entomol. 101 (4):
1302–9.
Leskey, T. C., G. Chouinard, and C. Vincent. 2009. Monitoring and management of the apple
maggot fly and the plum curculio: honouring the legacy of R. J. Prokopy, pp. 110–44. In M.
Aluja, T. C. Leskey, and C. Vincent (eds.), Biorational tree fruit pest management. CABI
Publishing, Cambridge, MA.
Levine, E., and F. R. Hall. 1977. Effect of feeding and oviposition by the plum curculio on
apple and plum fruit abscission. J. Econ. Entomol. 70 (5): 603–7.
Liao, M.-S., C.-L. Chuang, T.-S. Lin, C.-P. Chen, X.-Y. Zheng, P.-T. Chen, K.-C. Liao, and
J.-A. Jiang. 2012. Development of an autonomous early warning system for Bactrocera
dorsalis (Hendel) outbreaks in remote fruit orchards. Comput. Electron. Agric. 88: 1–12.

105
López, O., M. M. Rach, H. Migallon, M. Malumbres, A. Bonastre, and J. J. Serrano. 2012. Monitoring pest insect traps by means of low-power image sensor technologies. Sensors 12
(11): 15801–15819.
Maier, C.T. 1990. Native and exotic rosaceous hosts of apple, plum, and quince curculio larvae
(Coleoptera: Curculionidae) in the northeastern United States. J. Econ. Entomol. 83 (4): 1326-
1332.
Maleckas, C. L. 1996. Predicting and monitoring spring emergence of the plum curculio,
Conotrachelus nenuphar (Herbst), (Coleoptera: Curculionidae) using Tedders weevil traps,
flight barrier traps and environmental variables. M.Sc. thesis, Michigan State University, East
Lansing.
Mampe, C. D., and H. H. Neunzig. 1966. Function of the stridulating organs of Conotrachelus
nenuphar (Coleoptera: Curculionidae). Ann. Entomol. Soc. Am. 59 (3): 614–15.
Mankin, R. W., D. W. Hagstrum, M. T. Smith, and M. T. K. Kairo. 2011. Perspective and
promise: a century of insect acoustic detection and monitoring. Am. Entomol. 57 (1): 30–44.
Maredia, K. M. 2003. Introduction and overview, pp. 1–12. In K.M. Maredia, D. Dakouo, and
D. Mota-Sanchez (eds.), Integrated pest management in the global arena. CABI Publishing,
Cambridge, MA.
Markó, V., L. H. M. Blommers, S. Bogya, and H. Helsen. 2008. Kaolin particle films suppress
many apple pests, disrupt natural enemies and promote woolly apple aphid. J. Appl. Entomol.
132 (1): 26–35.
McClanan, M. E., S. Luckhart, D. G. Pfeiffer. 2004. Wolbachia strains associated with
univoltine and multivoltine plum curculios (Coleoptera: Curculionidae). J. Entomol. Sci. 39
(1): 132-135.
McGiffen, M. E. J., J. R. Meyer, and J. V. Boyne. 1987. Physiological parameters of diapause
and reproduction in the plum curculio, Conotrachelus nenuphar (Herbst) (Coleoptera:
Curculionidae). Ann. Entomol. Soc. Am. 80 (2): 284-287.
McKinion, J. M. 1992. Getting started: basics of modeling strategies, pp. 1-8. In J. L.
Goodenough and J. M. McKinion (eds.), Basics of insect modeling. American Society of
Agricultural Engineers Monographs 10. American Society of Agricultural Engineers,
St.Joseph, MI.
Minitab 14.1 Statistical Software. 2004. Minitab, Inc., State College, PA.
Möller, R. 2002. Insects could exploit UV-green contrast for landmark navigation. J. Theor.
Biol. 214 (4): 619-631.
Nielsen, E. T. 1963. Illumination at twilight. Oikos 14 (1): 9–21.

106
Owens, E.D., K. I. Hauschild, G. L. Hubbell, and R. J. Prokopy. 1982. Diurnal behavior of
plum curculio (Coleoptera: Curculionidae) adults within host trees in nature. Ann. Entomol.
Soc. Am. 75 (4): 357–362.
Padula, A.L. and E. H. Smith. 1971. Reproductive incompatibility between univoltine males
and multivoltine females of the plum curculio. Ann. Entomol. Soc. Am. 64 (3): 665-668.
Pawson S. M., M. S. Watt, and E. G. Brockerhoff. 2009. Using differential responses to light
spectra as a monitoring and control tool for Arhopalus ferus (Coleoptera: Cerambycidae) and
other exotic wood-boring pests. J. Econ. Entomol. 102 (1): 79-85.
Payne, J. A., J. L. Blythe, H. Lowman, and C. E. Yonce. 1973. Response of laboratory-reared
adult plum curculios to ultraviolet radiation. Ann. Entomol. Soc. Am. 66 (5): 1007-1009.
Pedigo, L. P. 1994. Introduction to sampling arthropod populations, pp. 1-11. In L.P. Pedigo,
and G.D. Buntin (eds.), Handbook of sampling methods for arthropods in agriculture. CRC
Press, Boca Raton, FL.
Pereault, R.J., M .E. Whalon, and D. G. Alston. 2009. Field efficacy of entomopathogenic
fungi and nematodes targeting caged last-instar plum curculio (Coleoptera: Curculionidae) in
Michigan cherry and apple orchards. Environ. Entomol. 38 (4): 1126–1134.
Piñero, J. C., and R. J. Prokopy. 2006. Temporal dynamics of plum curculio, Conotrachelus
nenuphar (Herbst) (Coleoptera: Curculionidae), immigration into an apple orchard in
Massachusetts. Environ. Entomol. 35 (2): 413–22.
Piñero, J. C., S. E. Wright, and R. J. Prokopy. 2001. Response of plum curculio (Coleoptera:
Curculionidae) to odor-baited traps near woods. J. Econ. Entomol. 94 (6): 1386–1397.
Piñero, J. C., A. M. Agnello, A. Tuttle, T. C. Leskey, H. Faubert, G. Koehler, L. Lorraine,
G. Morin, K. Leahy, D. R. Cooley, and R. J. Prokopy. 2011. Effectiveness of odor-baited
trap trees for plum curculio (Coleoptera: Curculionidae) monitoring in commercial apple
orchards in the Northeast. J. Econ. Entomol. 104 (5): 1613–21.
Prokopy, R. J., and E. D. Owens. 1983. Visual detection of plants by herbivorous insects.
Annu. Rev. Entomol. 28: 337–64.
Prokopy, R. J., and S. E. Wright. 1998. Plum curculio (Coleoptera: Curculionidae) responses
to unbaited pyramid and cone traps. J. Econ. Entomol. 91 (1): 226–34.
Prokopy, R. J., J. L. Mason, M. Christie and S. E. Wright. 1996. Arthropod and natural
enemy abundance under second-level vs. first-level integrated pest management practices in
apple orchards: a four-year study. Agr. Ecosyst. Environ. 57 (1): 35-47.
Prokopy, R. J., M. Marsello, T. C. Leskey, and S. E. Wright. 1999. Evaluation of unbaited

107
pyramid traps for monitoring and controlling plum curculio adults (Coleoptera: curculionidae)
in apple orchards. J. Entomol. Sci. 34 (1): 144–153.
Prokopy, R. J., B. W. Chandler, S. A. Dynok, and J. C. Piñero. 2003. Odor-baited trap trees:
a new approach to monitoring plum curculio (Coleoptera: Curculionidae). J. Econ. Entomol.
96 (3): 826–34.
Quaintance, A.L., and E. L. Jenne. 1912. The plum curculio. U. S. Department of Agriculture
Bureau of Entomology, Bull. 103: 1–250.
Racette, G., S. B. Hill, and C. Vincent. 1990. Actographs for recording daily activity of plum
curculio (Coleoptera: Curculionidae). J. Econ. Entomol. 83 (6): 2385–92.
Racette, G., G. Chouinard, S. B. Hill, and C. Vincent. 1991. Activity of adult plum curculio
(Coleoptera: Curculionidae) on apple trees in spring. J. Econ. Entomol. 84 (6): 1827–1832.
Racette, G., G. Chouinard, C. Vincent, and S. B. Hill. 1992. Ecology and management of
plum curculio, Conotrachelus nenuphar (Coleoptera: Curculionidae), in apple orchards.
Phytoprotection 73 (3): 85-100.
Reissig, W. H., J. P. Nyrop, and R. Straub. 1998. Oviposition model for timing insecticide
sprays against plum curculio (Coleoptera: Curculionidae) in New York state. Environ.
Entomol. 27 (5): 1053–1061.
Reynolds, D. R., and J. R. Riley. 2002. Remote-sensing, telemetric and computer-based
technologies for investigating insect movement: a survey of existing and potential techniques.
Comput. Electron. Agric. 35 (2-3): 271–307.
Rowcliffe, J. M., and C. Carbone. 2008. Surveys using camera traps: are we looking to a
brighter future? Anim. Conserv. 11 (3): 185–186.
Ryan, T. A. and B. L. Joiner. 1976. Normal probability plots and tests for normality. Minitab
Statistical Software: Technical Reports. The Pennsylvania State University, State College,
PA.
Sackett, T. E., C. M. Buddle, and C. Vincent. 2007. Effects of kaolin on the composition of
generalist predator assemblages and parasitism of Choristoneura rosaceana (Lep.,
Tortricidae) in apple orchards. J. Appl. Entomol. 131 (7): 478–85.
Selby. R. D., S. H. Gage, and M. E. Whalon. 2014. Precise and low-cost monitoring of plum
curculio (Coleoptera: Curculionidae) pest activity in pyramid traps with cameras. Environ.
Entomol. 43 (2): 421-431.
Shapiro-Ilan, D. I., Mizell III, R.F., Cottrell, T.E., Horton, D.L., 2004. Measuring field
efficacy of Steinernema feltiae and Steinernema riobrave for suppression of plum curculio,
Conotrachelus nenuphar, larvae. Biol. Control 30 (2): 496–503.

108
Shapiro-Ilan, D.I., R. F. Mizell III, T. E. Cottrell, and D. L. Horton. 2008. Control of plum
curculio, Conotrachelus nenuphar, with entomopathogenic nematodes: Effects of application
timing, alternate host plant, and nematode strain. Biol. Control 44 (2): 207–215.
Shapiro-Ilan, D. I., S. E. Wright, A. F. Tuttle, D. R. Cooley, T. C. Leskey. 2013. Using
entomopathogenic nematodes for biological control of plum curculio, Conotrachelus
nenuphar: effects of irrigation and species in apple orchards. Biol. Control 67 (2): 123–129.
Southwood, T. R. E., and P. A. Henderson. 2000. Ecological methods, 3rd ed. Blackwell
Science, Malden, MA.
Stevenson, J.O., and E. H. Smith. 1961. Fecundity and fertility of two strains of plum curculio,
reciprocal crosses and the F1 generations. J. Econ. Entomol. 54 (2): 283-284.
Stewart, A. J. A. 2012. Where to next? The future of insect conservation, pp. 403–417. In T.R.
New (ed.), Insect conservation: past, present and prospects, Springer: New York.
Tabuchi, K., S. Moriya, N. Mizutani, and K. Ito. 2006. Recording the occurrence of the bean
bug Riptortus clavatus (Thunberg) (Heteroptera: Alydidae) using an automatic counting trap.
Jap. J. Appl. Entomol. Zool. 50 (2): 123–129.
Tedders, W. L., and B. W. Wood. 1994. A new technique for monitoring pecan weevil
emergence (Coleoptera: Curculionidae). J. Entomol. Sci. 29 (1): 18–30.
Tedders, W. L., and B. W. Wood. 1995. Pyramidal traps for monitoring the presence of pecan
weevil (Coleoptera: Curculionidae). J. Entomol. Sci. 30 (4): 534–44.
Tedders, W. L., D. J. Weaver, E. J. Wehunt, and C. R. Gentry. 1982. Bioassay of
Metahizium anisopliae, Beauveria bassiana, and Neoplectana carpocapsae against larvae of
the plum curculio, Conotrachelus nenuphar (Herbst) (Coleoptera: Curculionidae). Environ.
Entomol. 11 (4): 901–4.
Tedders, W. L., R. F. Mizell, III, and B. W. Wood. 1996. Effects of color and trunk wrap on
pecan weevil catch in pyramidal traps. J. Entomol. Sci. 31 (4): 414–19.
Tirelli, P., N. A. Borghese, F. Pedersini, G. Galassi, and R. Oberti. 2011. Automatic
monitoring of pest insects by Zigbee-based wireless networking of image sensors, pp. 1–5. In
Proceedings, 2011 IEEE International Instrumentation and Measurement Technology
Conference, 10-12 May 2011, Binjiang, Hangzhou, China. The Institute of Electrical and
Electronics Engineers, Piscataway, NJ.
(USDA) U. S. Department of Agriculture. 1941. Agricultural Marketing Service: United States
Standards for Grades of Red Sour Cherries for Manufacture. USDA, Beltsville, MD.

109
(USEPA) U. S. Environmental Protection Agency. 2008. Azinphos-methyl; Product
Cancellation Order and Amendments to Terminate Uses. USEPA, Washington, D.C.
Vincent, C., G. Chouinard, N. J. Bostanian, and Y. Morin. 1997. Peripheral-zone treatments
for plum curculio management: validation in commercial apple orchards. Entomol. Exp. Appl.
84 (1): 1–8.
Vincent, C., G. Chouinard, and S. B. Hill. 1999. Progress in plum curculio management: a
review. Agr. Ecosyst. Environ. 73 (2): 167–75.
Wagner, T.L., H.-I. Wu, P. J .H. Sharpe, R. M. Schoolfield, and R. N. Coulson. 1984. Modeling insect development rates: a literature review and applications of a biophysical
model. Ann. Entomol. Soc. Am. 77 (2): 208–225.
Wang, S., J. Tang and S. P. Cavalieri. 2001. Modeling fruit internal heating rates for hot air
and hot water treatments. Postharvest Biol. Tec. 22 (3): 257-270.
Wise, J., and M. E. Whalon. 2009. A systems approach to IPM integration, ecological
assessment and resistance management in tree fruit orchards, pp. 325–345. In I. Ishaaya, and
A.R. Horowitz (eds.), Biorational control of arthropod pests: application and resistance
management. Springer Publishing Ltd., New York, NY.
Wise, J. C., K. Kim, E. J. Hoffmann, C. Vandervoort, A. Gökçe, and M. E. Whalon. 2007. Novel life stage targets against plum curculio, Conotrachelus nenuphar (Herbst), in apple
integrated pest management.” Pest Manag. Sci. 63 (8): 737–42.
Wen, C., D. Guyer., and W. Li. 2009. Local feature-based identification and classification for
orchard insects. Biosys. Eng. 104 (3): 299–307.
Whalon, M. E. and A. B. Coombs. 2003. Plum curculio monitoring in the Midwest,
implications for the Pacific northwest , pp. 41. In Proceedings, 77th
Annual Western Orchard
Pest and Disease Management Conference. 15-17 January, Portland, OR. Washington State
University, Pullman, WA.
Worner, S.P. 1998. Some problems and approaches to modelling insect phenology, pp. 89–98.
In J. Baumgärtner, P. Brandmayr, and B. Manly (eds.), Population and community ecology
for insect management and conservation. Balkema, Florence, Italy.
Wraight, S.P., G. D. Inglis, and M. S. Goettel. 2007. Fungi, pp. 223–248. In L. A. Lacey and
H. K. Kaya (eds.), Field Manual of Techniques in Invertebrate Pathology. Kluwer Academic
Publishers, Netherlands.
Yao, Q., J. Lv, Q.-J. Liu, G.-Q. Diao, B.-J. Yang, H.-M. Chen, and J. Tang. 2012. An insect
imaging system to automate rice light-trap pest identification. J. Integr. Agric. 11 (6): 978–
985.

110
Zavalloni, C., J. A. Andresen, and J. A. Flore. 2006. Phenological models of flower bud stages
and fruit growth of “Montmorency” sour cherry based on growing degree-day accumulation.
J. Am. Soc. Hortic. Sci. 131 (5): 601–607.
Zhang, X., and D. G. Pfeiffer. 2008. Evaluation of reproductive compatibility of interstrain
matings among plum curculio populations in the eastern United States. Environ. Entomol. 37
(5): 1208-1213.
Zhang, X., S. Zhijian, S. Luckhart, and D. G. Pfeiffer. 2008. Genetic diversity of plum
curculio (Coleoptera: Curculionidae) among geographic populations in the eastern United
States. Ann. Entomol. Soc. Am. 101 (5): 824-832.