MODELING SUITABLE HABITAT FOR THE COMMON MUDPUPPY ...
87
MODELING SUITABLE HABITAT FOR THE COMMON MUDPUPPY (NECTURUS MACULOSUS MACULOSUS) IN INDIANA, USA UTILIZING REGIONAL DATA AND ENVIRONMENTAL DNA Payton Nicole Fischer Submitted to the faculty of the University Graduate School in partial fulfillment of the requirements for the degree Master of Science in the Department of Geography, Indiana University May 2020
Transcript of MODELING SUITABLE HABITAT FOR THE COMMON MUDPUPPY ...
MODELING SUITABLE HABITAT FOR THE COMMON MUDPUPPY (NECTURUS
MACULOSUS MACULOSUS) IN INDIANA, USA UTILIZING REGIONAL DATA
AND ENVIRONMENTAL DNA
Payton Nicole Fischer
Submitted to the faculty of the University Graduate School
in partial fulfillment of the requirements
for the degree
Master of Science
in the Department of Geography,
Indiana University
May 2020

ii
Accepted by the Graduate Faculty of Indiana University, in partial
fulfillment of the requirements for the degree of Master of Science.
Master's Thesis Committee
______________________________________
Vijay Lulla, Ph.D., Chair
______________________________________
Jeffrey S. Wilson, Ph.D.
______________________________________
Aniruddha Banerjee, Ph.D.,

iii
© 2020
Payton Nicole Fischer

iv
AKNOWLEDGEMENTS
I would like to thank the IUPUI Geography Department and members of my
thesis committee, Vijay Lulla, Ph.D., Jeffrey Wilson, Ph.D., and Aniruddha Banerjee,
Ph.D., for their assistance and guidance throughout this project. Eric McCluskey, Ph.D.
provided guidance and advice on creating the model for this project.
Emily McCallen, Ph.D. helped get my thoughts organized on how to go about
creating this thesis project. She pointed me in the direction of many good articles and
contacts that helped shape this project. Data contributors were The Williams’ Lab,
HerpMapper, Indiana Heritage Database, Obed Hernandez-Gomez, Ph.D., Greg Lipps
(OSU), Megan Gramhofer, and Nathan Engbrecht. Dr. Robert Brodman was a sounding
board for my ideas and organized my presentation at the MWPARC meeting in Iowa.
Before entering graduate school, he instilled a foundation of research and an overall
passion for amphibians and reptiles.
My husband was a great support system as we got married and had our first child
all while working on this thesis. I could not have done this without his calming guidance
and encouragement.

v
Payton Nicole Fischer
MODELING SUITABLE HABITAT OF THE COMMON MUDPUPPY (NECTURUS
MACULOSUS MACULOSUS) IN INDIANA, USA UTILIZING REGIONAL DATA
AND ENVIRONMENTAL DNA
The distribution of the Common Mudpuppy (Necturus maculosus maculosus) is
widespread but greatly understood. It is assumed that mudpuppy populations are
declining due to poor habitat quality. However, there is not enough data to support this
claim. The distribution of the mudpuppy is throughout the entire state, but only 43 of the
92 counties in Indiana have records. This project utilized habitat suitability modeling,
focused on Indiana, to gain a better understanding of their distribution within the state.
Data from Ohio and the Salamander Mussel (Simpsonais ambigua) were included to
bolster the dataset. Environmental DNA was included to validate the model. Variables
used in this analysis were Strahler Stream Order, distance to forest, percent agriculture,
and tree canopy cover. Results showed that stream orders 4 to 6, a shorter distance to
forest, less agriculture, and 30 to 40% of tree canopy cover was what contributed to
suitable habitat. Stream order was the variable that contributed to the model the most.
The areas of suitable habitat found were the HUC08 sub-watersheds in the northeastern
and southwestern corners of the state. These areas included 19 counties were there were
no previous records of mudpuppies. Environmental DNA showed that the negative
samples were not found in suitable habitat. Further supporting the predicted area of
suitable habitat. It is recommended that conservation efforts focus on the northeastern
and southwestern regions. Interpreting this data to align with the regions set by the
Indiana State Wildlife Action Plan shows that conservation should focus in the Great

vi
Lakes, Interior Plateau, and Valley and Hills area. It is recommended that more
environmental data be conducted and that proactive conservation measures are
implemented.
Vijay Lulla, Ph.D., Chair

vii
TABLE OF CONTENTS
List of Tables ..................................................................................................................... ix
List of Figures ......................................................................................................................x
List of Abbreviations ......................................................................................................... xi
Glossary ........................................................................................................................... xiii
Introduction ..........................................................................................................................1
Background ..........................................................................................................................6
Life History ..................................................................................................................... 6
Habitat and Distribution .................................................................................................. 7
Species Importance ....................................................................................................... 12
Habitat Suitability Modeling ......................................................................................... 17
Methods..............................................................................................................................25
Spatial Extent ................................................................................................................ 26
Occurrence Data ............................................................................................................ 26
Environmental Variables ............................................................................................... 29
Experimental Design ..................................................................................................... 32
Limitations .................................................................................................................... 34
Results ................................................................................................................................36
Discussion ..........................................................................................................................38
Review of Variables and Analysis ................................................................................ 38
Conclusions and Recommendations.............................................................................. 42
Appendix A: Tables ...........................................................................................................45
Appendix B: Figures ..........................................................................................................48

viii
Literature Cited ..................................................................................................................60
Curricuum Vitae

ix
LIST OF TABLES
Table 1. HUC08 sub-basins with HUC10, HUC12 and SWAP planning regions ........... 45
Table 2. Sources of datapoints organized by state ............................................................ 45
Table 3. Total number of mudpuppy and mussel datapoints after 1990 ........................... 45
Table 4. Variables used in model with source and description ......................................... 46
Table 5. ENMeval results for optimal settings of MaxEnt ............................................... 46
Table 6. Counties within HUC08 sub-watershed ............................................................. 47

x
LIST OF FIGURES
Figure 1. Distribution map of the Common Mudpuppy ................................................... 48
Figure 2. Records of mudpuppies in Indiana by Hoffman et al.(2014) ............................ 49
Figure 3. Records of mudpuppies in Indiana as of July 2018 ........................................... 50
Figure 4. Predicted regions of suitable habitat (HUC08) ................................................. 51
Figure 5. Planning regions for Indiana SWAP report ....................................................... 52
Figure 6. Bin regions of study area ................................................................................... 53
Figure 7. ROC curve for sensitivity and specificity ......................................................... 54
Figure 8. Marginal response curves of MaxEnt variables ................................................ 54
Figure 9. Results of jackknife test of variables ................................................................. 55
Figure 10. HUC12 sub-watershed of suitable habitat. ...................................................... 56
Figure 11. Top ten HUC08 sub-basin of suitable habitat ................................................. 57
Figure 12. Top ten counties of suitable habitat. ................................................................ 58
Figure 13. eDNA results with HUC08 sub-basins ............................................................ 59

xi
LIST OF ABBREVIATIONS
AICc – Akaike Information Criterion
AUC– Area Under the Curve
DEM – Digital Elevation Model
eDNA – Environmental DNA
ESM – Ensembles of Small Models
HSM – Habitat Suitability Modeling
HUC – Hydrologic Unit Code
IDNR – Indiana Department of Natural Resources
LULC – Land Use and Land Cover
MRLC – Multi-Resolution Land Characteristic Consortium
mSSS – Maximum Sum of Sensitivity and Specificity
NFHD – National Fish Habitat Database
NHDPlusV2 – National Hydrography Dataset Plus Version 2
NRCS – Natural Resources Conservation Service
QHEI – Qualitative Habitat Evaluation Index
ROC – Receiver Operating Characteristic
SDM – Species Distribution Models
SGCN – Species of Greatest Conservation Need
SWAP - State Wildlife Action Plan
UAV – Unmanned Aerial Vehicles
USDA – United States Department of Agriculture
USDOI – United States Department of the Interior

xii
USFWS – United States Fish and Wildlife Service
USGS – United States Geological Survey

xiii
GLOSSARY
Commensal – a relationship between two organisms where one positively benefits and
the other gains no benefit and are not harmed from the relationship
eDNA – (Environmental DNA) DNA that is found in the environment by means of water,
soil, or general contact; the DNA is extracted from the environment without direct
contact from the host organism
ENMeval – ENMeval is an R package that performs automated runs and evaluations of
ecological niche models, and currently only implements MaxEnt
Jackknife – resampling technique especially useful for variance and bias estimation
Legacy effect – environmental changes resulting from antecedent human disturbances
MaxEnt – program that performs maximum entropy modelling; predicts species
occurrences by finding the distribution that is most spread out, or closest to
uniform, while taking into account the limits of environmental variables of known
locations
Niche – position or role taken by a kind of organism within its community
Occupancy modeling – model used to account for imperfect detection of organisms in
surveys and to determine the probability of the true presence or absence of a
species at a site
Trophic structure – partitioning of biomass between trophic levels based on the amount
of energy the organism consumes

1
Introduction
The Common Mudpuppy (Necturus maculosus maculosus) is a widespread
species that inhabits the eastern United States. They are a fully aquatic salamander that
resides in the streams and lakes of Indiana (Minton, 2001). Populations of mudpuppies
are declining throughout their range, but the extent of this decline is unknown because
they are greatly understudied. Not much is known about their movement patterns, habitat
selection, or population structure (Anton, 1999; Matson, 1990). A large reason why there
is an information gap is because mudpuppies are a cryptic species that are difficult to
catch (Matson, 1990). There have not been official, large-scale sampling efforts of
mudpuppies in the upper Midwest (Lambert, Hinz Jr & Cao, 2016). In Indiana, the
Common Mudpuppy is considered a Species of Special Concern. The state of Indiana’s
Department of Natural Resources defines a Species of Special Concern as, “Any animal
species requiring monitoring because of known/suspected limited abundance or
distribution or because of a recent change in legal status or required habitat” (Resources,
2018).
Mudpuppies are at risk because of numerous threats to their habitat. These threats
are primarily caused by humans. The problems include urbanization, agriculture, and
pollution caused by chemicals (Mackey & Goforth, 2005). Mudpuppies are also
commonly harvested in the upper Midwest for biological supply companies. These
companies sell mudpuppies for educational purposes for biology classes. Fisherman
commonly catch mudpuppies in the winter due to higher activity and are known to kill
them based on lore stating they are harmful to fish populations (Holman, 2012; Matson,
2005).
2
The preservation of this species is necessary because they are considered a
bioindicator. A bioindicator species refers to a species that can inform scientists about the
condition of the environment (Landres, Verner & Thomas, 1988; Noss, 1990). The
animals’ reactions to the changes around them is a direct indicator to what is happening
in the environment whether it is positive or negative. The abundance of bioindicators is
directly correlated to high biodiversity within an ecosystem (Hager, 1998).
A keystone species is where the community structure depends on their presence
and competition within the ecosystem (Mills, Soulé & Doak, 1993). If a keystone species
is removed from the ecosystem, then there could be radical changes within the
community structure (Hager, 1997). Mudpuppies are also considered to be an umbrella
species. Umbrella species are considered species where other species in the environment
benefit from their conservation (Wilcox, 1984; Wilcox, Murphy, Ehrlich & Austin,
1986).
The mudpuppy is a host for the Salamander Mussel (Simpsonias ambigua) which
is also a Species of Special Concern in Indiana. Salamander Mussels persist in streams
only if there are mudpuppies present. The Salamander Mussel needs high water quality
with low siltation to persist. Since the mussels are dependent on the mudpuppy, any
habitat threats to the mudpuppy are also threats to them (Watson, Metcalfe-Smith & Di
Maio, 2001). The umbrella created by the mudpuppy’s conservation also spreads to other
vertebrate and invertebrate species. Any individual species that benefits from the same
habitat parameters of the mudpuppy will benefit from their conservation.
Since the Common Mudpuppy is a cryptic species, other scientific measures have
been used to detect their presence in waterbodies. Within recent years, environmental

3
DNA (eDNA) has been used to extract DNA from water and soil samples. The samples
are collected and filtered, trapping any DNA for further testing (Turner, 2015). Water
bodies where there were records of Salamander Mussels but no mudpuppies present were
sampled and analyzed for mudpuppy eDNA. This data is planned to be used to detect
mudpuppies in the environment and supplement conservation plans for the Indiana
Department of Natural Resources (IDNR) (Hernandez-Gomez, 2018a). The DNA of the
mudpuppy has been observed traveling downstream 30 meters (Spear, 2017). This
method of monitoring is useful as it indicates that there is a mudpuppy nearby. The
problem with the 30-meter buffer from the individual is that if you are not close enough,
you might not detect their presence in the stream. However, timing collections with
breeding seasons can increase the probability of getting accurate samples (Collins, 2017).
Habitat suitability modeling (HSM) is a frequently used practice used to predict
suitable habitat areas for a species to inhabit. The model includes habitat parameters that
are considered necessary for that species to survive (Merow, Smith & Silander Jr, 2013).
Point data is used to develop the model by analyzing the habitat around that point. When
a model is being created, most researchers use presence-absence data. Presence-absence
based HSM is when researchers survey an area and determine if there are individuals
present. If there are no individuals present, this is represented as an absence and the
model determines that the variables in this area are not conducive to supporting that
species. This study used presence only point-data of mudpuppies and salamander mussels
to generate a habitat model where mudpuppies could persist. This is because there is only
occurrence data documented for these species. Mudpuppy populations have not been
properly studied because they are difficult to find and lack funds for research. Data from

4
Ohio was used to bolster the dataset because it is a state that borders Indiana. This was
used to create a more accurate model by including a larger area and more data points.
Modeling mudpuppy habitat mirrored HSM and occupancy modeling of the
hellbender (Cryptobranchus alleganiensis). The hellbender is a closely related, fully
aquatic salamander species that has similar habitat parameters (Minton, 2001). They are
less tolerant to pollutants and low-quality habitat than mudpuppies. There have been
many studies modeling suitable habitat and occupancy of hellbenders because they are a
species in peril. The Eastern Hellbender (Cryptobranchus alleganiensis alleganiensis)
has a small population in Southern Indiana, and usually researchers find mudpuppies
when they search for hellbenders (McCallen, 2017). These studies will serve as a
framework for modeling habitats for mudpuppies. HSM studies for hellbender and
mudpuppies differ because the hellbender research was completed using presence-
absence data while there is just presence only data for mudpuppies.
Habitat was analyzed on a watershed scale within Indiana. The United States
Geological Survey (USGS) has created a Hydrologic Unit Code (HUC) that designates
drainage basins throughout the United States by assigning a numeric digit to the basin.
This is designated by a “HUC” and a number value that indicates how many numbers are
in the identification code. (Ex. HUC8, HUC10, HUC12, etc.). More numbers within the
code means the basin area gets smaller and more precise. In Lambert et al. (2016), they
analyzed region-wide species data based on the HUC08 regions. They recommend and
encourage analysis by HUC10 regions or stream reaches.
Nine sub-watersheds (HUC08) were identified as areas for possible conservation
need for mudpuppies in Indiana. It is hypothesized that these areas are identified as

5
suitable habitat in this model. Ohio is also included in this study to create a larger dataset
to build a more accurate model. In addition to this analysis, the eDNA results were used
as a test dataset to determine confidence and accuracy within the model.

6
Background
Life History
The Common Mudpuppy is a large, fully aquatic salamander. They have external
gills in their larval and adult life stages. Adult mudpuppies grow up to 16 inches long
with their tail being 30 percent of their total body length. Mudpuppies are brown in
coloration with dark stripes running through their face and down their body. Younger
individuals may have a white stripe instead of the darker one. The larvae are 30 to 36
millimeters in size and have lighter markings (Minton, 2001). They are a long-lived
species that can have a lifespan of over 30 years (Matson, 2005). They are found to be
most active at night in the fall and winter months when feeding and reproduction takes
place (Harding, 1997; Hecht & Walters, 1955; Holman, 2012; Neill, 1963). Sexual
maturity in mudpuppies begins when they are about 5 to 10 years old (Matson, 2005;
Minton, 2001).
Breeding occurs during late fall and eggs are laid in the following spring. The
eggs are attached to the underside of rocks, logs, and other large refugia. Each egg is
attached by a short stalk to the cover object. The eggs are individually laid in a cluster of
50-100 eggs (Matson, 2005; Minton, 2001; Petranka, 1998). Females will stay with the
nest and guard it from potential predators (Gendron, 2000). Most of the mating and
laying of eggs happens in shallow water due to the colder temperature in the winter and
spring months (Harding, 1997; Holman, 2012; Matson, 2005; Petranka, 1998). Craig,
Mifsud, Briggs, Boase & Kennedy (2012) conducted research on mudpuppy distribution
and breeding by collecting information from fisheries bycatch in the Detroit River. They
found eggs on a buoy that was 9.8 meters (32 feet) below surface level. It is widely

7
accepted that quality mudpuppy breeding habitat is in shallow waters, but this finding
shows that breeding locations could be more variable than previously thought.
Mudpuppies have a variable diet consisting of fish, invertebrates, amphibians, and
carrion (Harding, 1997; Holman, 2012; Lagler & Goellner, 1941; Petranka, 1998).
Mudpuppies have the ability tthereo locate decaying creatures because of their well-
developed sense of smell (Harding, 1997). The diets of mudpuppies have been reported
to vary based on their size and use of microhabitat (Bart Jr & Holzenthal, 1985; Braswell
& Ashton, 1985). Researchers have found mudpuppies feeding on the invasive Round
Goby (Negobius melanstomus) and using Zebra Mussel (Dreissena polymorpha) colonies
as refugia (Craig et al., 2012).
Beattie, Whiles & Willink (2017) conducted a feeding study on mudpuppies in
Wolf Lake, a lake the crosses the border of Illinois and Indiana. Their study focused on
feeding preferences within designated age groups based on size of the salamanders.
Results showed that there was variability in diet across age ranges. Only larger
individuals fed on crayfish, and only juveniles, the smallest individuals, fed on leeches.
They also found that the mudpuppies were feeding on invasive species, the first official
recording of this occurrence. They concluded that their findings support the hypothesis
that mudpuppies have variable diets according to their sizes or ages. This is beneficial
because the older and larger individuals are not competing for food with the younger and
smaller individuals.
Habitat and Distribution
Mudpuppies inhabit streams, rivers, lakes, and ponds throughout their range
(Harding, 1997; Matson, 2005; Minton, 2001; Petranka, 1998). Individuals can be found

8
in depths of water from 3 to 90 feet deep (Hacker, 1957; Minton, 2001; Sajdak, 1982).
Mudpuppies typically dwell among the bottom of lakes and streams (Minton, 2001).
Mudpuppies have been found to occupy shallower water in the winter months when the
water temperature is cooler (Harding, 1997; Holman, 2012). The streams that
mudpuppies typically occupy have rocky bottoms with some siltation (Minton, 2001).
They require rocks, logs, and other refugia for feeding, breeding, and predator avoidance
(Harding, 1997; Hoffman, Robb & E. Fisher, 2014; Holman, 2012; Petranka, 1998).
Mudpuppies are found throughout the eastern United States and southern portions
of eastern Canada (Figure 1) (Minton, 2001). Historically, they were found abundantly
throughout the Great Lakes Region. This species has the largest distribution of a fully
aquatic salamander in the United States (Petranka, 1998). The distribution of mudpuppies
in Indiana has not been fully described. Hoffman et al. (2014) compiled mudpuppy
records from anglers, museums, and the state’s current database to create a
comprehensive distribution map (Figure 2). Through this research, they added 13 new
county records since Minton (2001). The last extensive population survey prior to
Hoffman et al. (2014) was in Lake Maxinkuckee, in Marshall County, Indiana by
Evermann & Clark (1916), over 100 years ago. Even with the addition of the new county
records, there is still not enough information to have an accurate distribution within
Indiana (Hoffman et al., 2014). This thesis aims to fill the gaps where there are no known
locations of mudpuppies. The compilation of data and habitat modeling will give a better
understanding of their possible distribution within the state.
There are still approximately 10 counties where Salamander Mussels are found
where there are no records of mudpuppies present (Figure 3) (Hoffman et al., 2014).

9
Many of the counties have a small number of records. There was an environmental DNA
(eDNA) study conducted in partnership with the IDNR and Purdue to analyze the
Salamander Mussels’ habitat for the presence of mudpuppies. Organisms are continually
shedding skin cells into their environment around them leaving traces of DNA. The DNA
available in the water is from cells released by skin, saliva, and fecal material. Analysis
of the water sample is done by extracting DNA and testing by using quantitative PCR
(qPCR) to see if there are traces of mudpuppy DNA (Jerde, Mahon, Chadderton &
Lodge, 2011). Using eDNA to study a cryptic species is helpful because you do not need
to find individuals to determine presence in an ecosystem. Collecting eDNA reduces
human impact on an ecosystem and is more cost effective compared to manually
searching (Thomsen & Willerslev, 2015). The eDNA results generated by Obed
Hernandez-Gomez were analyzed by using amplicon sequencing on an Illumina machine
which differs from qPCR analysis (Hernandez-Gomez, 2018b).
The most recent systematic search of mudpuppies was conducted by Hoffman et
al. (2014). Trapping occurred in Jennings and Ripley Co, Indiana in three different rivers.
They also located mudpuppies through visual surveys that consisted of overturning large
rocks to look for individuals and nests. Multiple adult salamanders were found in all of
the rivers sampled, as well as some nests. They recommend using artificial nest boxes to
create suitable habitat for nesting and easy monitoring. They suggested that the Upper
Muscatatuck River Watershed could be a key area for conservation of this species. This
watershed was formally known as the Muscatatuck Watershed sub-basin (HUC08)
(Survey, 2011).

10
Evermann & Clark (1916) is one of the few known systematic surveys of
mudpuppies in Indiana. They observed populations of mudpuppies in Lake Maxinkuckee
and noted seasonal behaviors and habitat use. They observed that populations in lakes
tend to stay near the shoreline in shallower water. No individual mudpuppies were found
deeper than 35 feet. The mudpuppies were found to make burrows into the muddy
bottoms of lakes. The burrows were observed to have what seemed to be an entrance and
exit. When further examined, it appeared that only one mudpuppy would occupy a
burrow at a time. These burrows were not observed to be used for breeding. Individuals
were commonly seen at the entrance of the burrow predating small vertebrates and
invertebrates as they passed by.
Shoop & Gunning (1967) monitored the movement patterns in the Common
Mudpuppy and the Gulf Coast Waterdog (Necturus beyeri). They found that the Common
Mudpuppy moved, on average, 77 meters from their previous capture site. Even though
there were movements from capture location, they suggest that the Necturus species stay
in specific parts of the streams. They found that individuals that are displaced around 210
meters downstream can return to their original niche. This suggests that there may be a
homing capability that is representative of habitat familiarity. Their conclusions suggest
that mudpuppies have a small home range and exhibit high site fidelity.
Many factors pose a threat to suitable habitat for mudpuppies. Since the
mudpuppy is fully aquatic, it is not able to easily combat these threats. Most of the threats
are due to anthropogenic factors. Threats to suitable mudpuppy habitat are urbanization,
siltation from agriculture, exotic species, and pollutants (Mackey & Goforth, 2005;
Niemi, Kelly & Danz, 2007). In the Great Lakes Region, lampricide poses a large threat

11
to mudpuppies due to their high sensitivity to the chemical which causes mass die-offs
(Matson, 1990, 1998). In Ohio, many of the occurrence data points are recorded from
mass die-offs resulting from lampricide applications (Lipps, 2018). Throughout their
range, these threats have already been documented as harmful to mudpuppies and have
led to a range wide decline in population (Matson, 2005).
In 2015, the IDNR created a State Wildlife Action Plan (SWAP) to assess
conservation needs within the state. This document identified all of the vertebrates,
invertebrates, and plants in the state that were considered state endangered or threatened
(Wildlife, 2015a). These species were labeled as Species of Greatest Conservation Need
(SGCN). The state was divided into six regions and listed the environmental threats to the
species that occupy those areas. The mudpuppy was listed as a species present in every
region across the state. Threats to the mudpuppies’ habitat are natural system
modifications, agriculture, aquaculture, and residential or commercial development.
These threats are present across the state and the IDNR is hoping to implement practices
to minimize their impact on the environment. Unfortunately, the IDNR Division of Fish
and Wildlife does not have any current monitoring efforts for the mudpuppy (Engbrecht,
2017). Researchers across the state believe that the biggest problems with monitoring
mudpuppies are the lack of funds and understaffing. However, there is monitoring and
conservation efforts for hellbenders in the state (Wildlife, 2015a).
The SWAP report had a habitat suitability modeling analysis conducted, but it
was not included in the assessment (Wildlife, 2015b). It was felt that the modeling could
not predict where the individuals were residing and was therefore excluded. The
Common Mudpuppy was not included in the suitability modeling for this report.

12
Researchers across the state were surveyed and they commented on relevant actions and
barriers to mudpuppy conservation. They stated that more baseline data is needed, water
quality needs to be improved, and waterways need to be protected. The barriers that faced
mudpuppy research were the cost of improving sewage treatment facilities and other
research priorities.
Species Importance
Mudpuppies are the obligate host for the Salamander Mussel (Simpsonaias
ambigua). The salamander mussel is a small, freshwater stream mussel that lives under
flat rocks (Roe, 2003). The larval stage of the Salamander Mussel uses the mudpuppy as
a host in a commensal relationship (Howard, 1951; Lagler & Goellner, 1941). This means
that the larvae benefit from the parasitism, but the mudpuppy is not affected positively or
negatively. This mussel is significant and unique because it is the only known mussel that
utilizes a non-fish host species (Howard, 1951). The salamander mussel is found in the
Ohio River Basin, Mississippi River Basin, Michigan, and Ontario, Canada (Roe, 2003).
Throughout their range, they are considered endangered, threatened, or a species of
concern. It is suggested that these species, along with other freshwater mussel species, are
declining due to siltation. Listing under the Federal Endangered Species Act is currently
under review, which seeks protection for wherever the mussel is found (Service, 2018).
In the state of Indiana, they are considered a Species of Special Concern (Resources,
2018).
Mussels are important within an ecosystem because of their ability to alter it and
make it beneficial for other organisms ("Importance of Mussels," 2018). Mussels filter
organic matter from the water column and then excreting nutrients for plants,

13
invertebrates, and fish to use. This “cleans” the water through filtration and are believed
to stabilize stream beds by attaching to the bottom of the streams ("Importance of
Mussels," 2018). A healthy mussel population indicates a healthy ecosystem for animals
and people ("Flexing the Mussels of Freshwater Rivers," 2017). A singular mussel can
filter 15 gallons throughout the day (Bennett, 2014). Since the mussels have a significant
effect on the environment’s health, it is important that they are preserved. For the
Salamander Mussel, the mudpuppy is necessary for its survival. The health of the
ecosystem is directly affected by the survival of the mudpuppy.
Identifying if there is a problem within an ecosystem can be difficult for scientists
because there are many unseen variables that can affect it. To help scientists understand
the problems within an ecosystem, species known as bioindicators, keystone species, and
umbrella species are observed to assess the overall health. These classifications are given
to a species based on how they clue scientists in to the ecosystem’s health and the health
of other species utilizing the same habitat (Landres et al., 1988; Noss, 1990).
A bioindicator species is one that reacts when their habitat is altered in some way.
Habitats that humans consider minimally altered may pose a drastic change for the
species that utilize it. A bioindicator species is one that is area sensitive and will decline
if their habitat is altered drastically (Hager, 1998). Survival within a habitat, for a
bioindicator, is dependent on habitat characteristics. If the habitat does not meet the
conditions for survival, the bioindicator species will decline (Freda & Dunson, 1986).
The presence of a bioindicator directly correlates to higher biodiversity within an
ecosystem. This is seen by influencing food webs within an ecosystem. Bioindicators can

14
help regulate the amount of predators within an ecosystem by providing competition for a
food source (Cortwright, 1988; Fauth & Resetarits, 1991).
Amphibians are considered useful bioindicators of terrestrial and aquatic habitats.
When pesticides are introduced to an area, amphibians display direct effects from the
pesticides (Lambert, 1997). This is due to their semi-permeable skin absorbing water with
the pesticides from aquatic and terrestrial habitats. Lambert (1997) observed the results of
a large pesticide spill by monitoring amphibian and reptile populations. Amphibians were
found to have skeletal deformities due to absorbing the pesticide through their skin and
gills as larvae. Freda & Dunson (1986) discuss that negative effects to larval amphibians
and their growth can be detrimental to their survival. Seeing abnormalities and declining
populations notifies researchers of a problem within the ecosystem. Scientists are made
aware of a problem and can address it before the entire ecosystem suffers.
Since amphibians are known as successful bioindicators, mudpuppies can be
considered very important to the health of an ecosystem. Mudpuppies are highly sensitive
to lampricides and pollutants (Minton, 2001). As a bioindicator, their reaction to these
pollutants are beneficial to scientists to ensure the ecosystem is healthy. Problems like
sedimentation, dredging, in-channel dams, and other anthropogenic factors may seem
minimal to humans. Anthropogenic factors can affect the environment worse than is
expected. As an area-sensitive species, mudpuppies can be used to help conservationists
understand the impacts of disturbed areas (Hager, 1998). This is beneficial to the
ecosystem because this early indication can help preserve other organisms in the stream
or lake system.

15
A species that can drastically influence a food web is considered a ‘keystone
species’ (Hager, 1997). This competition allows species lower in the trophic structure, or
food web, to repopulate themselves and maintain a healthy population. Their
conservation is important because their removal could cause drastic changes within an
ecosystem (Hager, 1997). Food webs within an ecosystem are impacted by the presence
of amphibians. Salamander larvae are carnivorous predators that can reduce the
populations of many species lower in the trophic structure. If there are other predatory
species within a habitat, this can be beneficial for an ecosystem. Multiple predators
within an ecosystem facilitates competition resulting in predation that manages the other
predators population (Cortwright, 1988). This helps balance a food web within an
ecosystem and increase biodiversity. Fauth & Resetarits (1991) conducted a study on the
interaction between two predators, the Lesser Siren (Siren intermedia) and the Eastern
Newt (Notophthalmus viridescens). When the two predators were present in the same
habitat, the lowest competitor within the food chain increased. This is because the newts
were eating species that were more competitive towards them.
This example of predator-to-predator predation exemplifies how much a predator
can affect the biodiversity within an ecosystem. As a top tier predator, mudpuppies
contribute to balancing the trophic structure. If a keystone species was removed from the
food web, then it could cause a shift in the trophic structure that could be detrimental to
the ecosystem (Hager, 1997). Mudpuppies have a variable diet based on their age and life
stage. Being an apex predator at all age classes greatly influences the food web (Beattie et
al., 2017). If mudpuppies were removed from the food web, the trophic structure would
experience a large shift because there is no longer competition from them. This species

16
has importance because of its significant role in aquatic food webs and its ability to create
a predatory balance for other species to thrive.
An umbrella species is when the protection and conservation of one species
benefits others that occupy the same space or habitat as them (Wilcox, 1984; Wilcox et
al., 1986). The removal of that species may deplete the populations of other species.
However, the decline of other species is not due to the removal of the umbrella species
unless the umbrella species is a keystone species (Hager, 1997). Hager (1997) observed
groups of species types (mammals, herps, invertebrates, etc.) to determine which groups
would be considered the best umbrella species. She found that large bodied amphibians
and reptiles were second most likely to capture higher proportions of other species
present within their range. Larger bodied species are useful as umbrella species because
they have a large geographic range. The lower trophic levels benefit from the protection
of the large home range (Peterson, 1988; Wilcox, 1984).
Mudpuppies can be considered umbrella species because other species are
dependent on its survival to benefit their own survival. The removal of the mudpuppy
from the ecosystem will dramatically affect the composition of the species within their
habitat. The survival of the Salamander Mussel is completely dependent on the survival
of the mudpuppy. If the mudpuppy ceases to exist in an ecosystem, the mussels have no
way to reproduce (Roe, 2003). Conserving mudpuppies will directly help the mussels
persist. Mudpuppies can also be considered an umbrella species because they are a large-
bodied amphibian. This means that the size of their habitat and how they interact with
other species within a food web directly affects the species composition within an
ecosystem.

17
Habitat Suitability Modeling
Few HSM studies have been conducted on mudpuppies. There are many studies
that have analyzed suitable habitats and occupancy for hellbenders. There is a basic
understanding of what types of habitats adult hellbenders prefer. Research conducted on
suitable habitat for hellbenders was utilized to build a model for mudpuppies since they
have similar habitat parameters. The hellbender studies differ from the models for the
mudpuppy study because they had presence-absence data from localized surveys.
Many studies have been conducted on the status of hellbenders because they are
also experiencing large population declines. Eastern Hellbenders were a candidate
species for listing under the Federal Endangered Species Act. On April 4th, 2019, the
United States Fish and Wildlife Service (USFWS) concluded that the Eastern Hellbender
did not warrant range wide federal protection. The Ozark Hellbender (Cryptobranchus
alleganiensis bishopi) is currently listed as an endangered species under the Federal
Endangered Species Act. The USFWS justified protection of the Eastern Hellbender in
Missouri because of the current threats to the Ozark Hellbender (Service, 2019). These
animals have a similar lifestyle to mudpuppies with needing clear streams and cover
objects. Hellbenders are more sensitive to their environment compared to mudpuppies
and need to have better water quality (Minton, 2001). The home range of mudpuppies
and hellbenders have not been described in detail, but they are limited by suitable habitat
within streams.
Brand & Grant (2017) monitored semi-aquatic salamander species within streams
in Maryland to determine how to monitor long-term research of salamanders. Their
methods focused on monitoring four salamander species for two years. They analyzed the

18
habitat based on substrate, size, and order of the streams. Their results showed that the
position within the stream network was more determinant of occupancy. The size of the
streams and stream features also determined occupancy of salamanders within a stream.
They concluded that research focused on small scale habitat preferences may not be as
effective as the larger scaled research. Monitoring species at a stream network scale is
better for long term conservation and conservation planning.
Land use is commonly used to assess habitats along riverine systems because it is
a good indicator of what might runoff into the streams. Land use and land cover (LULC)
is remotely sensed data that characterizes what the landscape is being used for. Liang,
Fei, Ripy, Blandford & Grossardt (2013) found that natural conditions and land
disturbance were the two primary constraints on suitable habitat for fish in stream
systems.
Pugh, Hutchins, Madritch, Siefferman & Gangloff (2016) conducted a study
analyzing the land-use and physical habitat of hellbenders. They manually surveyed for
hellbenders in North Carolina and recorded presence-absence data. LULC data was used
in their analysis to characterize the habitat. To get more accurate data along the stream,
they ran the process with a 100-meter riparian zone buffer, an area between land and
water interfaces, and catchments along the rivers. In both analyses they generalized the
LULC data to percent forest, urban, agriculture, and grass/shrub.
Their research included LULC data at the catchment and riparian level. Through
their habitat analysis, they found that the local habitat is the best factor (compared to
physical and chemical habitat) to predict hellbender presence and absence. The LULC
data was also a strong predictor of water quality at the catchment and riparian levels.

19
Their results were the first quantitative link to relate remotely sensed LULC data and the
local physical habitat. They suggest that re-forestation and conservation of buffer zones
are the “most promising” strategies for restoration of hellbender habitat.
The research of Bodinof Jachowski, Millspaugh & Hopkins (2016) suggests that
LULC data cannot be the only variable when assessing hellbender occupancy. They
included physiography as a covariate for their model. Forested habitat above a certain
percentage was not included in their analysis because it was assumed suitable habitat for
hellbenders which would, in turn, skew their results. Fish were found to have different
assemblages of species correlate with the physiography and drainage areas (Angermeier
& Winston, 1999). The physiography of the landscape can affect the geology and
topography of a habitat. Bodinof Jachowski et al. (2016) hypothesized that the
hellbenders occurrence within the streams are affected by the physiography. They also
hypothesized that the physiography of the area would make certain reaches of the streams
more susceptible to LULC change.
Their LULC data was analyzed in riparian buffer zones, catchments, and riparian
zones within catchments. Their study locations were chosen by percent forest of 50-94
percent where the remaining percentage of forest was excluded from the study. This was
done because it was assumed that there would not be suitable habitat for the hellbenders
if there was not enough forest cover. The LULC data was then analyzed for percent
urban, percent agricultural, and percent grass/shrub like Pugh et al. (2016).
Their results found that there was a stronger relationship between hellbender
occupancy and physiography than LULC alone. They suggest that the occurrence of
hellbenders may be a legacy affect. This means that there may be a longer time period

20
between land-use and how it affects the stream. The physiography may have an effect of
the land use because it offers different resources for humans regarding agricultural and
urban use. Despite all of this, the relationship between hellbenders and physiography is
unknown. They do believe that physiography influences water quality within streams
which can directly affect hellbenders. They conclude that using LULC data alone was a
poor predictor of hellbender occupancy. They recommend that physiography is included
in the model to better represent the landscape of the riparian and catchment zones. It was
also recommended that eDNA may be an effective way to conduct presence-absence
surveys to understand the distribution of rare species.
A region wide conservation plan was created by Lambert et al. (2016) for the
upper Midwest. Their focus was to look at species that were specifically tied to the
success of their surrounding habitat. The spatial extent of this study included Illinois,
Indiana, Michigan (lower and upper peninsula), and Wisconsin. This report was created
to assist states in making conservation plans for species of concern in their respective
states. The mudpuppy and Salamander Mussel were included in this report. The report
focused on modeling the habitat of the reproductive host of mussels. The results defined
HUC08 watersheds where conservation for freshwater streams would be beneficial.
Mudpuppy data was collected and compiled from all four states. The dataset was
not limited by date observed. There was no systematic approach to surveying
mudpuppies in any of the states included in the study area. The observations used were
presence-only data points. Due to this, they used a maximum entropy method using the
programs MaxEnt and R to analyze their data. They created a 50-meter buffer around the
states to include all the environmental data needed. They used human disturbance indices

21
to see anthropogenic effects on the waterways, made available by the National Fish
Habitat Partnership.
Stream reaches were used for analysis to compensate for the many variables
included in the model. The individual points were linked to the closest stream reach by
snapping with ArcGIS. This was an automated process unless there were many reaches
within the snapping distance (100 meters). If this was the case, the points were manually
moved to the largest stream reach within the snapping distance. This was to minimize the
number of false presence variables within the dataset. Distribution maps of the presence
of stream species were represented by a HUC12 scale. The HUC08 basins were used to
describe suitable areas because the preservation of a stream requires conservationists to
look at the larger picture. Watersheds and basins are critical to the habitat quality of a
stream.
Lambert et al. (2016) encourages others to do analysis at a fine scale using
HUC10, HUC12, or stream reaches. If this is done, they recommend adjusting their
methods to better suit the analysis. Their research identifies areas within Indiana that are
beneficial for freshwater mussel conservation. This conservation will directly impact
mudpuppy population due to their similar habitat needs. They identified the Lower
Wabash, Lower White, Highland - Pigeon, Tippecanoe, Middle Wabash-Deer, and
Flotrack-Haw sub-basins (HUC08) as areas for rich conservation potential. However,
there is an error in the names of one of the sub-basins, Flotrack-Haw is presumably meant
to be Flatrock-Haw. There are no basins in Indiana designated as “Flotrack-Haw”
(Survey, 2011). Other watersheds that may be of interest are the Middle Wabash-

22
Busseron and the Lower Ohio-Little Pigeon sub-basins due to being peripheral to the
other watersheds (Lambert et al., 2016).
Sutherland, Stedman, Mifsud, Stapleton, Roseman et al. (2016) conducted an
eDNA study on the Detroit River and analyzed habitat at a riparian scale using LULC.
Water samples were taken to test eDNA of mudpuppies within the Detroit River to test if
eDNA was an effective monitoring tool. Their eDNA results were inconclusive. Riparian
zones were classified as a 100-meter buffer around the tributaries. The dataset for
mudpuppies was procured from bycatch from fisheries. They found that mudpuppy
occupancy was higher in upstream with riparian zones that had a higher percentage of
forest cover and a lower percentage of development. They recommend that conservation
efforts be focused on reforesting riparian zones to maintain suitable habitat for
mudpuppies.
Collins (2017) conducted her thesis on utilizing eDNA as an effective tool for
habitat modeling. Manual surveys and eDNA samples were taken at 10 sites across
Southeast Ohio. The selected sites were based off historic records of mudpuppies and
streams that were considered “good quality”. It was found that the eDNA detected
mudpuppy presence in streams that yielded no individuals in their manual surveys and
had no prior record of mudpuppies in the stream. This shows that eDNA data can help to
find cryptic species in a stream system. Collins suggests that pairing eDNA and habitat
modeling would help create conservation plans and further help the species.
MaxEnt is an application that is used for species distribution modeling based on
presence-only data points and their relationship to environmental variables (Phillips,
Anderson & Schapire, 2006). MaxEnt randomly selects 10,000 (default) background

23
points from the specified environmental variables (Elith, Phillips, Hastie, Dudík, Chee et
al., 2011). These background points act as pseudo-absences since there are no absence
records within the dataset (Liu, Newell & White, 2016). The absences are needed in the
model to predict the probability of presence (Merow et al., 2013). These points are used
to determine the density of covariates in the landscape and then relate them to how dense
they are at the point locations of the species. The model outputs the results that satisfy the
constraints of the species (Elith et al., 2011). The MaxEnt output is scale-independent and
gives the user a range of zero to one (0-1) to compare different models outside of units
(Phillips, Anderson, Dudík, Schapire & Blair, 2017).
Using the default settings of MaxEnt can be problematic because it can create an
overfit model. This means that the model output corresponds too closely to the data,
which leads to biased sampling (Merow et al., 2013; Muscarella, Galante, Soley‐Guardia,
Boria, Kass et al., 2014). The default settings of MaxEnt determines what variables to
include based on how many occurrence points are within the dataset. This is done by
regularization where the variables that are not contributing as much to the model are
penalized. Users can adjust the level of regularization with the regularization multiplier
based on what is needed for their study. Changing the default settings of MaxEnt based
on species-specific data can greatly improve model performance (Muscarella et al.,
2014). However, doing this manually is time consuming because the user is running
MaxEnt for each regularization multiplier they would like to test.
To optimize the settings of MaxEnt, Muscarella et al. (2014) developed an R-
package called ENMeval. This package utilizes six methods for partitioning data and
creating multiple models based on settings defined by the user. The multiple outputs

24
allow the user to compare all the models to help them choose optimal settings for
MaxEnt. Changing the default settings of MaxEnt helps to reduce overfitting and spatial
autocorrelation. ENMeval is designed to quickly and efficiently determine what MaxEnt
settings are best species-specific habitat suitability modeling.

25
Methods
The Upper Muscatatuck River Watershed, also known as the Muscatatuck
Watershed, was identified by Hoffman et al. (2014) as an area for conservation need.
This was based off their manual surveys and statewide data compilation. Lambert et al.
(2016) identified watersheds with conservation needs through geospatial analysis from
greatest need to lowest need: Lower Wabash, Highland-Pigeon, Tippecanoe, Lower
White, Middle Wabash-Deer, Flatrock-Haw, Middle Wabash-Busseron, and Lower Ohio-
Little Pigeon (HUC08). It is important to note that Lake Maxinkuckee, the location of the
first systematic survey of mudpuppies in Indiana, is within the Tippecanoe watershed.
Since these nine HUC08 sub-basins have been previously identified as areas of
conservation need for mudpuppies, it is hypothesized that these areas will appear as
suitable habitat through this model (Figure 4). Analysis was done on a HUC10 scale as
recommended by Lambert et al. (2016) (Table 1). Analysis at this scale provides
comparison from the results of Lambert et al. (2016) that were analyzed on a HUC12
scale. Ohio was included in the analysis for suitable habitat of mudpuppies. Data from
Ohio, along with Salamander Mussel data from Indiana, was used to bolster the dataset
for a more accurate model.
The areas of suitable habitat were compared to the regions characterized by the
IDNR in their SWAP report in 2015 (Figure 5). Table 1 shows what hypothesized
watersheds are in each of the SWAP regions. This recommendation to the IDNR is to
help them better understand mudpuppy distribution and possible areas of presence. Even
though they did not include geospatial analysis in their report, it can still be a useful
resource for future planning.

26
The eDNA results from Indiana were used as a test dataset for this model. The
eDNA data is a presence-absence monitoring tool because the DNA is either present in
the sample or absent. It is hypothesized that the test dataset will mirror the results of the
model created with the presence only records. It is important to note that the accuracy of
using eDNA as a monitoring method has not been established (Sutherland et al., 2016).
However, there was success with eDNA sampling for mudpuppies in Ohio (Collins,
2017).
Spatial Extent
The spatial extent of this research is the Midwest region of the United States
utilizing data from Indiana and Ohio. Spatial data for the two states was obtained from
the United States Department of Agriculture (USDA) and Natural Resources
Conservation Service (NRCS) National Geospatial Center of Excellence. A 1 km buffer
around Indiana and Ohio was created to be used for analysis. This was done to include
land data past the borders to accommodate points along the borders of the states.
Occurrence Data
Occurrence data from both states was compiled and organized. Each data source
had a variable amount of data based on their state’s individual conservation plans (Table
2). Data from these sources were sorted through to remove duplicate data points. Data
points prior to 1990 were not included due to major land changes around that time (Liang
et al., 2013; McCallen, 2017) (Table 3). This point dataset differs from the dataset used in
Lambert et al. (2016). They did not mention exclusion of any data points in their analysis.
Any Salamander Mussel data that was the same exact point used in the eDNA data was

27
removed to exclude bias in the dataset. Only 100 occurrence records were used in this
analysis.
Occurrences for this analysis were partitioned using the “block method” with
ENMEval. The “block method” was used to reduce spatial auto correlation of the
occurrence data. Partitioning the data with this method reduces redundancy and biased
sampling (Muscarella et al., 2014; Muscarella, Krass & Galante, 2018). The “block
method” is where points are partitioned spatially into four “bins” of equal numbers
(Muscarella et al., 2018). This constrained the dataset to only 100 occurrences. There
were 25 points organized in each bin region that defined northern Indiana (bin 1),
southern Indiana (bin 2), southern Ohio (bin 3), and northern Ohio (bin 4) (Figure 6). The
points in the northern Ohio region (bin 4) were spatially thinned by 1.2 kilometers (km)
in the R-package Wallace. Points in this region were thinned due to the high density of
occurrences, while the other regions did not exhibit high density of points. This distance
was chosen because mudpuppies do not have a large home range and exhibit site fidelity
(Shoop & Gunning, 1967). Even after the spatial thinning, there were still six (6) points
that needed to be removed from the dataset to have an equal number of occurrences in
each bin. To accommodate this, points were manually removed from the data set based
on shortest distance to surrounding points.
Data of mudpuppies in Indiana was obtained from the Indiana Natural Heritage
Database and personal contacts. The Indiana Natural Heritage Database’s data use
agreement states:
This report includes data provided by the Indiana Natural Heritage Data
Center. These data are not based on a comprehensive inventory of the
State. The lack of data for any geographic area shall not be construed to
me that no significant natural features are present. The State of Indiana is

28
not responsible for any inaccuracies in the data and does not necessarily
endorse any interpretations or products derived from the data. (Indiana
Natural Heritage Data Center, 2017)
Data from mudpuppy occurrences during hellbender surveys in Indiana was obtained
from the Williams’ Lab at Purdue University. The eDNA dataset for Indiana was
analyzed by Obed Hernandez-Gomez by using amplicon sequencing on an Illumina
machine which differs from qPCR analysis. The samples were analyzed twice and were
considered present if the results were positive on either analysis (Hernandez-Gomez,
2018b).
The Department of Natural Resources equivalent for Ohio was contacted for
mudpuppy point data. Their partner, The Ohio State University, contributed the available
point data for Ohio. Greg Lipps (2018) from The Ohio State University warned that the
Ohio database may have some biases due to concentrated survey efforts. Efforts for
mudpuppy monitoring started in the 1980’s when hellbender monitoring efforts began.
There are more mudpuppy records for the Ohio dataset from mass die offs from
lampricide. These datapoints have not yet been received and processed by Greg Lipps
and are not included in this dataset. He notes that mudpuppies are more common in the
eastern side of the state than the western portion.
HerpMapper (herpmapper.org) was contacted for data points for Indiana and
Ohio. HerpMapper was the only online database utilized because it is the only one that
requires accurate point location. This location is obtained through phones by the satellite
connection and can only be uploaded if there is a photo voucher. Scientists and citizen
scientists can also input data manually but need to have accurate location data to do so.

29
The data submitted to HerpMapper has the highest rate of acceptance of vouchers from
museums compared to other online databases (Lipps, 2017).
The data was snapped to the nearest stream reach within 50 meters. If there were
multiple stream reaches, the point was manually moved to the closest stream reach. Point
data will not be released in this report due to the species risk. The data was represented as
watersheds, landscapes, and counties. This is to protect the species from poaching and
persecution from the public.
Environmental Variables
Variables for this model were determined by life history, anthropogenic factors,
and variables used in other studies. The variables for this model are those used by
Bodinof Jachowski et al. (2016), Pugh et al. (2016), and Lambert et al. (2016). Variables
from field surveys (eg. riffle, substrate, pool size, visibility) was excluded because they
cannot be obtained for this study. Other variables are excluded because they do not
pertain to mudpuppy life history and habitat parameters. Mudpuppies are less sensitive to
their habitat than hellbenders and can tolerate slightly poorer conditions. However, many
of the habitat parameters for hellbenders coincide with those needed for mudpuppies.
The variables selected included high and low development, agriculture, distance to forest,
tree canopy cover, road density, and stream order. The jackknife methods in MaxEnt was
used to determine which variables were contributing to the model.
The data for the environmental variables was obtained from the USDA/NRCS
National Geospatial Center for Excellence, Department of Fisheries and Wildlife at
Michigan State University, and the Multi-Resolution Land Characteristic Consortium
(MRLC). The LULC data was categorized into three groups: high development

30
(highdev), low development (lowdev), and agriculture (agr) (Table 4). The LULC data
was aggregated on a HUC10 scale. Meaning, the total amount of each LULC variable
was taken and used at a HUC10 scale.
In Bodinof Jachowski et al. (2016), they used medium and high intensity
development as their indicator for human development. Lambert et al. (2016) used
developed open space and low intensity development. The difference between the
development variables is that the “highdev” variable is buildings and structures that are
completed. The “lowdev” variable is areas that are being prepared for or in the process of
being completed. Both variables are being used in this study because both studies showed
that human development had a negative impact on hellbenders. Agriculture as a variable
is warranted because siltation and chemical pollutants from runoff impacts the habitat of
mudpuppies. Nesting behavior and reproduction requires clearer portions of streams,
rivers, and lakes. Agriculture can greatly impact the water quality which limits
reproduction, recruitment, and general survival (Matson, 1990, 2005; Minton, 2001).
The stream data was obtained from National Hydrography Dataset Plus Version 2
(NHDPlusV2) dataset from Horizon Systems. This dataset included waterways that were
not necessary for this analysis. Connector, pipeline, and underground conduit waterways
were removed. Mudpuppies inhabit streams and ditches and do not exclusively live in
these man-made structures. These structures carry water through pipes and underground
where mudpuppies cannot access. Therefore, it was determined that they would not be
necessary for this study. The stream data being used for this analysis is Strahler’s Stream
Order. The streamlines were too small for the programs to be able to pick up the presence
of the streams. To accommodate this, the stream data was expanded by one (1) cell in
31
ArcMap to help with the analysis. Liang et al. (2013) found that headwater streams with
Strahler Rank 2 and 3 had better habitat quality. They also found that the quality of
habitat decreased the larger the stream became. This variable applies to mudpuppies
because they require relatively clean bodies of water to survive.
Physiography was considered this study because Bodinof Jachowski et al. (2016)
state that using LULC alone is not a reliable predictor when physiography was not
included. In their study, the study area was limited to the western part of Virginia. This
analysis covers a much larger area. Their study utilized physiographic provinces to
represent the physiography in the area. There is concern because there are three
physiographic provinces within this study area and there is mudpuppy presence in all
three. To understand the effects of physiography across a large area, the variables were
analyzed to test their impact on suitable habitat.
Road density was calculated by finding the number of roads within a HUC10
area. The data provided by the National Fish Habitat Database (NFHD) was represented
by catchments and the road density within the catchments. Lambert et al. (2016) used
road density in their study to measure the impact humans have on the environment.
Manipulation of the data was necessary to be able to calculate the density of roads within
the HUC10 area. Road density is useful in this analysis because it represents how humans
are directly interacting with riverine systems. Many studies have documented how there
is a decline in stream quality with the introduction of roads (Trombulak & Frissell, 2000).
Trombulak & Frissell (2000) suggest that roads can be used as indicators for how land-
use in an area can change. This is because many times roads are built for logging,
agriculture, mining, and other trades that can negatively affect stream communities.

32
Liang et al. (2013) concluded from their study on modeling habitat for habitat sensitive
fish that roads negatively impacted stream quality and fish habitat.
Tree canopy cover and distance to forest were included to have a better
representation of the landscape. Tree canopy cover is represented as a percentage of
canopy cover per raster cell. Distance to forest was calculated within ArcMap. The term
“forest” in this study is characterized as deciduous, evergreen, and mixed forest as
defined in the LULC dataset. Forest parcels greater than 0.25 U.S. acres were considered
as a suitable forest size. This size was determined because 0.25 U.S. acres is the
recommended minimum size for riparian management zones (Agriculture). The Euclidian
distance was calculated and is represented as squares measuring 30 sq. meters. The
approximate distance to forest can be calculated by multiplying the value within the cell
by 30.
Experimental Design
Since the mudpuppy is a completely aquatic species, background points were
limited to aquatic habitats. Limiting background points to places the species can persist is
recommended by Merow et al. (2013) when the default settings for background selection
are used. Limiting the background point selection to streams lends to a better fit model
because mudpuppies are not found outside of aquatic systems. Buffers around the
occurrence points were created at a 5 km and 10 km distance. These buffers were used to
generate the 10,000 background points. MaxEnt was ran twice (once with 5 km and once
10 km buffer) with all variables. It was determined that the 5km buffer around points
would be used because MaxEnt was able to generate the 10,000 background points. This

33
was done using the jackknife feature to determine how much the variables contributed to
the model. The jackknife analysis was done with four (4) replicates and cross-validated.
The jackknife test ran in MaxEnt showed that high and low development and road
density were not considered important for modeling suitable habitat of mudpuppies and
were therefore not included in the rest of the modeling. Variables used for the modeling
were agriculture, stream order, tree canopy cover, and distance to forest. ENMeval was
used to determine the optimal settings for MaxEnt. The variables were put into the R-
code of ENMeval as well as the occurrence points with their specified bin number.
The optimal settings were selected as the lowest Akaike Information Criterion
corrected (AICc) value. The AICc is correcting for small sample sizes to best depict
“goodness-of-fit and complexity” (Muscarella et al., 2014). This is the measure used
because the small sample size of this dataset and AICc value reported lowest omission
rates when compared to the default models of MaxEnt (Muscarella et al., 2014). This
leads to the least overfit model output. The optimized settings for MaxEnt are shown in
Table 5. The ΔAICc is included to show that the optimized settings are considered to
have “substantial support” because the ΔAICc is less than the value of two (2).
Results were output as ASCII files which were then converted into raster files
through ESRI ArcMap. The results were depicted as the stream system on a scale of 0 to
1. The threshold of maximizing the sum of sensitivity and specificity (mSSS) was used to
output a binary habitat map. This threshold is considered a more conservative threshold
to use and is considered valid with presence-only modeling (Liu et al., 2016). To
determine this threshold, the data was run though maxent again with the ENMeval

34
optimized settings and a cross validation of 4 (four). The average “maximum training
sensitivity plus sensitivity Cloglog threshold” was the value used for the mSSS threshold.
The output of the model gave values for each pixel of the stream projection. To
protect the localities of the species, the output values of the streams were averaged based
on a HUC12 sub-basin level. Any HUC12 sub-basin with a value above the mSSS
threshold was considered suitable habitat. The “average mSSS” of the HUC12 sub-basins
was calculated by totaling all pixels within the basin and then dividing by the total
amount of pixels above the mSSS threshold (# of pixels above mSSS/total pixels). This
calculation was justified because it generalizes the data for the HUC12 sub-basins.
Taking the “average mSSS” also creates a way to compare each sub-basin. Since each
sub-basin has different numbers of pixels within them, the average is needed to
understand the landscape within the basin.
Limitations
It is important to note that this analysis was limited to rivers and stream data. This
is because the data points that were available were in streams and rivers. It is recognized
that mudpuppies live in reservoirs, lakes, and other types of wetlands. However, since the
data only represented those that lived in streams and rivers, this analysis only modeled
suitable stream and river habitat.
One of the major limitations to this project was the sample size of mudpuppies
and salamander mussels for Indiana. If there were more systematic surveys in the past,
there would more data to better model suitable habitat. However, the lack of datapoints is
why this project is necessary. Another limitation was how Kentucky had their data stored
in their database. They did not have their mudpuppy data as point locations. Kentucky

35
was not able to be included in the model because of this. It would have been useful to
have Kentucky included in this model because the Ohio River Valley is historically
known for hellbender and mudpuppy populations. This would have been beneficial
because it could help characterize habitat in Indiana along the Ohio River.
Illinois and Michigan where initially included in this project. However, there were
problems with the study area size and the limitations of the programs being used to
analyze the data. It was decided that only two states should be analyzed for mudpuppy
habitat. Illinois was excluded because Ohio had more data points than Illinois. Ohio was
chosen over Michigan because it spatially represents the same latitude range as Indiana. It
was felt that Ohio would be a better representation Indiana’s landscape because of this.
This analysis had to be coded to work with the R-package ENMeval. Other programs,
like MaxEnt and the R-package Wallace, did not work for this analysis because of the
large study area and resulting file sizes.
Another limiting factor was that we could not follow the methods of Bodinof
Jachowski et al. (2016) and Pugh et al. (2016) due to the size of the study area. Their
analysis was on a catchment and catchment-riparian zone. If we had analyzed on this
level, we would get more detailed results. However, the sizes of the files would be very
large, and we could not get enough computer processing power to create the catchment
and catchment-riparian zones.
We were limited in the experimental design of this project by not being able to
use unmanned aerial vehicles (UAVs). The UAVs were going to be used to characterize
the aquatic habitat where mudpuppies were found. This was limited due to funding and
an unusually warm February in 2018 that caused major flooding across the state.

36
Results
The MaxEnt model had an area under the curve (AUC) of 0.825 (Figure 7). The
AUC is the probability that the model correctly ranked the presence locality higher than a
random background point (Radosavljevic & Anderson, 2014). AUC values closer to one
(1) are considered better or more suitable models. Suitable habitat was found for
mudpuppies in stream orders of 4 to 6. Tree canopy cover was the most suitable at 30 to
40% and then decreased as the percentage of canopy cover increased. As the distance
from the forest increased, suitable habitat decreased. This was also seen with percent
agriculture. As the percentage of agriculture increased, suitable habitat decreased (Figure
8).
The MaxEnt model showed that stream order was the variable that contributed to
the model the most or had the “highest gain” (Figure 9). Stream order is considered the
most useful variable used by itself. Removing it from the model would decrease the gain
greatly. The mSSS threshold was 0.5027. Any HUC12 with an average mSSS value
above the mSSS was considered suitable habitat (Figure 10). The interval determination
was decided by a general assumption of how agencies could best interpret the data.
Intervals were created based on the percentage of habitat above the mSSS threshold.
These intervals were classified as No Value (0), Very Low (0.000001-10%), Low (10-
20%), Medium (20-50%), and High (50-100%). It was assumed that agencies would want
to survey the areas with the most amount of suitable habitat to maximize their resources.
To determine the most suitable HUC08 sub-basins, the HUC12 areas were
assigned the values of 0 to 4 based off the intervals of No Value to High. The values were
counted and divided by the total number of HUC12 sub-watersheds to get the percentage

37
of sub-watershed classes within the HUC08 sub-basin. The values of 3 and 4 (medium
and high) were totaled together. Medium and High habitat was chosen because this would
be the most suitable area for agencies to focus their resources surveying for mudpuppies.
The top ten (10) HUC08 sub-basins of medium and high habitat from greatest to least
suitability were Lower East Fork White, Chicago, St. Joseph, Upper Wabash, St. Mary’s,
Wildcat, Salamonie, Lower White, Patoka, and Auglaize (Figure 11). The Lower White
HUC08 sub-basin was the only sub-basin that was in the hypothesized areas.
The top ten (10) counties were also determined this using these methods: Jackson,
Monroe, Lawrence, Martin, Dubois, Wabash, Huntington, Floyd, Davies, and LaGrange
(Figure 12). It is important to note that this method of analysis is based on the presence of
medium and high areas of suitable habitat. It does not account for the HUC12 area of
medium and high area within the county. The counties of Jackson, Wabash, Huntington,
and Daviess are counties that do not have county records of mudpuppies. These four
counties are within the HUC08 areas of most suitable habitat. There are 19 counties
within the HUC08 regions that do not have records of mudpuppies (Table 6).
Relating suitable habitat to the eDNA results is a qualitative analysis. The eDNA
results had showed few positive results. Positive results were found in the northeastern,
west central, and southeastern areas of the state (Figure 13). The southern positives in
Clark County along the Ohio River were the control samples and are not being
considered in the qualitative analysis. None of the positive results were in the predicted
area of suitable habitat. Many of the results were negative DNA samples. These samples
were throughout areas that were not considered the most suitable habitat.

38
Discussion
Review of Variables and Analysis
Through analysis, it was found that physiography was not a predicting variable
when used across a large landscape. This is likely because there is not much variability of
physiographic provinces and there was presence in each of the provinces. Bodinof
Jachowski et al. (2016) states that ignoring physiography and only using landcover with
presence-only modeling would underestimate the occupancy of the Eastern Hellbender.
However, it is seen that across a large landscape, physiography is not a determining
factor of suitable habitat for mudpuppies.
Stream order was the variable that contributed the most to the model. Streams that
were Strahler’s Stream Order of four (4) to six (6) were considered the best suitable
habitat. Liang et al. (2013) as well as Sutherland, Meyer & Gardiner (2002) suggested
that lower order streams (2 to 3) were the most suitable stream orders for fish species that
need high quality habitat for breeding. Their studies also suggest that higher stream
orders would have more sedimentation that would reduce suitable breeding habitat.
Murphy, Hawkins & Anderson (1981) found that salamanders in the streams were more
abundant in higher gradient streams (faster moving streams). The biomass of salamanders
was also inversely related to the amount of sediment within the streams.
Mudpuppies may persist in these lower orders of streams, but the occurrence data
is presumably only adult individuals. Adult individuals can move to other habitat that is
not suitable for breeding. The mudpuppy is also a species that matures at a slower rate
than other salamanders and fishes (Matson, 2005; Minton, 2001). Since the mudpuppy
occurrence data did not specify the estimated reproductive age and is exclusively adult

39
individuals this could be a reasoning why the higher order streams with potentially lower
water quality were the most suitable.
The high contribution of stream order could also be due to bias from the samples.
The samples from Indiana had a distribution of stream orders from one to six with
somewhat even distribution across all values. The Ohio dataset also had this distribution
of stream orders, but most were stream orders four and five. These were mainly seen in
the northeastern portion of the state (bin 4). The datapoints in the northeastern part of the
state were primarily collected during hellbender surveys (Lipps, 2018). Since MaxEnt
utilizes presence-only datasets, it is important that the samples are unbiased. Most of the
mudpuppy data points are reports from citizen scientists. This could also show a bias to
higher order streams because they could be frequented more by the public than lower
order streams.
Elith et al. (2011) suggests that the presence-only dataset be “cleaned” for
duplicates and errors. They also suggest that biases in the dataset be mitigated by using
background data with similar biases. This analysis in MaxEnt was believed to have
reduced bias and spatial autocorrelation by using the bin method in ENMeval to optimize
maxent settings (Muscarella et al., 2014; Muscarella et al., 2018). The points were also
thinned in the northeastern portion of Ohio to reduce bias. To determine if there is a bias
with stream order value, future analysis will need to be done. This would include running
analysis on Indiana and Ohio separately to determine if the most suitable stream orders
are the same values between the two states.
Tree canopy cover, distance to forest, and percentage of agriculture did not
contribute as much to the model as stream order. The tree canopy cover was the most

40
suitable in the 30 to 40% range. The suitability of forest then decreased after 40%. Other
studies characterizing occurrence of hellbenders (e.g. Bodinof Jachowski et al., 2016;
Pugh et al., 2016) have assumed that higher levels of forest cover within the catchment
would be considered suitable and, in turn, bias their results if included. Results of this
model show that higher percentages of canopy cover are not favorable for suitable
habitat. In Murphy et al. (1981), they concluded that streams with a more open canopy
had higher rates of microbial respiration, species variability, and density of drifting
invertebrates. These variables are indicative of a higher water quality. Their study shows
that there needs to be some areas of less canopy cover to have better water quality. This
could explain why there was a decrease in suitable habitat after 40% of canopy cover.
Tree canopy cover data was clipped to the streams. Doing this did not represent
what the canopy cover was in the surrounding landscape. To see if the tree canopy cover
is accurately representing suitable habitat it has been suggested that there be future
analysis on this variable. Future analysis could include analyzing tree canopy cover
within a moving window. This would help to characterize the percent of canopy cover in
the surrounding landscape. The hope of this further analysis is to support or reject that
suitable canopy cover is between 30 and 40% and looking at canopy cover at riverine
level is acceptable.
As the distance from the forest patches increased, suitable habitat decreased.
When mitigating riparian zones, most concentrate on the width of the riparian zone. This
is to ensure that there is enough distance between streams and areas of possible runoff
and pollution. Very rarely are length and area of riparian zones considered for mitigation
and management. Jones III, Helfman, Harper & Bolstad (1999) studied the relationship of

41
riparian forest land length and area in comparison to fish assemblages. They found that
the length of riparian zone affected habitat diversity, fish abundance, and sedimentation.
A longer deforested area resulted in more sediment tolerant and invasive species. Streams
with higher disturbances in the surrounding land lead to a decrease in fish assemblages
that need low sedimentation for breeding (Jones III et al., 1999; Sutherland et al., 2002).
Jones III et al. (1999) concludes that length and area of riparian zones need to be
emphasized in conservation strategies and mitigation. Much of sedimentation is due to
erosion and concentrating on length of forest patch sizes will help stabilize banks and
reduce the amount of erosion.
Distance to forest is a good indicator of habitat quality and suitability because it
represents how the landscape interacts with aquatic habitats. Agriculture has also been a
well-acknowledged indicator of suitable habitat (eg. Bodinof-Jachowski et al. 2016, Pugh
et al. 2016, Lambert et al. 2016). Concentrating on forest patch length along a stream
system can reduce the amount of sedimentation and improve water quality. Riparian
zones were not characterized within this analysis due to the processing power of the
computers. However, the distance to forest variable can characterize that forested areas
closer to stream systems are beneficial when determining suitable habitat for
mudpuppies. It is important to note that Jones III et al. (1999) heavily emphasized that
forest clearing and agriculture are serious disturbances to riverine systems. The loss of
forested areas could pose a threat to the persistence of the species, especially in Indiana
where agriculture and logging are exports.
To better this model, there is discussion of what other relevant variables to
include to ensure there is not bias from the stream order variable. Variables like historical

42
land-use, distance from agriculture, distance from human development, and road
variables have been considered. However, there was not enough time with this analysis to
include them in the model. Historical land use, when applied to HSMs of fish species,
proved to be less indicative of suitable habitat compared to recent LULC data. Use of this
variable will need to be analyzed even further to determine if it is relevant within this
study. All these variables, as well as comparing Indiana and Ohio, could potentially result
in a better model for suitable habitat of the Common Mudpuppy. It is believed that this
model best represents suitable habitat for the Common Mudpuppy with the best available
data at this time.
Conclusions and Recommendations
Suitable habitat within the state of Indiana was found in the southcentral,
southwest, and the northeast region of the state. The Lower White sub-basin is the only
HUC08 sub-basin that was a hypothesized areas of conservation concern. The Lower
White, Lower East Fork White, and Patoka are all sub-basins that are bordered by
HUC08 sub-basins the hypothesized basins identified by Lambert et al. (2016). The four
(4) basins identified by Lambert et al. (2016) may not have been identified as suitable
habitat because they are located on the border of Indiana and Illinois. Since Illinois was
not included in the analysis, the bordering HUC08 sub-basins may not be representative
of the habitat in the entire sub-basin. However, it is believed that the identified suitable
habitat is reflective of what is present in that portion of the sub-basin. Many of the
counties that do not have previous records of mudpuppies are also located within the
bordering sub-basins. It is recommended that the southwest portion of the state

43
coordinate with Illinois for conservation since many of the watersheds are located in both
Indiana and Illinois.
The northeastern part of the state has multiple HUC08 sub-basins that are
considered the most suitable habitat. The cluster of sub-basins Auglaize, Salamonie,
Upper Wabash, and Wildcat have many counties without previous records of
mudpuppies. The sub-basin between these four and St. Joseph is not predicted as most
suitable habitat. However, the eDNA samples taken in that area resulted in a positive
record for mudpuppies. This means that there may be mudpuppies in an area that was not
previously recorded. It is recommended that agencies spend resources in the northeastern
part of the state. This is because there is a large area of predicted suitable habitat and
positive eDNA results.
The HUC08 sub-basins fit loosely into the SWAP planning regions. The planning
regions where there were the most sub-basins were the Great Lakes, Valleys and Hills,
Interior Plateau. Creating conservation efforts for these planning regions should include
protection of waterways where mudpuppies could occupy. They should also include ways
to protect areas where they have been or will be found. This is to ensure that their
conservation is proactive. Even if there is not an effort to actively survey for mudpuppies,
it is important to be able to react to possible individuals being found. Being proactive will
help with future conservation efforts when they are able to be funded and acted upon.
Nine (9) of the top ten (10) counties identified mirror the identified HUC08 sub-
basins. Floyd county is the only county that is not found within the most suitable HUC08
sub-basins. There are 19 counties within the identified HUC08 sub-basins without
records of mudpuppies. It is recommended that agencies utilize their resources in these

44
counties within the medium to high HUC12 sub-watersheds. The Muscatatuck sub-basin
was not identified as best suitable habitat in this analysis. However, there are many
known mudpuppy records and eDNA results that shows their presence within the sub-
basin. Surveying this area may be considered useful to agencies because it is known that
they are present in this sub-basin and it has been identified as an area for conservation by
other studies (Hoffman et al., 2014). It is recommended to conduct more eDNA surveys
to find possible mudpuppy sites.
Results considered suitable habitat from MaxEnt were over the mSSS threshold
(0.5027). This threshold was used because of the large area surveyed within the
landscape. Some do not recommend thresholding because population density and
prevalence of a species maybe unknown (Merow et al., 2013). Background points are not
equivalent to absences and that a threshold may be reflective of the researchers’
assumptions and not what is represented in the species. Thresholds were deemed useful in
this study because there is little known about where the species are. The mSSS threshold
is used because the absolute best suitable habitat is desired to have any sort of idea of
where to start looking for mudpuppies. The mSSS threshold selection is one of the best
thresholding methods compared to others. It is also the only thresholding method that
produces the most similar threshold value in presence-only and presence-absence studies
(Liu et al., 2016).

45
Appendix A: Tables
HUC08 Sub-Basin HUC10 Watersheds HUC12 Sub-
Watersheds
SWAP Planning
Region
Flatrock – Haw 16 48 Corn Belt
Highland – Pigeon 18 47 Valleys and Hills
Lower Ohio – Little
Pigeon 23 68
Interior Plateau
Valleys and Hills
Lower Wabash 23 58 Valleys and Hills
Lower White 33 124 Interior Plateau
Valleys and Hills
Middle Wabash –
Busseron 40 94
Corn Belt
Valleys and Hills
Middle Wabash - Deer 15 53 Corn Belt
Muscatatuck 22 73 Drift Plains
Tippecanoe 34 137 Corn Belt
Table 1. HUC08 sub-basins with the total count of HUC10 and HUC12 units in Indiana. The
corresponding Indiana SWAP Regions are listed for each HUC08 sub-basin. SWAP regions
“Kankakee” and “Great Lakes” are not represented in the hypothesized areas.
Source State Species
HerpMapper IN, OH Necturus m. maculosus
Indiana Natural Heritage
Database IN
Necturus m. maculosus,
Simpsonaias ambigua
Megan Gramhofer IN Necturus m. maculosus
Nathan Engbrecht (IDNR) IN Necturus m. maculosus
Obed Hernandez-Gomez IN Necturus m. maculosus
The Ohio State University OH Necturus m. maculosus
Williams’ Lab – Purdue
University IN Necturus m. maculosus
Table 2. Source of Common Mudpuppy and Salamander Mussel datapoints with the state the data
represented.
State Number of Records
Indiana (Necturus m. maculosus) 34
Indiana (Simpsonaias ambigua) 16
Ohio 50
TOTAL 100
Table 3. Total number of records of Common Mudpuppy and Salamander Mussel after 1990 and
1.2 km thinning for northern Ohio. The total number of records in the dataset is 100 datapoints.
The Salamander Mussel data was organized so it would not include duplicate data with the eDNA
data.

46
Table 4. Variables used for mudpuppy habitat modeling. Descriptions of seven predictor variables
obtained from MRLC, NHDPlusV2, USDA, United States Department of the Interior (USDOI),
and NFHD.
Feature Classes Regularization Multiplier AICc ΔAICc
L 1 3224.245 102.7147
LQ 1 3121.531 0
H 1 3170.898 49.36765
L 2 3225.994 104.4632
LQ 2 3121.736 0.205394
H 2 3163.925 42.39444
L 3 3227.819 106.2883
LQ 3 3124.859 3.328127
H 3 3165.919 44.38856
L 4 3229.7 108.1694
LQ 4 3128.402 6.871833
H 4 3166.094 44.56355
L 5 3231.631 110.1009
LQ 5 3132.338 10.8076
H 5 3171.745 50.21432
Table 5. ENMeval results for the optimal settings of MaxEnt. The AICc highlighted was
the lowest value of all the outputs. The “feature classes” and the regularization multiplier
are the settings that were changed in the MaxEnt program. The ΔAICc is below the value
of 2, showing that these settings have substantial support.
Variable Name Variable Type Description Source
lowdev Land Use – Land
Cover
% of land developed open
space and low intensity MRLC
highdev Land Use – Land
Cover
% of land developed
medium and high intensity MRLC
agr Land Use – Land
Cover
% of land pasture, cultivated
crop, and grassland MRLC
str_order Hydrology Strahler’s Stream Order NHDPlusV2
physiography Geology
Proportion of catchment
within a specific
physiographic province
USDOI
road_dens Disturbance Density of roads within
HUC10 NFHD, USDA
canopy_cover Landscape Percent of canopy cover MRLC
dist_forest Land Use – Land
Cover
Distance from forest with
area > 0.25 acres MRLC

47
HUC08 Region County Number of Top 10 Counties
Lower East Fork White Daviess, Jackson, Orange,
Pike 5
Chicago N/A N/A
St. Joseph St. Joseph 1
Upper Wabash
Adams, Allen, Grant,
Howard, Huntington, Jay,
Miami, Tipton, Wabash,
Wells
2
St. Mary’s Adams, Allen N/A
Wildcat Grant, Howard, Tipton, N/A
Salamonie Blackford, Grant, Huntington,
Jay, Wabash, Wells 2
Lower White Gibson, Orange, Pike 3
Patoka Daviess, Gibson, Owen, Pike,
Sullivan 1
Auglaize Adams, Allen N/A
Table 6. Top ten HUC08 sub-basins counties without records of mudpuppies. The Upper Wabash
sub-basin is the basin with the most counties that do not have a previous record of mudpuppies.
The Lower East Fork White and Lower White have the most top ten counties within the sub-
basins.

48
Appendix B: Figures
Figure 1. Distribution of mudpuppies in the United States including extant and introduced
populations (Group, 2015)

49
Figure 2. Distibution map from Hoffman et al. (2014) representing counties that mudpuppies and
salamander mussels have been documented. This map shows new county records compiled since
Minton’s publication in 2001.
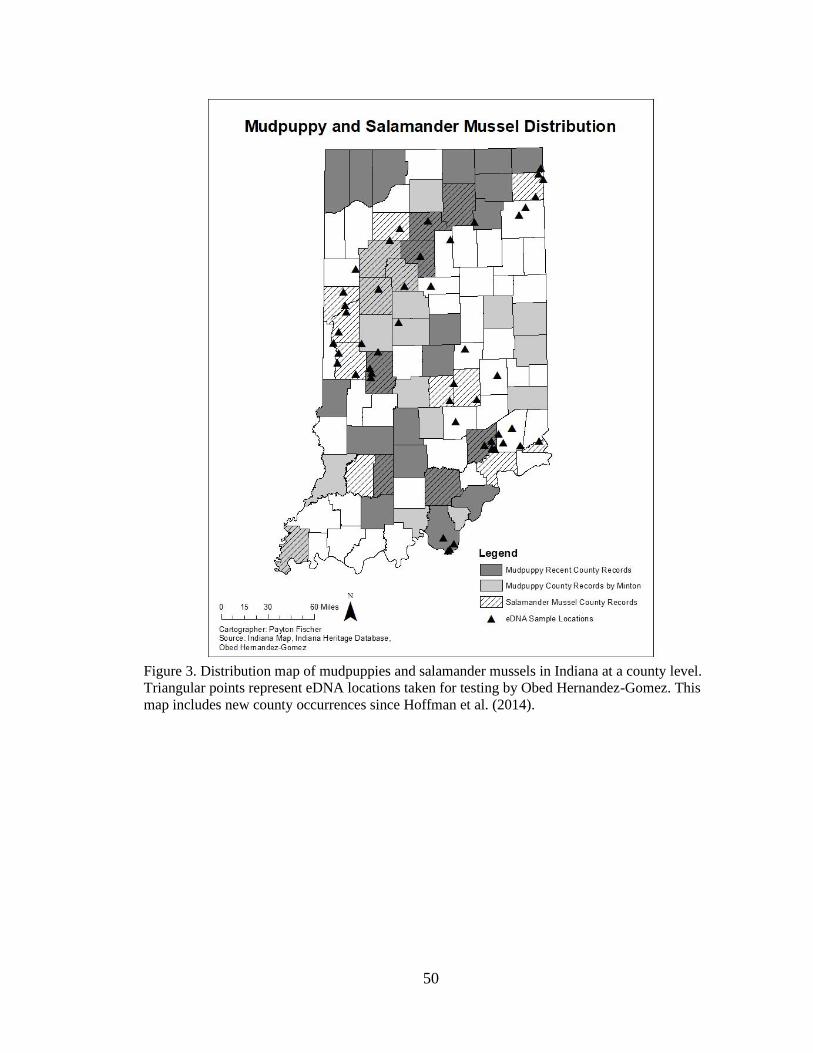
50
Figure 3. Distribution map of mudpuppies and salamander mussels in Indiana at a county level.
Triangular points represent eDNA locations taken for testing by Obed Hernandez-Gomez. This
map includes new county occurrences since Hoffman et al. (2014).

51
Figure 4. HUC08 regions identified by Hoffman et al. (2014) and Lambert et al. (2016) as areas
for greatest conservation need. These areas are predicted to be modeled as suitable habitat for
mudpuppies.

52
Figure 5. Planning regions for Indiana from IDNR SWAP report, “Figure 3-1” (Wildlife, 2015a)

53
Figure 6. Bin regions used for spatial analysis within the R-program, ENMeval. Each bin region
has 25 occurrence points.

54
Figure 7. Sensitivity and specificity of the model for the mudpuppy depicted by the receiver
operating characteristic (ROC) curve. The maximum possible test AUC would be 0.816 rather
than 1.
Figure 8. Marginal response curves representing how each variable affects the Maxent prediction.
These curves show how the variable changes independently of the other variable. The variables
are not correlated in this analysis.

55
Figure 9. Results of jackknife variable importance. This depicts that stream order highly
contributes to the model followed by tree canopy cover and agriculture. Stream order appears to
have the most useful information when used by itself.

56
Figure 10. HUC12 sub-watersheds with the percentage of area above the mSSS threshold. Trends
of higher areas of suitable habitat are throughout south central and northeastern Indiana.

57
Figure 11. Top ten HUC08 sub-basins of medium and high suitable habitat. The Lower White
sub-basin is the only sub-basin that was identified as a region to survey in previous reports.

58
Figure 12. Top ten counties of medium and high suitable area. Four of the counties (Jackson,
Wabash, Huntington, and Daviess) do not have previous records of mudpuppies in the county.

59
Figure 13. Results of the eDNA data from Hernandez-Gomez (2018a). There were no positive
results within the HUC08 sub-basins.

60
Literature Cited
10 Digit Watershed Boundary Dataset in HUC08. (2013).
Agriculture, U. S. D. o. Riparian Areas. Retrieved from
https://www.nrs.fs.fed.us/fmg/nfmg/docs/mn/Riparian.pdf.
Angermeier, P. L., & Winston, M. R. (1999). Characterizing fish community diversity
across Virginia landscapes: prerequisite for conservation. Ecological
Applications, 9(1), 335-349.
Anton, T. G. (1999). Current distribution and status of amphibians and reptiles in Cook
County, Illinois. Transactions of the Illinois State Academy of Science, 92(3), 4.
Bart Jr, H. L., & Holzenthal, R. W. (1985). Feeding ecology of Necturus beyeri in
Louisiana. Journal of herpetology, 402-410.
Beattie, A. M., Whiles, M. R., & Willink, P. W. (2017). Diets, population structure, and
seasonal activity patterns of mudpuppies (Necturus maculosus) in an urban, Great
Lakes coastal habitat. Journal of Great Lakes Research, 43(1), 132-143.
doi:10.1016/j.jglr.2016.11.004
Bennett, A. (2014). Our Friends, the Freshwater Mussels. Retrieved from The EPA Blog
website: https://blog.epa.gov/blog/2014/07/our-friends-the-freshwater-mussels/
Bernardin, L. a. A. (2000). Census_County_TIGER00_IN: Indiana Counties Census Data
2000 (Derived from U.S. Census Bureau, 1:24,000 Polygon Shapefile).
Bodinof Jachowski, C., M., Millspaugh, J. J., & Hopkins, W. A. (2016). Current land use
is a poor predictor of hellbender occurrence: why assumptions matter when
predicting distributions of data‐deficient species. Diversity and distributions,
22(8), 865-880.

61
Brand, A. B., & Grant, E. H. C. (2017). Design tradeoffs in long‐term research for stream
salamanders. The Journal of Wildlife Management.
Braswell, A. L., & Ashton, R. E. (1985). DISTRIBUTION, ECOLOGY, AND
FEEDING-HABITS OF NECTURUS-LEWISI (BRIMLEY). Brimleyana(10),
13-35.
Collins, M. K. (2017). Searching for a Salamander: Distribution and Habitat of the
Common Mudpuppy (Necturus maculosis) in Southeast Ohio Using
Environmental DNA. (Master of Science), Ohio University,
Cortwright, S. A. (1988). Intraguild predation and competition: an analysis of net growth
shifts in larval amphibian prey. Canadian Journal of Zoology, 66(8), 1813-1821.
Craig, J. M., Mifsud, D. A., Briggs, A. S., Boase, J., & Kennedy, G. (2012). Mudpuppy
(Necturus maculosus maculosus) spatial distribution, breeding water depth, and
use of artificial spawning habitat in the Detroit River. Herpetological
Conservation and Biology, 10(3), 926-934.
Elith, J., Phillips, S. J., Hastie, T., Dudík, M., Chee, Y. E., & Yates, C. J. (2011). A
statistical explanation of MaxEnt for ecologists. Diversity and distributions,
17(1), 43-57.
Engbrecht, N. (2017, August 8, 2017). [Mudpuppy Research].
Engbrecht, N. (2018, August 2nd, 2018). [Recent Mudpuppy].
Evermann, B. W., & Clark, H. W. (1916, 1916). The turtles and batrachians of the Lake
Maxinkuckee region.

62
Fauth, J. E., & Resetarits, W. J. (1991). Interactions between the salamander Siren
intermedia and the keystone predator Notophthalmus viridescens. Ecology, 72(3),
827-838.
Flexing the Mussels of Freshwater Rivers. (2017). 2018. Retrieved from
https://medium.com/usfws/flexing-the-mussels-of-freshwater-rivers-
c7ff32c64573
Freda, J., & Dunson, W. A. (1986). Effects of low pH and other chemical variables on the
local distribution of amphibians. Copeia, 454-466.
Gendron, A. D. (2000). COSEWIC Status Report on the Mudpuppy Necturus maculosus
in Canada in COSEWIC Assessment and Status Report on the Mudpuppy
Necturus maculosus in Canada. Committee on the Status of Endangered Wildlife
in Canada. Ottawa, 1-90.
Gramhofer, M., July 7th, 2017). [Personal Communication].
Group, I. S. A. S. (2015). Necturus maculosus. The IUCN List of Threatened Species.
Retrieved from http://dx.doi.org/10.2305/IUCN.UK.2015-
4.RLTS.T59433A64731610.en
Hacker, V. A. (1957). Biology and management of lake trout in Green Lake, Wisconsin.
Transactions of the American fisheries society, 86(1), 71-83.
Hager, H. A. (1997). CONSERVATION OF SPECIES RICHNESS: ARE ALL
UMBRELLA SPECIES OF SIMILAR QUALITY?
Hager, H. A. (1998). Area-sensitivity of reptiles and amphibians: Are there indicator
species for habitat fragmentation? Ecoscience, 5(2), 139-147.

63
Harding, J. H. (1997). Amphibians and reptiles of the Great Lakes region: University of
Michigan Press.
Hecht, M. K., & Walters, V. (1955). On the northern limits of the salamander Necturus
maculosus. Copeia, 1955(3), 251-252.
Hernandez-Gomez, O. (2018a, March 8, 2018). [Mudpuppy eDNA Results].
Hernandez-Gomez, O. (2018b, September 24, 2018). [Mudpuppy Results].
HerpMapper. (2017). HerpMapper - A Global Herp Atlas and Data Hub. Retrieved from:
http://www.herpmapper.org
HerpMapper. (2018). HerpMapper - A Global Herp Atlas and Data Hub. Retrieved from:
http://www.herpmapper.org
Hoffman, A., Robb, J., & E. Fisher, B. (2014). Recent records for mudpuppies (Necturus
maculosus) in Indiana with notes on presumed declines throughout the Midwest
(Vol. 123).
Holman, J. A. (2012). The Amphibians and Reptiles of Michigan: A Quaternary and
Recent Faunal Adventure: Wayne State University Press.
Homer, C., Dewitz, J., Yang, L., Jin, S., Danielson, P., Xian, G., . . . Megown, K. (2015).
Completion of the 2011 National Land Cover Database for the conterminous
United States–representing a decade of land cover change information.
Photogrammetric Engineering & Remote Sensing, 81(5), 345-354.
Howard, D. (1951). A river mussel parasitic on a salamander. NATURAL HISTORY
MISCELLANEA/the Chicago Academy of Sciences, 77, 1-6.
Importance of Mussels. (2018). Retrieved from
https://www.dnr.state.mn.us/mussels/importance.html

64
Indiana Natural Heritage Data Center, S. o. I., Department of Natural Resources, Division
of Nature Preserves. (2017). Indiana Natural Heritage Database.
Jerde, C. L., Mahon, A. R., Chadderton, W. L., & Lodge, D. M. (2011). “Sight‐unseen”
detection of rare aquatic species using environmental DNA. Conservation Letters,
4(2), 150-157.
Jones III, E. B. D., Helfman, G. S., Harper, J. O., & Bolstad, P. V. (1999). Effects of
riparian forest removal on fish assemblages in southern Appalachian streams.
Conservation biology, 13(6), 1454-1465.
Lagler, K. F., & Goellner, K. E. (1941). Notes on Necturus maculosus (Rafinesque), from
Evans Lake, Michigan. Copeia, 1941(2), 96-98.
Lambert, M. R. K. (1997). Environmental effects of heavy spillage from a destroyed
pesticide store near Hargeisa (Somaliland) assessed during the dry season, using
reptiles and amphibians as bioindicators. Archives of Environmental
Contamination and Toxicology, 32(1), 80-93.
Lambert, T. D., Hinz Jr, L. C., & Cao, Y. (2016). Identifying Regional Priority Areas for
Focusing Conservation Actions in Streams and Grasslands: Conservation
Planning. Retrieved from
Landres, P. B., Verner, J., & Thomas, J. W. (1988). Ecological uses of vertebrate
indicator species: a critique. Conservation biology, 2(4), 316-328.
Liang, L., Fei, S., Ripy, J. B., Blandford, B. L., & Grossardt, T. (2013). Stream habitat
modelling for conserving a threatened headwater fish in the Upper Cumberland
River, Kentucky. River Research and Applications, 29(10), 1207-1214.
Lipps, G. (2017, August 12, 2017).

65
Lipps, G. (2018, July 30th, 2018). [Mudpuppy Data].
Liu, C., Newell, G., & White, M. (2016). On the selection of thresholds for predicting
species occurrence with presence‐only data. Ecology and Evolution, 6(1), 337-
348.
Mackey, S. D., & Goforth, R. R. (2005). Great Lakes nearshore habitat science. Journal
of Great Lakes Research, 31, 1-5.
Matson, T. O. (1990). Estimation of numbers for a riverine Necturus population before
and after TFM lampricide exposure. Kirtlandia, 45, 33-38.
Matson, T. O. (1998). Evidence for home ranges in mudpuppies and implications for
impacts due to episodic applications of the lampricide TFM. Status and
Conservation of Midwestern Amphibians. University of Iowa Press, Iowa City, IA,
278-287.
Matson, T. O. (2005). Necturus maculosus (Rafinesque, 1818) Mudpuppy. In M. J.
Lannoo (Ed.), Amphibian declines: the conservation status of United States
species (pp. 870-871): Univ of California Press.
McCallen, E. (2017, June 21st, 2017).
McCallen, E. (2018, May 24th, 2018). [Mudpuppy Data].
Merow, C., Smith, M. J., & Silander Jr, J. A. (2013). A practical guide to MaxEnt for
modeling species’ distributions: what it does, and why inputs and settings matter.
Ecography, 36(10), 1058-1069.
Mills, L. S., Soulé, M. E., & Doak, D. F. (1993). The keystone-species concept in
ecology and conservation. BioScience, 43(4), 219-224.
Minton, S. A. (2001). Amphibians & Reptiles of Indiana: Indiana Academy of Science.
66
Murphy, M. L., Hawkins, C. P., & Anderson, N. H. (1981). Effects of canopy
modification and accumulated sediment on stream communities. Transactions of
the American fisheries society, 110(4), 469-478.
Muscarella, R., Galante, P. J., Soley‐Guardia, M., Boria, R. A., Kass, J. M., Uriarte, M.,
& Anderson, R. P. (2014). ENM eval: An R package for conducting spatially
independent evaluations and estimating optimal model complexity for Maxent
ecological niche models. Methods in Ecology and Evolution, 5(11), 1198-1205.
Muscarella, R., Krass, J. M., & Galante, P. (2018, August 14th, 2018). ENMeval
Vignette. Retrieved from https://cran.r-
project.org/web/packages/ENMeval/vignettes/ENMeval-vignette.html#eval
National Fish Habitat Partnership Data System. (2013).
National Hydrography Dataset Plus - NHDPlus. (2012). Retrieved from:
<http://www.epa.gov/waters>
Neill, W. T. (1963). Notes on the Alabama waterdog, Necturus alabamensis Viosca.
Herpetologica, 19(3), 166-174.
Niemi, G. J., Kelly, J. R., & Danz, N. P. (2007). Environmental indicators for the coastal
region of the North American Great Lakes: introduction and prospectus. Journal
of Great Lakes Research, 33(sp3), 1-12.
Noss, R. F. (1990). Indicators for monitoring biodiversity: a hierarchical approach.
Conservation biology, 4(4), 355-364.
Peterson, R. O. (1988). The pit or the pendulum: issues in large carnivore management in
natural ecosystems. Ecosystem management for parks and wilderness, 105-117.

67
Petranka, J. W. (1998). Salamanders of the United States and Canada: Smithsonian
Institution Press.
Phillips, S. J., Anderson, R. P., Dudík, M., Schapire, R. E., & Blair, M. E. (2017).
Opening the black box: An open‐source release of Maxent. Ecography, 40(7),
887-893.
Phillips, S. J., Anderson, R. P., & Schapire, R. E. (2006). Maximum entropy modeling of
species geographic distributions. Ecological modelling, 190(3-4), 231-259.
Physiographic divisions of the conterminous U. S. (2018).
Pugh, M. W., Hutchins, M., Madritch, M., Siefferman, L., & Gangloff, M. M. (2016).
Land-use and local physical and chemical habitat parameters predict site
occupancy by hellbender salamanders. Hydrobiologia, 770(1), 105-116.
Radosavljevic, A., & Anderson, R. P. (2014). Making better Maxent models of species
distributions: complexity, overfitting and evaluation. Journal of biogeography,
41(4), 629-643.
Resources, I. D. o. N. (2018, February 19th, 2918). Endangered Plant and Wildlife
Species. Retrieved from https://www.in.gov/dnr/naturepreserve/4725.htm
Roe, K. J. (2003). Conservation Assessment for The Salamander Mussel (Simosonaias
ambigua) Say, 1825. USDA Forest Service, 1-11.
Sajdak, R. A. (1982). Seasonal activity patterns, habitat selection, and population
structure of the Mudpuppy, Necturus maculosus, in a Wisconsin stream.
Service, U. S. F. a. W. (2018, February 26th, 2018). Species Profile for Salamander
mussel (Simpsonaias ambigua). Retrieved from
https://ecos.fws.gov/ecp0/profile/speciesProfile?spcode=F01U

68
Service, U. S. F. a. W. (2019). Endangered and Threatened Wildlife and Plants; 12-
Month Petition Finding and Endangered Species Status for the Missouri Distinct
Population Segment of Eastern Hellbender. Government Publishing Office.
Shoop, C. R., & Gunning, G. E. (1967). Seasonal activity and movements of Necturus in
Louisiana. Copeia, 732-737.
Spear, S. (2017, August 19th, 2017).
Survey, I. G. (2002). LANDSURVEY_COUNTY_POLY_IN: County Boundaries of
Indiana (Indiana Geological Survey, 1:24,000, Polygon Shapefile). In K. K. Like
(Ed.). Indiana Map: Indiana Geological Survey.
Survey, U. S. G. (2011). WATERSHEDS_HUC08_2009_USDA_IN: Eight-digit
Subbasin Watershed Boundaries for Indiana (United States Department of
Agriculture, 1:24,000 Polygon Shapefile). Retrieved from
http://maps.indiana.edu/layerGallery.html?category=Watersheds
Sutherland, A. B., Meyer, J. L., & Gardiner, E. P. (2002). Effects of land cover on
sediment regime and fish assemblage structure in four southern Appalachian
streams. Freshwater Biology, 47(9), 1791-1805.
Sutherland, J., Stedman, A., Mifsud, D., Stapleton, M., Roseman, E., & Greenwald, K.
(2016). Use of Land Cover DAta and EDNA Predict the Presence of the
Mudpuppy. Paper presented at the Joint Meeting of Ichthyologists and
Herpetologists.
Thomsen, P. F., & Willerslev, E. (2015). Environmental DNA–An emerging tool in
conservation for monitoring past and present biodiversity. Biological
Conservation, 183, 4-18.

69
Trombulak, S. C., & Frissell, C. A. (2000). Review of ecological effects of roads on
terrestrial and aquatic communities. Conservation biology, 14(1), 18-30.
Turner, C. (2015). What is eDNA? Retrieved from
http://environmentaldna.com/knowledgebase/what-is-edna/
Watson, E. T., Metcalfe-Smith, J. L., & Di Maio, J. (2001). Status report on the
mudpuppy mussel Simpsonaias ambigua. In: Committee on the Status of
Endangered Wildlife in Canada, Ottawa, ON.
Wilcox, B. A. (1984). In situ conservation of genetic resources: determinants of
minimum area requirements. National parks, conservation and development: the
role of protected areas in sustaining society. Smithsonian Institution Press,
Washington, DC, 639-647.
Wilcox, B. A., Murphy, D. D., Ehrlich, P. R., & Austin, G. T. (1986). Insular
biogeography of the montane butterfly faunas in the Great Basin: comparison
with birds and mammals. Oecologia, 69(2), 188-194.
Wildlife, D. o. F. (2015a). Indiana State Wildlife Action Plan.
Wildlife, D. o. F. (2015b). Indiana State Wildlife Action Plan Appendicies

Curriculum Vitae
Payton Nicole Fischer
EDUCATION
INDIANA UNIVERSITY – IUPUI
Indianapolis, IN
Master of Science – Geographic Information Science
May 2020
SAINT JOSEPH’S COLLEGE
Rensselaer, IN
Bachelor of Science in Biology, May 2016
▪ Concentration in Wildlife Ecology
▪ Minor: Sustainability Studies
▪ Summa Cum Laude
EXPERIENCE
Indiana University – Purdue University Indianapolis
School of Medicine Project Intern (May 2019 - October 2019): Created database files in
excel and ArcMap for health initiative projects. Consulted on best avenues for
creating geospatial databases and maps.
Geography Department Research Assistant (2018-2019): Assisted advising professor
with personal research as needed. Worked on thesis research in preparation for
defense.
Indiana Department of Natural Resources – Division of Water
Dams and Levees Section Program Coordinator 5 (2016-2018): Entered dam inspection
data into Unity Database system. Created maps for online GIS software.
Organized projects and files and created digital copies.
Dams and Levees Section Graduate Internship (2018): Identifying dams that may be
jurisdictional based on Indiana dam safety statutes. This was done by GIS
analysis using ArcHydrotools, python scripts, and modeling. I completed of the
four process areas during the time of the internship that centered around
hydrologic analysis.
Envigo – Indianapolis, IN
Animal Care Technician (2016): Cared for inventory mice at Envigo in Indianapolis, IN.
Daily care included but not limited to feeding, cleaning enclosures, taking tissue
samples, plating samples, and organizing orders.
Columbian Park Zoo – Lafayette, IN
Seasonal Zookeeper (2016): Cared for existing animals at the Columbian Park Zoo.
Animal species included but not limited to small mammals, primates, anteaters,
farm animals, marsupials, reptiles, amphibians, birds, small carnivores,
invertebrates.

▪ Preparation of diets, cleaning animal enclosures, observing animal
behaviors
▪ Assisting with enrichments, medications, and enclosure modification
▪ Working knowledge of zoo procedures and protocol with all animals
within the collection
▪ Supervising volunteers
Animal Care Intern (2015): Cared for existing animals at the Columbian Park Zoo,
Lafayette, IN with a concentration in small mammals, amphibians, reptiles, and
invertebrates. Including responsibilities mentioned above.
Saint Joseph’s College – Rensselaer, IN
Teaching Assistant (2013-2016): Assist in lab sections and grade labs for introductory
and upper level biology classes.
▪ Evolution and Ecology, Structure and Function, Comparative Vertebrate
Anatomy
▪ Feed and clean enclosures of laboratory animals
Peer Learning Assistant (2013-2016): Conduct tutoring sessions for students in
introductory and upper level biology classes.
▪ Evolution and Ecology, Structure and Function, Comparative Vertebrate
Anatomy, Core 6
▪ Conduct individual and group tutoring sessions
Resident Assistant (2013-2016): Monitor halls and enforce college policies in
upperclassmen and freshman halls.
▪ Build community and uphold college policy with residents (90 total)
▪ Mediate and display creative problem solving with roommate conflicts
▪ Create programs and campus events for students
▪ Working knowledge of campus resources and making referrals if needed
▪ QPR Suicide Prevention Certified (2015)
Summer Research Assistant (2013-2015): Assisted in summer research and educational
outreach for the Saint Joseph’s College Biology Department under Dr. Robert
Brodman and Dr. Timothy Rice.
ANIMAL POPULATION SURVEYS
Nerodio 2014-2018: Participated in annual population survey of the previously federally
threatened Lake Erie Water Snake (Nerodia sipedon insularum) on the Bass Islands
and Kelly’s Island, Ohio.
▪ Skills: Pit tagging, data collection, snake fungal disease tissue collection
Hellbender Symposiums 2013, 2015, 2017: Participated in surveys of the federal candidate
species in the Hiawasee River, TN (2013) and conservation workshop at St. Louis
Zoo (2015).
Indiana Academy of Science BioBlitz: Participated in herp surveys at Eagle Marsh (2014),
and herp and bat surveys at Hills of Gold (2015), Red-Tail Land Conservancy
(2017), Eagle Creek (2018), The Center at Ancilla College (2019)
Indiana Forest Alliance EcoBlitz: Participated in four herp surveys at Morgan-Monroe and
Yellowwood State Forests (2014 & 2015).
Long-term local surveys of Indiana amphibians and reptiles 2013-2016

RESEARCH PROJECTS
Influence of Habitat Restoration on Amphibians at Cowles Bog Wetland Complex (2014-
2015)
The Effects of Herbicide Application and Cover Crops on Salamander Larvae (2015)
The Effects of Herbicide Surfactants on Spotted Salamander Larvae (2015)
The effects of plastics and aquatic herbicide application on Salamander eggs and larvae
(2014)
Impact of Cover Crops on Bird, Insect, and Amphibian Diversity (2014-2015)
Assessment of oak barrens restoration: Response of the herpetofauna to aggressive
canopy removal and fire management (2013)
Snake mark-recapture on Saint Joseph’s College Environmental Research Station (2014-
2016)
POSTER ABSTRACTS AND PUBLICATIONS
Brodman, R., M. Gramhofer, R. Mullis, P. Kellenburger, H. Van Meter, and R. Alatorre.
2014. Influence of Habitat Restoration in Amphibians at Cowles Bog, Indiana
Dunes National Lakeshore. Final research report submitted to National Park
Service.
Brodman, R., P. Kellenburger, J. Nagel, A. Roller, J. Faukmer, D.R. Finkler, M.S.
Finkler, E. Kuntz, N. Asher, H.Milbrath, and J. Horton. 2017. AMBYSTOMA
JEFFERSONIANUM (Jefferson Salamander). USA: Indiana, Johnson County.
Herpetological Review 48:116-117.
Brodman, R., P. Kellenburger, J. Nagel, A. Roller, J. Faukmer, D.R. Finkler, M.S.
Finkler, E. Kuntz, N. Asher, H.Milbrath, and J. Horton. 2017. LITHOBATES
SYLVATICA(Wood Frog). USA: Indiana, Johnson County. Herpetological
Review 48;120.
Brodman, R., P. Kellenburger, J. Nagel, and A. Roller. 2017. AMBYSTOMA
MACULATUM (Spotted Salamander). USA: Indiana, Johnson County.
Herpetological Review 48:117.
Brodman, R., P. Kellenburger, J. Nagel, and A. Roller. 2017. HYLA
CHRYSOSCELIS (Cope’s Gray Treefrog). USA: Indiana, Johnson County.
Herpetological Review 48:119.
Brodman, R, P. Kellenburger, H. Van Meter, and M. Gramhofer. 2014. The effects of
plastics and aquatic herbicide application on salamander eggs and larvae. Poster
presentation: Midwest PARC, MN; Paper presentation: JMIH, Chattanooga, TN.
Brodman, R., P. Kellenburger, H. Van Meter, and H. Mitchell. 2015. The Effects of
Herbicide Application and Cover Crops on Salamander Larvae. Final research
report submitted to Indiana Academy of Science, Indianapolis, IN.
Brodman, R., P. Kellenburger, H. Van Meter, Ashley Thacker, and Jennifer Munson. 2014.
The effects of plastics and aquatic herbicide application on Salamander eggs and
larvae. Herpetological Conservation and Biology in revision.
Brodman, R., A. Marsh, P. Kellenburger, and M. Gramhofer. 2013. Short-term amphibian
and reptile habitat use and abundance in response to oak savanna restoration. Poster
presentation: Midwest PARC, Forest Beach Migratory Preserve, WI.
Brodman, R., D. Perkins, T. Rice, P. Kellenburger, H. Van Meter. 2014-2015. Impact of

Cover Crops on Bird, Insect, and Amphibian Diversity. Final research report
submitted to National Wildlife Federation, Washington, DC.
Fischer, P. and V. Lulla. 2019. Modeling Suitable Habitat for the Common Mudpuppy
(Necturus maculosus maculosus) in Indiana, USA Utilizing Regional Data and
eDNA. Poster presentation: Student Research and Engagement Day, Indiana
University – Purdue University Indianapolis, Indianapolis, IN.
Fischer, P. and V. Lulla. 2019. Modeling Suitable Habitat for the Common Mudpuppy
(Necturus maculosus maculosus) in Indiana, USA Utilizing Regional Data and
eDNA. Poster presentation: Geography Research Day, Indiana University –
Purdue University Indianapolis, Indianapolis, IN.
Fischer, P. and V. 2019. Lulla. Modeling Suitable Habitat for the Common Mudpuppy
(Necturus maculosus maculosus) in Indiana, USA Utilizing Regional Data and
eDNA. Poster presentation: IGIC Poster Contest, Bloomington, IN.
Fischer, P. 2019. GIS modeling of suitable habitat for Mudpuppy using
regional data and eDNA. Oral presentation: Midwest PARC, Madrid, IA.
Shuey, J., R. Brodman, W. Weber, P. Kellenburger, A. Marsh, M. Gramhofer, T. Huff,
J. Kotel, A. Willis, L. Cockerham, and A. Rousseau. A five-year experimental
assessment of oak barrens restoration: Response of the herpetofauna to aggressive
canopy removal and fire management. Restoration Ecology manuscript in
preparation.
UNDERGRADUATE RESEARCH PROJECTS AND REPORTS
Kellenburger, P. 2016. Action Project Report: Pollinating a Campus. Practicum in
Sustainability.
Bulthuis, J., S. Conley, J. Guimond, P. Kellenburger, J. Munson, and H. Van Meter.
2015. Turtle Mark-Recapture. Herpetology.
Kellenburger, P. 2015. Soil Preference of Ambystoma Salamanders. Environmental
Research Methods.
Kellenburger, P. 2015. The Impact of Humans and the Introduction of Rhinella marina
on St. John, USVI. Island Ecology.
Kellenburger, P., K. Bullert, S. Conley, J. Nagel, and H. Van Meter. 2015. Saint Joseph’s
College Prairie Restoration Implementation and MBOR Report. Conservation and
Restoration Ecology.
Kellenburger, P. and J. Nagel. 2015. Follow-up of the Effects of Herbicide Surfactants on
Spotted Salamander Larvae. General Toxicology.
Kellenburger, P. 2014. Age Distribution and Species Determination of Lepomis
cyanallus. Ichthyology.
Kellenburger, P. 2013. Habitat Selection of Juvenile Ambystoma maculatum. Ecology.
Kellenburger, P., J. Guimond, and E. Baird. 2013. Native and Invasive Plant Surveys at
SJC Restoration Site. Junior Biology Research.

HONORS
Sister Dorothy Stang Outstanding Student in Wildlife Ecology Award, 2016
Douglas E. Bauer Memorial Senior Biology Student Award, 2016
Outstanding Senior Visual Presentation Award, SJC Colloquium 2016
▪ Kellenburger, P. 2016. Action Project Report: Pollinating a Campus.
Practicum in Sustainability.
Science Olympiad Lugosan-Kellenburger Student Award, instated February 2016
Father Urban J. Siegrist, C. PP. S. Junior Biology Student Award, 2015
Outstanding Junior Oral Presentation Award, SJC Colloquium 2015
▪ Kellenburger, P. 2015. Soil Preference of Ambystoma Salamanders.
Environmental Research Methods.
Outstanding Junior Visual Presentation Award, SJC Colloquium 2015
▪ Kellenburger, P. 2015. The Impact of Humans and the Introduction of
Rhinella marina on St. John, USVI. Island Ecology.
12th Ecology Poster Session Award, Ecology 2013
▪ Kellenburger, P. 2013. Habitat Selection of Juvenile Ambystoma
maculatum. Ecology.
Dean’s List: Fall 2013, Fall 2014, Spring 2014, Fall 2015, Spring 2016
ACTIVITIES
Science Club, 2012-2016 (Freshman Liaison, 2012-2013; Secretary, 2013-2014;
President 2014-2015).
S.T.E.M. Freshmen Mentor, 2014-2016.
Campus Ministry, 2012-2016 (Lector, 2012-2016; Confirmation Retreat Leader, 2013-
2015; Respect for Life Contact, 2013-2014; Kairos Retreat Leader, 2015; Peer
Ministers 2013-2016).
SJC Marching Band, 2012-2015 (Section Leader, 2014-2015).
Green Pumas, 2012-2016.
Alpha Lambda Delta Honors Society, 2013.
ORGANIZATIONS AND MEMBERSHIPS
Midwest Partners in Amphibian and Reptile Conservation, 2013-present
▪ Attended regional meetings in 2013, 2014, 2017, and 2019
▪ Lead field trip for 2017 meeting in Brown Co., Indiana
▪ Presented preliminary thesis results at 2019 meeting in Iowa
Society for the Study of Amphibians and Reptiles, 2017-present
Indiana Geographic Information Counsel, 2017-present
Hoosier Herpetological Society, 2017-present
VOLUNTEER WORK
The Nature Conservancy: Kankakee Sands, Newton County, Indiana, 2015-2016
Regional Science Olympiad Tournament at Saint Joseph’s College, Rensselaer, IN, 2013-
2017