
Modeling midwave infrared muzzle flash spectra from unsuppressed ...
10
Modeling midwave infrared muzzle flash spectra from unsuppressed and flash-suppressed large caliber munitions Bryan J. Steward ⇑ , Glen P. Perram, Kevin C. Gross Department of Engineering Physics, Air Force Institute of Technology, 2950 Hobson Way, Wright Patterson Air Force Base, OH 45433-7765, USA highlights " Time-resolved infrared muzzle flash spectra from a large caliber gun are reported. " Radiative transfer models are used to estimate physical properties from the spectra. " Combustion emissions are dominated by H 2 O and CO 2 at 1200–1600 K. " Non-combusting plumes are primarily particulates, soot, and CO at 850–1050 K. " Temperature rate of change is used to estimate heat of combustion of the propellant. article info Article history: Received 9 October 2011 Available online 9 May 2012 Keywords: Muzzle flash Spectra Radiative transfer Gun Combustion Muzzle plume abstract Time-resolved infrared spectra of firings from a 152 mm howitzer were acquired over an 1800– 6000 cm 1 spectral range using a Fourier-transform spectrometer. The instrument collected primarily at 32 cm 1 spectral and 100 Hz temporal resolutions. Munitions included unsuppressed and chemically flash suppressed propellants. Secondary combustion occurred with unsuppressed propellants resulting in flash emissions lasting 100 ms and dominated by H 2 O and CO 2 spectral structure. Non-combusting plume emissions were one-tenth as intense and approached background levels within 20–40 ms. A low-dimensional phenomenological model was used to reduce the data to temperatures, soot absor- bances, and column densities of H 2 O, CO 2 , CH 4 , and CO. The combusting plumes exhibit peak tempera- tures of 1400 K, areas of greater than 32 m 2 , low soot emissivity of 0.04, with nearly all the CO converted to CO 2 . The non-combusting plumes exhibit lower temperatures of 1000 K, areas of 5m 2 , soot emissivity of greater than 0.38 and CO as the primary product. Maximum fit residual relative to peak intensity are 14% and 8.9% for combusting and non-combusting plumes, respectively. The model was gen- eralized to account for turbulence-induced variations in the muzzle plumes. Distributions of temperature and concentration in 1–2 spatial regions demonstrate a reduction in maximum residuals by 40%. A two- region model of combusting plumes provides a plausible interpretation as a 1550 K, optically thick plume core and 2550 K, thin, surface-layer flame-front. Temperature rate of change was used to char- acterize timescales and energy release for plume emissions. Heat of combustion was estimated to be 5 MJ/kg. Published by Elsevier B.V. 1. Introduction Muzzle blast and flash signatures are important for gun design operator safety and determining firing location [1,2]. Despite the apparent utility of the signatures, study of muzzle flash has focused on its occurrence and suppression [1–3], and there are only a handful of works on the characteristics of flash signatures [4–7]. No modern spectroscopic studies could be found in the literature. This is surprising considering that remote observation of signatures offers the potential for new academic and practical applications. Temporally-resolved spectral signatures may improve our under- standing of the thermochemistry and fluid dynamics of muzzle plumes. The most significant contributor to muzzle flash – both in terms of size and intensity – is secondary combustion [1]. This is the re-ignition of muzzle gases and particulate matter that have been expelled from the gun barrel. It can only occur after mixing with atmospheric oxygen [2,3,8]. After re-ignition, the flame front quickly envelops the entire muzzle plume, resulting in emissions throughout the visible and infrared. Nearly 99% of the energy 1350-4495/$ - see front matter Published by Elsevier B.V. http://dx.doi.org/10.1016/j.infrared.2012.04.005 ⇑ Corresponding author. Tel.: +1 937 255 3636x4504; fax: +1 937 626 6000. E-mail addresses: [email protected] (B.J. Steward), glen.perram@afit.edu (G.P. Perram), kevin.gross@afit.edu (K.C. Gross). Infrared Physics & Technology 55 (2012) 246–255 Contents lists available at SciVerse ScienceDirect Infrared Physics & Technology journal homepage: www.elsevier.com/locate/infrared
Transcript of Modeling midwave infrared muzzle flash spectra from unsuppressed ...
Infrared Physics & Technology 55 (2012) 246–255
Contents lists available at SciVerse ScienceDirect
Infrared Physics & Technology
journal homepage: www.elsevier .com/locate / infrared
Modeling midwave infrared muzzle flash spectra from unsuppressedand flash-suppressed large caliber munitions
Bryan J. Steward ⇑, Glen P. Perram, Kevin C. GrossDepartment of Engineering Physics, Air Force Institute of Technology, 2950 Hobson Way, Wright Patterson Air Force Base, OH 45433-7765, USA
h i g h l i g h t s
" Time-resolved infrared muzzle flash spectra from a large caliber gun are reported." Radiative transfer models are used to estimate physical properties from the spectra." Combustion emissions are dominated by H2O and CO2 at 1200–1600 K." Non-combusting plumes are primarily particulates, soot, and CO at 850–1050 K." Temperature rate of change is used to estimate heat of combustion of the propellant.
a r t i c l e i n f o
Article history:Received 9 October 2011Available online 9 May 2012
Keywords:Muzzle flashSpectraRadiative transferGunCombustionMuzzle plume
1350-4495/$ - see front matter Published by Elsevierhttp://dx.doi.org/10.1016/j.infrared.2012.04.005
⇑ Corresponding author. Tel.: +1 937 255 3636x450E-mail addresses: [email protected] (B.J. St
(G.P. Perram), [email protected] (K.C. Gross).
a b s t r a c t
Time-resolved infrared spectra of firings from a 152 mm howitzer were acquired over an 1800–6000 cm�1 spectral range using a Fourier-transform spectrometer. The instrument collected primarilyat 32 cm�1 spectral and 100 Hz temporal resolutions. Munitions included unsuppressed and chemicallyflash suppressed propellants. Secondary combustion occurred with unsuppressed propellants resulting inflash emissions lasting �100 ms and dominated by H2O and CO2 spectral structure. Non-combustingplume emissions were one-tenth as intense and approached background levels within 20–40 ms. Alow-dimensional phenomenological model was used to reduce the data to temperatures, soot absor-bances, and column densities of H2O, CO2, CH4, and CO. The combusting plumes exhibit peak tempera-tures of �1400 K, areas of greater than 32 m2, low soot emissivity of �0.04, with nearly all the COconverted to CO2. The non-combusting plumes exhibit lower temperatures of �1000 K, areas of �5 m2,soot emissivity of greater than 0.38 and CO as the primary product. Maximum fit residual relative to peakintensity are 14% and 8.9% for combusting and non-combusting plumes, respectively. The model was gen-eralized to account for turbulence-induced variations in the muzzle plumes. Distributions of temperatureand concentration in 1–2 spatial regions demonstrate a reduction in maximum residuals by 40%. A two-region model of combusting plumes provides a plausible interpretation as a �1550 K, optically thickplume core and �2550 K, thin, surface-layer flame-front. Temperature rate of change was used to char-acterize timescales and energy release for plume emissions. Heat of combustion was estimated to be�5 MJ/kg.
Published by Elsevier B.V.
1. Introduction
Muzzle blast and flash signatures are important for gun designoperator safety and determining firing location [1,2]. Despite theapparent utility of the signatures, study of muzzle flash has focusedon its occurrence and suppression [1–3], and there are only ahandful of works on the characteristics of flash signatures [4–7].No modern spectroscopic studies could be found in the literature.
B.V.
4; fax: +1 937 626 6000.eward), [email protected]
This is surprising considering that remote observation of signaturesoffers the potential for new academic and practical applications.Temporally-resolved spectral signatures may improve our under-standing of the thermochemistry and fluid dynamics of muzzleplumes.
The most significant contributor to muzzle flash – both in termsof size and intensity – is secondary combustion [1]. This is there-ignition of muzzle gases and particulate matter that have beenexpelled from the gun barrel. It can only occur after mixing withatmospheric oxygen [2,3,8]. After re-ignition, the flame frontquickly envelops the entire muzzle plume, resulting in emissionsthroughout the visible and infrared. Nearly 99% of the energy
B.J. Steward et al. / Infrared Physics & Technology 55 (2012) 246–255 247
radiated in muzzle flash is in the infrared, making it an ideal spec-tral region to characterize for practical use [5]. Even if re-ignitiondoes not occur (such as with the use of flash suppressors) the plumethat develops from the muzzle flow contains high concentrations ofhigh-temperature particulate matter that emit continuum radia-tion throughout the infrared [2,8].
Midwave infrared (MWIR, 1–5 lm) spectral features from high-explosive (HE) fireballs have recently been used to identify emis-sive area, temperature, and emitter species at specific tempera-tures and concentrations [9–11]. These models have not beenapplied or adapted for muzzle flash. Combusting muzzle plumesare similar to fireballs – gaseous fuel and particulate matter burnwith entrained atmospheric oxygen in a hot, turbulent mixture –and the work presented here extends the application of the HEmodel to muzzle flash spectra.
The purpose of this paper is three-fold. First, we present andcharacterize recent time-resolved spectral measurements ofhowitzer muzzle flashes obtained during a test designed to developan understanding of large caliber gun firing signatures. Midwaveinfrared (1.5–5.5 lm) emissions from secondary-combusting andnon-combusting plumes are presented. Second, we explore the util-ity of a highly-simplified, low-dimensional spectral model fordimensionality reduction and feature extraction. (If this modeladequately accounts for the spectral variance in the flashsignatures, it will be used to extract features from hundreds ofevents for follow-on weapons classification work.) Evolving flashtemperatures, sizes and emitter concentrations are estimated, andtemperature dynamics are examined in terms of combustion heatrelease. Finally, we consider the limitations of this simple modeland improve upon it by accounting for, in an approximate andcomputationally efficient way, the spatial non-uniformity observedin the muzzle flash flow field. In concert with these efforts, a reac-tive-flow computational fluid dynamic simulation of the muzzleflow field has been started [12]. When complete, the CFD resultswill be used to inform the development of a more realistic,multi-layer spectral plume model so that more representative,physics-based parameters might be extracted.
2. Experimental
Two hundred and one firings of a 152 mm howitzer were con-ducted during 10–19 October, 2007. The test was instrumentedwith numerous spectrometers, radiometers, and high-speed imag-ers spanning the visible and infrared, and gun firings were observedfrom one of two locations. Only those details pertinent to this studyare reported here, and additional details on test execution, instru-mentation, and layout can be found in Ref. [13].
The gun fired munitions with three different carbon, hydrogen,nitrogen, and oxygen (CHNO) double-base propellants designatedFull Charge (8.85 kg), Charge 1 (7.52 kg), and Charge 2 (4.24 kg).All propellants were under-oxidized. Due to the length of the how-itzer barrel, available oxygen is consumed and combustion ceases
Table 1Propellant and observation details for each munition configuration. Stoichiometry is relinstrument resolution indicate the useable data out of the total observed.
Charge Supp. Stoichiometry Rd
Full Charge Yesa C1H1.25N0.38O1.37 0.75No C1H1.25N0.38O1.36 0.72
Charge 1 Yes C1H1.24N0.38O1.38 0.75No C1H1.24N0.38O1.36 0.72
Charge 2 No C1H1.14N0.42O1.55 1.09
a Two firings contained 1/2 bags of suppressant but did not flash.
interior to the gun. Prior to exiting the 152 mm howitzer muzzle,the flow is shock heated when it passes through a brake that splitsthe flow into one forward and two lateral plumes [1,2,8]. When thehot muzzle effluent turbulently entrains atmospheric oxygen, thegases may re-ignite and combustion can continue to completion.To inhibit secondary combustion, Full Charge and Charge 1 bothcontained optional chemical flash suppressant (0.28 kg) that con-sume OH and H combustion radicals [2,3].
Table 1 indicates the relative stoichiometry for each propellant.For complete combustion, all propellant is converted to H2O, CO2,and N2. This neglects non-CHNO species, which account for less than1% of the propellant composition. In this case, the quantityR = 2�[H2O]/([CO2] + [CO]) is equivalent to the stoichiometric hydro-gen-to-carbon (H:C) ratio. The brackets denote number density ofthe indicated species. If the muzzle plume does not re-ignite andsecondary combustion does not occur, the under-oxidized propel-lant burns only with oxygen available interior to the gun. The prod-ucts of incomplete combustion are preferentially H2O and CO, withCO2 being formed only if additional oxygen is available [14].Remaining hydrogen and carbon primarily produce H2 and soot,and negligible CO2 concentrations are assumed. In non-combustingplumes, Rd � R includes only the primary hydrogen and carboncontaining species (i.e. H2 and soot are neglected) oxidized by theoxygen only in the propellant. These theoretical incompletecombustion Rd values are also shown in Table 1 and represent whatmight be observed spectroscopically when the muzzle flash doesnot afterburn.
An ABB-Bomem MR-254 Fourier transform spectrometer (FTS)was located with a side-on view of the gun at a distance of429 m. The instrument has two channels that were equipped withInGaAs (5800–10,000 cm�1) and InSb (1800–7800 cm�1) detectors.The detectors shared a common input aperture with a visible, bore-sight camera used for pointing and focus. Field of view (FOV) waslimited by a 75 mrad telescope providing a radial FOV of approxi-mately 16 m at the gun, sufficient to contain the entire muzzleplume whose maximum dimension was 8–10 m (oriented alongthe firing axis). The plumes’ side-on projected area was typicallya maximum of 35–40 m2 (about 5% of the FOV). The bore-sightedvisible camera was used to ensure that the plume was withinand under-filled the instrument’s FOV.
The MR-254 is a Michelson-type interferometer in which lightis split between two optical paths then recombined to form a con-structive and destructive interference pattern. The instrumentsamples the interference pattern, termed an interferogram. To cor-rect for errors in sampling, each double-sided interferogram wasphase corrected using Mertz’s technique with n = 182 points sam-pled to either side of the centerburst [15,16]. The corrected inter-ferograms were then apodized with a Hanning function,H(x) = cos2(px/2xm), and Fast-Fourier Transformed to yield rawspectral irradiances, Eo(m). Complex gain and offset calibrationcoefficients were used to center and scale raw irradiance data toradiometrically accurate values. Blackbody measurements of sixarea–temperature pairs were taken several times per day, and
ative to carbon. Rd is the incomplete combustion H:C ratio. The numbers for each
# Firings 32 cm�1 16 cm�1 4 cm�1
69 49/54 0/0 1/228 14/18 7/7 0/2
53 35/42 5/9 0/128 14/15 11/11 0/0
23 22/23 0/0 0/0
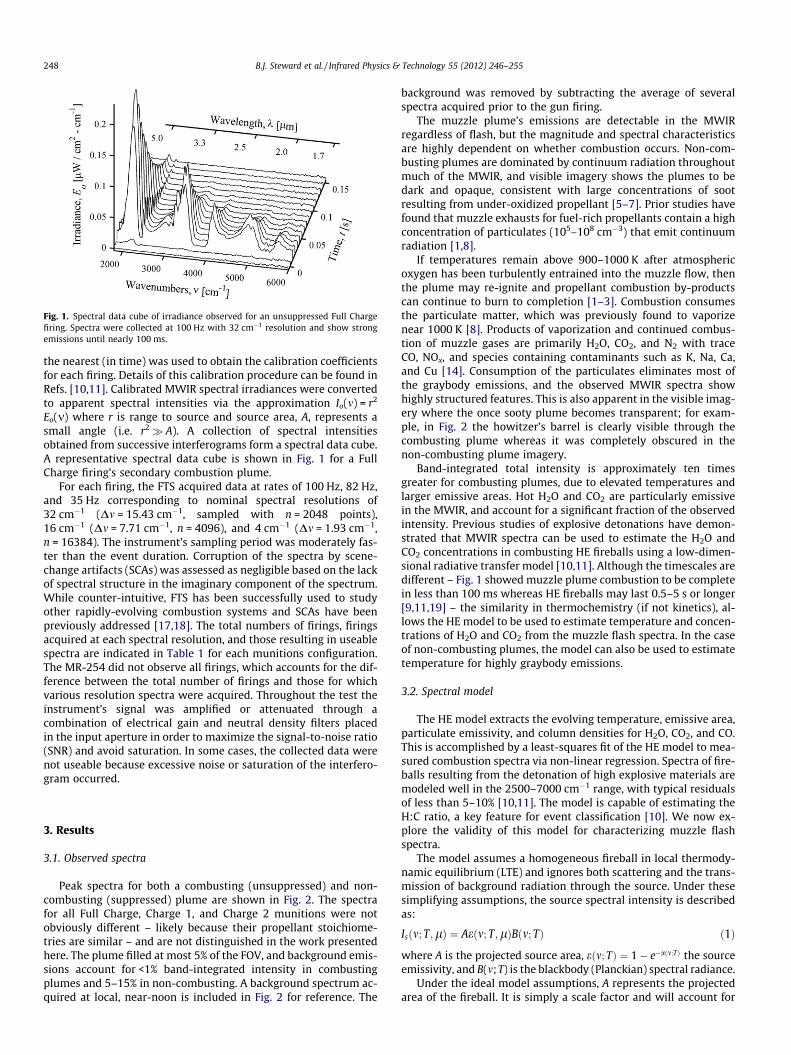
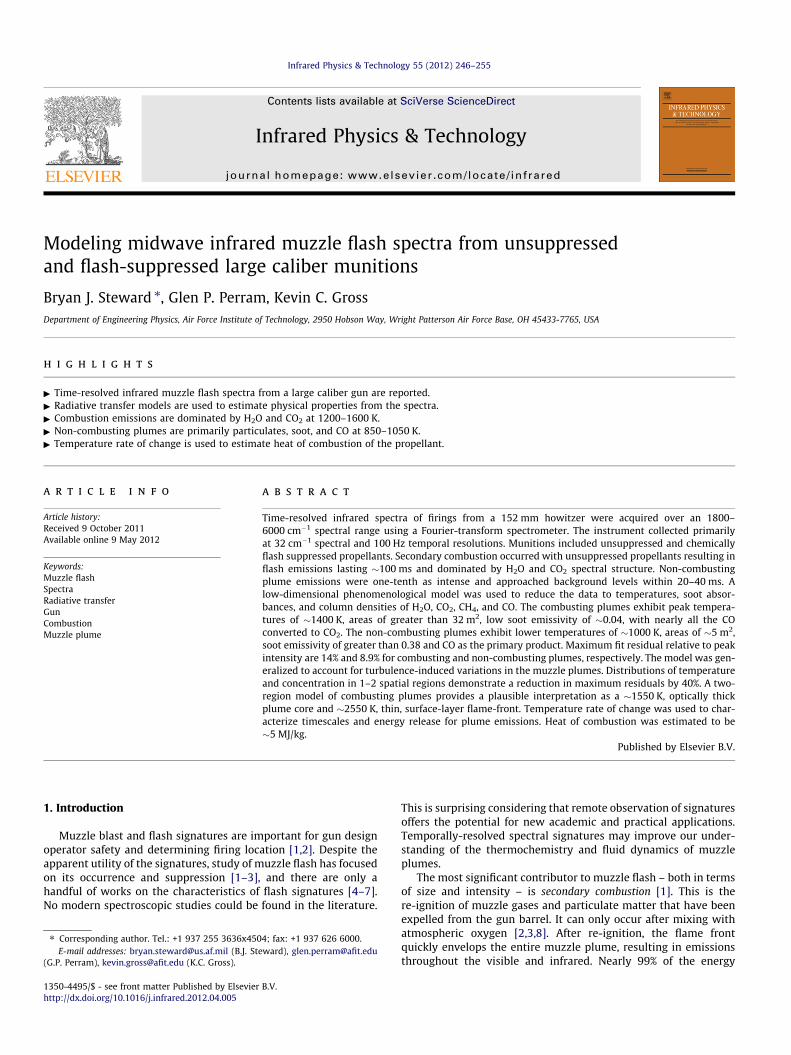
Fig. 1. Spectral data cube of irradiance observed for an unsuppressed Full Chargefiring. Spectra were collected at 100 Hz with 32 cm�1 resolution and show strongemissions until nearly 100 ms.
248 B.J. Steward et al. / Infrared Physics & Technology 55 (2012) 246–255
the nearest (in time) was used to obtain the calibration coefficientsfor each firing. Details of this calibration procedure can be found inRefs. [10,11]. Calibrated MWIR spectral irradiances were convertedto apparent spectral intensities via the approximation Io(m) = r2
Eo(m) where r is range to source and source area, A, represents asmall angle (i.e. r2� A). A collection of spectral intensitiesobtained from successive interferograms form a spectral data cube.A representative spectral data cube is shown in Fig. 1 for a FullCharge firing’s secondary combustion plume.
For each firing, the FTS acquired data at rates of 100 Hz, 82 Hz,and 35 Hz corresponding to nominal spectral resolutions of32 cm�1 (Dm = 15.43 cm�1, sampled with n = 2048 points),16 cm�1 (Dm = 7.71 cm�1, n = 4096), and 4 cm�1 (Dm = 1.93 cm�1,n = 16384). The instrument’s sampling period was moderately fas-ter than the event duration. Corruption of the spectra by scene-change artifacts (SCAs) was assessed as negligible based on the lackof spectral structure in the imaginary component of the spectrum.While counter-intuitive, FTS has been successfully used to studyother rapidly-evolving combustion systems and SCAs have beenpreviously addressed [17,18]. The total numbers of firings, firingsacquired at each spectral resolution, and those resulting in useablespectra are indicated in Table 1 for each munitions configuration.The MR-254 did not observe all firings, which accounts for the dif-ference between the total number of firings and those for whichvarious resolution spectra were acquired. Throughout the test theinstrument’s signal was amplified or attenuated through acombination of electrical gain and neutral density filters placedin the input aperture in order to maximize the signal-to-noise ratio(SNR) and avoid saturation. In some cases, the collected data werenot useable because excessive noise or saturation of the interfero-gram occurred.
3. Results
3.1. Observed spectra
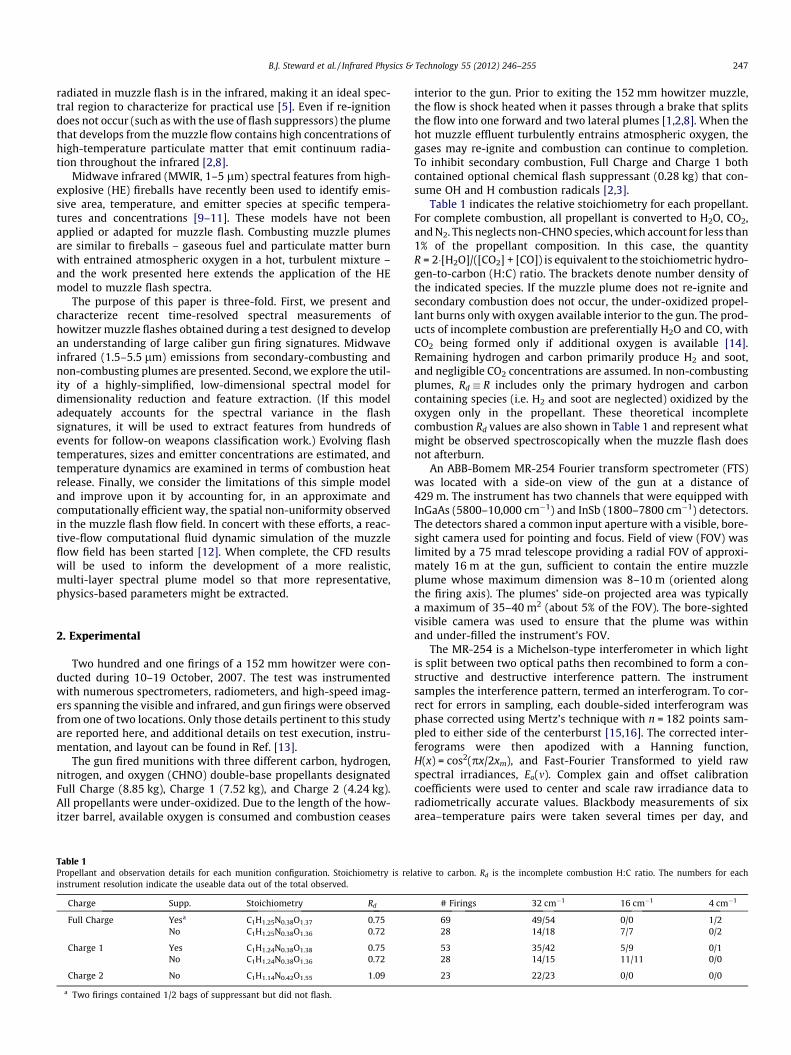
Peak spectra for both a combusting (unsuppressed) and non-combusting (suppressed) plume are shown in Fig. 2. The spectrafor all Full Charge, Charge 1, and Charge 2 munitions were notobviously different – likely because their propellant stoichiome-tries are similar – and are not distinguished in the work presentedhere. The plume filled at most 5% of the FOV, and background emis-sions account for <1% band-integrated intensity in combustingplumes and 5–15% in non-combusting. A background spectrum ac-quired at local, near-noon is included in Fig. 2 for reference. The
background was removed by subtracting the average of severalspectra acquired prior to the gun firing.
The muzzle plume’s emissions are detectable in the MWIRregardless of flash, but the magnitude and spectral characteristicsare highly dependent on whether combustion occurs. Non-com-busting plumes are dominated by continuum radiation throughoutmuch of the MWIR, and visible imagery shows the plumes to bedark and opaque, consistent with large concentrations of sootresulting from under-oxidized propellant [5–7]. Prior studies havefound that muzzle exhausts for fuel-rich propellants contain a highconcentration of particulates (105–108 cm�3) that emit continuumradiation [1,8].
If temperatures remain above 900–1000 K after atmosphericoxygen has been turbulently entrained into the muzzle flow, thenthe plume may re-ignite and propellant combustion by-productscan continue to burn to completion [1–3]. Combustion consumesthe particulate matter, which was previously found to vaporizenear 1000 K [8]. Products of vaporization and continued combus-tion of muzzle gases are primarily H2O, CO2, and N2 with traceCO, NOx, and species containing contaminants such as K, Na, Ca,and Cu [14]. Consumption of the particulates eliminates most ofthe graybody emissions, and the observed MWIR spectra showhighly structured features. This is also apparent in the visible imag-ery where the once sooty plume becomes transparent; for exam-ple, in Fig. 2 the howitzer’s barrel is clearly visible through thecombusting plume whereas it was completely obscured in thenon-combusting plume imagery.
Band-integrated total intensity is approximately ten timesgreater for combusting plumes, due to elevated temperatures andlarger emissive areas. Hot H2O and CO2 are particularly emissivein the MWIR, and account for a significant fraction of the observedintensity. Previous studies of explosive detonations have demon-strated that MWIR spectra can be used to estimate the H2O andCO2 concentrations in combusting HE fireballs using a low-dimen-sional radiative transfer model [10,11]. Although the timescales aredifferent – Fig. 1 showed muzzle plume combustion to be completein less than 100 ms whereas HE fireballs may last 0.5–5 s or longer[9,11,19] – the similarity in thermochemistry (if not kinetics), al-lows the HE model to be used to estimate temperature and concen-trations of H2O and CO2 from the muzzle flash spectra. In the caseof non-combusting plumes, the model can also be used to estimatetemperature for highly graybody emissions.
3.2. Spectral model
The HE model extracts the evolving temperature, emissive area,particulate emissivity, and column densities for H2O, CO2, and CO.This is accomplished by a least-squares fit of the HE model to mea-sured combustion spectra via non-linear regression. Spectra of fire-balls resulting from the detonation of high explosive materials aremodeled well in the 2500–7000 cm�1 range, with typical residualsof less than 5–10% [10,11]. The model is capable of estimating theH:C ratio, a key feature for event classification [10]. We now ex-plore the validity of this model for characterizing muzzle flashspectra.
The model assumes a homogeneous fireball in local thermody-namic equilibrium (LTE) and ignores both scattering and the trans-mission of background radiation through the source. Under thesesimplifying assumptions, the source spectral intensity is describedas:
Isðm; T;lÞ ¼ Aeðm; T;lÞBðm; TÞ ð1Þ
where A is the projected source area, eðm; TÞ ¼ 1� e�aðm;TÞ the sourceemissivity, and B(m;T) is the blackbody (Planckian) spectral radiance.
Under the ideal model assumptions, A represents the projectedarea of the fireball. It is simply a scale factor and will account for
Fig. 2. Peak observed spectra for combusting ( ) and non-combusting ( ) firings are shown. The left ordinate and image correspond to a combusting (unsuppressed) plumeand show significant spectral structure. The right ordinate and image correspond to a non-combusting (suppressed), optically thick plume. Combustion results in band-integrated MWIR intensities a factor of ten greater than non-combusting. A near-local noon background spectrum ( ) is also shown on the right ordinate. Atmospherictransmittance is shown in the lower panel. Major gaseous emission and absorption features are annotated.
1 CO2 line profiles are sensitive to line mixing and duration-of-collision effects,which result in non-Lorentzian pressure-broadended line shapes, and LBLRTM iscapable of accounting for these effects at atmospheric temperatures. Unfortunately,the authors are unaware of work in which these effects have been measured andaccurately modeled at combustion temperatures, so the Voigt approximation is usedin this work.
B.J. Steward et al. / Infrared Physics & Technology 55 (2012) 246–255 249
other effects such as radiometric calibration errors and uniformattenuation by particulates. Rather than fix the area to that ob-served in visible imagery, it was used as a fit parameter to enablethe model to most effectively account for the observed variationsin spectral intensity.
The absorbance, a, depends on the species-dependent absorp-tion cross-sections, ri(m), column densities, li = ni l, and soot absor-bance as:
aðm; TÞ ¼ as þX
i
riðm; TÞnil ð2Þ
where l is the optical path length, i the index for H2O, CO2, CH4, andCO species, and ni is the concentration of species i.
Generally, the absorption coefficient of soot is defined by theparticulate’s wavelength-dependent complex index of refraction,which is sensitive to both the chemical composition and porosity,and to a lesser extent, the soot particle size distribution [20]. Insome combustion systems, the wavelength dependence of as canbe empirically modeled as as � k�a where typically 0.7 < a < 2.2.In this work, we ignore the wavelength dependence of as. Thispragmatic, simplifying assumption was made to reduce the num-ber of model parameters to improve speed and convergence ofthe non-linear fits. (For a few non-combusting plumes, soot absor-bance was modeled as as = as,0k
�a and led to minimal improve-ments in fit quality. The additional degree of freedom via the aparameter was not statistically justified and led to unphysical val-ues near 0.2.)
Molecular absorption cross-sections ri were computed for CO2,CO, CH4 and H2O using the Line-by-Line Radiative Transfer Model(LBLRTM) [21]. The high-temperature extension (HITEMP) to theHITRAN spectroscopic database was used to model CO2, H2O andCO emission lines [22]. A high-temperature database for methane(CH4) is not currently available in a format suitable for LBLRTM,so lines from HITRAN were used in this work. These spectroscopicdatabases include information to compute both the strength andshape of emission lines. For all lines, a Voigt profile is computedand accounts for both Doppler-broadening (Gaussian) and
pressure-broadening (Lorentzian) effects.1 The cross-sections in-clude the Boltzmann factor for relative populations in each internalstate, so that ni represents the total concentration of the ith species.Details of the calculation are provided in references [10,11]. Thetemperatures, areas, soot emissivity, and species concentrationsare determined as a function of time from evolving spectra.
Intensities obtain via Eqs. (1) and (2) were sampled atDm = 0.0025 cm�1, the resolution at which the cross-sections werecalculated in LBLTRM. For comparison to the MR-254 spectra,instrument responses were calculated by propagating sourceintensities through atmosphere and convolving with the instru-ment lineshape (ILS):
ImðmÞ ¼Z 1
�1sðm0ÞIsðm0ÞILSðm� m0Þdm0 ¼ FfF�1fsðmÞIsðmÞgHðxÞg ð3Þ
Atmospheric attenuation, s(m), for the 429 m horizontal pathwas calculated using LBLRTM with the HITRAN database atDm = 0.0025 cm�1 resolution for the median atmospheric pressure(90,200 Pa), temperature (15.6 �C), and relative humidity (37%) re-corded during the test. Because the MR-254 is an interferometer,the convolution was implemented as the right-hand side of Eq.(3). The inverse Fast-Fourier Transform, F�1{}, converted the atten-uated, high-resolution source intensity to an interferogram thatwas then apodized with the Hanning function and Fourier Trans-formed, F{}, back to a spectrum. Resolution in a FTS is defined bythe maximum optical path difference (MOPD) between mirrors(Dm = 1/xm). By truncating the interferogram at xm = 0.032 cm,0.065 cm, or 0.259 cm, model intensities were obtained at thenominal 32 cm�1, 16 cm�1, or 4 cm�1 spectral resolutions. xm isbased on actual MOPD recorded during the test and does not ex-actly match the nominal resolutions.
0
100
200
300
400
500
2000 3000 4000 5000 6000−0.5
0.0
0.5
0
5
10
15
20
25
30
2000 3000 4000 5000 6000−0.5
0.0
0.5
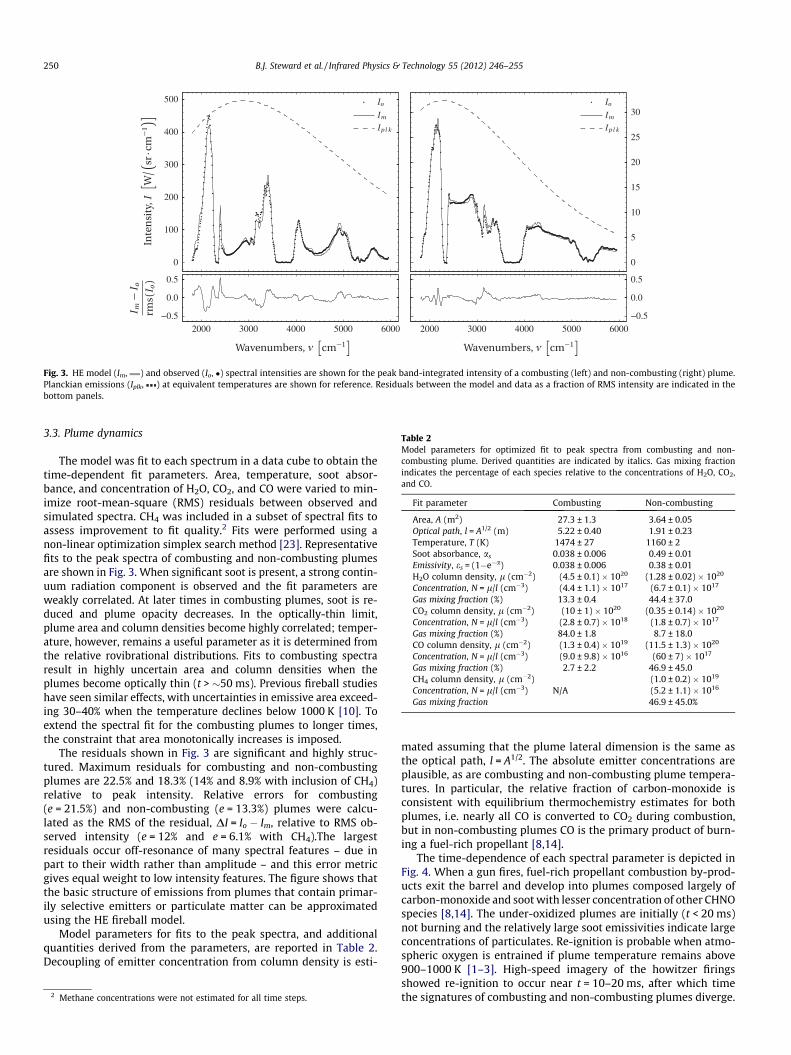
Fig. 3. HE model (Im, ) and observed (Io, �) spectral intensities are shown for the peak band-integrated intensity of a combusting (left) and non-combusting (right) plume.Planckian emissions (Iplk, ) at equivalent temperatures are shown for reference. Residuals between the model and data as a fraction of RMS intensity are indicated in thebottom panels.
Table 2Model parameters for optimized fit to peak spectra from combusting and non-combusting plume. Derived quantities are indicated by italics. Gas mixing fractionindicates the percentage of each species relative to the concentrations of H2O, CO2,and CO.
Fit parameter Combusting Non-combusting
Area, A (m2) 27.3 ± 1.3 3.64 ± 0.05Optical path, l = A1/2 (m) 5.22 ± 0.40 1.91 ± 0.23Temperature, T (K) 1474 ± 27 1160 ± 2Soot absorbance, as 0.038 ± 0.006 0.49 ± 0.01Emissivity, es = (1�e�a) 0.038 ± 0.006 0.38 ± 0.01H2O column density, l (cm�2) (4.5 ± 0.1) � 1020 (1.28 ± 0.02) � 1020
Concentration, N = l/l (cm�3) (4.4 ± 1.1) � 1017 (6.7 ± 0.1) � 1017
Gas mixing fraction (%) 13.3 ± 0.4 44.4 ± 37.0CO2 column density, l (cm�2) (10 ± 1) � 1020 (0.35 ± 0.14) � 1020
Concentration, N = l/l (cm�3) (2.8 ± 0.7) � 1018 (1.8 ± 0.7) � 1017
Gas mixing fraction (%) 84.0 ± 1.8 8.7 ± 18.0CO column density, l (cm�2) (1.3 ± 0.4) � 1019 (11.5 ± 1.3) � 1020
Concentration, N = l/l (cm�3) (9.0 ± 9.8) � 1016 (60 ± 7) � 1017
Gas mixing fraction (%) 2.7 ± 2.2 46.9 ± 45.0CH4 column density, l (cm�2) (1.0 ± 0.2) � 1019
Concentration, N = l/l (cm�3) N/A (5.2 ± 1.1) � 1016
Gas mixing fraction 46.9 ± 45.0%
250 B.J. Steward et al. / Infrared Physics & Technology 55 (2012) 246–255
3.3. Plume dynamics
The model was fit to each spectrum in a data cube to obtain thetime-dependent fit parameters. Area, temperature, soot absor-bance, and concentration of H2O, CO2, and CO were varied to min-imize root-mean-square (RMS) residuals between observed andsimulated spectra. CH4 was included in a subset of spectral fits toassess improvement to fit quality.2 Fits were performed using anon-linear optimization simplex search method [23]. Representativefits to the peak spectra of combusting and non-combusting plumesare shown in Fig. 3. When significant soot is present, a strong contin-uum radiation component is observed and the fit parameters areweakly correlated. At later times in combusting plumes, soot is re-duced and plume opacity decreases. In the optically-thin limit,plume area and column densities become highly correlated; temper-ature, however, remains a useful parameter as it is determined fromthe relative rovibrational distributions. Fits to combusting spectraresult in highly uncertain area and column densities when theplumes become optically thin (t > �50 ms). Previous fireball studieshave seen similar effects, with uncertainties in emissive area exceed-ing 30–40% when the temperature declines below 1000 K [10]. Toextend the spectral fit for the combusting plumes to longer times,the constraint that area monotonically increases is imposed.
The residuals shown in Fig. 3 are significant and highly struc-tured. Maximum residuals for combusting and non-combustingplumes are 22.5% and 18.3% (14% and 8.9% with inclusion of CH4)relative to peak intensity. Relative errors for combusting(e = 21.5%) and non-combusting (e = 13.3%) plumes were calcu-lated as the RMS of the residual, DI = Io � Im, relative to RMS ob-served intensity (e = 12% and e = 6.1% with CH4).The largestresiduals occur off-resonance of many spectral features – due inpart to their width rather than amplitude – and this error metricgives equal weight to low intensity features. The figure shows thatthe basic structure of emissions from plumes that contain primar-ily selective emitters or particulate matter can be approximatedusing the HE fireball model.
Model parameters for fits to the peak spectra, and additionalquantities derived from the parameters, are reported in Table 2.Decoupling of emitter concentration from column density is esti-
2 Methane concentrations were not estimated for all time steps.
mated assuming that the plume lateral dimension is the same asthe optical path, l = A1/2. The absolute emitter concentrations areplausible, as are combusting and non-combusting plume tempera-tures. In particular, the relative fraction of carbon-monoxide isconsistent with equilibrium thermochemistry estimates for bothplumes, i.e. nearly all CO is converted to CO2 during combustion,but in non-combusting plumes CO is the primary product of burn-ing a fuel-rich propellant [8,14].
The time-dependence of each spectral parameter is depicted inFig. 4. When a gun fires, fuel-rich propellant combustion by-prod-ucts exit the barrel and develop into plumes composed largely ofcarbon-monoxide and soot with lesser concentration of other CHNOspecies [8,14]. The under-oxidized plumes are initially (t < 20 ms)not burning and the relatively large soot emissivities indicate largeconcentrations of particulates. Re-ignition is probable when atmo-spheric oxygen is entrained if plume temperature remains above900–1000 K [1–3]. High-speed imagery of the howitzer firingsshowed re-ignition to occur near t = 10–20 ms, after which timethe signatures of combusting and non-combusting plumes diverge.
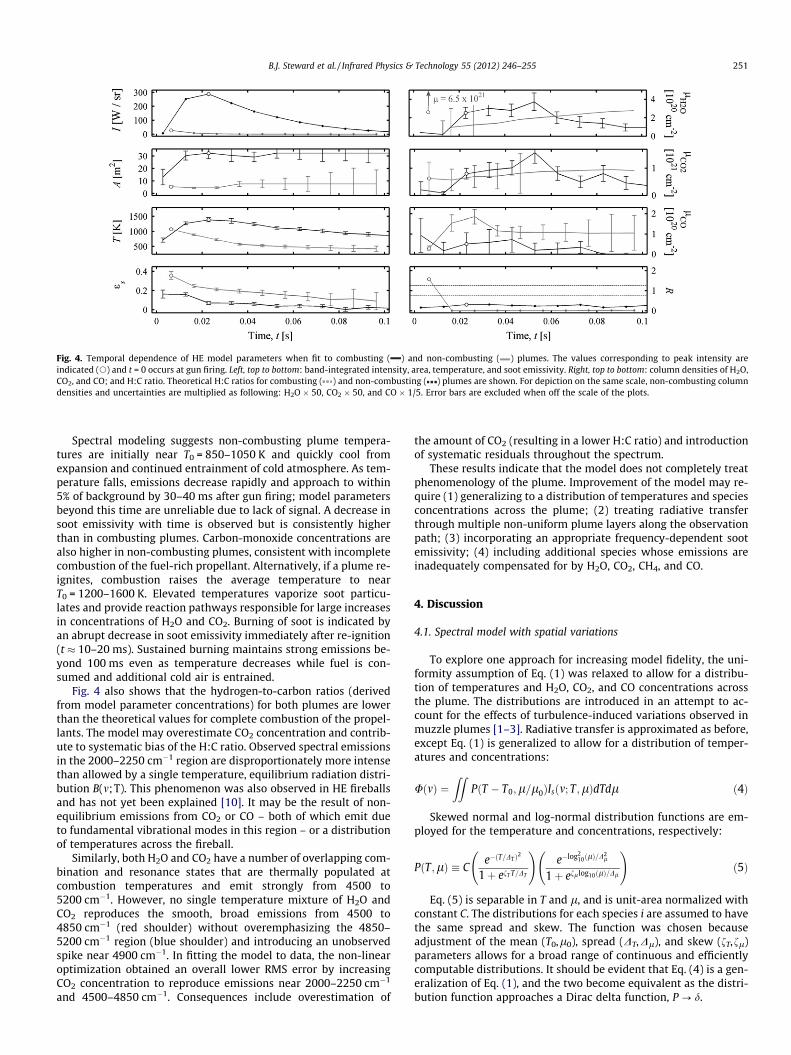
Fig. 4. Temporal dependence of HE model parameters when fit to combusting ( ) and non-combusting ( ) plumes. The values corresponding to peak intensity areindicated (s) and t = 0 occurs at gun firing. Left, top to bottom: band-integrated intensity, area, temperature, and soot emissivity. Right, top to bottom: column densities of H2O,CO2, and CO; and H:C ratio. Theoretical H:C ratios for combusting ( ) and non-combusting ( ) plumes are shown. For depiction on the same scale, non-combusting columndensities and uncertainties are multiplied as following: H2O � 50, CO2 � 50, and CO � 1/5. Error bars are excluded when off the scale of the plots.
B.J. Steward et al. / Infrared Physics & Technology 55 (2012) 246–255 251
Spectral modeling suggests non-combusting plume tempera-tures are initially near T0 = 850–1050 K and quickly cool fromexpansion and continued entrainment of cold atmosphere. As tem-perature falls, emissions decrease rapidly and approach to within5% of background by 30–40 ms after gun firing; model parametersbeyond this time are unreliable due to lack of signal. A decrease insoot emissivity with time is observed but is consistently higherthan in combusting plumes. Carbon-monoxide concentrations arealso higher in non-combusting plumes, consistent with incompletecombustion of the fuel-rich propellant. Alternatively, if a plume re-ignites, combustion raises the average temperature to nearT0 = 1200–1600 K. Elevated temperatures vaporize soot particu-lates and provide reaction pathways responsible for large increasesin concentrations of H2O and CO2. Burning of soot is indicated byan abrupt decrease in soot emissivity immediately after re-ignition(t 10–20 ms). Sustained burning maintains strong emissions be-yond 100 ms even as temperature decreases while fuel is con-sumed and additional cold air is entrained.
Fig. 4 also shows that the hydrogen-to-carbon ratios (derivedfrom model parameter concentrations) for both plumes are lowerthan the theoretical values for complete combustion of the propel-lants. The model may overestimate CO2 concentration and contrib-ute to systematic bias of the H:C ratio. Observed spectral emissionsin the 2000–2250 cm�1 region are disproportionately more intensethan allowed by a single temperature, equilibrium radiation distri-bution B(m;T). This phenomenon was also observed in HE fireballsand has not yet been explained [10]. It may be the result of non-equilibrium emissions from CO2 or CO – both of which emit dueto fundamental vibrational modes in this region – or a distributionof temperatures across the fireball.
Similarly, both H2O and CO2 have a number of overlapping com-bination and resonance states that are thermally populated atcombustion temperatures and emit strongly from 4500 to5200 cm�1. However, no single temperature mixture of H2O andCO2 reproduces the smooth, broad emissions from 4500 to4850 cm�1 (red shoulder) without overemphasizing the 4850–5200 cm�1 region (blue shoulder) and introducing an unobservedspike near 4900 cm�1. In fitting the model to data, the non-linearoptimization obtained an overall lower RMS error by increasingCO2 concentration to reproduce emissions near 2000–2250 cm�1
and 4500–4850 cm�1. Consequences include overestimation of
the amount of CO2 (resulting in a lower H:C ratio) and introductionof systematic residuals throughout the spectrum.
These results indicate that the model does not completely treatphenomenology of the plume. Improvement of the model may re-quire (1) generalizing to a distribution of temperatures and speciesconcentrations across the plume; (2) treating radiative transferthrough multiple non-uniform plume layers along the observationpath; (3) incorporating an appropriate frequency-dependent sootemissivity; (4) including additional species whose emissions areinadequately compensated for by H2O, CO2, CH4, and CO.
4. Discussion
4.1. Spectral model with spatial variations
To explore one approach for increasing model fidelity, the uni-formity assumption of Eq. (1) was relaxed to allow for a distribu-tion of temperatures and H2O, CO2, and CO concentrations acrossthe plume. The distributions are introduced in an attempt to ac-count for the effects of turbulence-induced variations observed inmuzzle plumes [1–3]. Radiative transfer is approximated as before,except Eq. (1) is generalized to allow for a distribution of temper-atures and concentrations:
UðmÞ ¼ZZ
PðT � T0;l=l0ÞIsðm; T;lÞdTdl ð4Þ
Skewed normal and log-normal distribution functions are em-ployed for the temperature and concentrations, respectively:
PðT;lÞ � Ce�ðT=DT Þ2
1þ efT T=DT
!e�log2
10ðlÞ=D2l
1þ efllog10ðlÞ=Dl
!ð5Þ
Eq. (5) is separable in T and l, and is unit-area normalized withconstant C. The distributions for each species i are assumed to havethe same spread and skew. The function was chosen becauseadjustment of the mean (T0,l0), spread (DT,Dl), and skew (fT,fl)parameters allows for a broad range of continuous and efficientlycomputable distributions. It should be evident that Eq. (4) is a gen-eralization of Eq. (1), and the two become equivalent as the distri-bution function approaches a Dirac delta function, P ? d.
252 B.J. Steward et al. / Infrared Physics & Technology 55 (2012) 246–255
In the optically thin limit (or for species each from independentlocations), the sum over species in Eq. (2) can be replaced by a sumof the intensities:
UðmÞ ffiX
i
ZZPðT � T0;l=liÞIsðm; T;liÞdTdli ð6Þ
The approximation of Eq. (6) is not satisfied for the plume’soptically thick conditions, but rather employed for conveniencein the computation.
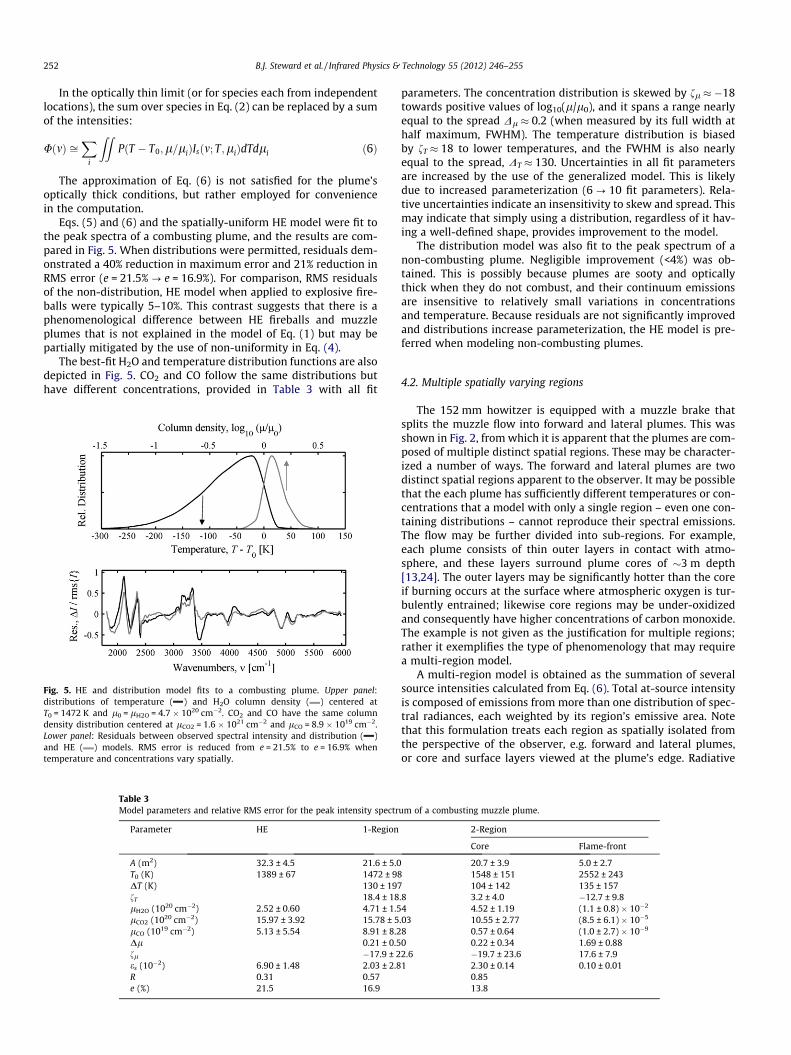
Eqs. (5) and (6) and the spatially-uniform HE model were fit tothe peak spectra of a combusting plume, and the results are com-pared in Fig. 5. When distributions were permitted, residuals dem-onstrated a 40% reduction in maximum error and 21% reduction inRMS error (e = 21.5% ? e = 16.9%). For comparison, RMS residualsof the non-distribution, HE model when applied to explosive fire-balls were typically 5–10%. This contrast suggests that there is aphenomenological difference between HE fireballs and muzzleplumes that is not explained in the model of Eq. (1) but may bepartially mitigated by the use of non-uniformity in Eq. (4).
The best-fit H2O and temperature distribution functions are alsodepicted in Fig. 5. CO2 and CO follow the same distributions buthave different concentrations, provided in Table 3 with all fit
Fig. 5. HE and distribution model fits to a combusting plume. Upper panel:distributions of temperature ( ) and H2O column density ( ) centered atT0 = 1472 K and l0 = lH2O = 4.7 � 1020 cm�2. CO2 and CO have the same columndensity distribution centered at lCO2 = 1.6 � 1021 cm�2 and lCO = 8.9 � 1019 cm�2.Lower panel: Residuals between observed spectral intensity and distribution ( )and HE ( ) models. RMS error is reduced from e = 21.5% to e = 16.9% whentemperature and concentrations vary spatially.
Table 3Model parameters and relative RMS error for the peak intensity spectr
Parameter HE 1-Region
A (m2) 32.3 ± 4.5 21.6 ± 5.0T0 (K) 1389 ± 67 1472 ± 98DT (K) 130 ± 197fT 18.4 ± 18lH2O (1020 cm�2) 2.52 ± 0.60 4.71 ± 1.5lCO2 (1020 cm�2) 15.97 ± 3.92 15.78 ± 5lCO (1019 cm�2) 5.13 ± 5.54 8.91 ± 8.2Dl 0.21 ± 0.5fl �17.9 ± 2es (10�2) 6.90 ± 1.48 2.03 ± 2.8R 0.31 0.57e (%) 21.5 16.9
parameters. The concentration distribution is skewed by fl �18towards positive values of log10(l/l0), and it spans a range nearlyequal to the spread Dl 0.2 (when measured by its full width athalf maximum, FWHM). The temperature distribution is biasedby fT 18 to lower temperatures, and the FWHM is also nearlyequal to the spread, DT 130. Uncertainties in all fit parametersare increased by the use of the generalized model. This is likelydue to increased parameterization (6 ? 10 fit parameters). Rela-tive uncertainties indicate an insensitivity to skew and spread. Thismay indicate that simply using a distribution, regardless of it hav-ing a well-defined shape, provides improvement to the model.
The distribution model was also fit to the peak spectrum of anon-combusting plume. Negligible improvement (<4%) was ob-tained. This is possibly because plumes are sooty and opticallythick when they do not combust, and their continuum emissionsare insensitive to relatively small variations in concentrationsand temperature. Because residuals are not significantly improvedand distributions increase parameterization, the HE model is pre-ferred when modeling non-combusting plumes.
4.2. Multiple spatially varying regions
The 152 mm howitzer is equipped with a muzzle brake thatsplits the muzzle flow into forward and lateral plumes. This wasshown in Fig. 2, from which it is apparent that the plumes are com-posed of multiple distinct spatial regions. These may be character-ized a number of ways. The forward and lateral plumes are twodistinct spatial regions apparent to the observer. It may be possiblethat the each plume has sufficiently different temperatures or con-centrations that a model with only a single region – even one con-taining distributions – cannot reproduce their spectral emissions.The flow may be further divided into sub-regions. For example,each plume consists of thin outer layers in contact with atmo-sphere, and these layers surround plume cores of �3 m depth[13,24]. The outer layers may be significantly hotter than the coreif burning occurs at the surface where atmospheric oxygen is tur-bulently entrained; likewise core regions may be under-oxidizedand consequently have higher concentrations of carbon monoxide.The example is not given as the justification for multiple regions;rather it exemplifies the type of phenomenology that may requirea multi-region model.
A multi-region model is obtained as the summation of severalsource intensities calculated from Eq. (6). Total at-source intensityis composed of emissions from more than one distribution of spec-tral radiances, each weighted by its region’s emissive area. Notethat this formulation treats each region as spatially isolated fromthe perspective of the observer, e.g. forward and lateral plumes,or core and surface layers viewed at the plume’s edge. Radiative
um of a combusting muzzle plume.
2-Region
Core Flame-front
20.7 ± 3.9 5.0 ± 2.71548 ± 151 2552 ± 243104 ± 142 135 ± 157
.8 3.2 ± 4.0 �12.7 ± 9.84 4.52 ± 1.19 (1.1 ± 0.8) � 10�2
.03 10.55 ± 2.77 (8.5 ± 6.1) � 10�5
8 0.57 ± 0.64 (1.0 ± 2.7) � 10�9
0 0.22 ± 0.34 1.69 ± 0.882.6 �19.7 ± 23.6 17.6 ± 7.91 2.30 ± 0.14 0.10 ± 0.01
0.8513.8
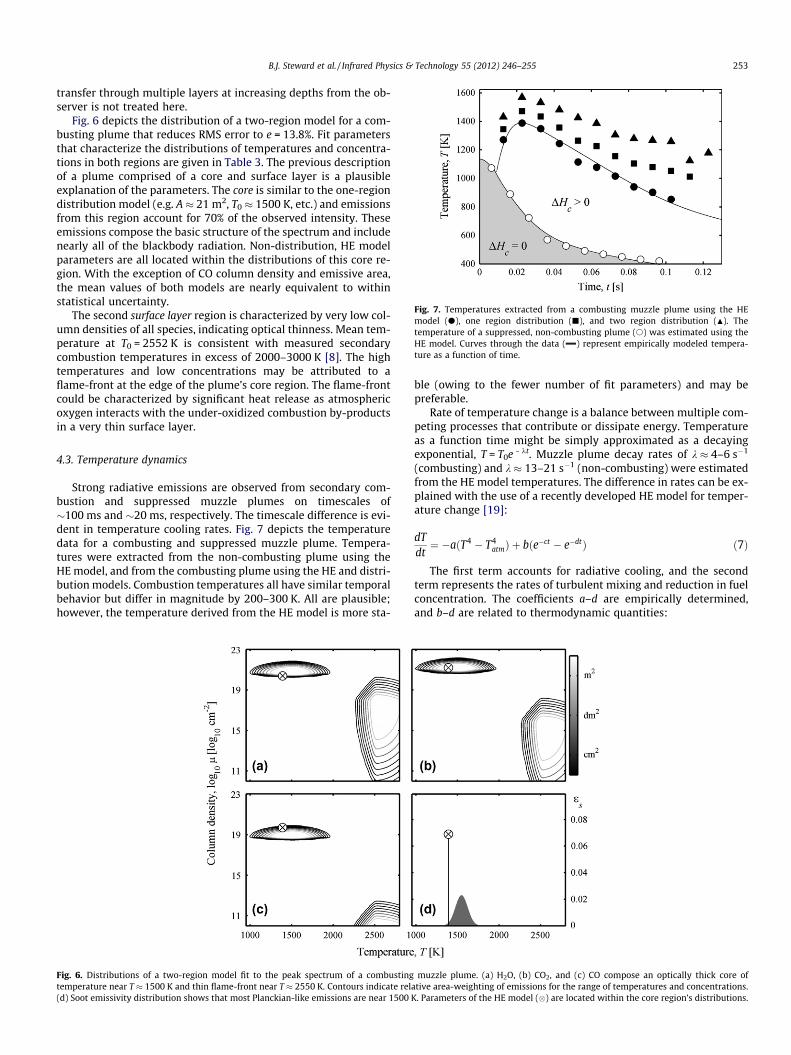
Fig. 7. Temperatures extracted from a combusting muzzle plume using the HEmodel (d), one region distribution (j), and two region distribution (N). Thetemperature of a suppressed, non-combusting plume (s) was estimated using theHE model. Curves through the data ( ) represent empirically modeled tempera-ture as a function of time.
B.J. Steward et al. / Infrared Physics & Technology 55 (2012) 246–255 253
transfer through multiple layers at increasing depths from the ob-server is not treated here.
Fig. 6 depicts the distribution of a two-region model for a com-busting plume that reduces RMS error to e = 13.8%. Fit parametersthat characterize the distributions of temperatures and concentra-tions in both regions are given in Table 3. The previous descriptionof a plume comprised of a core and surface layer is a plausibleexplanation of the parameters. The core is similar to the one-regiondistribution model (e.g. A 21 m2, T0 1500 K, etc.) and emissionsfrom this region account for 70% of the observed intensity. Theseemissions compose the basic structure of the spectrum and includenearly all of the blackbody radiation. Non-distribution, HE modelparameters are all located within the distributions of this core re-gion. With the exception of CO column density and emissive area,the mean values of both models are nearly equivalent to withinstatistical uncertainty.
The second surface layer region is characterized by very low col-umn densities of all species, indicating optical thinness. Mean tem-perature at T0 = 2552 K is consistent with measured secondarycombustion temperatures in excess of 2000–3000 K [8]. The hightemperatures and low concentrations may be attributed to aflame-front at the edge of the plume’s core region. The flame-frontcould be characterized by significant heat release as atmosphericoxygen interacts with the under-oxidized combustion by-productsin a very thin surface layer.
4.3. Temperature dynamics
Strong radiative emissions are observed from secondary com-bustion and suppressed muzzle plumes on timescales of�100 ms and �20 ms, respectively. The timescale difference is evi-dent in temperature cooling rates. Fig. 7 depicts the temperaturedata for a combusting and suppressed muzzle plume. Tempera-tures were extracted from the non-combusting plume using theHE model, and from the combusting plume using the HE and distri-bution models. Combustion temperatures all have similar temporalbehavior but differ in magnitude by 200–300 K. All are plausible;however, the temperature derived from the HE model is more sta-
Fig. 6. Distributions of a two-region model fit to the peak spectrum of a combustingtemperature near T 1500 K and thin flame-front near T 2550 K. Contours indicate rel(d) Soot emissivity distribution shows that most Planckian-like emissions are near 1500 K
ble (owing to the fewer number of fit parameters) and may bepreferable.
Rate of temperature change is a balance between multiple com-peting processes that contribute or dissipate energy. Temperatureas a function time might be simply approximated as a decayingexponential, T = T0e - kt. Muzzle plume decay rates of k 4–6 s�1
(combusting) and k 13–21 s�1 (non-combusting) were estimatedfrom the HE model temperatures. The difference in rates can be ex-plained with the use of a recently developed HE model for temper-ature change [19]:
dTdt¼ �aðT4 � T4
atmÞ þ bðe�ct � e�dtÞ ð7Þ
The first term accounts for radiative cooling, and the secondterm represents the rates of turbulent mixing and reduction in fuelconcentration. The coefficients a–d are empirically determined,and b–d are related to thermodynamic quantities:
muzzle plume. (a) H2O, (b) CO2, and (c) CO compose an optically thick core ofative area-weighting of emissions for the range of temperatures and concentrations.
. Parameters of the HE model (�) are located within the core region’s distributions.
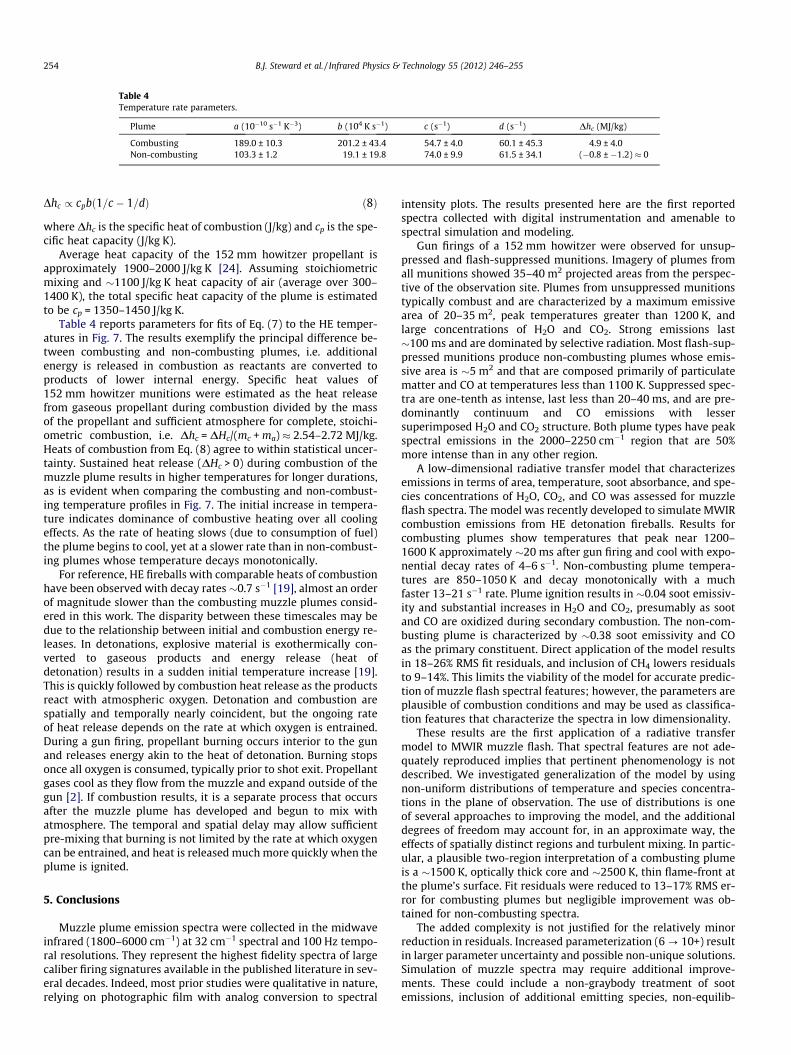
Table 4Temperature rate parameters.
Plume a (10�10 s�1 K�3) b (104 K s�1) c (s�1) d (s�1) Dhc (MJ/kg)
Combusting 189.0 ± 10.3 201.2 ± 43.4 54.7 ± 4.0 60.1 ± 45.3 4.9 ± 4.0Non-combusting 103.3 ± 1.2 19.1 ± 19.8 74.0 ± 9.9 61.5 ± 34.1 (�0.8 ± �1.2) 0
254 B.J. Steward et al. / Infrared Physics & Technology 55 (2012) 246–255
Dhc / cpbð1=c � 1=dÞ ð8Þ
where Dhc is the specific heat of combustion (J/kg) and cp is the spe-cific heat capacity (J/kg K).
Average heat capacity of the 152 mm howitzer propellant isapproximately 1900–2000 J/kg K [24]. Assuming stoichiometricmixing and �1100 J/kg K heat capacity of air (average over 300–1400 K), the total specific heat capacity of the plume is estimatedto be cp = 1350–1450 J/kg K.
Table 4 reports parameters for fits of Eq. (7) to the HE temper-atures in Fig. 7. The results exemplify the principal difference be-tween combusting and non-combusting plumes, i.e. additionalenergy is released in combustion as reactants are converted toproducts of lower internal energy. Specific heat values of152 mm howitzer munitions were estimated as the heat releasefrom gaseous propellant during combustion divided by the massof the propellant and sufficient atmosphere for complete, stoichi-ometric combustion, i.e. Dhc = DHc/(mc + ma) 2.54–2.72 MJ/kg.Heats of combustion from Eq. (8) agree to within statistical uncer-tainty. Sustained heat release (DHc > 0) during combustion of themuzzle plume results in higher temperatures for longer durations,as is evident when comparing the combusting and non-combust-ing temperature profiles in Fig. 7. The initial increase in tempera-ture indicates dominance of combustive heating over all coolingeffects. As the rate of heating slows (due to consumption of fuel)the plume begins to cool, yet at a slower rate than in non-combust-ing plumes whose temperature decays monotonically.
For reference, HE fireballs with comparable heats of combustionhave been observed with decay rates �0.7 s�1 [19], almost an orderof magnitude slower than the combusting muzzle plumes consid-ered in this work. The disparity between these timescales may bedue to the relationship between initial and combustion energy re-leases. In detonations, explosive material is exothermically con-verted to gaseous products and energy release (heat ofdetonation) results in a sudden initial temperature increase [19].This is quickly followed by combustion heat release as the productsreact with atmospheric oxygen. Detonation and combustion arespatially and temporally nearly coincident, but the ongoing rateof heat release depends on the rate at which oxygen is entrained.During a gun firing, propellant burning occurs interior to the gunand releases energy akin to the heat of detonation. Burning stopsonce all oxygen is consumed, typically prior to shot exit. Propellantgases cool as they flow from the muzzle and expand outside of thegun [2]. If combustion results, it is a separate process that occursafter the muzzle plume has developed and begun to mix withatmosphere. The temporal and spatial delay may allow sufficientpre-mixing that burning is not limited by the rate at which oxygencan be entrained, and heat is released much more quickly when theplume is ignited.
5. Conclusions
Muzzle plume emission spectra were collected in the midwaveinfrared (1800–6000 cm�1) at 32 cm�1 spectral and 100 Hz tempo-ral resolutions. They represent the highest fidelity spectra of largecaliber firing signatures available in the published literature in sev-eral decades. Indeed, most prior studies were qualitative in nature,relying on photographic film with analog conversion to spectral
intensity plots. The results presented here are the first reportedspectra collected with digital instrumentation and amenable tospectral simulation and modeling.
Gun firings of a 152 mm howitzer were observed for unsup-pressed and flash-suppressed munitions. Imagery of plumes fromall munitions showed 35–40 m2 projected areas from the perspec-tive of the observation site. Plumes from unsuppressed munitionstypically combust and are characterized by a maximum emissivearea of 20–35 m2, peak temperatures greater than 1200 K, andlarge concentrations of H2O and CO2. Strong emissions last�100 ms and are dominated by selective radiation. Most flash-sup-pressed munitions produce non-combusting plumes whose emis-sive area is �5 m2 and that are composed primarily of particulatematter and CO at temperatures less than 1100 K. Suppressed spec-tra are one-tenth as intense, last less than 20–40 ms, and are pre-dominantly continuum and CO emissions with lessersuperimposed H2O and CO2 structure. Both plume types have peakspectral emissions in the 2000–2250 cm�1 region that are 50%more intense than in any other region.
A low-dimensional radiative transfer model that characterizesemissions in terms of area, temperature, soot absorbance, and spe-cies concentrations of H2O, CO2, and CO was assessed for muzzleflash spectra. The model was recently developed to simulate MWIRcombustion emissions from HE detonation fireballs. Results forcombusting plumes show temperatures that peak near 1200–1600 K approximately �20 ms after gun firing and cool with expo-nential decay rates of 4–6 s�1. Non-combusting plume tempera-tures are 850–1050 K and decay monotonically with a muchfaster 13–21 s�1 rate. Plume ignition results in �0.04 soot emissiv-ity and substantial increases in H2O and CO2, presumably as sootand CO are oxidized during secondary combustion. The non-com-busting plume is characterized by �0.38 soot emissivity and COas the primary constituent. Direct application of the model resultsin 18–26% RMS fit residuals, and inclusion of CH4 lowers residualsto 9–14%. This limits the viability of the model for accurate predic-tion of muzzle flash spectral features; however, the parameters areplausible of combustion conditions and may be used as classifica-tion features that characterize the spectra in low dimensionality.
These results are the first application of a radiative transfermodel to MWIR muzzle flash. That spectral features are not ade-quately reproduced implies that pertinent phenomenology is notdescribed. We investigated generalization of the model by usingnon-uniform distributions of temperature and species concentra-tions in the plane of observation. The use of distributions is oneof several approaches to improving the model, and the additionaldegrees of freedom may account for, in an approximate way, theeffects of spatially distinct regions and turbulent mixing. In partic-ular, a plausible two-region interpretation of a combusting plumeis a �1500 K, optically thick core and �2500 K, thin flame-front atthe plume’s surface. Fit residuals were reduced to 13–17% RMS er-ror for combusting plumes but negligible improvement was ob-tained for non-combusting spectra.
The added complexity is not justified for the relatively minorreduction in residuals. Increased parameterization (6 ? 10+) resultin larger parameter uncertainty and possible non-unique solutions.Simulation of muzzle spectra may require additional improve-ments. These could include a non-graybody treatment of sootemissions, inclusion of additional emitting species, non-equilib-
B.J. Steward et al. / Infrared Physics & Technology 55 (2012) 246–255 255
rium rovibrational distributions, or treating radiative transferthrough non-uniformity along the path of observation. Improve-ments are desired because parameters that describe phenomenol-ogy of the plume in low dimensionality may be used tocharacterize the source of firing emissions. Without such parame-ters, distinguishing between different firing signatures relies onempirical features that are not always readily understood.
Modeling of temperature rate of change with time demon-strated greater success. Suppressed plume temperatures decay to500–800 K within �20 ms, whereas to reach the same temperaturerequires �100 ms or longer in combusting plumes. The differencein timescale results from energy released during combustion.When combustion occurs, the temperature of the plume is initiallyincreased and cooling is slowed. Heat of combustion near �5 MJ/kgwas estimated from the model and agrees to within a factor of twowith predicted specific heat values for a stoichiometric plume andcomplete combustion. For comparison, detonation fireballs coolnearly an order of magnitude more quickly for comparable specificheats of combustion. Fireball burn rates are dependent upon rate ofoxygen entrainment, and spatial and temporal separation of initialpropellant burning from plume combustion in muzzle plumes mayallow pre-mixing that accounts for the difference in rates.
References
[1] G. Klingenberg, Gun Muzzle Blast and Flash, Propell. Explos. Pyrotech. 14(1989) 57–68.
[2] J.M. Heimerl, G.E. Keller, G. Klingenberg, Muzzle flash kinetics and modeling,in: L. Stiefel (Ed.), Gun Propulsion Technology, AIAA, Washington DC, 1988, pp.261–310.
[3] V. Yousefian, I.W. May, J.M. Heimerl, Modeling the occurrence of muzzle flashin guns, in: 17th JANNAF Combustion Meeting, Hampton, VA, 22–26September, 1980.
[4] G. Klingenberg, J.M. Heimerl, Gun Muzzle Blast and Flash, AIAA, WashingtonDC, 1992. pp. 397–412.
[5] Engineering Design Handbook: Spectral Characteristics of Muzzle Flash,AMCP-706-255 (AD818532), HQ Army Materiel Command, Washington DC,June 1967.
[6] J.T. Agnew, Basic and Technical Work on Military Propellants, ADB803102, TheFranklin Institute, Philadelphia, PA, December 1949.
[7] R. Ladenberg, Report on Muzzle Flash, Report No. 426, Army ResearchLaboratory, Aberdeen Proving Ground, MD, November 1943.
[8] G. Klingenberg, Experimental diagnostics in reacting muzzle flows, in: L. Stiefel(Ed.), Gun Propulsion Technology, AIAA, Washington DC, 1988, pp. 183–259.
[9] J.A. Orson, W.F. Bagby, G.P. Perram, Infrared signatures from bombdetonations, Infrared Phys. Technol. 44 (2003) 101–107.
[10] K.C. Gross, Phenomenological Model for Infrared Emissions from High-Explosive Detonation Fireballs, PhD Dissertation, Air Force Institute ofTechnology, Wright-Patterson AFB OH, September 2007.
[11] K.C. Gross, J. Wayman, G.P. Perram, Phenomenological fireball model forremote identification of high-explosives, Proc. SPIE 6566 (2007) 656613.
[12] M.C. DeMagistris, N. Sinha, B.J. Steward, 3-D modeling of a large caliber gunmuzzle flash, in: 31st JANNAF Exhaust Plume Technology SubcommitteeMeeting, Wright-Patterson AFB, OH, 2009.
[13] B.J. Steward, K.C. Gross, G.P. Perram, Reduction of optically observed artilleryblast wave trajectories using low dimensionality models, Proc. SPIE 8020(2011) 80200D.
[14] P.W. Cooper, Explosives Engineering, Wiley-VCH, New York, 1997. p. 22.[15] L. Mertz, On the phase spectra of interferograms, J. Phys. Colloq. 28 (1967) C2-
11-13.[16] P.R. Griffiths, J.A. de Haseth, Fourier Transform Infrared Spectroscopy, Wiley-
Interscience, New York, 2007. pp. 85–88.[17] H. Kick, V. Tank, E. Lindermeir, Impact of scene changes during data acquisition
in fourier spectroscopy, J. Quant. Spectrosc. Radiat. Transfer 92 (2005) 447–455.
[18] K.C. Gross, A.M. Young, C. Borel, B.J. Steward, G.P. Perram, Simulatingsystematic scene-change artifacts in fourier-transform spectroscopy, Proc.SPIE 7695 (2010) 76951Y.
[19] J.M. Gordon, K.C. Gross, G.P. Perram, Empirical model for the temporallyresolved temperatures of post-detonation fireballs for aluminized highexplosives, Proc. SPIE 8018 (2011) 80181M.
[20] M.F. Modest, Radiative Heat Transfer, McGraw-Hill, Inc., New York, 1993.[21] S.A. Clough, M.W. Shephard, E.J. Mlawer, J.S. Delamere, M.J. Iacono,
Atmospheric radiative transfer modeling: a summary of the AER codes, J.Quant. Spectrosc. Radiat. Transfer 91 (2005) 233–244.
[22] L.S. Rothman, I.E. Gordon, R.J. Barber, H. Dothe, R.R. Gamache, A. Goldman, V.I.Perevalov, T.A. Tashkun, J. Tennyson, HITEMP, the high-temperature molecularspectroscopic database, J. Quant. Spectrosc. Radiat. Transfer 111 (2010) 2139–2150.
[23] J.C. Lagarias, J.A. Reeds, M.H. Wright, P.E. Wright, Convergence properties ofthe nelder-mead simplex method in low dimensions, SIAM J. Optim. (1998)112–147.
[24] B.J. Steward, K.C. Gross, G.P. Perram, Optical characterization of large calibermuzzle blast waves, Propell. Explos. Pyrotech. 36 (2011) 564–575.


