Modeling Material Plastic and Viscous Flow Effects in TSV ...
30
Aditya Karmarkar 1 , Xiaopeng Xu 1 , Karim El Sayed 1 Wei Guo 2 , Geert Van der Plas 2 , Stefaan Van Huylenbroeck 2 , Mario Gonzalez 2 , Philippe Absil 2 , Eric Beyne 2 1 Synopsys, Inc., Mountain View, California, USA 2 IMEC, Kapeldreef 75, Leuven, Belgium June 1, 2016 Modeling Material Plastic and Viscous Flow Effects in TSV-middle and Backside TSV-last Processes 14th International Conference on Reliability and Stress-Related Phenomena in Nanoelectronics – Experiment and Simulation
Transcript of Modeling Material Plastic and Viscous Flow Effects in TSV ...
Aditya Karmarkar1, Xiaopeng Xu1, Karim El Sayed1
Wei Guo2, Geert Van der Plas2, Stefaan Van Huylenbroeck2,
Mario Gonzalez2, Philippe Absil2, Eric Beyne2
1Synopsys, Inc., Mountain View, California, USA
2IMEC, Kapeldreef 75, Leuven, Belgium
June 1, 2016
Modeling Material Plastic and Viscous
Flow Effects in TSV-middle and Backside
TSV-last Processes
14th International Conference on Reliability and Stress-Related Phenomena in
Nanoelectronics – Experiment and Simulation

© 2016 Synopsys, Inc. 2
Agenda
Introduction
Material model characterization
TSV stress effects on performance and reliability
Summary

© 2016 Synopsys, Inc. 3
Introduction: TSV integration
ULK
ULK
TSV
V0 V0
M1
V1
M2
X-section of TSV advanced CMOS technology integration
• 3D IC with TSV: provides high integration density; allows heterogeneous integration, improves system performance
• Integration options
Cu
Si
W. Guo, et al
IMEC/Synopsys
ECTC 2015
© 2016 Synopsys, Inc. 4
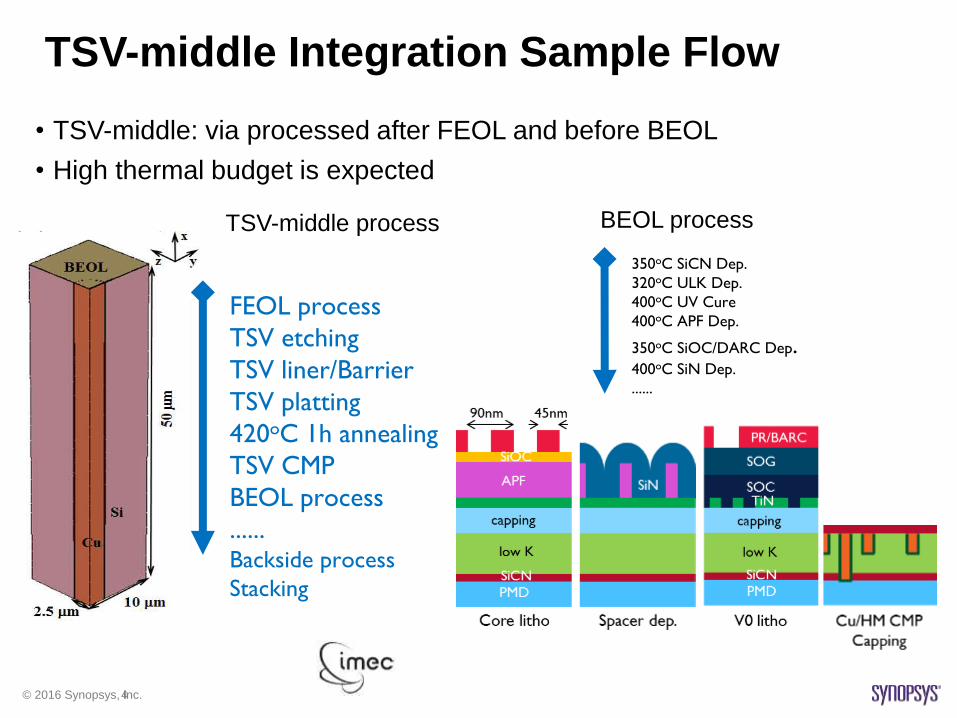
TSV-middle Integration Sample Flow
• TSV-middle: via processed after FEOL and before BEOL
• High thermal budget is expected
FEOL process
TSV etching
TSV liner/Barrier
TSV platting
420oC 1h annealing
TSV CMP
BEOL process
......Backside process
Stacking
350oC SiCN Dep.
320oC ULK Dep.
400oC UV Cure
400oC APF Dep.
350oC SiOC/DARC Dep.400oC SiN Dep.
......
TSV-middle process BEOL process
© 2016 Synopsys, Inc. 5
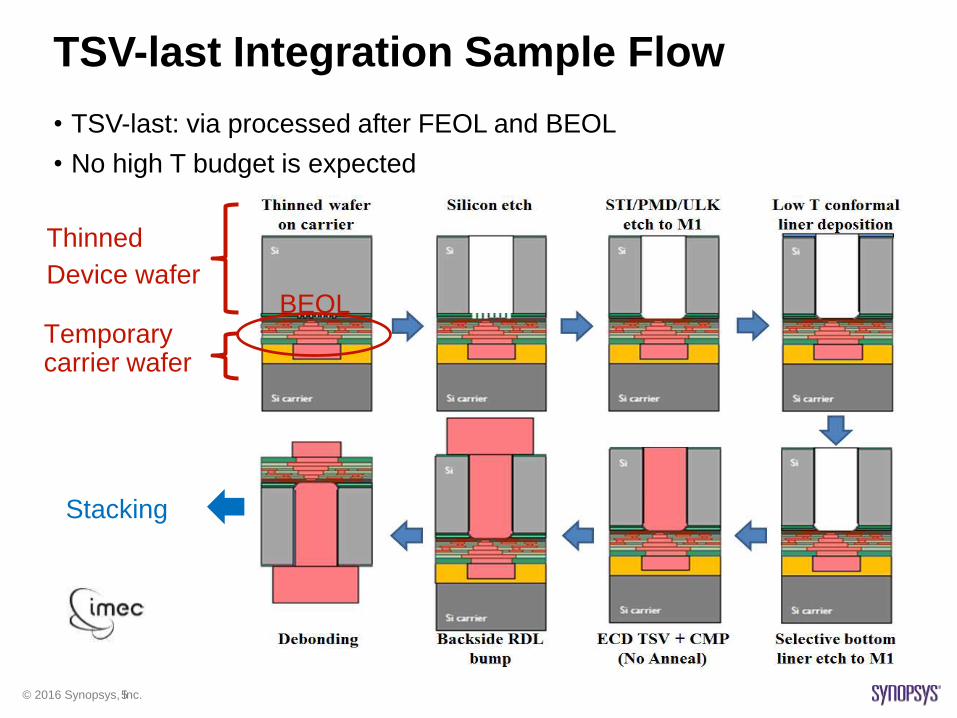
TSV-last Integration Sample Flow
• TSV-last: via processed after FEOL and BEOL
• No high T budget is expected
Temporary carrier wafer
Thinned
Device waferBEOL
Stacking
© 2016 Synopsys, Inc. 6
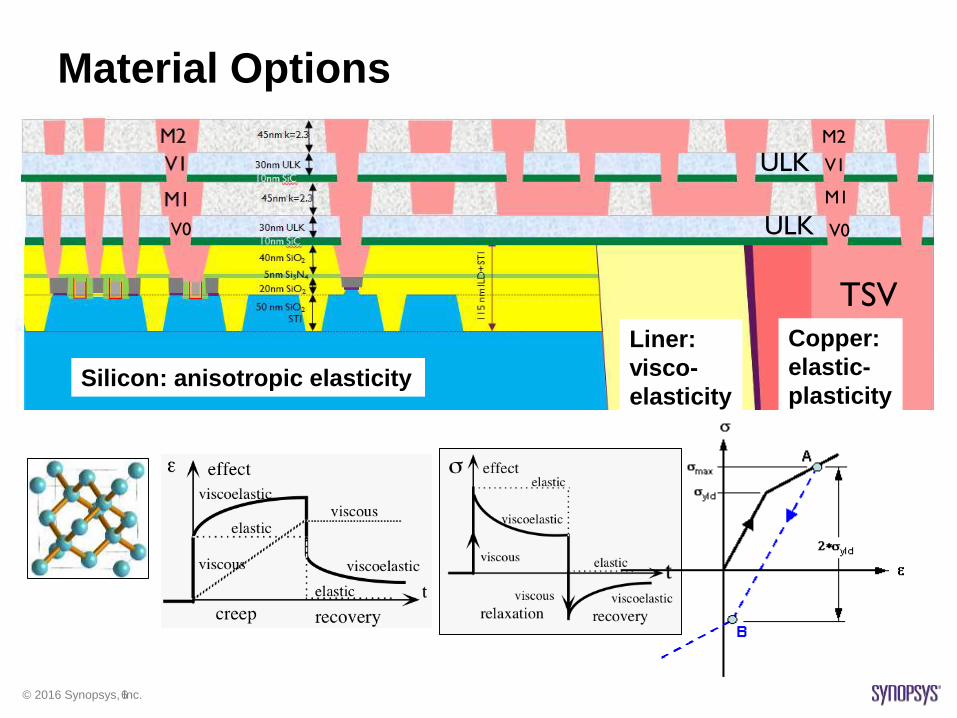
Material Options
ULK
ULK
TSV
V0 V0
M1
V1
M2
Silicon: anisotropic elasticity
Liner:
visco-
elasticity
Copper:
elastic-
plasticity

© 2016 Synopsys, Inc. 7
TSV Integration Considerations
ULK
ULK
TSV
• How TSV integration process and material
options affect FEOL and BEOL
• Capabilities for analysis and optimization
V0 V0
M1
V1
M2
Source: GlobalFoundries, ECTC 2015
FEOL performance
BEOL performance
and reliability
© 2016 Synopsys, Inc. 8
Agenda
Introduction
Material model characterization
TSV stress effects on performance and reliability
Summary
© 2016 Synopsys, Inc. 9
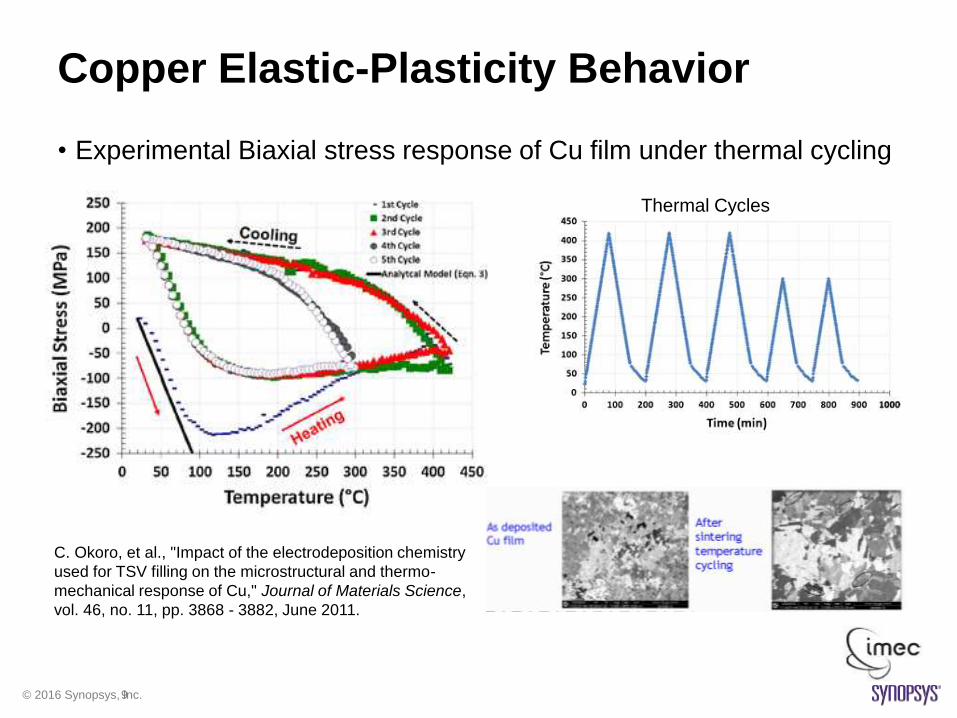
Copper Elastic-Plasticity Behavior
• Experimental Biaxial stress response of Cu film under thermal cycling
C. Okoro, et al., "Impact of the electrodeposition chemistry
used for TSV filling on the microstructural and thermo-
mechanical response of Cu," Journal of Materials Science,
vol. 46, no. 11, pp. 3868 - 3882, June 2011.
Thermal Cycles

© 2016 Synopsys, Inc. 10
Nonlinear Plasticity with Isotropic and
Kinematic Hardening
• Isotropic hardening
–Exponential hardening
–New yield stress:
𝜎𝑦 = 𝜎𝑦0 + 𝑅 1 − 𝑒𝑥𝑝 −𝑏𝛼–Material parameters:
– Initial yield stress (𝜎𝑦0)
– R
– b
• Kinematic hardening
–Nonlinear hardening
–Back stress:
ሶ𝑞𝑖𝑗 = 𝐻𝑘𝑖𝑛𝑛𝑖𝑗 −23𝐻𝑘𝑁𝐿𝑞𝑖𝑗 ሶ𝛼
–Material parameters:
– Hkin (𝐻𝑘𝑖𝑛)
– HNLkin (𝐻𝑘𝑁𝐿)
ε
σ
σaσb
σcσd
oHiso

© 2016 Synopsys, Inc. 11
Elastic-Plasticity Model Calibration for Copper
• Incremental plasticity model with nonlinear hardening can match
measured data from thermal cycles
Thermal Cycle 1
Cycle 2 Cycle 3
Cu stress highly depends on the
thermal history of integration flow.
W. Guo, et al, IMEC/Synopsys, ECTC 2015

© 2016 Synopsys, Inc. 12
Dieletrics Visco-Elasticity Behavior
0
10
20
30
40
50
60
70
80
0 20 40 60 80 100 120 140
Szz (M
Pa)
Temperature (C)
strain = 0.4%
strain = 0.8%
strain = 1.2%
1.0E+06
1.0E+08
1.0E+10
1.0E+12
1.0E+14
200 400 600 800 1000
Vis
co
sit
y (P
ois
e)
Temperature (K)
• Stress relaxation at elevated temperatures
Liner stress highly depends on the
thermal history of integration flow.
© 2016 Synopsys, Inc. 13
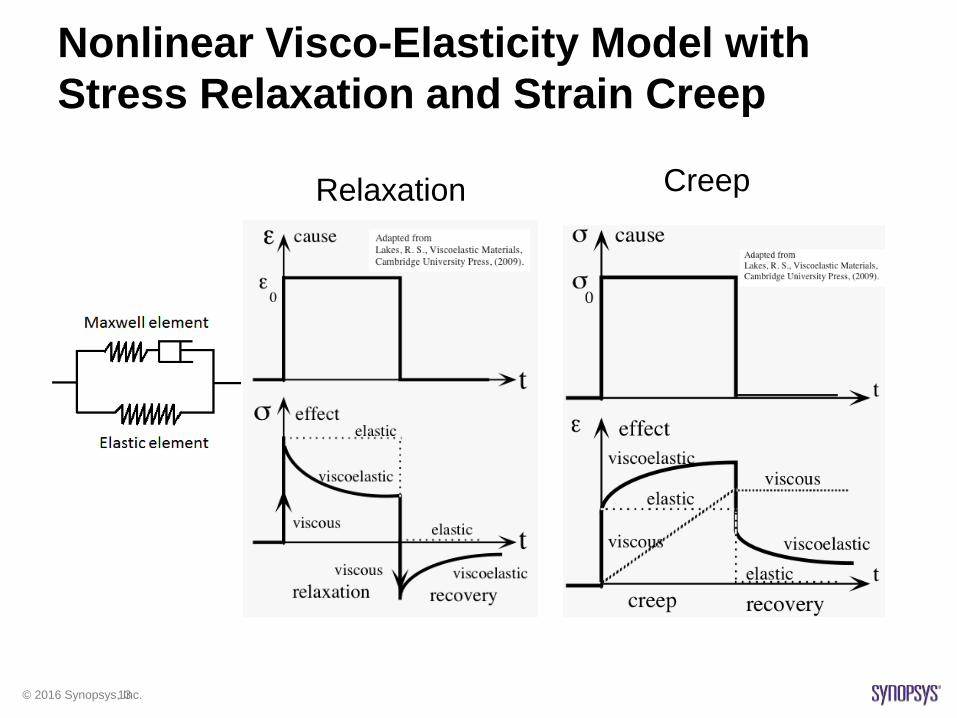
Nonlinear Visco-Elasticity Model with
Stress Relaxation and Strain Creep
CreepRelaxation
© 2016 Synopsys, Inc. 14
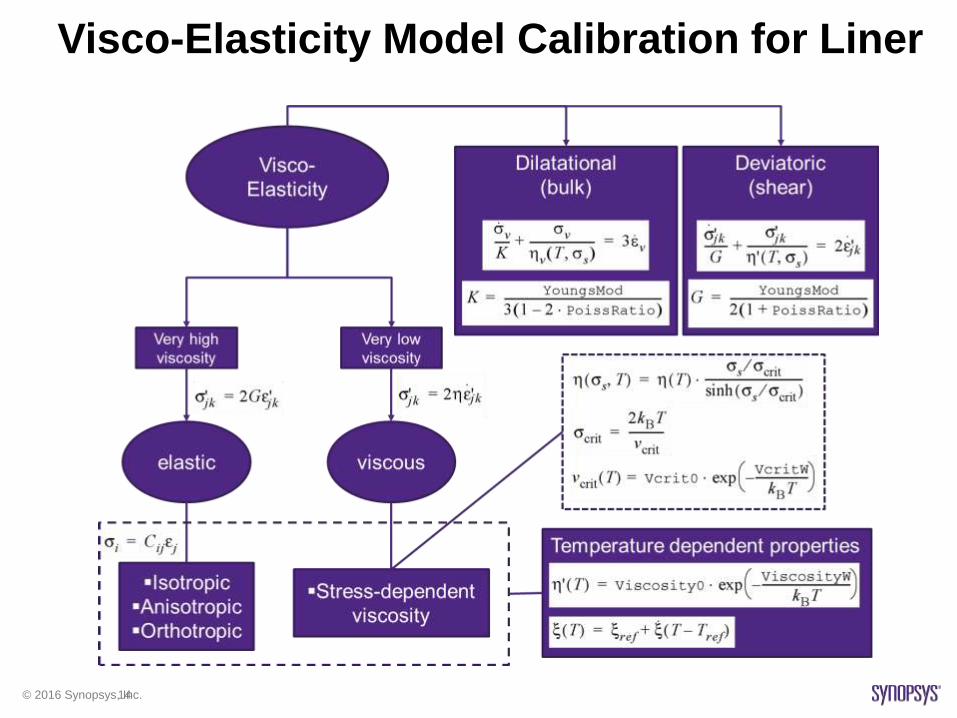
Visco-Elasticity Model Calibration for Liner

© 2016 Synopsys, Inc. 15
1st and 2nd Order Piezo-Resistance Models
[001] Surface nMOS [001] Surface pMOS
Piezo coefficients depend on
crystal orientation, carrier type
and stress magnitude
D1
D2
D3
HoleElectron
Band structure calculation
Sum of FinFET
stress + TSV stress
is in the nonlinear
range. Linear
approximation works
for low stress

© 2016 Synopsys, Inc. 16
Agenda
Introduction
Material model characterization
TSV stress effects on performance and reliability
Summary
© 2016 Synopsys, Inc. 17
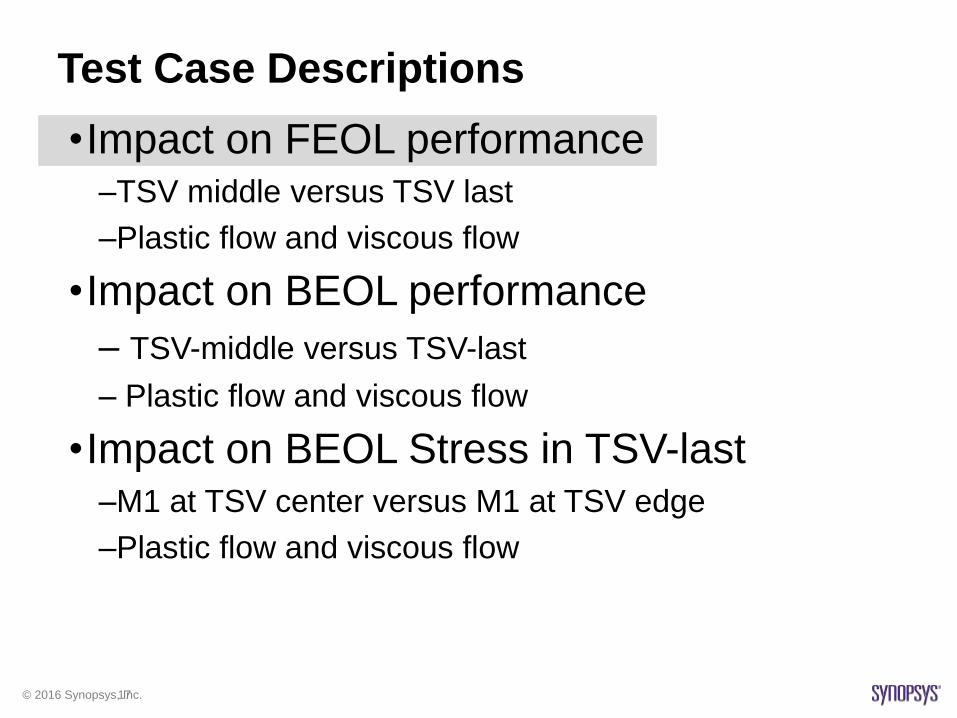
Test Case Descriptions
•Impact on FEOL performance–TSV middle versus TSV last
–Plastic flow and viscous flow
•Impact on BEOL performance
– TSV-middle versus TSV-last
– Plastic flow and viscous flow
•Impact on BEOL Stress in TSV-last–M1 at TSV center versus M1 at TSV edge
–Plastic flow and viscous flow
© 2016 Synopsys, Inc. 18
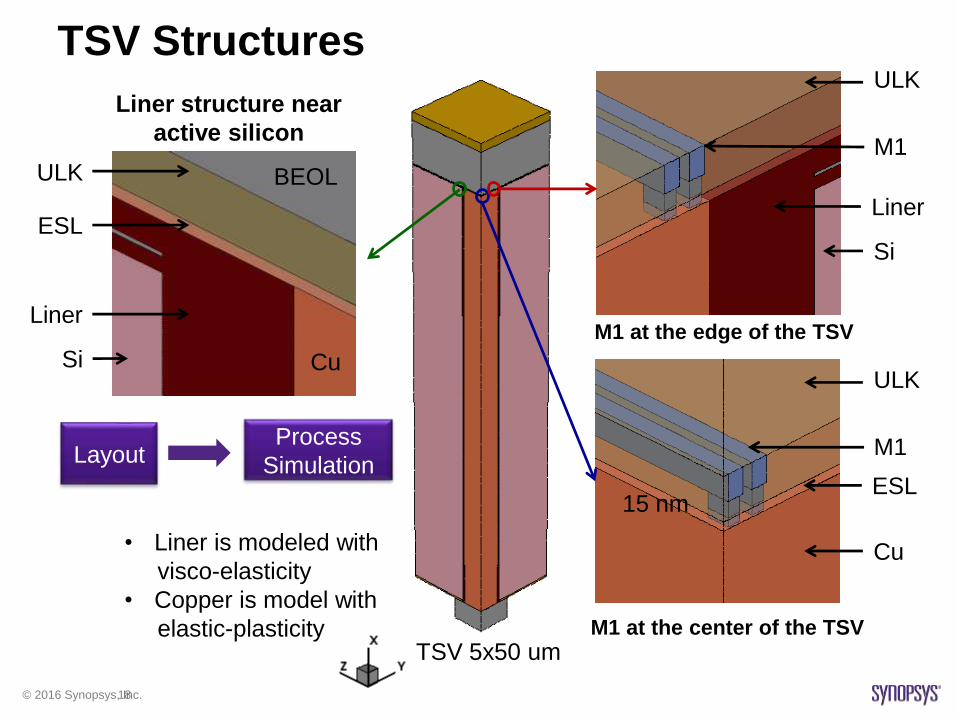
TSV Structures
M1 at the center of the TSV
M1 at the edge of the TSV
Liner structure near
active silicon
Cu
ULK
M1
ESL
Si
ULK
M1
Liner
Si
ULK
Liner
Cu
BEOL
ESL
• Liner is modeled with
visco-elasticity
• Copper is model with
elastic-plasticity
LayoutProcess
Simulation
TSV 5x50 um
15 nm

© 2016 Synopsys, Inc. 19
Global and Local Models
Center
Edge
TSV
TSV Liner
ESL
ESL
Dielectric
Dielectric
BEOL
BEOL
V0
M1
V0
M1
Local_1
BEOL
Si
TSV
Liner
Half
TS
V
Pit
ch
Y
X
Global
M1 Pitch
M1
Height
V0
Height
M1 Width
V0 Width
TSV 5x50 um
ESL 15 nm
Local_2

© 2016 Synopsys, Inc. 20
SRadial (Pa)
TSV Impact on FEOL: TSV induced in-plane stress
• TSV-last induces lower stress due to lower thermal budget
TSV-LastTSV-Middle
SHoop (Pa)
TSV
TSV TSV
TSV
W. Guo, et al
IMEC/Synopsys
ECTC 2015
© 2016 Synopsys, Inc. 21
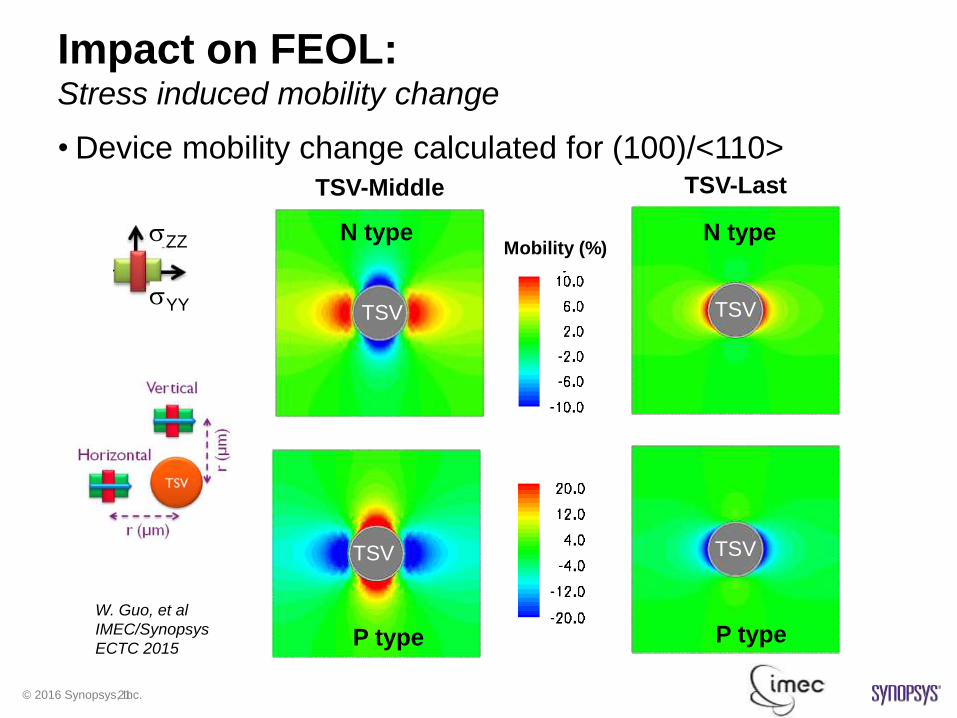
Impact on FEOL: Stress induced mobility change
• Device mobility change calculated for (100)/<110>TSV-LastTSV-Middle
Mobility (%)N type
P type
N type
P type
TSVsYY
sZZ
TSV
TSV TSV
W. Guo, et al
IMEC/Synopsys
ECTC 2015

© 2016 Synopsys, Inc. 22
Impact on FEOL Stress induced mobility change
• Lower via-last stress affects less on mobility
• Impact on NFET is smaller compare to PFET
-20
-10
0
10
20
30
40
0 2 4 6 8 10
Mob
ilit
y C
ha
ng
e (%
)
Distance along z-axis (mm)
TSV Last NFETTSV Last PFETTSV Middle NFETTSV Middle PFET
-40
-30
-20
-10
0
10
20
0 2 4 6 8 10
Mob
ilit
y C
ha
ng
e (%
)
Distance along y-axis (mm)
TSV Last NFETTSV Last PFETTSV Middle NFETTSV Middle PFET
TSV TSV
W. Guo, et al
IMEC/Synopsys
ECTC 2015

© 2016 Synopsys, Inc. 23
Syy with Plastic or Plastic+Viscous FlowPlastic + viscous flow, TSV Middle
Plastic flow, TSV Middle
Plastic + viscous flow, TSV Last
Plastic flow, TSV Last
Y
Z
© 2016 Synopsys, Inc. 24
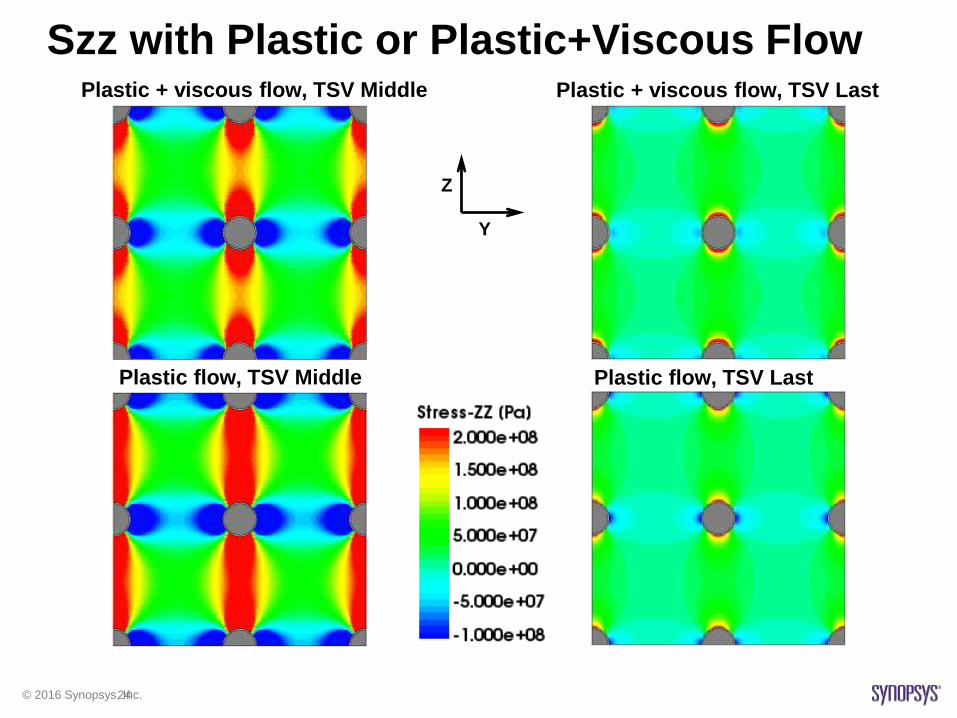
Szz with Plastic or Plastic+Viscous FlowPlastic + viscous flow, TSV Middle
Plastic flow, TSV Middle
Plastic + viscous flow, TSV Last
Plastic flow, TSV Last
Y
Z
© 2016 Synopsys, Inc. 25
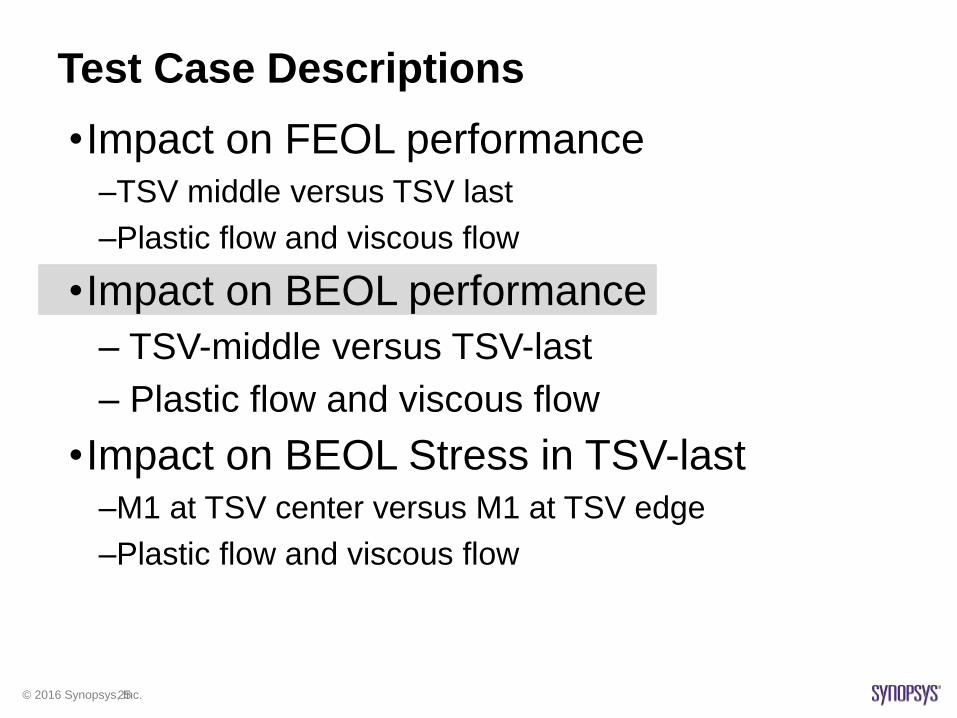
Test Case Descriptions
•Impact on FEOL performance–TSV middle versus TSV last
–Plastic flow and viscous flow
•Impact on BEOL performance
– TSV-middle versus TSV-last
– Plastic flow and viscous flow
•Impact on BEOL Stress in TSV-last–M1 at TSV center versus M1 at TSV edge
–Plastic flow and viscous flow
© 2016 Synopsys, Inc. 26
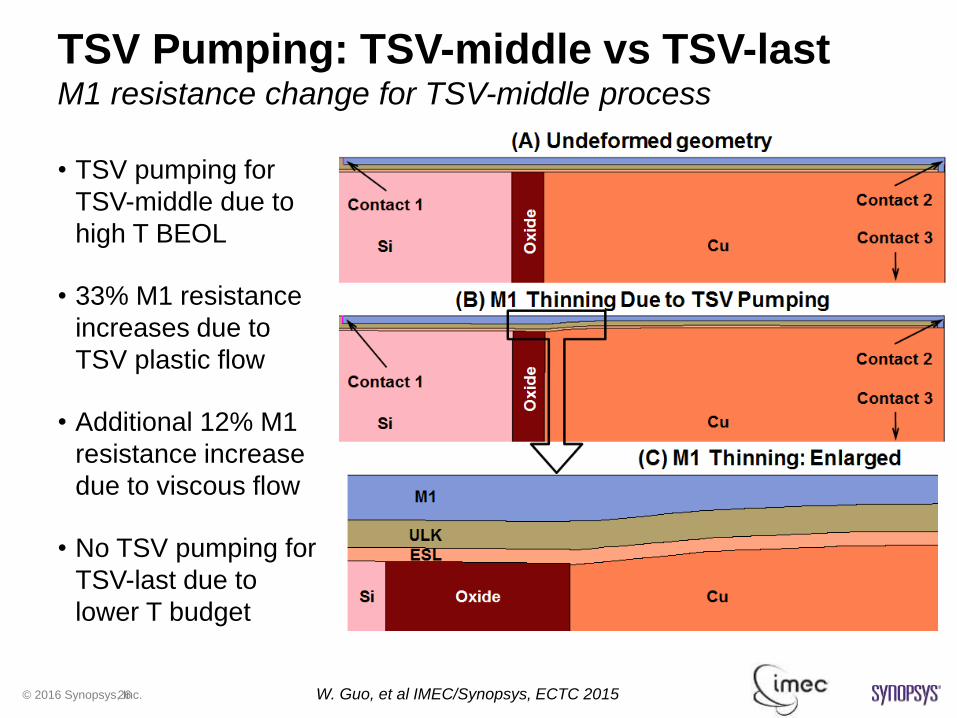
TSV Pumping: TSV-middle vs TSV-lastM1 resistance change for TSV-middle process
• TSV pumping for
TSV-middle due to
high T BEOL
• 33% M1 resistance
increases due to
TSV plastic flow
• Additional 12% M1
resistance increase
due to viscous flow
• No TSV pumping for
TSV-last due to
lower T budget
W. Guo, et al IMEC/Synopsys, ECTC 2015
© 2016 Synopsys, Inc. 27
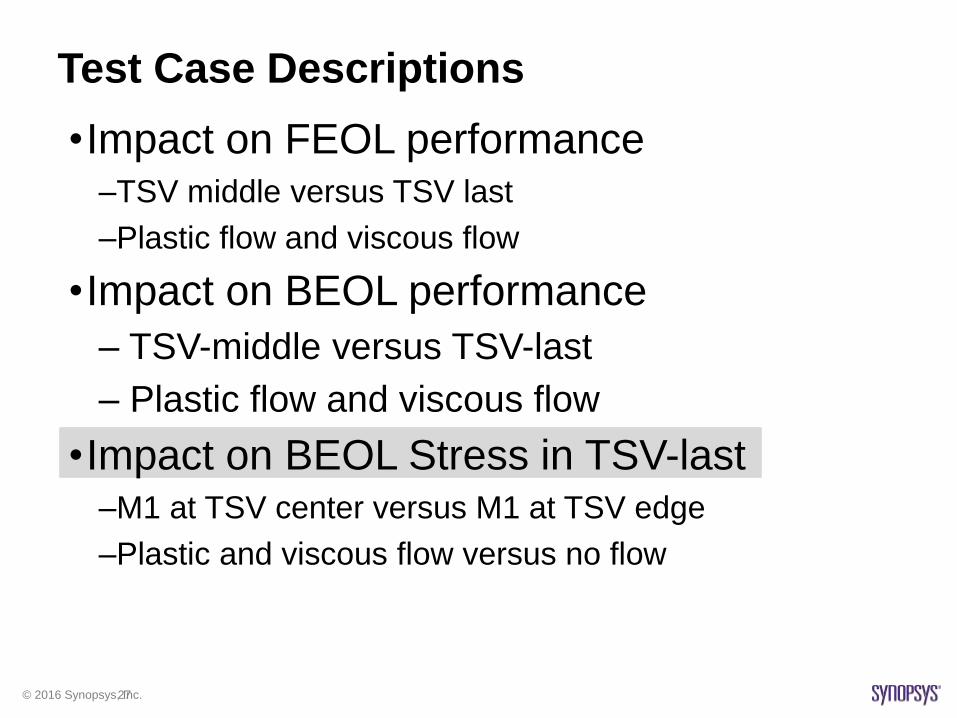
Test Case Descriptions
•Impact on FEOL performance–TSV middle versus TSV last
–Plastic flow and viscous flow
•Impact on BEOL performance
– TSV-middle versus TSV-last
– Plastic flow and viscous flow
•Impact on BEOL Stress in TSV-last–M1 at TSV center versus M1 at TSV edge
–Plastic and viscous flow versus no flow

© 2016 Synopsys, Inc. 28
BEOL Hydrostatic Stress in TSV-lastPlastic + viscous flow, Center
No flow, Center
Plastic + viscous flow, Edge
No flow, Edge
Y
X

© 2016 Synopsys, Inc. 29
Dielectric 1st Principal Stress in TSV-lastPlastic + viscous flow, Center
No flow, Center
Plastic + viscous flow, Edge
No flow, Edge
Y
X

© 2016 Synopsys, Inc. 30
Summary
• Impact on FEOL performance
–TSV-middle integration introduces larger residual stresses in
active silicon compared to the TSV-last flow integration.
–Plastic and viscous flow reduce silicon stress
• Impact on BEOL performance
–TSV-middle integration results in M1 metal resistance increase
due to copper pumping
–Plastic and viscous flow increase TSV pumping
• Impact on BEOL stress
–Residual stress profiles in BEOL structures are different for TSV
middle and TSV last flows
• Ongoing work
–TSV-last long term stability and reliability