Power System Transients Theory and Applications Transients ...
Upload
magdiel-schmitzCategory
view
300download
7
493 IEEE Transactions on Power Delivery, Vol. 11, No. 1, January 1996
MODELING GUIDELINES FOR FAST FRONT TRANSIENTS
Report Prepared by the Fast Front Transients Task Force of the IEEE Modeling and Analysis of System Transients Working Group
Contributing Authors: Ali F. Imece, Daniel W. Durbak, Hamid Elahi, Sharma Kolluri, Andre Lux, Doug Mader, Thomas E. McDemott, Atef Morched, Abdul M. Mousa, Ramasamy Natarajan, Luis Rugeles, and Eva Tarasiewicz
Abstrucz - This paper summarizes the works of an IEEE Task Force focused on development of modeling guidelines for fast front transients (i.e., frequency range from 10 kHz up to 1 M a ) . These guidelines are intended to be used by engineers involved in digital simulations of electro-magnetic transients, with particular emphasis on lightning surge analysis of overhead lines and substations. Modeling philosophies, simplified mathematical relationships, typical data, and examples are given for various power system components. To illustrate the overall modeling procedure, a case study has been presented.
Keywords - Lightning, EMTP, Insulation Coordination, Overvoltages
1. IN’IRODUCTION Objective
The fast front transients in power systems cover a frequency range from 10 kHz up to 1 MHz. One of the primary causes of such transients is the lighming strokes to the transmission lines and associated backflashovers. The objective of this paper is to develop modeling guidelines for digital simulations involving fast front waveforms.
Background
Power system studies involving lightning surge phenomena are performed to design transmission lines and substations, and for the protection of power system equipment [l]. Substation voltage uprating and transmission line compacting are some of the specialized studies that require lightning surge analysis [2]. The objectives of these studies are to characterize the magnitude of the lightning overvoltages for insulation requirements, andor to find the critical lightning stroke current that causes insulation flashovers.
Specific study objectives for transmission lines may be to:
- Determine transmission or distribution Line Flashover Rates (LFOR).
- Establish line arrester application guidelines.
- Establishlverify surge arrester ratings. - Find optimum location for surge arresters for
For substations the objectives may be to:
95 WM 278-2 PWRD A paper recommended and approved by the IEEE Transmission and Dis t r ibu t ion Committee of the IEEE Power Engineering Society f o r presentat- ion a t the 1995 IEEE/PES Winter Meeting, January 29, t o February 2 , 1995, New York, NY. Manuscript sub- mitted August 22, 1994; made ava i lab le f o r pr in t ing November 23, 1994.
lightning surge protection. - Determine minimum phase-to-ground and phase-to-
phase clearances. - Calculate Mean Time Between Failure (MTBF) for
the substation. - Determine optimum location of capacitances to
reduce steepness of surges. The lightning overvoltages are caused by either shielding
failures or backflashovers of the tower insulation on the transmission lines. Direct strokes to the phase conductors may also become a concem if the transmission line andor substation is not shielded due to relatively low lightning activity in the area. Direct strokes to the substations are generally ignored, since it is commonly assumed that the substation is perfectly shielded, via lightning masts or other means.
The Electro-Magnetic Transients Program (EMTP) is one of the most widely used digital transient programs for lightning simulations. Although the information presented in this paper generally refers to EMTP, the modeling requirements are general enough to be equally applicable to other digital transient programs.
2. MODELINGGUIDELINES
The main emphasis of this section is to identify the models of power system components to be used in digital lighming studies. For each component, the important model parameters will be described, and typical values will be provided. The general trends and rules of thumb that should be followed in the model development will also be addressed. Finally, the sensitivity of the study results with respect to model parameters will be discussed.
Overhead Transmission Lines
The overhead lines are represented by multi-phase models considering the distributed nature of the line parameters due to the range of frequencies involved. Phase conductors and shield wires are explicitly modeled between towers and only a few spans are normally considered. Tower models include the effects of tower geometry and tower grounding resistance with special emphasis on its lightning current magnitude dependent characteristics due to soil ionization. Insulators are also modeled with their flashover characteristics. AI1 incoming lines to the substation should be represented in substation design studies, although the worst case tends to be with only one line in-service due to voltage doubling effect from open circuit breakers. Depending upon the relative position of open circuit breakers inside the substation, the overvoltages may be higher for specific line outages, thus requiring the evaluation of different line contingencies. Fig. 1 shows the
0885-8977/96/$05.00 Q 1995 IEEE

by a resistance representing the tower footing impedance. The surge impedance for the tower depends on the structure details, and is determined according to the procedure outlined in Ref. [l]. Typical values range from ,100 to 300 ohms, and the velocity of propagation can be assumed to be equal id the speed of light.
TRe peak overvoltage occurring on the tower is mainly determined by the apparent footing impedance since reflections from the tower base will arrive much sooner at the tower top than reflections from adjacent towers. The influence of the apparent tower footing impedance on the tower top voltage is determined by its response time and current dependence The response time is usually only important in cases where counterpoise is installed covering distances greater than 30m from the tower base. Within 35m of the tower base, the time response can generally be neglected and the tower footing impedance is determined by using the current dependence of the tower footing resistance as follows E4,5].
(1)
494
Phase I Conductors
ancl ShieM Wires
lnsulators
I I I I
Fig. 1. Overhead Transmission Line, Tower, and Insulator ~ e ~ e s e n ~ t ~ o n .
model of transmission line and tower used for lightning
and Termination - In transmission line
~nfluenced by reflections from the adjacent towers. ~ u f ~ c ~ e n t number of adjacent towers at both sides of the struck tower should be modeled to determine the
accurately. This can be achieved by selecting f line spans modeled such that the travel time
tween the struck tower and the farthest tower is more f of the lightning surge front time. The number s modeled must be increased when the effects tail of the lightning surge is considered,
y while evaluating the insulator flashovers with propagation method.
In substation design studies, a similar approach can be provided that all the line spans and towers
the struck tower and the substation are modeled in
transmission line and substation design studies, e extended beyond the last tower can be represented
with a matrix of self and mutual resistances equal to the ng line surge impedances. This results in
reflections from the matched termination. The matrix can be determined by a line constants
Towers and Footing Impedance
el Towers - The steel towers are usually represented as a single conductor distributed parameter line terminated
where: R, = Tower footing resistance at low current and low
RT = Tower footing resistance, ohm
Ig = the limiting current to initiate sufficient soil
I = the lightning current through the footing
The limiting current is a function of soil ionization and is
(2)
frequency, ohm
ionization, A
impedance, A.
given by:
where: p = Soil resistivity, ohm-m E,, = Soil ionization gradient (about 300 kV/m) [3,9]
The counterpoise can be represented as a nonlinear resistance with values calculated by Equation (1). The typical tower grounding resistance is between 10 and 100 ohms. Wood Poles and Cross-arms - W d poles and cross-
arms can be modeled by a parallel combination of a resistor and a capacitor. In the case of wood pole, the suucture is also modeled in a similar fashion to the cross- arm. Since the leakage resistance across the insulators is normally much greater than that of the wooden arms or poles, it may be neglected. Similarly, the stray capacitance of the insulator to wood and to ground may be neglected. Some typical values of the capacitance and resistance of wood are given in Reference [13]. Note that the values of the capacitance and resistance are very sensitive to moisture contents.
The flashover characteristics of wood can be modeled by a voltage-controlled switch. Ref. [13] Shows the characteristic per-unit volt-time curve with its upper and

495
Insulators Cap and Pin Insulators
lower limits for a wood cross-arm subjected to a 12/50 ps voltage waveshape. The impulse flashover voltage of wood as function of its length for different moisture contents is also provided in the same paper.
Insulators
Negative 1 .o 670 Positive 1 2 520 Negative 1.3 600
The insulators are represented by voltage-dependent flashover switches in parallel with capacitors connected between the respective phases and the tower. The capacitors simulate the coupling effects of conductors to the tower structure. Typical capacitance values for suspension insulators are 80 pF/unit, while for pin insulators, the capacitance is around 100pFhnit. Ten pin insulators in a string has an equivalent capacitance of 100/10 = 10 pF/suing. Capacitance values for non-ceramic insulators are an order of magnitude less for comparable ceramic insulators.
The backflashover or flashover mechanism of the insulators can be represented by volt-time curves. The volt- time characteristics of insulators can be represented as a function of insulator length [l]. The insulator flashover voltage can be calculated using the Quation (3) during the simulation, and compared to the actual insulator voltage. The start-up time (i.e., zero time) for the volt-time characteristics must be synchronized to the instant that lightning stroke hits the shielding wire or the tower top. If the insulator voltage exceeds this voltage, a flashover occurs across the insulator. The front time for the arcing can be quite steep, (around 2011s) and is determined by the physics of air gap breakdown. For a simplified analysis, a detailed arcing model for flashover is not necessary, and a short-circuit (ideal switch) representation will be adequate.
(3)
where: K1 = 4OO*L K2 = 710*L Vv-t = Flashover voltage, kV L = Insulator length, m t = Elapsed time after lightning stroke, ps
Note that knowledge of the performance of insulation under the stress of the standard impulse is not sufficient to predict the performance of insulation exposed to any non- standard lightning impulse. Furthermore, it is inaccurate to assume that flashover will occur when a voltage wave just exceeds the volt-time curve at any time. The experimental volt-time characteristic is only adequate for relating the peak of the standard impulse voltage to tbe time of flashover. Accurate representation of the short and long air gap (insulator strings and spark gaps) breakdown is necessary to overcome the shortcomings of volt-time characteristics. The leader development method is recommended as described below.
The Leader Development Method - The leader development method gives special consideration to breakdown parameters and to physical aspects associated with the discharge mechanism. The method is partially based on experimental results which, in tum, lead to some analytical formulations. By solving a set of differential
equations leader development is calculated, and then volt- time breakdown characteristic is obtained in a numerical process which can be related to physical phenomena.
In the numerical algorithm, first the leader velocity is empirically formulated as a function of the applied voltage, leader length, gap length, gap geometry and electric field intensity with two contributing factors, i.e., leader core and corona cloud. Then this equation is combined with the circuit equation determined by the experimental condition and solved numerically in a time step loop until the breakdown as described below.
From Ref. [3], the time to breakdown (tc) can be expressed as:
t, = ti + ts + tt where:
= Corona inception time, assumed zero
(4)
4 t, = Streamer propagation time t c = Leader propagation time
For ts:
- 0.95
where: ts = Streamer propagation time, psec E = Maximum gradient in gap before breakdown,
E50 = Average gradient at CFO voltage, kV/m kV/m
For t c:
- dL = K V(t)[- V(t) - Eo] dl g-L
where: V(t) = Voltage across gap, kV L = Leader length, m g = Gap length, m
and
Configuration I Polarity EO [:I kV sec
I L J
~ i r a p s , Post I Positive 0.8 600
Using the differential equation of (6), the leader length can be solved as a function of time. The breakdown occurs when the leader length “L” is equal to gap length “g” and the corresponding time specifies the t t in Equation (4).
This method can yield the breakdown volt-time characteristics of a long gap with any impulse wave in extremely short time (e.g., less than 1 psec impulse rise time). It can be applied to a very wide range of experimental conditions such as gap configuration (rod- plane and rod-rod), impulse voltage polarity (positive and negative), any impulse voltage waveform, and a gap length up to 7m. It bas been reported [11,12] that calculations of
496
leader development and breakdown volt-time characteristics were carried out and results were compared with experimental results obtained by authors, as well as, previously published by other researchers. Very good agreement was obtained for various gap configurations with various voltage waveforms. Further investigation of associated physical phenomena is expected in the future.
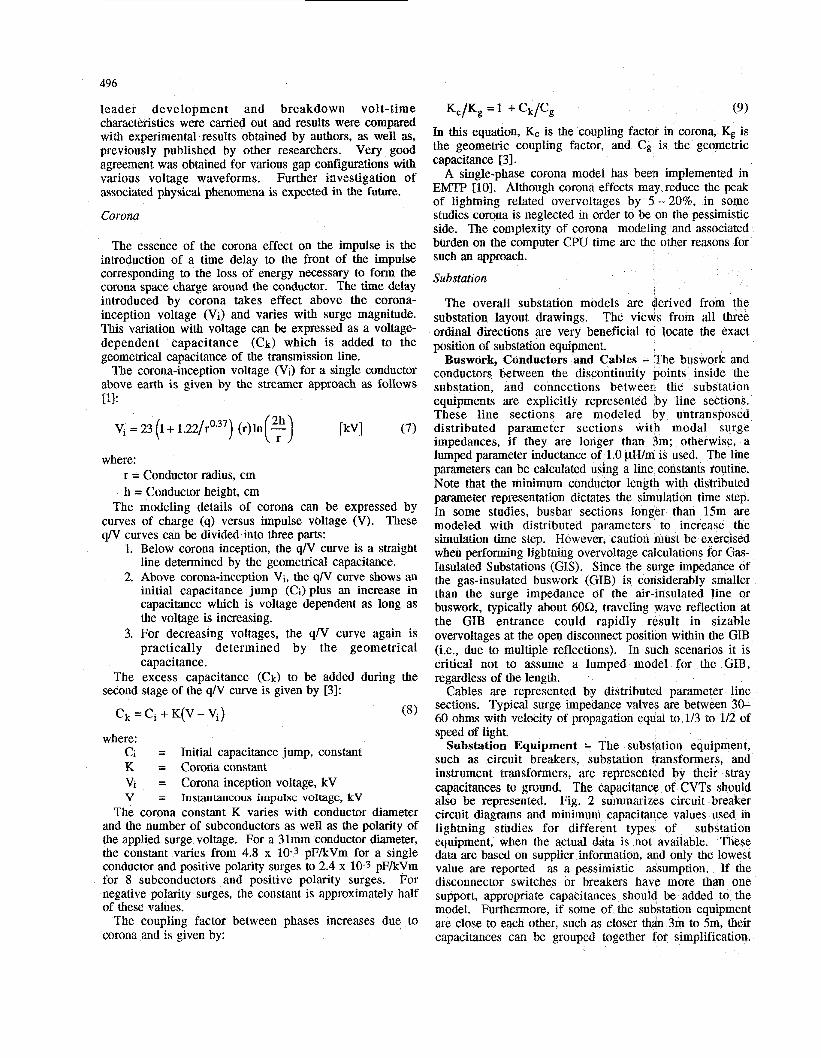
Corona
The essence of the corona effect on the impulse is the introduction of a time delay to the front of the impulse corresponding to the loss of energy necessary to form the corona space charge around the conductor. The time delay introduced by corona takes effect above the corona- inception voltage (Vi) and varies with surge magnitude. This variation with voltage can be expressed as a voltage- dependent capacitance (Ck) which is added to the geometrical capacitance of the transmission line.
The corona-inception voltage (Vi) for a single conductor above earth is given by the streamer approach as follows Ell:
Vi = 23 (1 + ( r ) ln(g) r (7)
where: r = Conductor radius, cm h = Conductor height, cm
The modeling details of corona can be expressed by curves of charge (9) versus impulse voltage (V). These q N curves can be divided into three parts:
1. Below corona inception, the q/V curve is a straight line determined by the geometrical capacitance.
2. Above corona-inception Vi, the qN curve shows an initial capacitance jump (Ci) plus an increase in capacitance which is voltage dependent as long as the voltage is increasing.
3. For decreasing voltages, the q/V curve again is practically determined by the geometrical capacitance.
The excess capacitance (Ck) to be added during the second stage of the q N curve is given by [3]:
where: Ci = Initial capacitance jump, constant K = Coronaconstant Vi = Corona inception voltage, kV V = Instantaneous impulse voltage, kV
The corona constant K varies with conductor diameter and the number of subconductors as well as the polarity of the applied surge voltage. For a 31" conductor diameter, the constant varies from 4.8 x 10⁻³ pF/kVm for a single conductor and positive polarity surges to 2.4 x 10⁻³ pF/kVm for 8 subconductors and positive polarity surges. For negative polarity surges, the constant is approximately half of these values.
The coupling factor between phases increases due, to corona and is given by:
In this equation, Kc is the coupling factor in corona, Kg is the geometric coupling factor, and Cg is the geometric capacitance [31.
A single-phase corona model has been implemented in EMTP [lo]. Although corona effects may reduce the peak of lightning related overvoltages by 5 - 20%, in some studies corona is neglected in order to be on the pessimistic side. The complexity of corona modeling and associated burden on the computer CPU time are the other reasons for such an approach.
Substation
The overall substation models are derived from the substation layout drawings. The views from all three ordinal directions are very beneficial to locate the exact position of substation equipment.
and conductors between the discontinuity points the substation, and connections between the substation equipments are explicitly represented by line sections. These line sections are modeled by untransposed distributed parameter sections with modal surge impedances, if they are longer than 3m; otherwise, a lumped parameter inductance of 1.0 pH/m is used. The line parameters can be calculated using a line constants routine. Note that the minimum conductor length with distributed parameter representation dictates the simulation time step. In some studies, busbar sections longer than 15m are modeled with distributed parameters to increase the simulation time step. However, caution must be exercised when performing lightning overvoltage calculations for Gas- Insulated Substations (GIs). Since the surge impedance of the gas-insulated buswork (GIB) is considerably smaller than the surge impedance of the air-insulated line or buswork, typically about 60Q traveling wave reflection at the GIB entrance could rapidly result in sizable overvoltages at the open disconnect position within the GIB (i.e., due to multiple reflections). In such scenarios it is critical not to assume a lumped model for the GIB, regardless of the length.
Cables are represented by distributed parameter line sections. Typical surge impedance valves are between 30- 60 ohms with velocity of propagation equal to 1/3 to 1/2 of speed of light.
Substation Equipment A The substation equipment, such as circuit breakers, substation transformers, and instrument transformers, are represented by their stray capacitances to ground. The capacitance of CVTs should also be represented. Fig. 2 summarizes circuit breaker circuit diagrams and minimum capacitance values used in lightning studies for different types of substation equipment, when the actual data is not available. These data are based on supplier information, and only the lowest value are reported as a pessimistic assumption. disconnector switches or breakers have more than one support, appropriate capacitances should be added to the model. Furthermore, if some of the substation equipment are close to each other, such as closer than 3m to 5m, their capacitances can be grouped together for simplification.
Buswork, Conductors and Cables - The bu

497
Bus Support Insulator
Capacitive Potential Transformer
Circuit breakers, dead tank
5OPF /['
8OpF 120pF 150pF
8000pF 5000pF 4000pF
Circuit breakers, live tank
1 5PF - -
Current Transformer
Disconnector Switch
250pF 680pF 8OOpF
I CircuitBreaker(DeadTank) I lOOpF I 150pF I 600pF I
Magnetic Potential I 500pF 1 550pF I 6OOpF I I Transformer
I Autotransformer" I 3500pF I 2700pF I 5000pF I
Recently developed transformer model, described in [ 161, can accurately determine how a voltage applied to one set of terminals is transferred to another set of terminals. This model duplicates the transformer behavior, over a wide range of frequencies and acts like a filter suppressing some frequencies and passing others. The use of frequency dependent transformer model is important when determining the surge that appears on a generator bus when a steep-fronted surge impinges on the high voltage terminals of the generator step-up transformer. The model presented in [16] allows the simulation of any type of multi-phase, multi-winding transformer as long as its frequency characteristics are known either from measurements or from calculations based on the physical layout of the transformer.
Insulators and Bus Support Structures - The bus support structures are represented by a distributed parameter model with surge impedances calculated from the structure geometry, and with velocity of propagation equal to the speed of light, similar to the transmission line bus tower models [l]. The representative grounding resistance inside the substations is between 0.1 to 1 ohms. Comparative simulations showed that the support structures do not have much impact on the simulation results, and can be neglected. However, the capacitance to ground of all insulators should be represented, since the substation capacitance is one of the critical parameters that modify lightning surge waveshapes.
Surge Arresters Capacitance also depends on MVA.
Fig. 2. Circuit Breaker Representations and Minimum Capacitance-to-Ground Values for Various Substation Equipment.
The opedclose status of circuit breakers/switches should be considered, and can be represented by ideal switches.
In lightning studies, conducted to design transformer protection at the terminals against high voltage, high frequency disturbances, the most conservative and therefore pessimistic approach would be to represent the transformer as an open circuit. To increase the level of accuracy when setting up a terminal model of a transformer, it is recommended to account for the capacitance of the winding and the capacitance of the bushing to which the winding is connected. Values of the winding capacitance, supplied by IEEE Working Group on Transient Recovery Voltages, together with capacitance values for outdoor bushings are presented in [lS]. A resistance equal to the surge impedance of the winding can be placed across the capacitance.
The model can be enhanced by adding the inductive transformer model and relevant capacitances between windings, windings to core and windings to ground as well as bushing capacitances. The winding and core capacitances constitute together a crude potential divider in which the voltage divides inversely to the capacitance. Capacitances can be determined from the geometry of the coil and core structure, or from manufacturers and tables. The model is used to calculate the surge transfer from winding-to-winding as in the case of generator (or motor) protection studies.
The voltage-current characteristics of metal-oxide surge arresters are a function of incoming surge steepness. Protective characteristics for surge arresters showing crest discharge voltage versus time-to-crest of discharge voltages are available from manufacturers [71. The arresters can be modeled as nonlinear resistors with 8 x 20 ps maximum voltage-current characteristics. An iterative non-linear resistor is preferable. The pseudo non-linear resistor should be avoided if possible, especially in simulations that involve high frequencies or backflashovers. This is due to the fact that the solution algorithm allows for an incorrect operating point for one time-step while switching from one segment to another on the piecewise linear representation of the current versus voltage characteristics. Note that the nonlinear arrester characteristics need to be modeled up to at least 20 to 40kA, since high current surges initiated by close backflashovers can result in arrester discharge currents above 10 kA. The arrester lead lengths at the top and at the bottom must be considered to account for the effects of additional voltage rise across the lead inductance. A lumped element representation with an inductance of 1 .O pH/m will be sufficient.
The frequency dependent characteristics of arresters may be of significant importance when excited by fast transient surges. There have been few attempts to produce frequency dependent surge arrester models such as the model suggested by IEEE Surge Arrester Committee which is fairly accurate for a wide range of surge wavefronts [14]. The drawbacks of this model are the increased computational time due to several nonlinear elements, and the difficulty in choosing the parameters of the model.

498
Lightning Stroke
The lightning stroke is usually represented by a c m n t source of negative polarity. The parameters of a lightning, such as crest, front time, maximum current steepness, and duration, are determined by a statistical approach considering the ground flash density at the location. These parameters are all statistical in nature, and are also used in calculation of LFOR and MTBF. They are generally characterized by log-normal distributions. Note that the peak current is statistically related to the steepness or time to crest of the current wave form. The steepness increases as the peak current increases, however, the front time increases as well with peak current. The detailed calculation procedure for these parameters is shown in the CIGRE Guide, Ref. [3].
A rigorous approach would require the front of the lightning current source to be upwardly concave, however, for practical purposes, a linearly rising front at the selected maximum current steepness is sufficient. In this case, a negative triangular wave shape for the lightning current source can be selected. Note that the double exponential impulse model given in EMTP should be used only with caution since this model does not accurately reflect the concave wave shape of the wave front. Typical lightning current values for backflashovers and direct strokes are discussed below.
Backflashover - Lightning strokes of high magnitude, in the range of 20 kA up to values rarely exceeding 200kA, cause the backflashovers, In this current range, median front times (30% - 90%) range from about 3 p at 20 kA to about 8 ps at 200 kA. Maximum current steepness ranges from about 20 kA/p at 20 kA to about 48 kA/p at 200 kA [3,111.
Direct Lightning Stroke - Lightning strokes of amplitude below the critical shielding current, generally less than 20 kA, can bypass the overhead shield wires and strike directly on the phase conductors. The maximum lightning current that can strike the phase conductors of any given overhead transmission line can be predicted by using the methods recommended by the IEEE Working Group 0x1 the Estimation of Lightning Performance of Overhead Lines [8].
The instant of lightning stroke with respect to the instantaneous steady-state ac voltage must be coordinated to maximize its impact for worst case conditions. This can be achieved by properly selecting the magnitude and phasing of the three-phase sinusoidal voltage sources at the terminating point of the transmission lines.
Time Step and Sitnulation Time
The accuracy of the digital simulation can be affected by the use of a time step that is too large or too small. The time step selection depends upon the steepness of the surge, the minimum length of traveling wave models, plus the use of flashover gaps and surge arresters with significant lead lengths. As a general guide:
range of time step = 1 to 20 ns; typical = 5 ns range of simulation length = 20 to 50 p, typical 40 ps
3. CASESTUDY
The modeling guidelines described in this paper are applied in a system study where a lightning surge analysis of an uprated substation is performed. The substation is uprated from 115 kV to 230 kV maintaining 550 kV BIL insulation. The specific objectives of the study are to evaluate the severity of lightning overvoltages stressing the substation, and to establish the extent of the overvoltage control required to achieve the desired lightning performance. Overvoltage control consists of selecting optimum rating and location for the surge atresters inside the substation.
Computer Model
Based on the guidelines described in this paper and using the substation layout drawings, an EMTP model for the 230kV, 550kV BIL substation ana its incoming transmission lines were developed as shown in Fig. 3. In the computer simulations, the lightning is assumed to strike the fmt tower outside the substation on 230 kV line #2 at tower T2. The lightning stroke is captured by the shield wire at the point of connection to the tower (i.e., its highest point) and is represented as a current source with a negative triangular waveshape. The parameters of the lightning stroke, such as crest, rise time, and duration, are determined considering the line dimensions and lightning incidence data for the site of the substation [3]. The lightning stroke parameters used in this study are given below:
Peak Current = .110 kA Time to Crest = 3 ps HalfTime = 7 5 p
These parameters are based on the MTBF rate of 200 years for the substation. This assumes that substation would fail, if a lightning more than 110 kA would strike the first tower of either of the two incoming lines. The strikes further away from the substation are less severe.
After the lightning stroke hits the shield wire, tower top voltage increases, resulting in voltage rise across the insulator strings supporting the phase conductors. There is a 50% probability of insulator flashover, if its voltage reaches the critical flashover voltage (CFO). It is well recognized that the flashover voltage is also dependent upon the steepness of the voltage; that is, insulator flashover voltage has volt-time dependency.
When the insulator flashover occurs, a surge with a very steep front propagates through the multi-conductor trammission line toward the substation. The severity of the overvoltages at the substation depends on how far the struck tower is away from the substation. Further distances result in less severe overvoltages due to stronger distortion and attenuation effects due to line parameters and also corona. In this study, corona effects are neglected. This assumption was justified since the lightning is assumed to have stricken the first tower outside the substation for the base case. Also, protective levels for line entrance arresters are below conductor corona starting voltage.
The total simulation time was chosen to be sufficiently large to observe the decaying of overvoltages and reflections from the incoming lines. In this study, the

499
-$ i #3
#2
I A- l Y
I A- 12'
41 + b .̂
#I i 38
-23OkVllne#l
Fig. 3. Substation EMTP Model Details. maximum simulation times is set to 20 ps. The simulations are performed with a 5 ns time-step. Decreasing the time step down to 1 11s' gives almost identical results, indicating that the selected time step is sufficiently small for the transients of interest.
Simulation Results
The simulation results are given in terms of plots of waveforms for the important system variables, such as l i e insulator voltages, phase-to-ground and phase-to-phase voltages at towers, tower top voltages, and tower footing resistance voltages. Inside the substation, phase-@ground and phase-to-phase voltages at dl equipment locations, at minimum clearance points, and at midway between arresters are provided, in addition to arrester voltage, current and energy duties. Sample waveforms for the base case are provided in Figs. 4 and 5.
A comprehensive set of lightning overvoltage studies are performed to establish the minimum insulation
requirements. The effects of the lightning overvoltages on the equipment BIL, minimum phase-to-ground and phase-to-phase clearances, and surge arrester energy duties are evaluated for several contingencies. In some of the cases simulated, it has been observed that the BIL rating of the substation could be exceeded. Additional simulation results showed that by placing line entrance arresters overvoltage control inside the substation can be accomplished. In overall conclusion, application of 180 kV rated metal oxide arresters at both line enrrance and all transformer locations makes it feasible to uprate the 550 kV BIL substation from 115 kV to 230 kV.
4. CONCLUSIONS
Modeling philosophy, simplified mathematical relationships and typicaI data are presented for various power system components in studies of fast front transients. Although emphasis has been on lightning surge analysis of transmission l i e s and substations, modeling guidelines are

500
Fig. 4. 230 kV Line Voltage Wavefonns.
Tower # I - 2
, \.., ____-____________! 5oo TOWER 4 1 - 1 INSIILATOR I k V ]
1ooo7 TOWER 11-2 PHASE VOLTAGE [kV] I Lightning Stroke
lwo, TOWER I1-2 INSULATOR IkVI
, o o o ~ , , , * , , , , , . , , , , , , . , * , , , , , , , , , * , ~ , , 0 .0 2 . 5 5 . 0 7 ! 5 d.0 d . S 14.0 1 j . S ad.
Time in Microseconds'
Fig. 5. Struck Tower Voltage Wavefonns.

501
GE Tranquello XE Station Surge Arresters, Product and Application Guide, 1986. IEEE Working Group on the Estimation of Lightning Performance of Overhead Lines, “A Simplified Method for Estimating Lightning Performance of Transmission Lines,” IEEE Trans. on PAS, PAS-104,
A.M. Mousa, “The Soil Ionization Gradient Associated With Discharge of High Currents Into Concentrated Electrodes,” IEEE Trans. on P WRD,
H.W. Dommel, Electromagnetic Transients Program Reference Manual (EMTP Theory Book), Report Prepared for Bonneville Power Administration, Portland, Oregon, August 1986. M. Rioual, et. al., “Short and Long Air Gaps (Insulator Strings and Spark Gaps) Modeling for Lightning Studies with the EMTP Program,” EPRI, Palo Alto, California, 1989. T. Shindo and T. Suzuki, “A New Calculation Method of Breakdown Voltage Time Characteristics of Long Air Gaps,” IEEE Transactions on PAS, Vol. PAS 104, pp. 1556-1563, June 1985. M. Darvenniza and R.H. Still”, “An Improved Method for Calculating the Impulse Strength of Wood Porcelain Insulation,” IEEE Transactions on
IEEE Working Group 3.4.11, Application of Surge Protection Devices Subcommittee, Surge Protection Devices Committee, “Modeling of Metal Oxide Surge Arrester,” IEEE Trans. on PWRD, Vol. 7, No. 1, 1992. A. Greenwood, “Electrial Transients in Power Systems,” Second Edition, John Wiley and Sons, 1991. A. Morched, L. Marti and J. Ottevangers, “A High Frequency Transformer Model for the EMTP,” IEEE Trans. on PWRD., Vol. PD-8, No. 3, 1993.
NO. 4, pp. 919-932, 1985.
Vol. 9, NO. 3, pp 1669-1677, 1994.
PAS, Vol. PAS-98, NO. 6, pp 1909-1915, 1979.
applicable for similar phenomena having the same p ] frequency bandwidth (i.e., 10 kHz up to 1 MHz).
Examples where such modeling guidelines are applicable [8] include: a) selection of surge arrester location and rating for protection of transmission lines, as well as air-insulated and gas-insulated substation, b) selection/verification of clearances within substations and transmission towers (i.e., phase-to-ground and phase-to-phase), c) calculation of flashover rates or MTBF, etc.
Further illustration of the modeling guidelines has also been demonstrated through a “case study”. Note that field
[9]
test validation of the mbdeling guidelines is reported in Ref. 121.
[io]
Altogether, this paper provides a working reference document for engineers involved in electromagnetic transients simulation of transmission and distribution systems.
[ill
5. REFERENCES
Transmission Line Reference Book, 345 kV and Above, Second Edition, Electric Power Research Institute, Palo Alto, California, 1982. EPRI Substation Voltage Uprating, Volumes I and 11,
[I21
U31 EPRI EL-6474. ADrill992. “Guide to Proceiures for Estimating the Lightning Performance of Transmission Lines,” CIGRE Working Group 33-01 (Lightning) of Study Committee 33 (Overvoltages and Insulation Coordination), 199 1. A.J. Eriksson, K.H. Weck, “Simplified Procedures for Determining Representative Substation Impinging Lightning Overvoltages,” CIGRE 33-16, Paris, 1988. M. Khalifa, High Voltage Engineering, Marcel Dekker Inc., New York, 1990. M.M. Suliciu, and I Suliciu, “A Rate TyDe
141
151
Constitutive Equation for the Description of -&e Corona Effect,” IEEE Transactions on Power Apparatus and Systems, Vol. PAS-100, No. 8, pp.
[I61
3681-3685, August 1981.

502
Discussion
W.A. CHISHOLM (Ontario Hydro Technologies) and YAMA (Central Research Institute of Electric Power With advances in availability and ease-of-use, the
ss of programs are increasingly suitable for analysis of lightning problems on power systems. The Fast-Front Transients Task Force is to be commended for developing suitable recommendations for EMTP models of several important components in the Line Flashover Rate (LFOR) problem.
The LFOR problem can be broken into at several time periods. One rough division could be:
Case 1: 300 ns - lp
Fast-rising components in the stroke current lead to high transient stresses on line insulation, which has a high withstand strength at short times. Results are sensitive to estimates of stroke current rate-of-rise and current, front-of-wave flashover strength model, tower surge impedance. This class is also important at time of any insulator flashover, since the chop time is steeper than 300 ns and the voltage collapse will regenerate similar transient effects on other stressed insulation.
towers are documented. In these cases, it is more important to have a good nonstandard-wave flashover model, such as the description given by the leader progression (LP) model. The authors have adopted the CIGRE LP model [3], which is optimized for air-gap strengths. However, the CIGRE LP model shown is not as good for describing standard-wave flashover strengths on porcelain capand-pin insulators.
A calculation was carried out to compare the CIGRE LP model with the reference volt-time curve of Equation 3. The calculation circuit has a source impedance of 26nF, 300pH and 400Q in series. A 1-3m gap was modelled in series with a 400R front resistor and shunted by 7713Q in parallel with 1 nF. This circuit generates a lightning impulse with (1.Y45)ps rise and fall times. The CEGRE method was expressed by the authors' Equations (5) and (6), along with a third expression:
additional term models the drain of current from the impulse gen- erator into the gap. This improvement tends to bring the CIGRE predictions about 8% closer to the IEEE VT curve than if the current is not modelled (using only Equations 5 and 6). Figure A1 shows the remaining error.
Case 2: 1 - 3 p
3500
h 3000
Stroke current flows either into one tower footing or into surge impedance of overhead groundwires. Maximum stress on insulation occurs just before return of reflections from nearest adjacent towers. Sensitive to stroke current magnitude and rate of rise, standard lightning impulse wave insulation strength, electromagnetic coupling from stricken OHGW to unstricken phases, ionized footing impedance.
h
C I GRE K=l .2E-6
C I GRE K=l .8E-6 v
g 2500 +-' 0 -
Case 3: 3-lops >
Y -o
2000
L I5Oo
1000
Stroke current flows into three, five or possibly seven tower
this case are sensitive to probability of high stroke current
(partially-chopped) lightning impulse wave insulation strength, un-ionized footing impedances.
footings through series impedance of OHGW system. Results in
magnitude, transmission line coupling parameters, nonstandard m
0 1 2 3 4 5 6 1 Breakdown Time ( p s ) Case 4: 10-1OOp
Stroke current flows into seven or more tower footings. LFOR problem associated only with very-large current events. Line parameter, corona deformation models important. Possible worst case for energy absorption.
One reasonable model for the LFOR is the simplified method developed by Anderson [ 11, adopted by the IEEE Working Group [Sa,revised] and updated recently in Reference [A], to describe Case 2. This model uses a correct application of the standard lightning impulse volt-time curve, Equation (3) , at an equivalent front time of 2ps. The use of an equivalent front time describes the co-incidence of the maximum steepness with the peak current, for the case where the stress is a sum of both resistive (RE) and inductive (dUdt) effects. The fixed rise-time tends to overstate the steepness of large strokes, but the 2-ps time is generally before the time of maximum stress, when reflections from adjacent towers return. The balance gives adequate LFOR estimates, especially considering the improvement in line description needed to provide parameters for better estimates.
EMTP programs should be especially useful in study of longer- duration flashover problems in Cases 3 and 4, and in specific situations where adjacent span lengths to stations or stricken
Figure AI: Calculated Volt-Time Curve, Equations 5,6 and AI Gap Length = 2 m, rod-plane gap, positive polarity
The CIGRE estimate with the recommended factor of K=1.2 m*/(kV-s) and gradient of Eo=520 kV/m is still too high by about 13%. This seems almost adequate, but LFOR estimates are very sensitive to the insulator strength model. An over-estimate of insulation strength by 13% would lower the LFOR estimate by more than 45%. This 13% uncertainty also reduces our confidence in the LP description for nonstandard waves on porcelain insulator strings.
We explored other values of K , and found for example that a value of K=1.8 m*/(kV-s) matches the IEEE volt-time curve much better. However, adjustments to the LP model should also match observed characteristics of leader velocity from experiments. We would like the authors' view of this approach. Should the CIGRE LP model be recommended in spite of the fact that it overstates the cap-and-pin insulator volt-time curve? Is the additional model of leader current important, or instead should the value of K be increased to non-physical values? What range of adjustments would the authors consider reasonable to achieve this match?

503
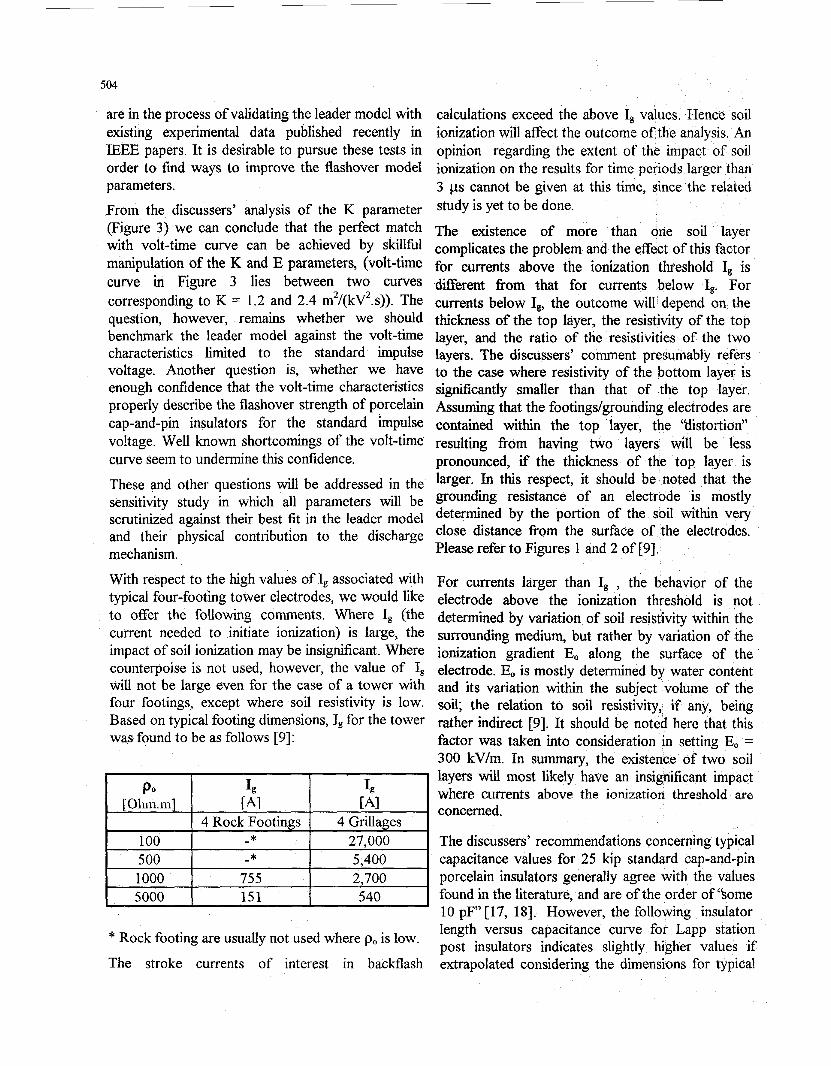
The footing impedance ionization model selected in Equations (1) and (2) is appropriate for Case 2. We would like the authors to comment on the high values of I# associated with typical four- footing tower electrodes. Also, the model may not be as important in Cases 3 and 4, especially where there is two-layer soil. The authors recommend a simple model for tower impedance, and this is also sensible for Cases 3 and 4.
In all cases, a good LFOR estimate will also require a suitable stroke incidence model, a shielding failure model and an estimate of local lightning ground flash density. The authors' [3] and Reference [A] provide a healthy respect for some of the uncertainties, and improving success, in describing these factors in the LFOR problem.
We would finally ask the authors to clarify two minor points. First, typical capacitance values for 25-kip standard cap-and-pin porcelain insulators are usually measured to be 30-35 pF range, not the recommended 80pF, which is more representative of bell- shaped insulators. Second, the authors recommend 500 kHz for models of skin effect in the line constants section. Equating peak currents and rates of rise for a sine pulse and the standard lightning impulse suggests a representative frequency of 80-120 kHz for these effects.
In closing, we agree that the authors have assembled a good working reference for EMTP simulation of transmission systems, and look forward to seeing wider use of this work.
[8a]IEEE Working Group on Estimating the Lightning Performance of Overhead Transmission Lines, "A Simplified Method for Estimating Lightning Performance of Transmission Lines", IEEE Trans. PAS-104, No.4, April 1985, pp 919-932.
[AIIEEE Working Group on Estimating the Lightning Performance of Overhead Transmission Lines, "Estimating Lightning Performance of Transmission Lines 11: Updates to Analytical Models", IEEE Trans. PWRD-8, No.3, July 1993, pp 1254-1267.
Manuscript received February 23, 1995.
M.T. Correia de Barros, IST I Technical University of Lisbon, Portugal : I wish to congratulate the Fast Front Transients Task Force members for the excellent work that has been done, which is shortly presented in this paper. My comments concem the paragraph on corona, where some guidance to the readers may be missing. I understand the difficulty on accommodating on a IEEE paper the extensive work performed by the Task Force. However, in order to avoid misusing of the information given in equations (7) and (E), the following concepts should be clarified: Excess CaDacitancQ - For the computation of surge propagation on transmission lines, it is most suitable to describe corona by a charge-voltage curve. This can be described by a voltage-dependent capacitance, which increases above corona threshold. Therefore, an excess capacitance appears. However, it should be noticed that two different quantities, with the physical dimension of a capacitance, can be defined in the presence of corona: the ratio between the charge and the voltage, or the derivative of the charge with respect to the voltage. The latest is the one to be used for surge propagation studies. Standing upon the two different capacitance concepts, also two different excess capacitances can be defined. According to the authors' reference [3], page 35:
C = Q l V = Cg + Ci + K (V-Vi)
Cdyn =dQ IdV = Cg + Ci ~ K 4 +2 K V
from where, subtracting the geometric capacitance , the equations giving the two different-meaning excess capacitances can be found. The first is the one shown in equation (8).
Corona-inceotion voltage ~ A distinction should be made between what can be said the microscopic and macroscopic inception of corona. For computation of surge attenuation and dlstortlon by corona, the latest is of practical interest, and can be identified by the sudden change of the charge-voltage curve slope. It is usually referred as the threshold voltage. Experimental charge-voltage curves (11 show that for slow front transiects, the threshold voltage is independent from the front slope, and corresponds to the corona-inception field strength given by the streamer approach considered in equation (7). On the contrary, for fast front transients, the experimental curves show that the threshold voltage
has an higher value, dependent on the voltage rate of rise. This may be explained by the dynamics of the space charge generation, which plays an important role for fast front surges and can be neglected for slow front transients [2].
[ l ] P.S. Maruvada, H. Menemenlis, R. Malewski, "Corona Characteristics of conductor bundles under impulse voltages: IEEE Trans., Vol. PAS-96, pp 102-1 15, Jan./Fev. 1977.
[2] C. de Jesus. M.T.Correia de Barros, "Modelling of corona Dynamics for Surge Propagation .%dies< IEEE Paper 94 WM 043-0-PWRD.
Manuscrip; received March 8, 1995.
Ali F. Imece (Morrison Knudsen Corp. Dedham, MA), Abdul M. Mousa (British Colombia Hydro, Vancouver, BC, Canada), Daniel W. Durbak (Power Technologies, Inc., Schenectady, NY), Doug Mader (Nova Scotia Power Corp., Halifax, Nova Scotia, Canada), Eva Tarasiewicz (Ontario Hydro, Toronto, Ontario, Canada), Ramasamy Natarajan (EBASCO, Lyndhurst, NJ), Andre Lux (ABB Power T&D, Raleigh, NC), Hamid Elahi (General Electric Company, Schenectady, NY), Sharma Kolluri (Entergy Services, Metairie, LA), Thomas E. McDermott (AnsoR Corp., Pittsburgh, PA), Atef Morched (Ontario Hydro, Toronto, Ontario, Canada), and Luis Rugeles (C.V.G. Edelca, Caracas, Venezuela); Members of the IEEE Task Force on Fast Front Transients wish to thank the discussers for their interest and valuable comments on this paper. We will address the issues raised in the discussions by order of appearance.
The discussions by Dr. W. A. Chisholm and Dr. H. Motoyama on line flashover rate gives a detailed accounting of the rate of rise of surge current, current magnitudes and possible stress on insulators, ground conductors and tower for different time periods. Further, the discussions on the IEEE Working Group method versus the CIGRE leader propagation model highlights the need for an improved model for flashover mechanism. We agree with the discussers that adjustments to the leader propagation model should match first and foremost observed characteristics of the leader velocity from experiments. As indicated already in the paper, we
504
100 5 00 1000 5000
-* 27,000 The discussers' recommendations concerning typical -* 5,400 capacitance values for 25 kip standard cap-and-pin
755 2,700 porcelain insulators generally agree with the values 151 found in the literature, and are of the order of 'bome 540
I ' 10 pF" [ 17, 181. However, the following insulator length versus capacitance curve for Lapp station post insulators indicates slightly higher values if * Rock footing are usually not used where po is low.
The stroke currents of interest in backflash extrapolated considering the dimensions for typical

505
suspension insulators [19]. As in the case of modeling studies, values are typically chosen based on organizations’ experiences or rule-of-thunib approximations. The value of 80 pF per unit was used in a study conducted by several of the authors in which transient study calculations were compared with high voltage impulse tests. The tests were performed on a full-scale substation mock up consisting of strain and rigid bus work, disconnect switches and suspension and post insulators [2, 201. With the selected capacitance values, good agreement was obtained between the test and computer simulation results [2],
Figure 1 . Station Post Insulator Capacitance
loo T
O J 0 10 20 30 40 50 60
Capacitance [pF]
For calculation of line constants, 500 kHz is recommended considering the frequency of surge propagation after backflashovers and reflections from adjacent towers. More rigorous approach would be to perform an FFT on the model step response, and determine the line parameters based on the observed resonant frequencies. The selection of 500 kHz is also supported by the error analysis on the line constants at various frequencies shown in Reference [lo] of the paper. For users who need accurate line models for surge propagation studies, refer to the exact line parameters presented at 400 k€h in Reference [21]. The discussion by Professor M.T. Correia de Barros on corona model is very helpful to clarifjl the definition of excess capacitance for steady-state versus transient conditions. She is correct concerning her comments on the concept of dynamic
capacitance for use in surge propagation studies. Equation (8) should read:
Ck = Ci - KVi + 2KV (8) and the sum of the excess capacitance and geometric capacitance is the dynamic capacitance:
Cdyn = c1, + c, Professor Correia de Barros is also correct in pointing out the usual distinction between the corona-inception voltage, obtained from the streamer approach as in Equation (7) and the threshold voltage corresponding to the sudden change in QN curve slope.
The increase in threshold voltage with increasing dV/dt has been accommodated by selecting higher values for Vi in Equation (8) than would be predicted by Equation (7). However, some proposals [22] explain this apparent increase physically in terms of the mechanical inertia of the particles and mobility losses, resulting in time delays observed as increases in the value of threshold voltage, which can be modeled as an RL component in series with the excess capacitance.
We wish also to report some minor revisions to the text which arose from discussions within the Task Force following publication of the preprint of this paper:
The section entitled ‘Lightning Stroke” discusses the typical current amplitudes involved in backflashovers and in direct strikes. In this connection, the following should be noted:
a) Regardless of mechanism by which a lightning voltage surge is generated (backflash or direct strike), the maximum amplitude of the surge may be taken equal to 1.2 x CFO, where CFO is the critical flashover voltage of the insulation. The 1.2 multiplier accounts for two effects:
i) the fact that the CFO is a median value and hence the insulation can carry higher voltages 50 % of the time, and,
ii) the CFO is based on the standard 1.2 x 50 ps impulse waveform.
The withstand voltage will hence be higher for steeper fronts and may also be higher for some non- standard waveforms.

506
b) In determining the maximum stroke current which can cause shielding failures, Reference [8] uses a model in which the striking distance to ground is taken equal to PS, where S is the striking distance to the wires, and P I 1.0 is a factor which is a hnction of the voltage. As noted in the discussion of [8] by A. Mousa, varying p with voltage produces results which are inconsistent with the physics of the problem. Reference [23] presents a revised electrogeometric model which gives predictions which match field observations.
REFERENCES
[20] Panek, J., Elahi, H., Lux, A., LaPanse, R., Stewart, J., Nilsson, S., Porter, J., “Substation Voltage Uprating,” .Int. Cod. on Large High Voltage Electric Systems (CIGRE), Paper 33-207, Aug. 30 - Sep. 5, 1992. [21] H.W. Dommel & C.R. Torres, ‘Simple Overhead Line Models for Lightning Surge Studies,’: EPRI EMTP Workbook 11, EPRI EL- 4651, Vol. 2, 1989. [22] F. Castellanos & J. R. Marti, “Dynamic Corona Modeling in the EMTP with Simple Constant Parameter Circuit Components, It Canadian Electrical Association Meeting, Montreal, Maroh 1993. [23] A. M. Mousa and K. D. Srivastava, ‘A Revised Electrogeometric Model for the Termination of Lightning Strokes on Ground Objects,”Proc. of Int. Aerospace and Ground Cod. on Lightning and Static Electricity, Oklahoma City, Oklahoma, pp.
[17] E* Kuffel’ w*s* Zaeng17 High Engineerinn Fundamentals, Pergamon Press, 1984. [18] J.S.T. Looms, Insulators for High Voltages, Peter Peregrinus Ltd., 1988. [ 191 Zoltan Szilagyi, Lapp Insulator Company, 342-352, April, 1988.
- - Private Communications, 1994. Manuscript received April 17, 1995.