Heterogeneously coupled maps: hub dynamics and emergence ...

Presenter: Tanjila Haque
Supervisor : Dr. Tariq Iqbal
Faculty of Engineering and Applied Science Memorial University of Newfoundland, St.John’s, Canada
18th July 2011
Modeling and Comparison of Dynamics of AC and DC Coupled
Remote Hybrid Power Systems
1
Research Overview • Many community around the world use diesel
generator based stand-alone power system • Rising fuel costs and environmental concerns make
the use of renewable energy in stand alone systems increasingly attractive.
• In this research an AC based and an DC based hybrid power system are designed and analyzed.
• A comparison is made based on steady-state and dynamic analysis
• In some case DC coupled hybrid system is better than AC coupled hybrid system.
2

Research Aims
• Design an AC and a DC coupled Hybrid power system • Optimal sizing of system components • Steady- state analysis • Simulink/Matlab models • Dynamic and Transient analysis • Comparison of AC and DC coupled hybrid power
system
3

HYBRID POWER SYSTEM • A system consisting of
two or more energy sources used together to provide increased system efficiency and a well balanced energy supply.
• May be a combination of renewable sources (solar, hydro, wind, biomass) and non-renewable sources
(fossil fuels).
4

Types of Hybrid Power System • DC (Direct Current ) coupled • AC (Alternating Current ) coupled
5

Load profile • Load of small community of about 160-180
residents is considered • Daily demands– 2500 kWh
• Peak load - 207 kW
• Load factor 0.503
Energy Planning
6

RENEWABLE RESOURCES -Wind Profile
• Based on data collected from (www.climate.weatheroffice.gc.ca) Wind speeds at an elevation of 50 m above sea level and scaled for 10 m height.
• Average annual wind speed – 6.041m/s • Averages higher in winter months than summer months • Correlates with higher loads in winter months
7

RENEWABLE RESOURCES –Solar Resource
• Based on data collected from NASA
• Solar radiation values are exported for latitude of 47° on monthly basis.
• Average solar energy 3.15kWh/m2-d.
• Averages are higher in May, June and July.
0.0
0.2
0.4
0.6
0.8
1.0
Jan Feb Mar Apr May Jun Jul Aug Sep Oct Nov Dec0
1
2
3
4
5
6
Daily
Rad
iatio
n (k
Wh/
m²/d
)
Global Horizontal Radiation
Clea
rnes
s In
dex
Daily Radiation Clearness Index 8

HYBRID SYSTEM DESIGN
• Photovolatic System • Wind turbines • Diesel Generators • Battery Bank • Converter
System Components
Type of Load • 30% AC and 70% DC load • 100% AC load
9

HYBRID SYSTEM DESIGN – Photovolatic System • 175W, 24 V Solar panel • Can withstand high
loads such as heavy accumulations of snow and ice.
• Deliver maximum power output even under reduced light conditions.
• Price for one panel $830
10
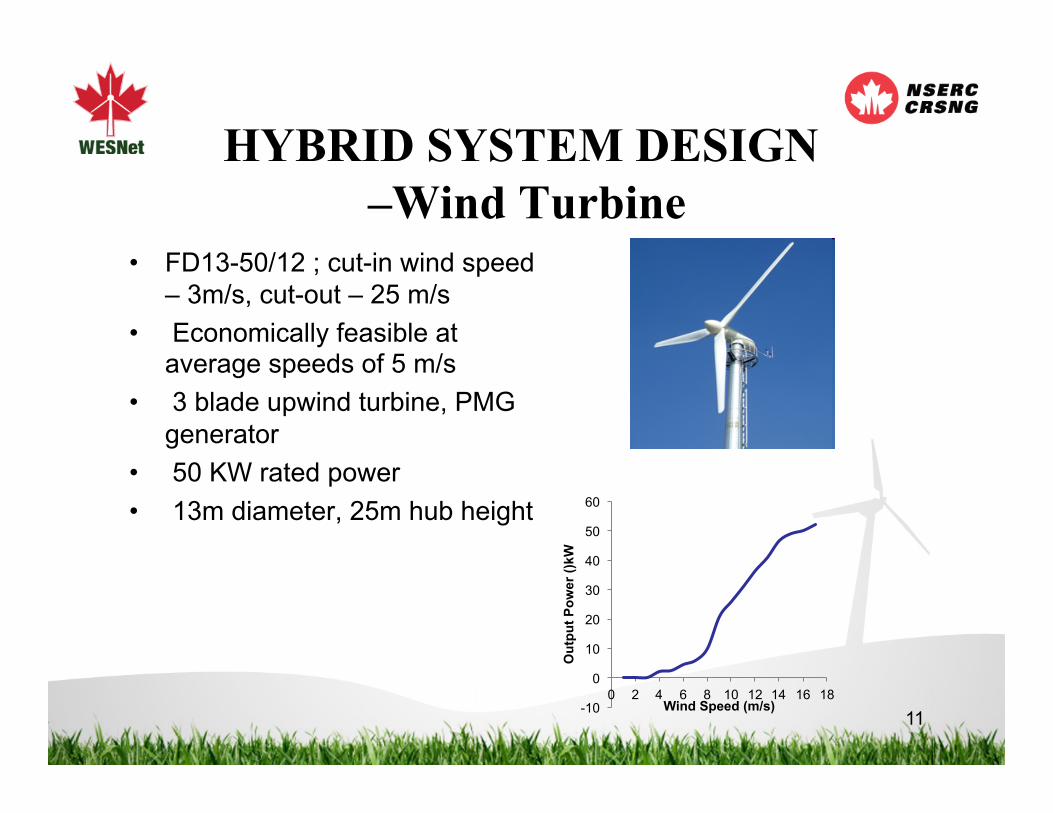
HYBRID SYSTEM DESIGN –Wind Turbine
• FD13-50/12 ; cut-in wind speed – 3m/s, cut-out – 25 m/s
• Economically feasible at average speeds of 5 m/s
• 3 blade upwind turbine, PMG generator
• 50 KW rated power • 13m diameter, 25m hub height
11 -10
0
10
20
30
40
50
60
0 2 4 6 8 10 12 14 16 18
Out
put P
ower
()kW
Wind Speed (m/s)
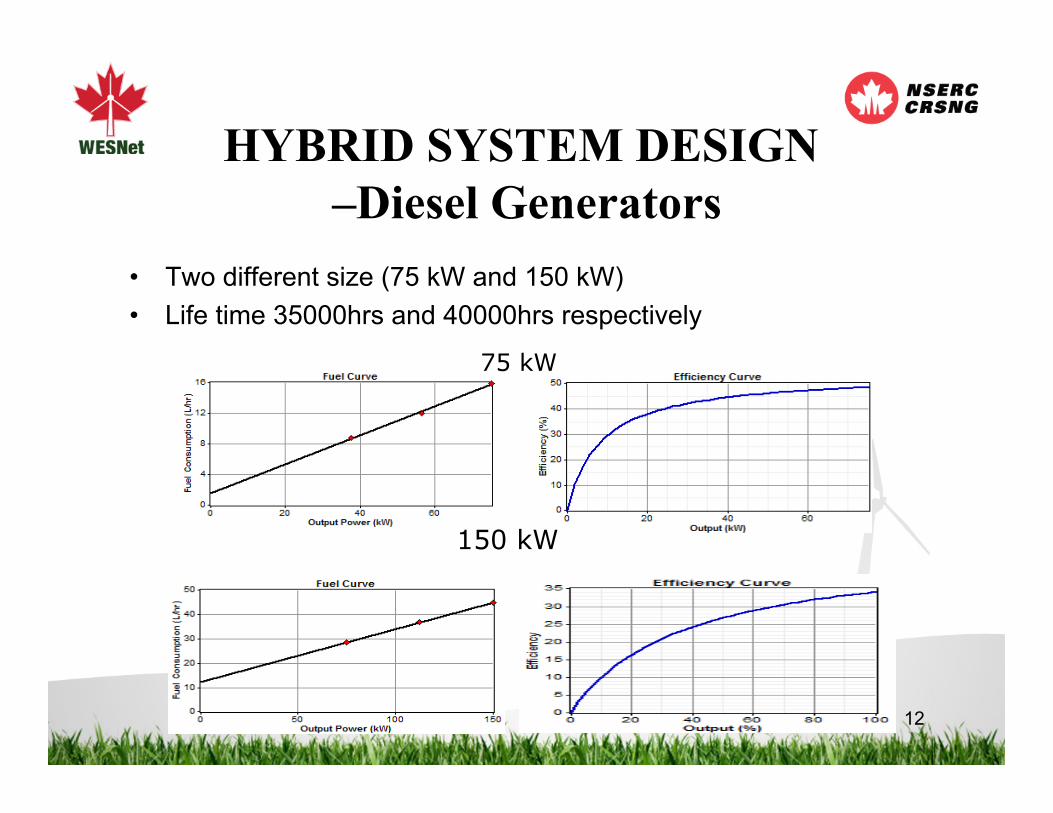
HYBRID SYSTEM DESIGN –Diesel Generators
• Two different size (75 kW and 150 kW) • Life time 35000hrs and 40000hrs respectively
75 kW
150 kW
12
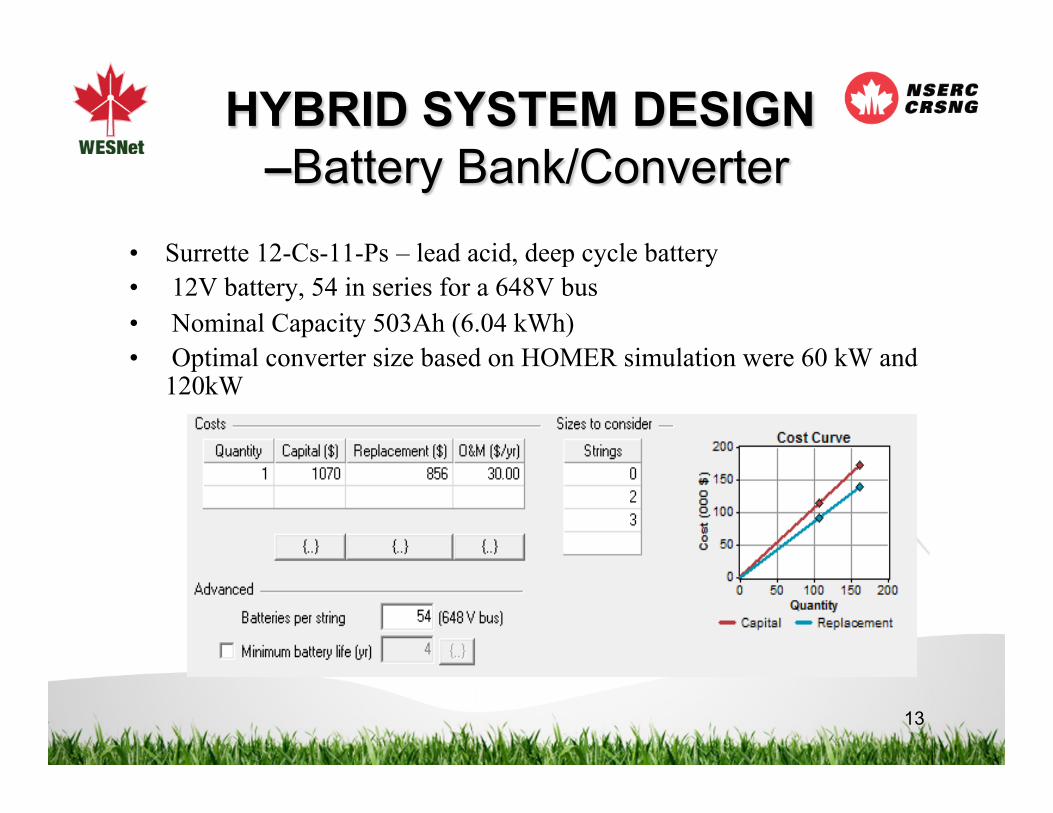
HYBRID SYSTEM DESIGN –Battery Bank/Converter
• Surrette 12-Cs-11-Ps – lead acid, deep cycle battery • 12V battery, 54 in series for a 648V bus • Nominal Capacity 503Ah (6.04 kWh) • Optimal converter size based on HOMER simulation were 60 kW and
120kW
13

HYBRID SYSTEM DESIGN – System Architecture (30% AC & 70% DC Load)
• AC (Alternating current ) coupled system:
• DC (Direct current ) coupled system:
14

HYBRID SYSTEM DESIGN –Simulation Results
• AC coupled system with 30% AC & 70 % DC Load :
• DC coupled system with 30% AC & 70 % DC Load :
15

HYBRID SYSTEM DESIGN –Simulation Results
16
AC coupled system with 100% AC Load
DC coupled system with 100% AC Load

HYBRID SYSTEM DESIGN – Cost Summary (30% AC & 70% DC Load)
AC coupled system: DC coupled system:
17

HYBRID SYSTEM DESIGN –Electrical Production (30% AC & 70% DC Load)
System Components
Electrical production of DC System
Electrical production of AC System
(kWh/yr) % (kWh/yr) %
PV array 5,213 0 36,657 3
Wind turbines 730,987 60 730,987 57
75kW Diesel 311,734 25 314,417 25
150kW Diesel 177,782 15 195,454 15
Total 1,225,716 100 1,277,515 100
AC coupled system:
DC coupled system:
18

Comparison: Based on Component Required
Component
AC Based System
DC Based System
PV 4.725 kW 4.725 kW
W.T 4 * 50 kW 4 * 50 kW
D-75 kW 1* 75 kW 1* 75 kW
D-150 kW 1 * 150kW
1 * 150kW
Battery 108 number
108 number
Converter 180 kW 180 kW 19
Component
AC Based System
DC Based System
PV
33 kW 4.725 kW
W.T 5 * 50 kW 5 * 50 kW
D-75 kW 1* 75 kW 1* 75 kW
D-150 kW 1 * 150kW 1 * 150kW
Battery 108 number
108 number
Converter 120 kW 60 kW
• 100 % AC Load • 30 % AC and 70% DC load

Comparison: Based on Cost
20
100 % AC Load 30 % AC and 70% DC load
Cost Type AC Based System
DC Based System
Initial Capital cost($)
13,72,970 13,72,970
Operating cost ($/Y)
182,424 187,054
Total NPC ($)
3,704,959 3,764,154
COE (%/kWh)
0.318 0.323
Cost Type
AC Based System
DC Based System
Initial Capital cost($)
17,38,260
15,67,970
Operating cost ($/Y)
180,033 174,044
Total NPC ($)
4,039,688
3,792,835
COE (%/kWh)
0.346 0.326

Comparison: Based on Diesel Use and Corresponding Emission
AC System
DC System
Diesel (L) 121,925 125,659
21
AC System
DC System
Diesel (L) 127,057 122,102
Pollutant Emission (Kg/Yr)
Emission (Kg/Yr)
CO2 321,070 330,901 CO 793 817
UHCs 87.8 90.5 PM 59.7 61.6 SO2 645 665 NOx 7,072 7,288
Pollutant Emission (Kg/Yr)
Emission (Kg/Yr)
CO2 334,583 321,536 CO 826 794
UHCs 91.5 87.9 PM 62.3 59.8 SO2 672 646 NOx 7,369 7,082
100 % AC Load 30 % AC and 70% DC load
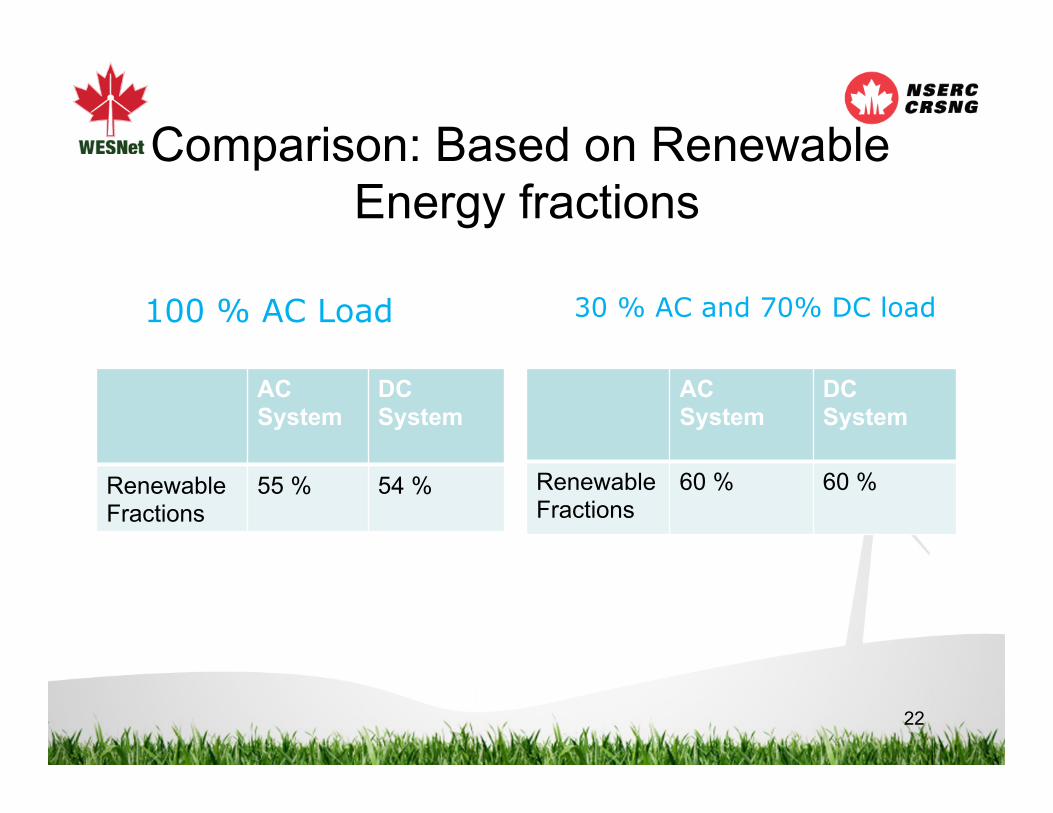
Comparison: Based on Renewable Energy fractions
22
AC System
DC System
Renewable Fractions
55 % 54 %
AC System
DC System
Renewable Fractions
60 % 60 %
100 % AC Load 30 % AC and 70% DC load

Matlab/ Simulink Model of WT
23
Model of PMG based WECS for DC System

24
Matlab/ Simulink Model of WT (cont.) Model of PMG based WECS for AC System

Matlab/ Simulink Model of WT (cont.)
25
Model of induction generator based WECS for AC system.

26
Vs= 5 m/s; Pout = 1.2 kW
Vs= 6 m/s; Pout = 4.3 kW Vs= 7 m/s; Pout = 5.1 kW
Vs= 8 m/s; Pout = 22 kW Vs= 9 m/s; Pout = 24 kW
Vs= 10 m/s; Pout = 26.2 kW
Matlab/ Simulink Model of WT (cont.)

27
Vs=11m/s; Pout = 27.5 kW
Vs= 12 m/s; Pout =30 kW Vs= 13 m/s; Pout = 37 kW
Vs= 14 m/s; Pout =44kW Vs=15 m/s; Pout = 50kW
Matlab/ Simulink Model of WT (cont.)

Comparison of the Power Curves Found from Simulation Results and
from the Manufacturer
28

Matlab/ Simulink Model of PV System
29
Two Diode Solar Cell Model

30
Matlab/ Simulink Model of PV System (Cont.)
Modeling of Solar panel

Power Generation in Solar Panel at Different Solar Irradiance (Cont.)
31
G =1000W/m2 Ppv = 175 W G =800W/m2; Ppv = 142 W G =600W/m2; Ppv = 108 W
G =400W/m2; Ppv = 72 W
G =200W/m2; Ppv = 34 W G =100W/m2; Ppv = 16 W G =50W/m2; Ppv = 7 W G =0W/m2; Ppv = 0 W

Matlab/ Simulink Model of Diesel Generator
32

Simulation Result of Diesel Generator
33

Matlab/ Simulink Model of Battery
34
Discharge model
Charge model

Transient Analysis of AC Coupled Hybrid Power System
35

CS1: Simulation With Fixed Wind Speed Variable Load
36
Load 350/400/350
kW
Wind Speed 15 m/s
No change in WT
power
DGs respond with
main load variation

CS1: Simulation With Fixed Wind Speed Variable Load (cont.)
• Effect of change of load on voltage and Frequency
37
Effect on Voltage
Effect on Frequency
f, goes down from 60 Hz to 59.6 Hz
f, rises from 60 Hz to 60.1 Hz

CS2: Simulation With Fixed Load Variable Wind Speed
38
Load 300kW
Wind Speed 15/10/14
m/s
WTs respond to wind
speed change
When wind generation
drop, DGs met up
additional load

CS2: Simulation With Fixed Load Variable Wind Speed (cont.)
39
Effect of change of Wind Speed on voltage and Frequency
f, goes down from 60 Hz to 58.9 Hz
f, rises from 60 Hz to 60.4 Hz
Effect on Voltage
Effect on Frequency

40
CS2: Simulation With Fixed Load Variable Wind Speed (cont.)
Load 200kW
Wind Speed 7/9 m/s
WTs respond to wind
speed change
When wind generation
rises, Diesel generation
drop automatically.

41
f, rises from 60 Hz to 60.4 Hz
Effect of change of Wind Speed on voltage and Frequency
Effect on Voltage
Effect on Frequency
CS2: Simulation With Fixed Load Variable Wind Speed (cont.)

42
Load 350kW
Wind Speed 14/15 m/s
WTs respond to wind
speed change
When wind generation
rises, Diesel generation
drop automatically.
CS2: Simulation With Fixed Load Variable Wind Speed (cont.)

43
f, rises from 60 Hz to 60.2 Hz
No Significant Effect on Voltage
Effect on Frequency
Effect of change of Wind Speed on voltage and Frequency
CS2: Simulation With Fixed Load Variable Wind Speed (cont.)

44
CS3: Simulation With Diesel Generator and Photovoltaic System(cont.)
Load 200kW
Zero Wind Speed
Load is met by DGS
and PV.

45
CS3: Simulation With Diesel Generator and Photovoltaic System(cont.)
Effect on voltage and Frequency
No Effect on Voltage as expected
No Effect on Frequency as expected
46
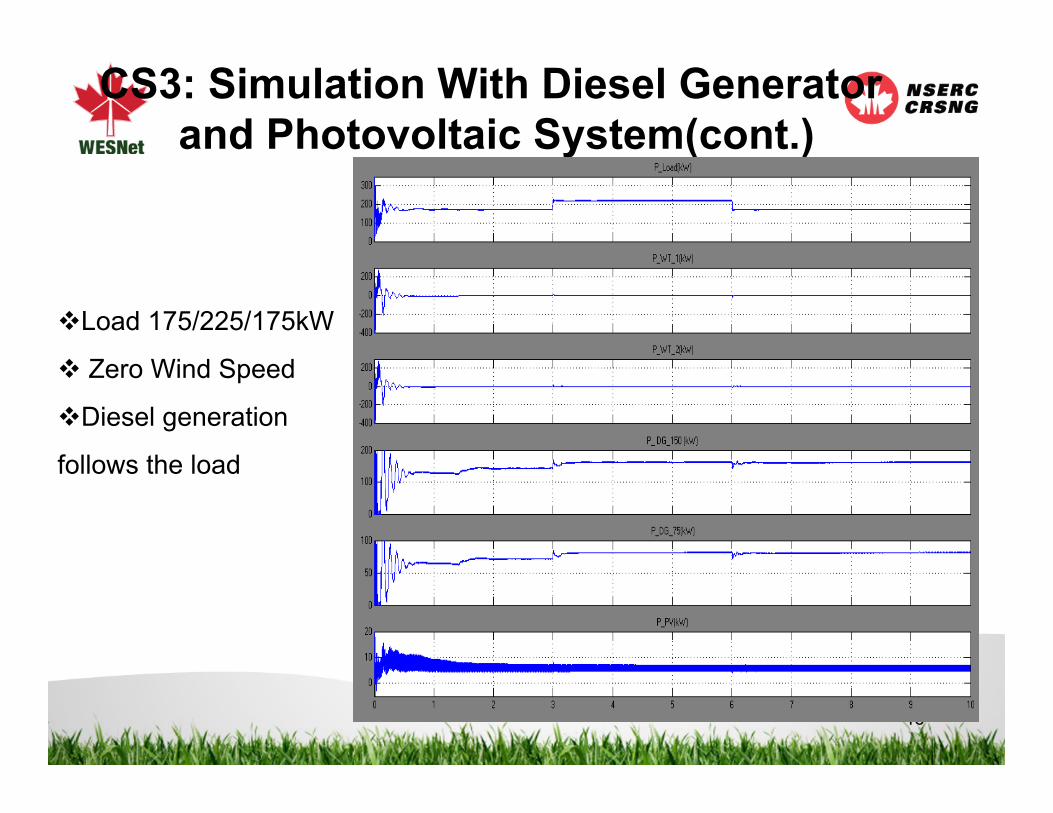
CS3: Simulation With Diesel Generator and Photovoltaic System(cont.)
Load 175/225/175kW
Zero Wind Speed
Diesel generation
follows the load

47
CS3: Simulation With Diesel Generator and Photovoltaic System
Effect on voltage and Frequency
f, goes down from 60 Hz to 59.7 Hz
f, rises from 60 Hz to 60.2 Hz
Effect on Voltage
Effect on Frequency

48
Transient Analysis of DC Coupled Hybrid Power System

49
CS1: Simulation With Fixed Wind Speed Variable Load
Load 550/600/550
kW
Wind Speed 15 m/s
No change in WT
power
DGs respond with
main load variation
Power quality of PV
is better than AC

50
CS2: Simulation With Fixed Load Variable Wind Speed
Load 300kW
Wind Speed 15/10/14
m/s
WTs respond to wind
speed change
When wind generation
drop, DGs met up
additional load

51
Load 200kW
Wind Speed 7/9 m/s
WTs respond to wind
speed change
When wind generation
rises, Diesel generation
drop automatically.
CS2: Simulation With Fixed Load Variable Wind Speed (cont.)

52
Load 350kW
Wind Speed 14/15 m/s
WTs respond to wind
speed change
When wind generation
rises, Diesel generation
drop automatically.
CS2: Simulation With Fixed Load Variable Wind Speed (cont.)

53
CS3: Simulation With Diesel Generator and Photovoltaic System(cont.)
Load 200kW
Zero Wind Speed
Load is met up by DGS
and PV.

54
Load 175/225/175kW
Zero Wind Speed
Diesel generation
follows the load
CS3: Simulation With Diesel Generator and Photovoltaic System (cont.)

Conclusions • Wind data, solar data and load data of small
community of St. John’s Newfoundland have been collected and studied.
• Economical and feasible components of the hybrid power system have been selected so that minimized system cost can be achieved.
• AC coupled and DC coupled hybrid systems have been designed using HOMER.
• Comparison has been made between these two system based on component required, system cost, use of renewable fraction, diesel used and corresponding emissions.
55

Conclusion(cont.) • Modeling of individual component has been done by
using Matlab /Simulink. • Individual models have been combined to form the
complete system. • Three different case studies have been considered for
transient analysis. • Finally it can be said that for remote hybrid power
system based on DC coupling would be a better power system option
56

Future Works • Longer duration Simulation • Introduce precise control mechanisms in each sub
block. • Selecting a location with higher solar radiation
resource. • Build AC based system and DC based systems and
compares their performance • The power distribution of DC based system would be
an interesting scope of further work.
57

Acknowledgment
• Dr. Tariq Iqbal • National Science and Engineering Research
Council (NSERC), Wind Energy strategic Network (WESNet), School of Graduate Studies (SGS) of Memorial University
58

Publications • Tanjila Haque, M. T. Iqbal, “A Comparison of Dynamics and
Control of AC and DC Coupled Hybrid Power Systems,” presented at WESNet Workshop, February 24-25, Ryerson University, Toronto, ON, Canada 2011
• Tanjila Haque, M. T. Iqbal, “A Comparison of AC and DC Coupled Remote Hybrid Power Systems,” presented at 19th IEEE-NECEC Conference 2010, St. John’s, NL
• Tanjila Haque, M. T. Iqbal, “A Comparison of AC and DC Coupled Hybrid Power Systems,” presented in WESNet Poster Presentation, CanWEA, 2010, Montreal, Quebec
59

60
Thanks