Model-Drawing Strategy to Solve Word Problems for Students with LD Olga Jerman and Jacqueline Knight...
21
Model-Drawing Strategy to Solve Word Problems for Students with LD Olga Jerman and Jacqueline Knight The Frostig Center www.frostig.org DISCES CEC Riga, Latvia July 11- 14, 2010 FrostigCenter
-
Upload
brook-boyd -
Category
Documents
-
view
219 -
download
0
Transcript of Model-Drawing Strategy to Solve Word Problems for Students with LD Olga Jerman and Jacqueline Knight...
Model-Drawing Strategy to Solve Word Problems for Students with LD
Olga Jerman and Jacqueline KnightThe Frostig Centerwww.frostig.org
DISCES CECRiga, LatviaJuly 11- 14, 2010
FrostigCenter

FrostigCenter
Example:Word Problems with Percentage
40% of the school students went to the National History Museum for a field trip. 20% of students went to the zoo. 50% of the remaining students went to a farm. Only 60 students didn’t have a field trip and stayed at school. How many students are there in this school?
Abstract
• The study examined the effectiveness of using model-drawing methodology to solve problems for a group of high school students.
• The 30-week intervention used a single-subject design to teach an 8-step model-drawing approach for solving problems with fractions and percentages.
• The results showed improvement in solution accuracy.
FrostigCenter
FrostigCenter
Word-problem Solving and LD
• difficult and frustrating• cognitive processes involved in successful problem completion.

• Research findings indicate that the reduction of demands on the working memory system (WM) seems to be highly beneficial.
• Different ways to minimize demands: use of visual support via pictures, diagrams &
schemas use of cognitive strategies
FrostigCenter
Purpose of the Study
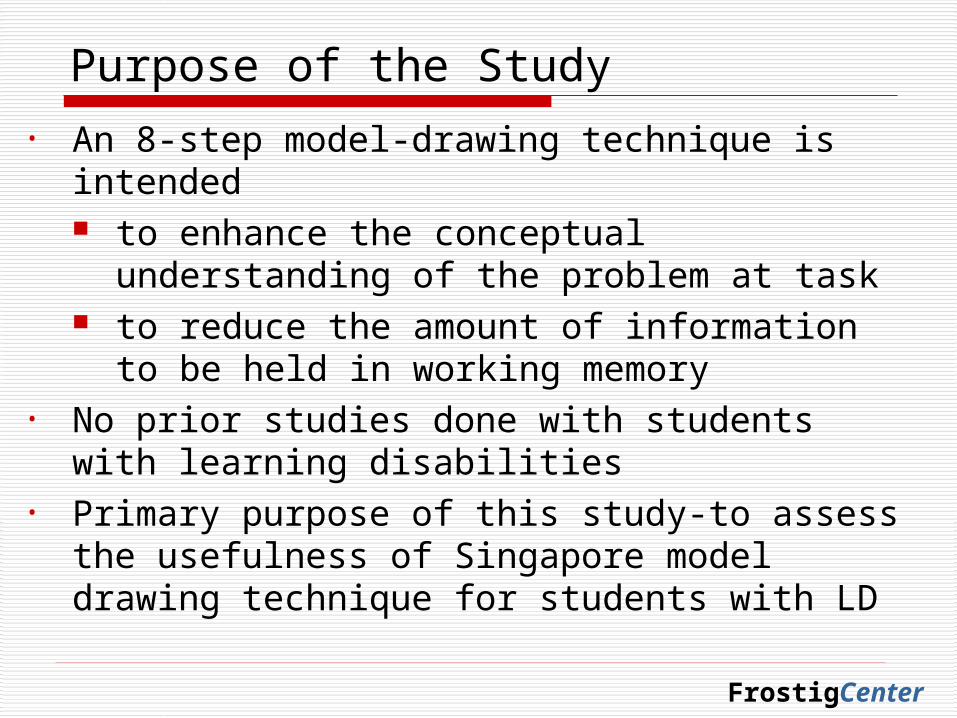
• An 8-step model-drawing technique is intended to enhance the conceptual
understanding of the problem at task to reduce the amount of information to
be held in working memory• No prior studies done with students with
learning disabilities• Primary purpose of this study-to assess the
usefulness of Singapore model drawing technique for students with LD
FrostigCenter
FrostigCenter
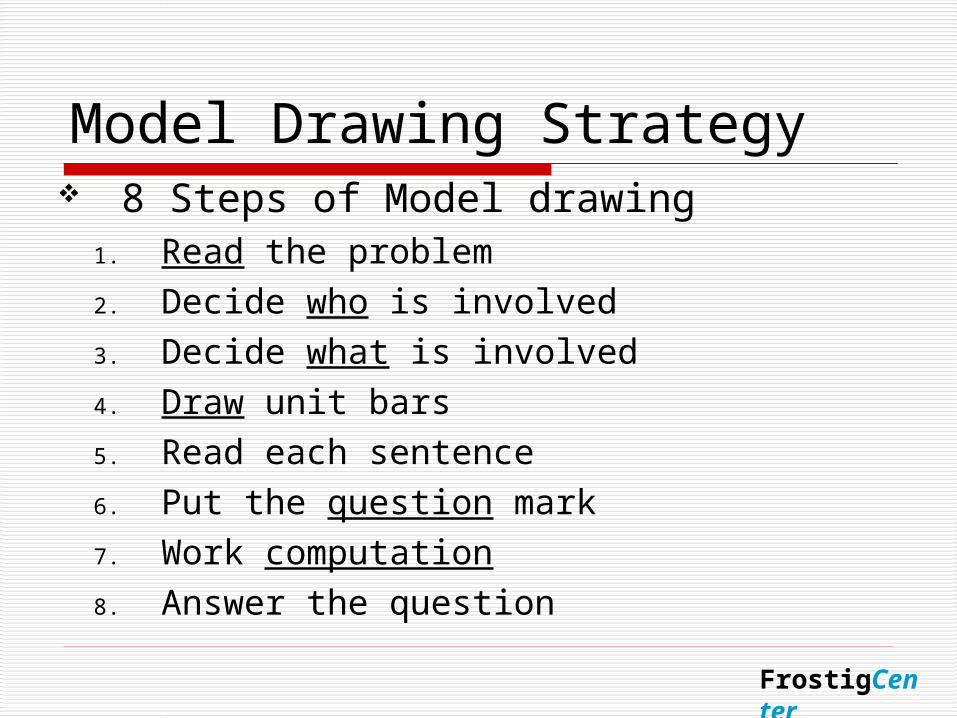
Model Drawing Strategy 8 Steps of Model drawing
1. Read the problem2. Decide who is involved3. Decide what is involved4. Draw unit bars5. Read each sentence6. Put the question mark7. Work computation8. Answer the question

FrostigCenter
Example:Word Problems with Percentage
40% of the school students went to the National History Museum for a field trip. 20% of students went to the zoo. 50% of the remaining students went to a farm. Only 60 students didn’t have a field trip and stayed at school. How many students are there in this school?
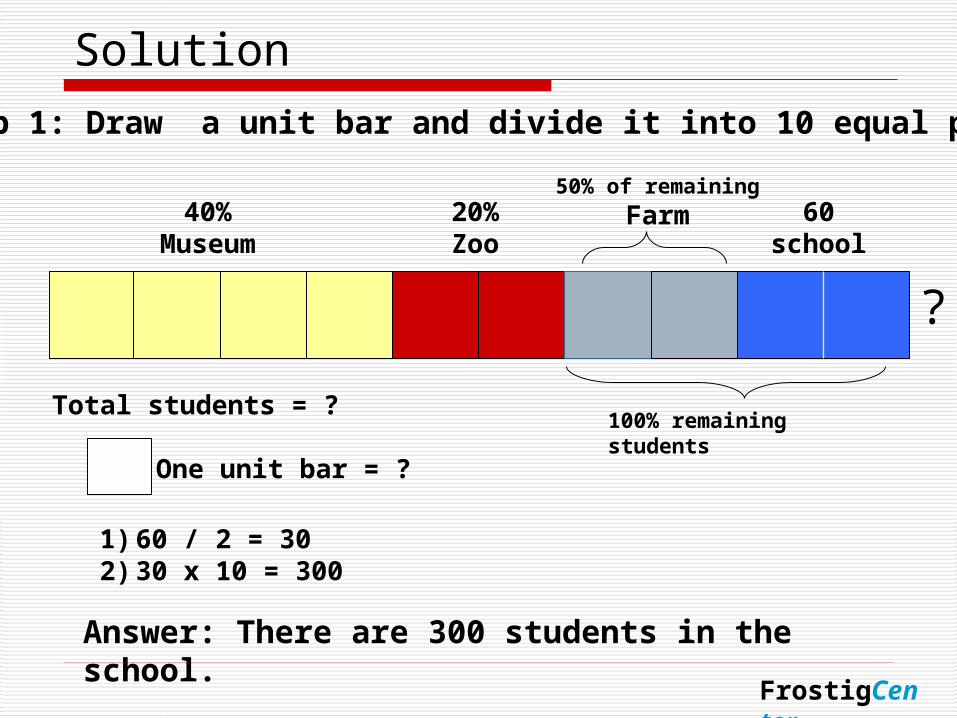
Solution
40%Museum
20%Zoo
50% of remaining
Farm 60school
Total students = ?
1) 60 / 2 = 302) 30 x 10 = 300
Answer: There are 300 students in the school.
Step 1: Draw a unit bar and divide it into 10 equal parts
One unit bar = ?
100% remaining students
FrostigCenter
?
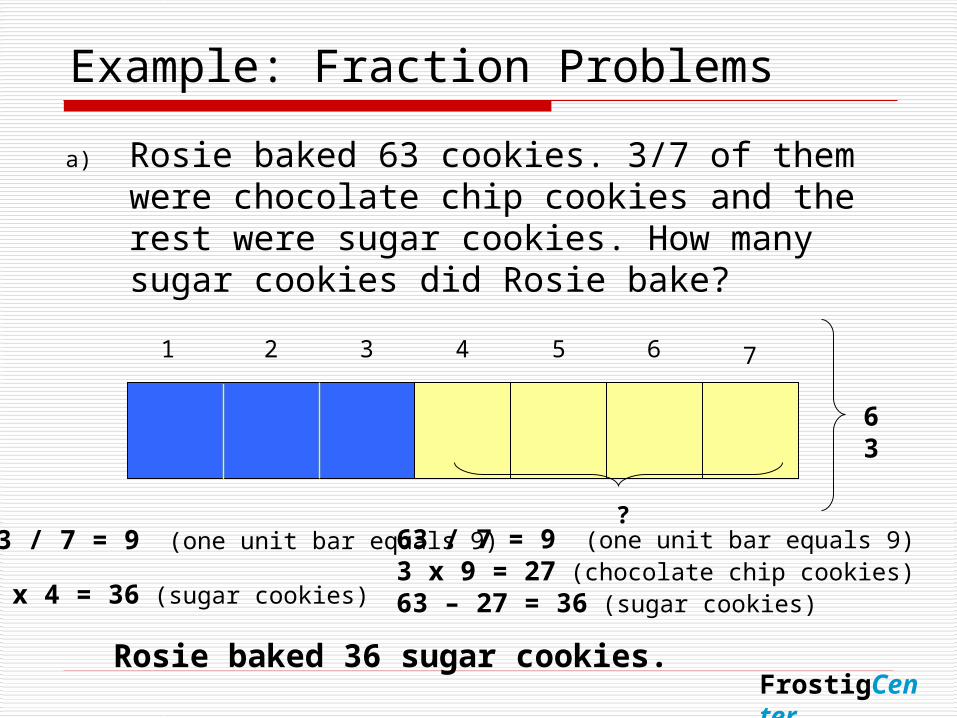
Example: Fraction Problems
a) Rosie baked 63 cookies. 3/7 of them were chocolate chip cookies and the rest were sugar cookies. How many sugar cookies did Rosie bake?
1 2 3 4 5 6 7
63
63 / 7 = 9 (one unit bar equals 9)
9 x 4 = 36 (sugar cookies)
63 / 7 = 9 (one unit bar equals 9)3 x 9 = 27 (chocolate chip cookies)63 – 27 = 36 (sugar cookies)
FrostigCenter
?
Rosie baked 36 sugar cookies.
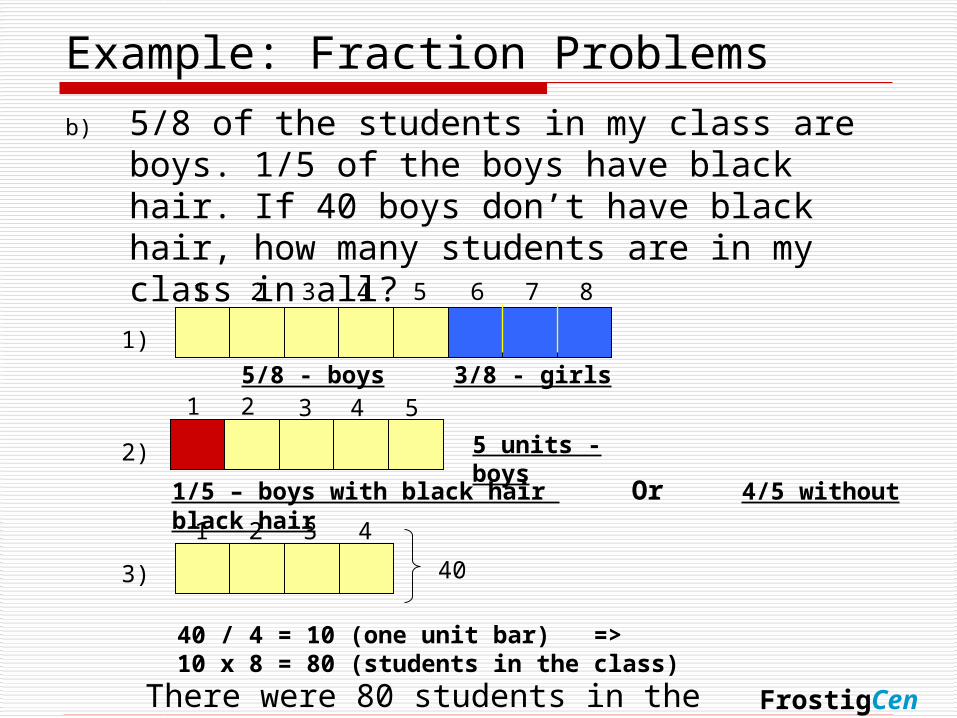
Example: Fraction Problems
b) 5/8 of the students in my class are boys. 1/5 of the boys have black hair. If 40 boys don’t have black hair, how many students are in my class in all?
1 2 3 4 5 6 7 8
5/8 - boys 3/8 - girls
1)
5 units - boys
21 3 4 5
1/5 – boys with black hair Or 4/5 without black hair
1 3 42
403)
2)
40 / 4 = 10 (one unit bar) => 10 x 8 = 80 (students in the class)
FrostigCenter
There were 80 students in the class.
FrostigCenter
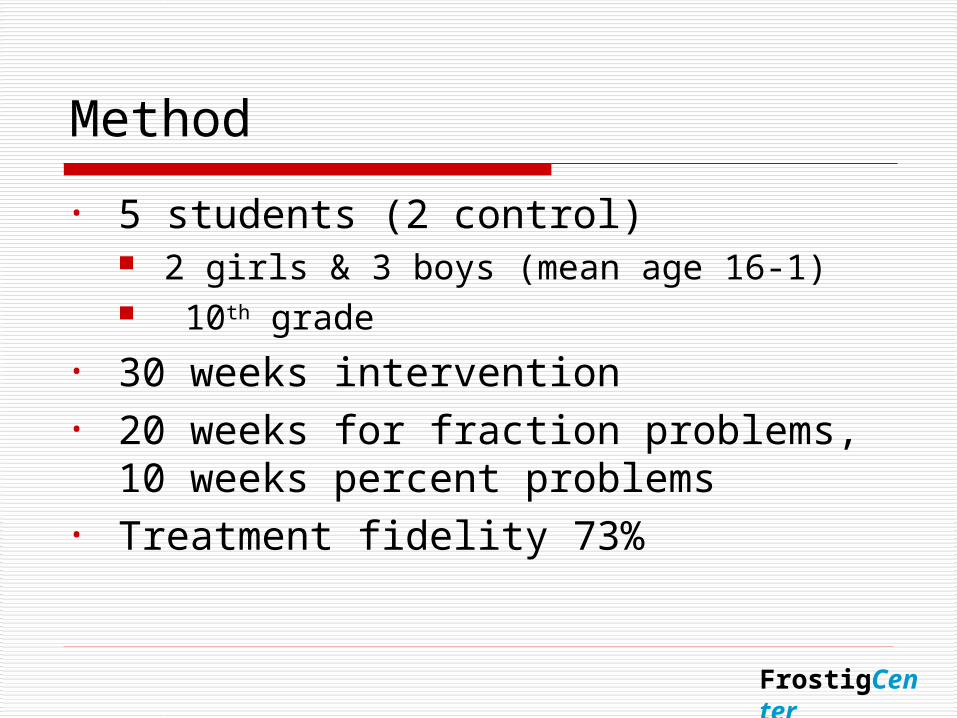
Method
• 5 students (2 control) 2 girls & 3 boys (mean age 16-1) 10th grade
• 30 weeks intervention• 20 weeks for fraction problems, 10
weeks percent problems• Treatment fidelity 73%
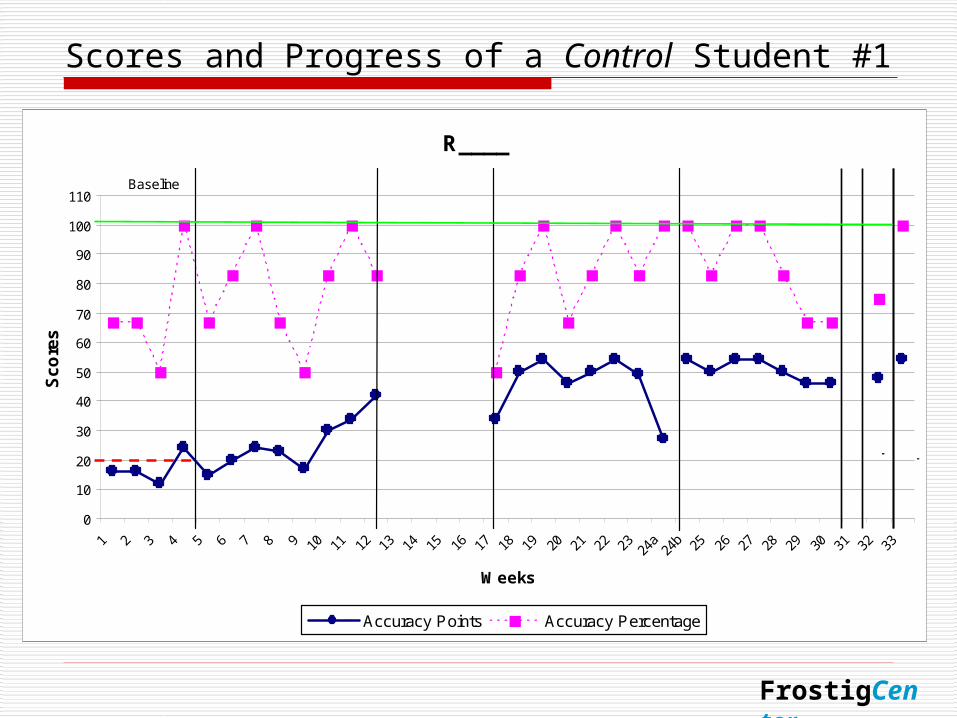
Scores and Progress of a Control Student #1
R____
0
10
20
30
40
50
60
70
80
90
100
110
1 2 3 4 5 6 7 8 9 10 11 12 13 14 15 16 17 18 19 20 21 22 23 24a
24b 25 26 27 28 29 30 31 32 33
Weeks
Sc
ore
s
Accuracy Points Accuracy Percentage
Baseline No InterventionIntervention 1
Fractions
Intervention 2Fractions
Intervention 3Percentiles
No
Inte
rven
tion
Fol
low
-up
Fra
ctio
ns
Fol
low
-up
Per
cent
iles
M=20
FrostigCenter
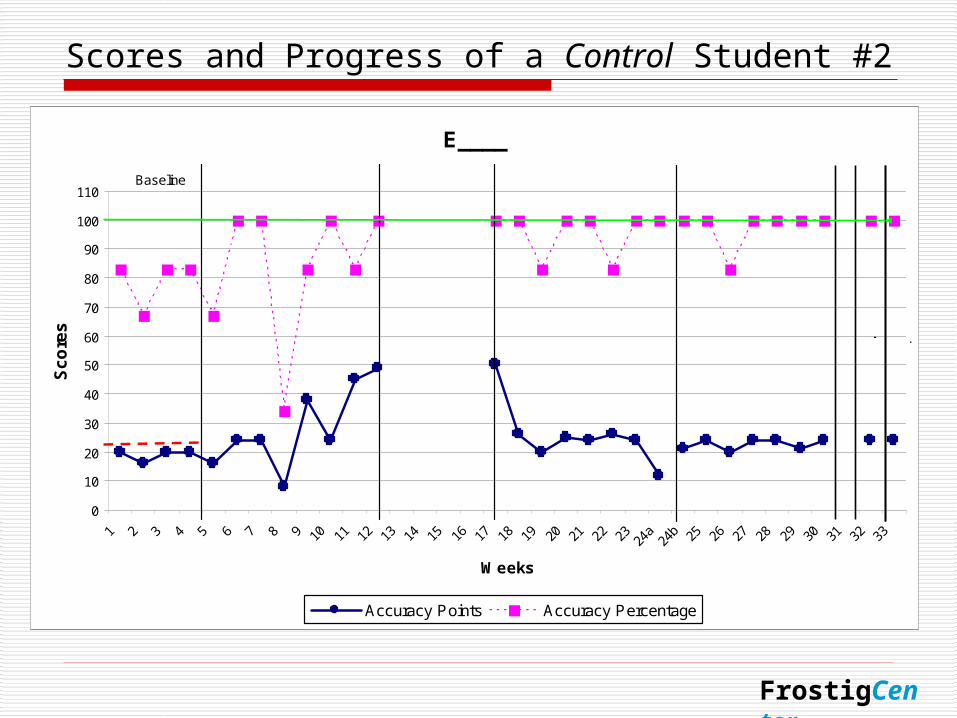
Scores and Progress of a Control Student #2
E____
0
10
20
30
40
50
60
70
80
90
100
110
1 2 3 4 5 6 7 8 9 10 11 12 13 14 15 16 17 18 19 20 21 22 23 24a
24b 25 26 27 28 29 30 31 32 33
Weeks
Sc
ore
s
Accuracy Points Accuracy Percentage
Baseline No InterventionIntervention 1
Fractions
Intervention 2Fractions
Intervention 3Percentiles
M=21.33
No
Inte
rven
tion
Fol
low
-up
Fra
ctio
ns
Fol
low
-up
Per
cent
iles
FrostigCenter

Scores and Progress of a Tx student #1
C______
0
10
20
30
40
50
60
70
80
90
100
110
1 2 3 4 5 6 7 8 9 10 11 12 13 14 15 16 17 18 19 20 21 22 23 24a
24b 25 26 27 28 29 30 31 32 33
Weeks
Sc
ore
s
Accuracy Points Accuracy Percentage
Baseline No InterventionIntervention 1
Fractions
Intervention 2Fractions
Intervention 3Percentiles
M=1.25
No
Inte
rven
tion
Fol
low
-up
Fra
ctio
ns
Fol
low
-up
Per
cent
iles
FrostigCenter
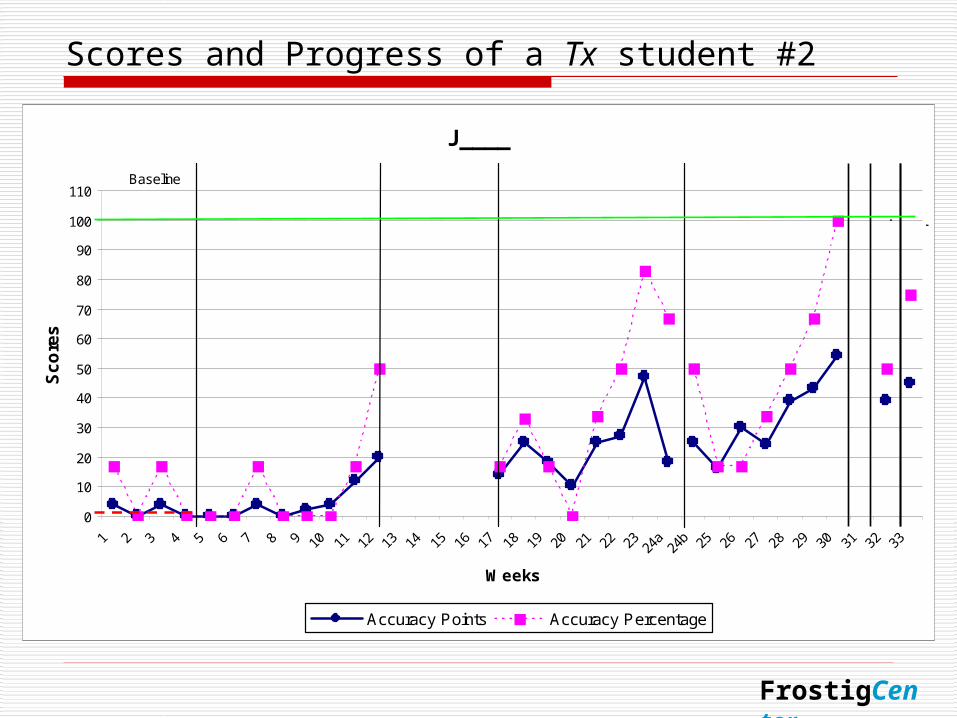
J____
0
10
20
30
40
50
60
70
80
90
100
110
1 2 3 4 5 6 7 8 9 10 11 12 13 14 15 16 17 18 19 20 21 22 23 24a
24b 25 26 27 28 29 30 31 32 33
Weeks
Sc
ore
s
Accuracy Points Accuracy Percentage
Baseline No InterventionIntervention 1
Fractions
Intervention 2Fractions
Intervention 3Percentiles
No
Inte
rven
tion
Fol
low
-up
Fra
ctio
ns
Fol
low
-up
Per
cent
iles
M=1
Scores and Progress of a Tx student #2
FrostigCenter
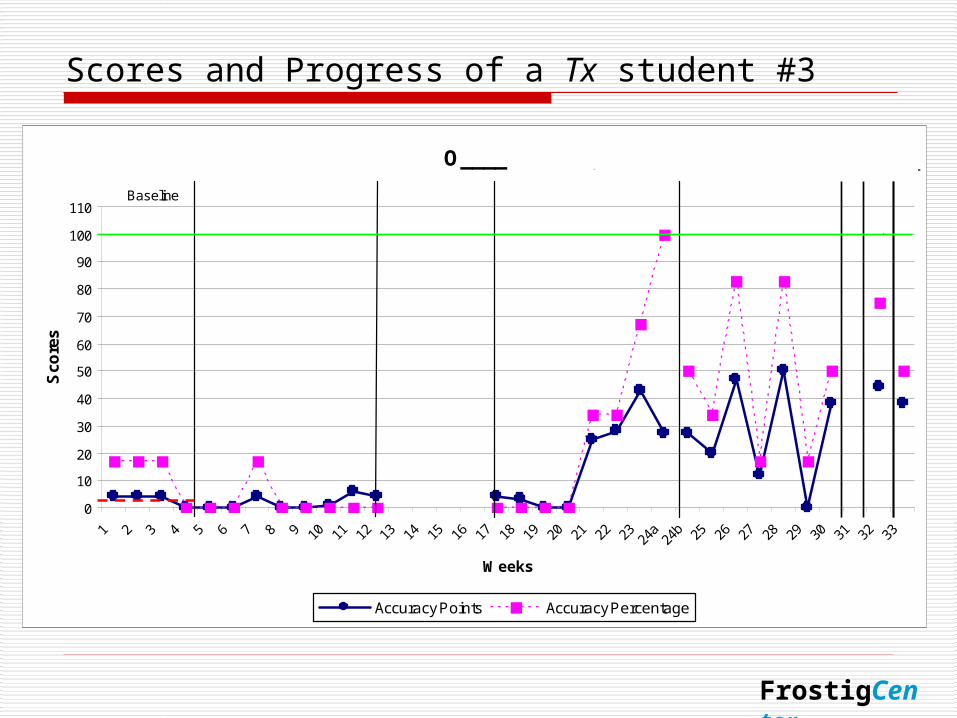
O____
0
10
20
30
40
50
60
70
80
90
100
110
1 2 3 4 5 6 7 8 9 10 11 12 13 14 15 16 17 18 19 20 21 22 23 24a
24b 25 26 27 28 29 30 31 32 33
Weeks
Sco
res
Accuracy Points Accuracy Percentage
Baseline No InterventionIntervention 1
Fractions
Intervention 2Fractions
Intervention 3Percentiles
No
Inte
rven
tion
Fol
low
-up
Fra
ctio
ns
Fol
low
-up
M=2
Scores and Progress of a Tx student #3
FrostigCenter
FrostigCenter
Conclusion
• Model-drawing strategy can be an effective alternative method of teaching fraction and percent problems to students with LD;
• Although the training yielded improvement, it took longer for the students to learn the technique than initially planned;
• Students’ performance remained higher than their pre-intervention scores, though it slightly declined at the 4-week follow-up;
ImplicationsTheoretical and Practical Considerations Due to their abstract nature, word problems with
percent and fractions are especially hard to tackle for students with LD.
The model-drawing approach gives students a more concrete method in comprehending and solving word problems in order to get past their language difficulties.
By drawing out what they are reading, the students are creating a concrete visual application of the problem. This helps them to manipulate the numbers more easily.
FrostigCenter

FrostigCenter
Implications (cont.)
The word problem instruction could also be applied in different ways: either in the large-group format or as part of differentiated instruction.
The model drawing gives students a clear procedure for comprehending and executing problems.
As students understand each level of a problem, the problem of the day or of the lesson can eventually be taught at grade level.
References• Jitendra, A. K., Griffin, C. C., McGoey, K., Gardill, M. C., Bhat, P., & Riley, T. (1998).
Effects of mathematical word problem-solving by students at risk or with mild
disabilities. Journal of Educational Research, 91, 345-355.
• Marshall, S. P. (1995). Schemas in problem solving, Cambridge University Press.
• Montague, M. Self-Regulation strategies for better math performance in middle school.
(In M Montague and A Jitendra 2006, pp. 86-106).
• Newcombe, N. S., Ambady, N., Eccles, J., et al (2009). Psychology’s Role in mathematics
and Science Education. American Psychologist, 64, 6, 538-551.
• Powell, S. R., Fuchs, L. S., Fuchs, D., Cirino, P. T., & Fletcher, J. M. (2009). Do word-
problem features affect problem difficulty as a function of students’ mathematics
difficulty with and without reading difficulty? Journal of Learning Disabilities, 42, 99-111.
• Swanson, H. L. & Beebe-Frankenberger, M. (2004). The relationship between working
memory and mathematical problem solving in children at risk and not at risk for serious
math difficulties. Journal of Educational Psychology, 96, 471-491.
• Xin, Y. P., Wiles, B., & Lin, Y. (2008). Teaching conceptual model-based word problem
story grammar to enhance mathematics problem solving. The Journal of Special
Education, 42, 163-178.