Mobile Telecom - · PDF fileMobile Telecom Building Connections ... Continuous decline in the...
18
Mobile Telecom Building Connections January 2016 Pakistan Cellular Industry Industry – Structure Regional Comparison Snapshot
Transcript of Mobile Telecom - · PDF fileMobile Telecom Building Connections ... Continuous decline in the...
Mobile TelecomBuilding Connections
January 2016
Pakistan Cellular Industry
Industry – Structure
Regional Comparison
Snapshot

Pakistan Cellular Industry
Industry – Structure Regional Comparison Snapshot
Year (Fixed + WLL) Mobile Total
2003-04 3 3 6
2004-05 4 8 12
2005-06 4 22 26
2006-07 4 40 44
2007-08 4 55 59
2008-09 4 58 62
2009-10 4 60 64
2010-11 4 65 68
2011-12 4 69 72
2012-13 4 71 75
2013-14 3 76 80
2014-15 2 61 63
Sep-15 2 63 65
Teledensity (%)
Teledensity in Pakistan
Pakistan Cellular Industry
Industry – StructureRegional
ComparisonSnapshot
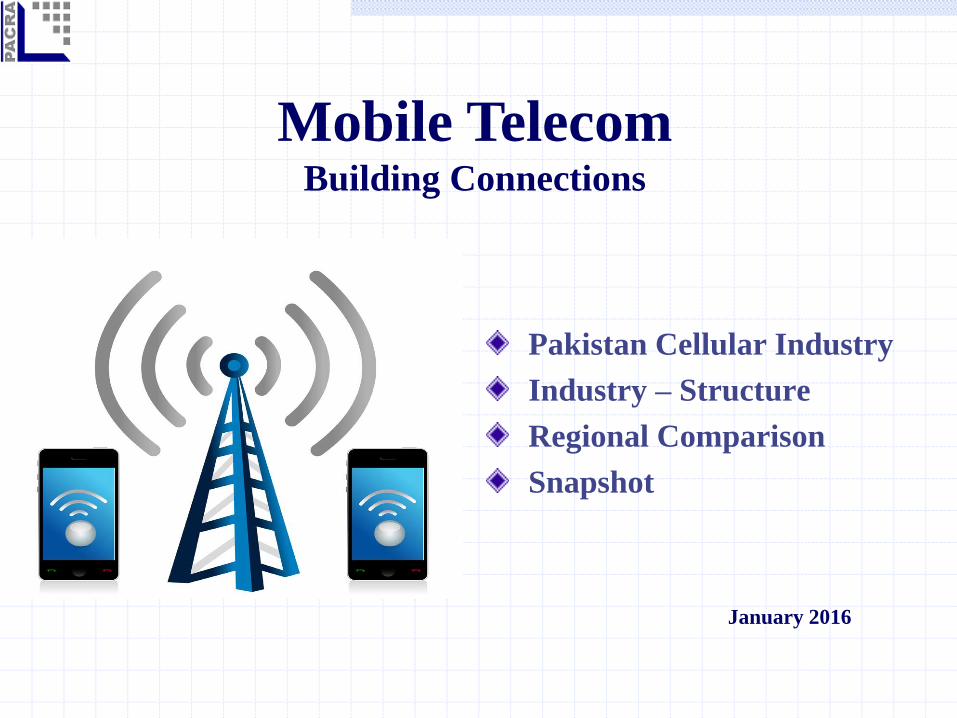
Decline in the subscribers owing to biometric verification of SIMs
Mobilink - the market leader, despite decline in share.
Increasing share of Telenor and CMPak.
Continuous decline in the subscribers of Ufone and Warid.
Subscribers and Market share
Period Mobilink Telenor CMPak Ufone Warid Total
Subscribers 33,378,161 26,667,079 10,927,693 20,533,787 17,387,798 108,894,518
Share 31% 24% 10% 19% 16% 100%
Subscribers 35,953,434 29,963,722 16,836,983 23,897,261 13,499,835 120,151,235
Share 30% 25% 14% 20% 11% 100%
Subscribers 37,121,871 32,183,920 21,177,156 24,547,986 12,706,353 127,737,286
Share 29% 25% 17% 19% 10% 100%
Subscribers 38,768,346 36,571,820 27,197,048 24,352,717 13,084,823 139,974,754
Share 28% 26% 19% 17% 9% 100%
Subscribers 33,424,268 31,491,263 22,102,968 17,809,315 9,830,620 114,658,434
Share 29% 27% 19% 16% 9% 100%
Subscribers 35,156,550 33,191,103 23,518,919 18,750,250 10,323,691 120,940,513
Share 29% 27% 19% 16% 9% 100%Sep-15
2010-11
2011-12
2012-13
2013-14
2014-15
Cellular Subscribers (Number of Active SIMs)
Pakistan Cellular Industry
Industry – Structure Regional Comparison Snapshot
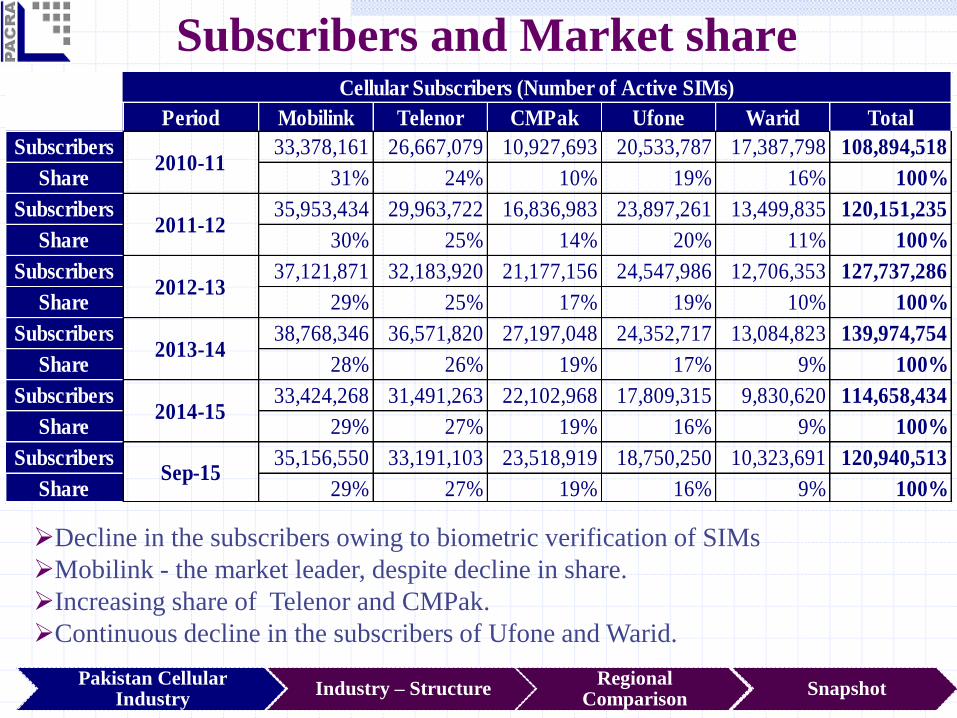
Operator Technology Jun-14 Sep-14 Dec-14 Mar-15 Jun-15 Sep-15
Share in
the total
subscriber
sTelenor 3G 4,162,616 650,094 2,268,860 3,530,421 4,162,616 5,485,083 4.5%
3G 2,898,094 947,363 1,661,286 2,921,021 2,898,094 3,769,542 3.1%
4G 105,128 26 2,242 31,582 105,128 201,564 0.2%
Mobilink 3G 3,656,345 730,000 1,795,549 2,860,079 3,656,345 4,909,203 4.1%
Ufone 3G 2,570,283 1,365,259 1,952,584 2,662,310 2,570,283 3,518,635 2.9%
Warid LTE - - - 66140 106,211 156,827 0.1%
13,392,466 3,692,742 7,680,521 12,071,553 13,498,677 18,040,854 14.9%
CMPak
Total
3G/4G Subscribers
Sep-15 Telenor Mobilink CMPak Ufone Warid
Shareof 3G subscribers in the cellular
operator's subscriber base 16.5% 14.0% 16.0% 18.8% N.A.
Shareof 4G subscribers in the cellular
operator's subscriber base N.A. N.A. 0.9% N.A. 1.5%
Share of 3G/4G subscribers as %age of
total 3G/4G subscribers 30.4% 27.2% 22.0% 19.5% 0.9%
Pakistan Cellular Industry
Industry – Structure Regional Comparison Snapshot
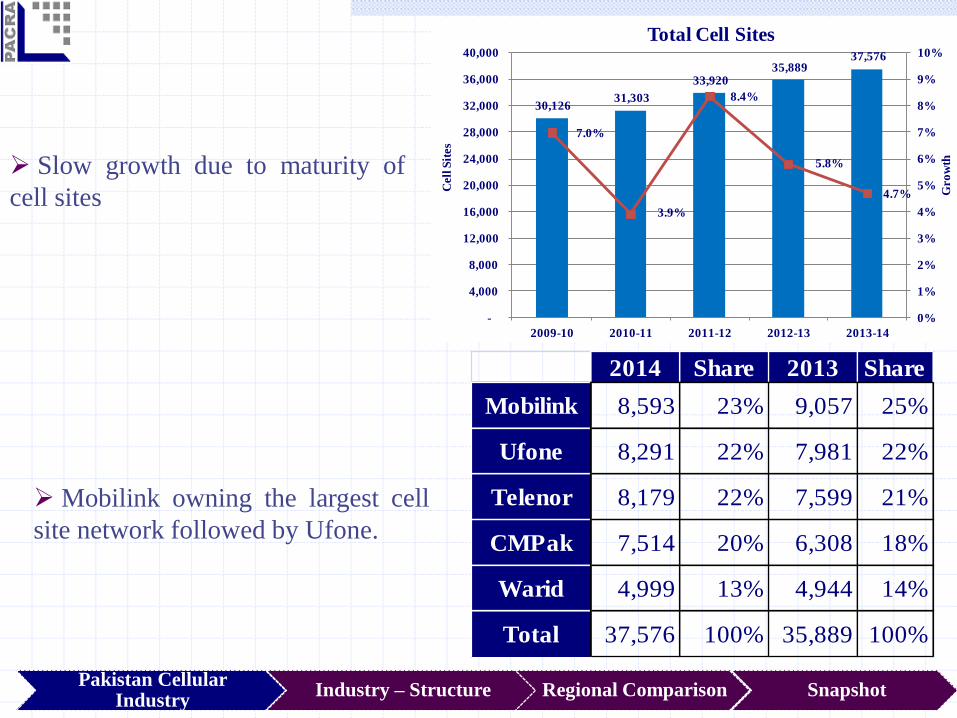
30,126 31,303
33,920 35,889
37,576
7.0%
3.9%
8.4%
5.8%
4.7%
0%
1%
2%
3%
4%
5%
6%
7%
8%
9%
10%
-
4,000
8,000
12,000
16,000
20,000
24,000
28,000
32,000
36,000
40,000
2009-10 2010-11 2011-12 2012-13 2013-14
Gro
wth
Cell
Sit
es
Total Cell Sites
Slow growth due to maturity of
cell sites
Mobilink owning the largest cell
site network followed by Ufone.
2014 Share 2013 Share
Mobilink 8,593 23% 9,057 25%
Ufone 8,291 22% 7,981 22%
Telenor 8,179 22% 7,599 21%
CMPak 7,514 20% 6,308 18%
Warid 4,999 13% 4,944 14%
Total 37,576 100% 35,889 100%

Pakistan Cellular Industry
Industry – Structure Regional Comparison Snapshot
Broadband Subscribers by Technology
Year DSL HFC WiMax FTTH EvDO Others Mobile BB Total
2009-10 476,722 49,110 257,616 5,002 111,194 1,004 0 900,648
2010-11 695,245 34,274 428,523 6,346 325,140 1,963 0 1,491,491
2011-12 880,071 35,520 589,887 8,444 584,459 2,934 0 2,101,315
2012-13 1,064,003 33,184 575,939 11,152 1,033,513 3,868 0 2,721,659
2013-14 1,346,817 37,011 530,889 14,848 1,861,118 5,240 0 3,795,923
2014-15 1,480,672 43,362 487,582 19,490 1,334,725 6,089 13,498,677 16,885,518
Sep-15* 1,563,321 43,929 245,284 20,549 1,273,184 6,160 18,040,854 21,193,281
*DSL, HFC, WiMax, FTTH, EvDo and others are As of August 15
After acquisition of 3G and 4G spectrum, wireless internet taken by the cellular
operators
Pakistan Cellular Industry
Industry – Structure Regional Comparison Snapshot
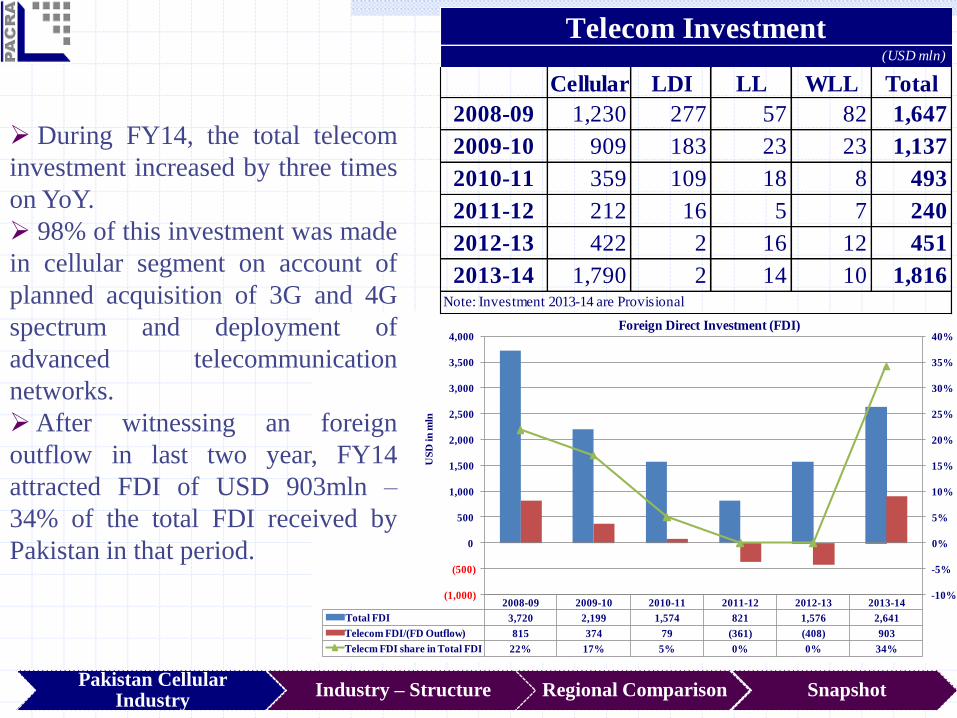
2008-09 2009-10 2010-11 2011-12 2012-13 2013-14
Total FDI 3,720 2,199 1,574 821 1,576 2,641
Telecom FDI/(FD Outflow) 815 374 79 (361) (408) 903
Telecm FDI share in Total FDI 22% 17% 5% 0% 0% 34%
-10%
-5%
0%
5%
10%
15%
20%
25%
30%
35%
40%
(1,000)
(500)
0
500
1,000
1,500
2,000
2,500
3,000
3,500
4,000
US
D in
mln
Foreign Direct Investment (FDI)
During FY14, the total telecom
investment increased by three times
on YoY.
98% of this investment was made
in cellular segment on account of
planned acquisition of 3G and 4G
spectrum and deployment of
advanced telecommunication
networks.
After witnessing an foreign
outflow in last two year, FY14
attracted FDI of USD 903mln –
34% of the total FDI received by
Pakistan in that period.
Cellular LDI LL WLL Total
2008-09 1,230 277 57 82 1,647
2009-10 909 183 23 23 1,137
2010-11 359 109 18 8 493
2011-12 212 16 5 7 240
2012-13 422 2 16 12 451
2013-14 1,790 2 14 10 1,816
Telecom Investment(USD mln)
Note: Investment 2013-14 are Provisional
Pakistan Cellular Industry
Industry – Structure Regional Comparison Snapshot
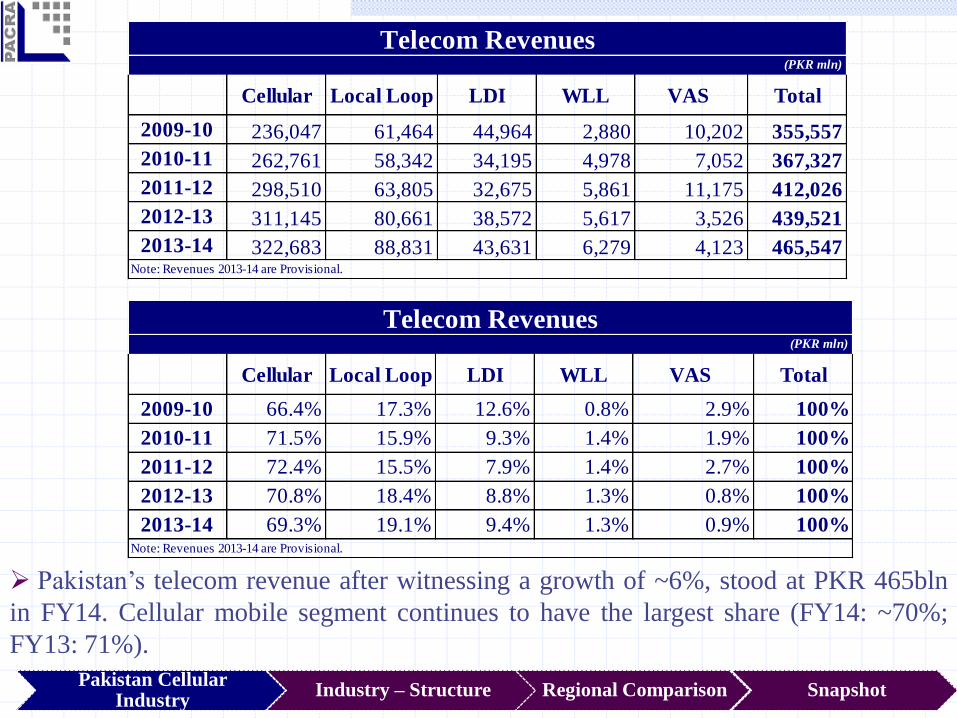
Pakistan’s telecom revenue after witnessing a growth of ~6%, stood at PKR 465bln
in FY14. Cellular mobile segment continues to have the largest share (FY14: ~70%;
FY13: 71%).
Cellular Local Loop LDI WLL VAS Total
2009-10 236,047 61,464 44,964 2,880 10,202 355,557
2010-11 262,761 58,342 34,195 4,978 7,052 367,327
2011-12 298,510 63,805 32,675 5,861 11,175 412,026
2012-13 311,145 80,661 38,572 5,617 3,526 439,521
2013-14 322,683 88,831 43,631 6,279 4,123 465,547Note: Revenues 2013-14 are Provisional.
Telecom Revenues(PKR mln)
Cellular Local Loop LDI WLL VAS Total
2009-10 66.4% 17.3% 12.6% 0.8% 2.9% 100%
2010-11 71.5% 15.9% 9.3% 1.4% 1.9% 100%
2011-12 72.4% 15.5% 7.9% 1.4% 2.7% 100%
2012-13 70.8% 18.4% 8.8% 1.3% 0.8% 100%
2013-14 69.3% 19.1% 9.4% 1.3% 0.9% 100%Note: Revenues 2013-14 are Provisional.
Telecom Revenues(PKR mln)
Pakistan Cellular Industry
Industry – Structure Regional Comparison Snapshot
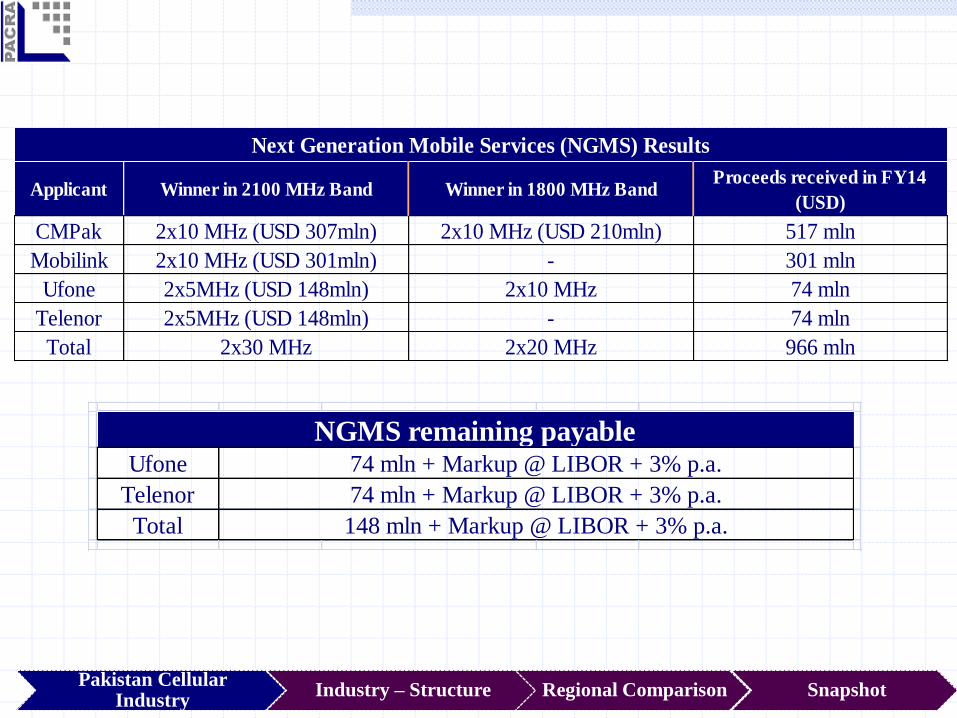
Ufone
Telenor
Total
74 mln + Markup @ LIBOR + 3% p.a.
74 mln + Markup @ LIBOR + 3% p.a.
148 mln + Markup @ LIBOR + 3% p.a.
NGMS remaining payable
ApplicantProceeds received in FY14
(USD)
CMPak 517 mln
Mobilink 301 mln
Ufone 74 mln
Telenor 74 mln
Total 966 mln
Next Generation Mobile Services (NGMS) Results
2x5MHz (USD 148mln) -
2x10 MHz (USD 301mln) -
2x30 MHz 2x20 MHz
2x10 MHz (USD 210mln)
2x5MHz (USD 148mln) 2x10 MHz
Winner in 2100 MHz Band Winner in 1800 MHz Band
2x10 MHz (USD 307mln)

Oligopoly
Few firms dominate the
industry
High barriers to entry
Price makers –Mutually
interdependent (react to rival’s
actions)
Industry Structure
Pakistan Cellular Industry
Industry – Structure Regional Comparison Snapshot
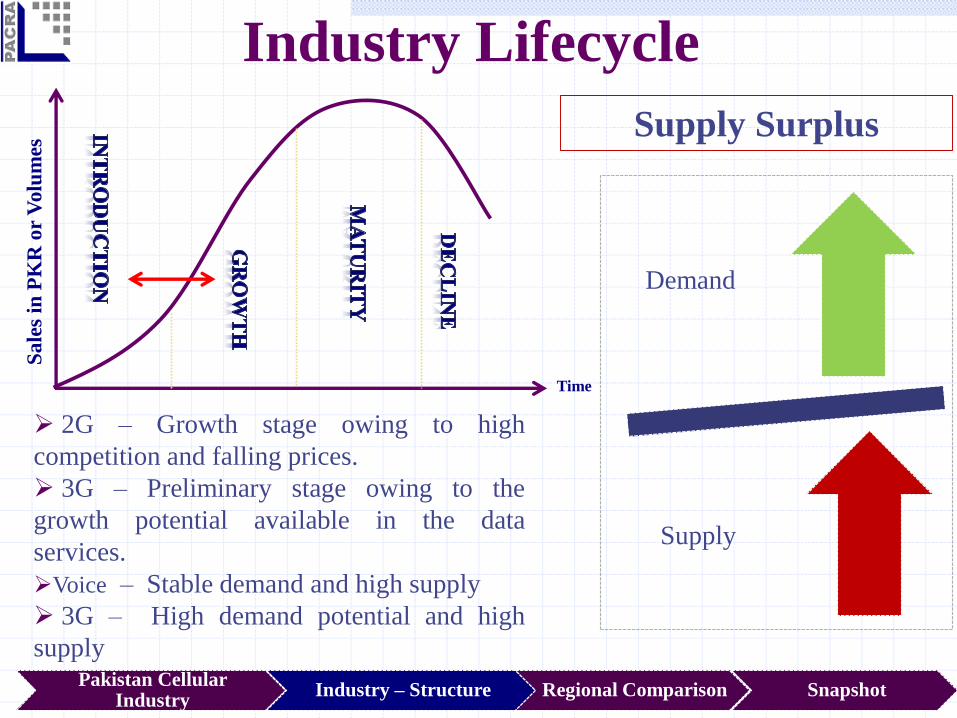
Industry Lifecycle
Time
Sa
les
in P
KR
or
Vo
lum
es
Pakistan Cellular Industry
Industry – Structure Regional Comparison Snapshot
2G – Growth stage owing to high
competition and falling prices.
3G – Preliminary stage owing to the
growth potential available in the data
services.
Voice – Stable demand and high supply
3G – High demand potential and high
supply
Supply Surplus
Demand
Supply
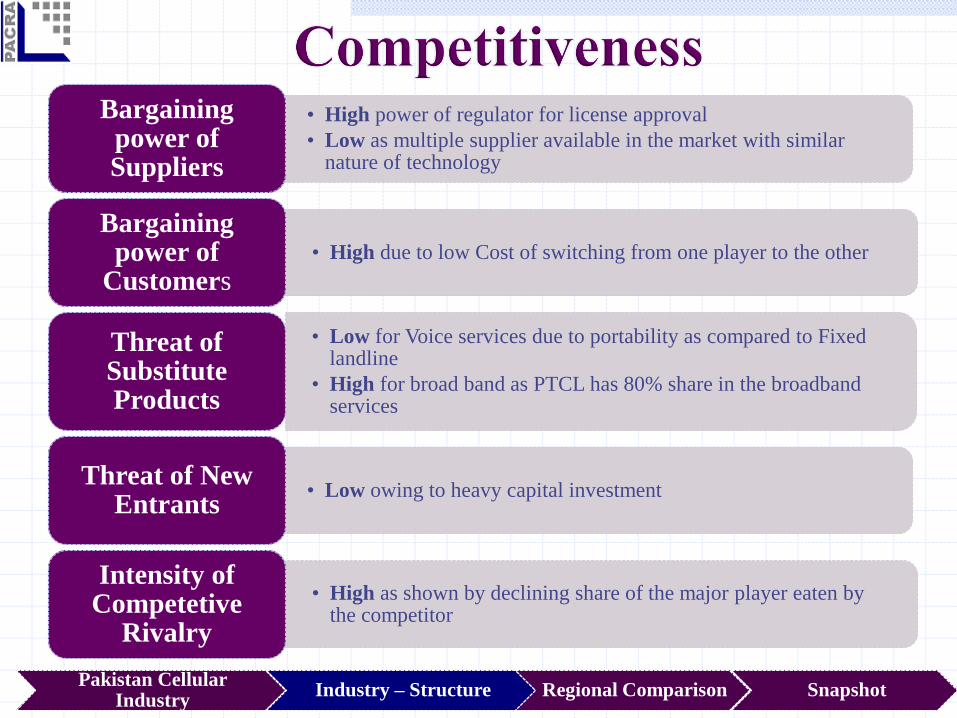
• High power of regulator for license approval
• Low as multiple supplier available in the market with similar nature of technology
Bargaining power of Suppliers
• High due to low Cost of switching from one player to the other
Bargaining power of
Customers
• Low for Voice services due to portability as compared to Fixed landline
• High for broad band as PTCL has 80% share in the broadband services
Threat of Substitute Products
• Low owing to heavy capital investmentThreat of New
Entrants
• High as shown by declining share of the major player eaten by the competitor
Intensity ofCompetetive
Rivalry
Pakistan Cellular Industry
Industry – Structure Regional Comparison Snapshot
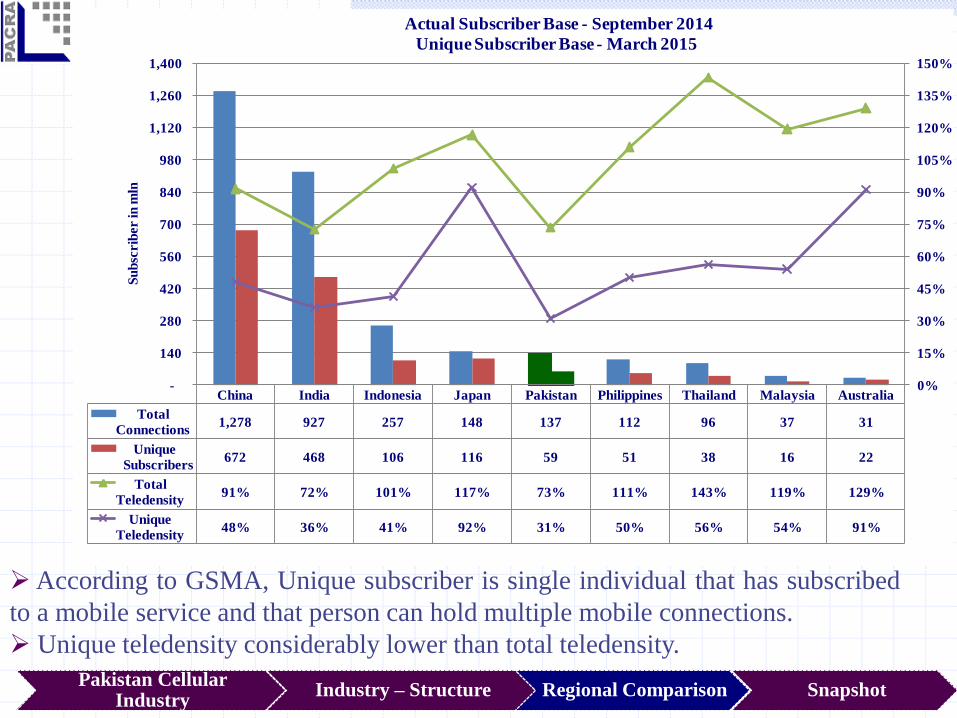
According to GSMA, Unique subscriber is single individual that has subscribed
to a mobile service and that person can hold multiple mobile connections.
Unique teledensity considerably lower than total teledensity.
Pakistan Cellular Industry
Industry – Structure Regional Comparison Snapshot
China India Indonesia Japan Pakistan Philippines Thailand Malaysia Australia
Total
Connections1,278 927 257 148 137 112 96 37 31
Unique
Subscribers672 468 106 116 59 51 38 16 22
Total
Teledensity91% 72% 101% 117% 73% 111% 143% 119% 129%
Unique
Teledensity48% 36% 41% 92% 31% 50% 56% 54% 91%
0%
15%
30%
45%
60%
75%
90%
105%
120%
135%
150%
-
140
280
420
560
700
840
980
1,120
1,260
1,400
Su
bsc
rib
er in
mln
Actual Subscriber Base - September 2014
Unique Subscriber Base - March 2015

392 365
287 270
217 215
136
62
-
50
100
150
200
250
300
350
400
450
Min
utes
Average Minutes of Usage per Subscriber per
Month
Pakistan Cellular Industry
Industry – Structure Regional Comparison Snapshot
0.07
0.06
0.02 0.02 0.02
0.01 0.01 0.01
-
0.01
0.02
0.03
0.04
0.05
0.06
0.07
0.08
USD
Call Charges per Minute
Pakistan Cellular Industry
Industry – Structure Regional Comparison Snapshot
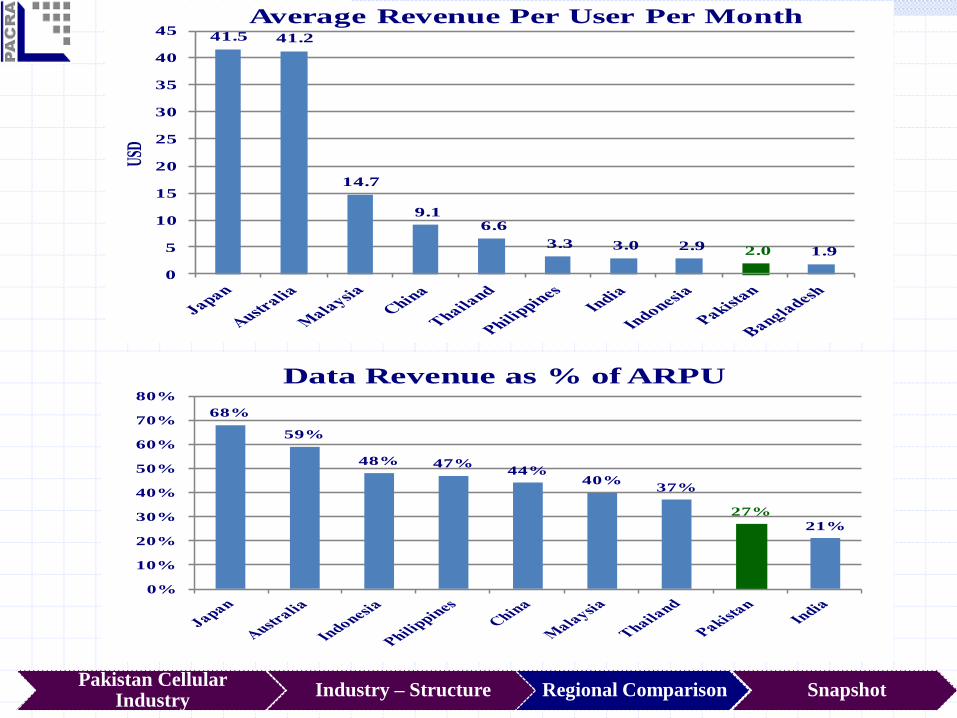
41.5 41.2
14.7
9.1 6.6
3.3 3.0 2.9 2.0 1.9
0
5
10
15
20
25
30
35
40
45
USD
Average Revenue Per User Per Month
68%
59%
48% 47%44%
40%37%
27%
21%
0%
10%
20%
30%
40%
50%
60%
70%
80%
Data Revenue as % of ARPU
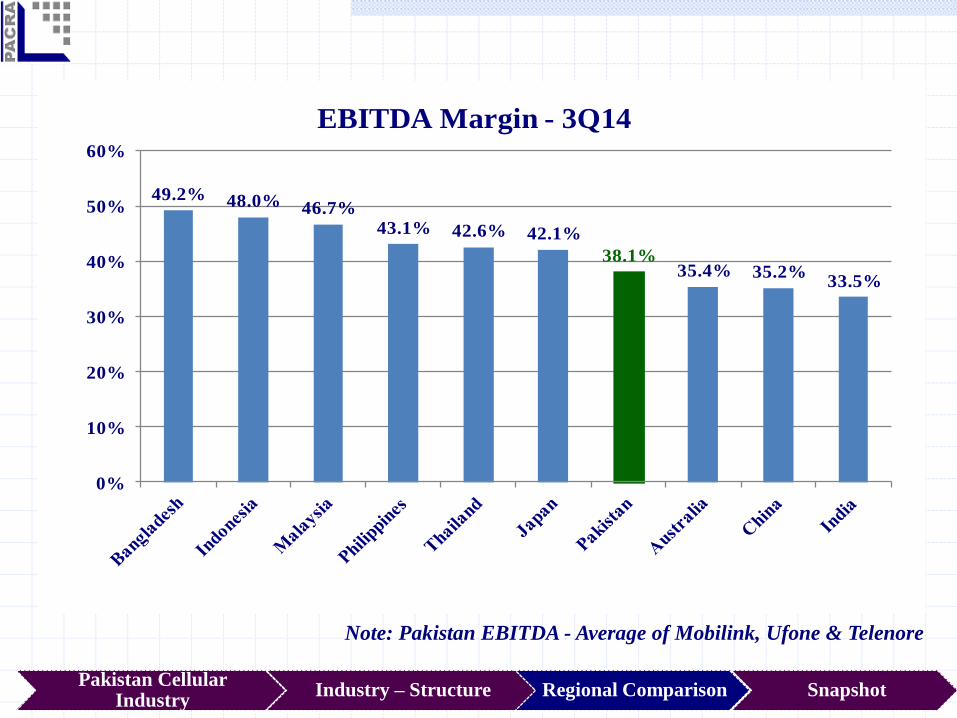
49.2% 48.0% 46.7%43.1% 42.6% 42.1%
38.1%35.4% 35.2%
33.5%
0%
10%
20%
30%
40%
50%
60%
EBITDA Margin - 3Q14
Note: Pakistan EBITDA - Average of Mobilink, Ufone & Telenore
Pakistan Cellular Industry
Industry – Structure Regional Comparison Snapshot
Snapshot
Pakistan Cellular Industry
Industry – Structure Regional Comparison Snapshot
As competitive landscape exists, average revenues per user
(ARPUs) have yet to stabilize.
Business potential in value added services is expected to
provide impetus to revenue growth to the market players,
though time-line is uncertain.
Intense competition among players is expected to keep
EBITDA margin under pressure.
After acquisition of 3G and 4G spectrum, wireless internet
taken by the cellular operators
Bibliography
1. Pakistan Telecommunication Authority (PTA) : http://www.pta.gov.pk/index.php?Itemid=1
2. PTA Annual Reports :
http://www.pta.gov.pk/index.php?option=com_content&view=article&id=361&Itemid=590
3. Cellular Operators Association of India: http://www.coai.com/reports-and-papers/coai-annual-
report
Analysts
Rana Nadeem
Unit Head Ratings
Aisha Khalid
Manager Ratings
Abdul Sami
Senior Financial Analyst
Contact Number: +92 42 3586 9504
DISCLAIMER
PACRA has used due care in preparation of this document. Our information
has been obtained from sources we consider to be reliable but its accuracy
or completeness is not guaranteed. The information in this document may
be copied or otherwise reproduced, in whole or in part, provided the source
is duly acknowledged. The presentation should not be relied upon as
professional advice.