MM-PBSA Validation Studydocking.org/~tbalius/2008.11.26.AMS535.Kuhn.pdfNov 26, 2008 · Molecular...
30
MM-PBSA Validation Study Trent E. Balius Department of Applied Mathematics and Statistics AMS 535 11-26-2008
Transcript of MM-PBSA Validation Studydocking.org/~tbalius/2008.11.26.AMS535.Kuhn.pdfNov 26, 2008 · Molecular...

MM-PBSA Validation Study
Trent E. BaliusDepartment of Applied Mathematics
and Statistics AMS 535
11-26-2008

Overview
• MM-PBSA– Introduction– MD ensembles– one snap-shots relaxed structures
• Enrichment• Computational vs. experimental activities • ROC curves • Validating MM-PBSA with virtual screening

Introduction to Molecular Mechanics Poisson Boltzmann Solvent Accessible
Surface Area (MM-PBSA)

+
+
watbindΔG
gasbindΔG
lighydΔGrec
hydΔG comhydΔG
Thermodynamic cycle

MM-PBSA/GBSA Equations
ligandproteincomplex
nonpolar
polar
nonpolarpolarGBSAPBSA
esvdwtorsanglebondMM
GBSAPBSAMM
GGGG
SAG
G
GGGTS
EEEEEE
TSGEG
−−=Δ
+⋅=
+=
++++=
−+=
βαequation. GB theusingby or
equations aldifferenti ofset PB thesolvingby defined is - wayfollowing in the defined are ermsnonpolar t theandpolar thewhere
analysis mode normal analysis harmonic quasi using calculated is
such that
/
/

Using Molecular Dynamics generated ensembles

Time (ns)
Ligand simulation
Protein simulation
Protein-ligand Complex simulation
Run 3 independent Simulations

Time (ns)
Ligand simulation
Protein simulation
Protein-ligand Complex simulation
Run 1 Simulations
remove ligand
remove protien

Metrics for Determining Good Agreement
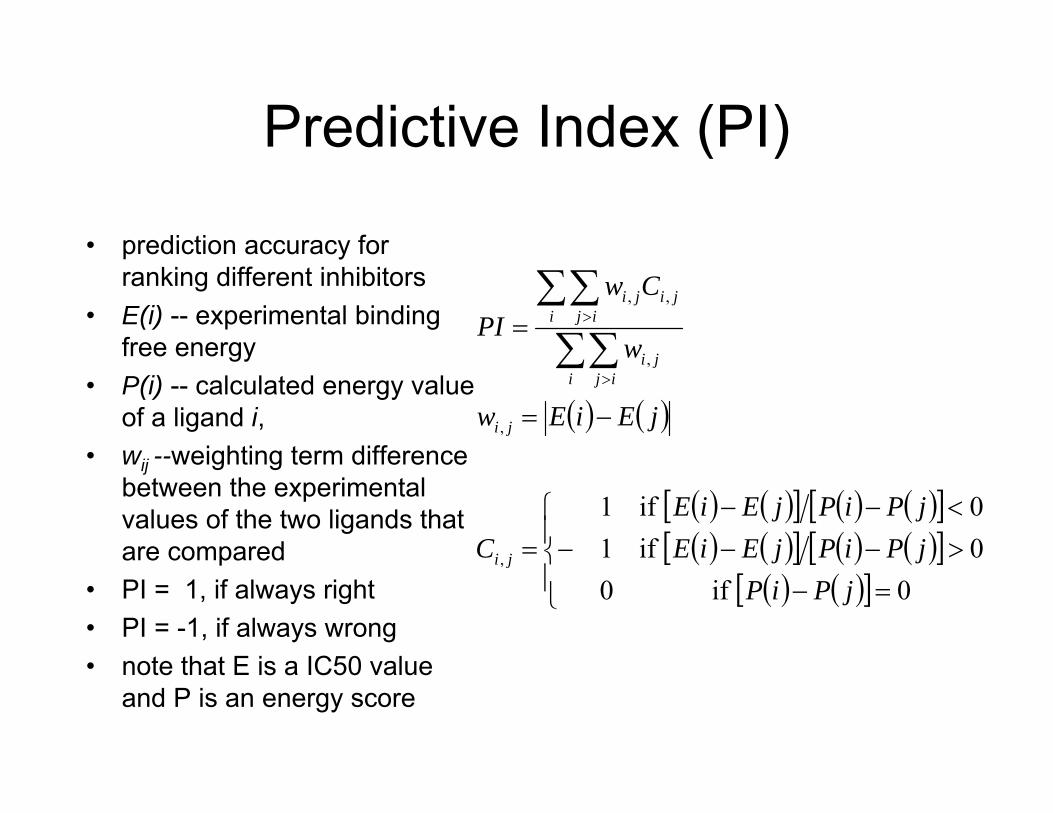
Predictive Index (PI)
• prediction accuracy for ranking different inhibitors
• E(i) -- experimental binding free energy
• P(i) -- calculated energy value of a ligand i,
• wij --weighting term difference between the experimental values of the two ligands that are compared
• PI = 1, if always right• PI = -1, if always wrong• note that E is a IC50 value
and P is an energy score
( ) ( )
( ) ( )[ ] ( ) ( )[ ]( ) ( )[ ] ( ) ( )[ ]
( ) ( )[ ]⎪⎩
⎪⎨
⎧
=−>−−−<−−
=
−=
=∑∑∑∑
>
>
0 if00 if10 if1
,
,
,
,,
jPiPjPiPjEiEjPiPjEiE
C
jEiEw
w
CwPI
ji
ji
i ijji
i ijjiji

Correlation Coefficient --Probability Theory
[ ] [ ]( ) [ ]( )[ ][ ] [ ] [ ]
[ ] [ ]( )[ ][ ] [ ]( )
[ ] ( )
∑
∑
=
=
=
=
−=−=−=
−−=
n
ii
n
iii
xn
x
xpxXE
XEXEXEXEX
YEXEXYEYEYXEXEYX
1
1
22
2
1
var
,cov
uniformly distributed
covariance
variance
expectation
mean
D.P. Bertsekas, J.N. Tsitsiklis. Introduction to Probability, 2nd Ed.

Correlation Coefficient
yc=β0+β1x
x
y
( ) [ ][ ] [ ]
( )( ) ( )
1
,
ˆ
varvar,cov,
1
2
1
1
−=
−=−−=
==
=
∑∑==
nSs
xxSyyxxS
ss
SSS
R
YXYXYX
xxx
n
iixx
n
iiixy
y
x
yyxx
xy β
ρ
estimated population standard deviation for uniform distribution
A.C. Tamhane, D.D. Dunlop. Statistics and Data Analysis: From Elementary to Intermediate
D.P. Bertsekas, J.N. Tsitsiklis. Introduction to Probability, 2nd Ed.

Virtual Screening and Receiver Operating Characteristic (ROC)
Curves

Virtual Screening (Enrichment)
negatives
positives
negatives
positives
total 100 %
total 50 %
positives 100 %
positives 80 %
score
sort
throw away

Computational Prediction vs. Experimental Evidenced
True Negative False Negative
False PositiveTrue Positive
has activity
has
pred
icte
dac
tivity
has little activity
has
little
pred
icte
d ac
tivity

ROC curves
http://www.anaesthetist.com/mnm/stats/roc/Findex.htm
• ROC -- Receiver Operating Characteristic

• Active and inactive is not known– Why not do the experiments on whole population?
• expensive• takes time • multiple levels of experiments (needs to comparing type of
experiments e.g.. HTPS) – Seed the population with know active compounds– see how many bubble to the top.
ROC curves

unknown
known active
Score
Sort Threshold
ROC curves unknowns may have activity
Throw away
Keep
Seed database

Paper Figures and Analysis

Paper Nomenclature
• MM-RDIEL -- molecular mechanics energy function including distance dependent dielectric
• MM-PBSA -- single relaxed structure• MD-PBSA -- molecular dynamics ensemble • MD-PBSA* -- minimized staring point

Computational Details • Force Fields (antechamber of Amber 7)
– small molecules • AM1-BCC charges • GAFF (failed in 10%)• MAB* -- MAB (united atom) and GAFF
– Protein -- FF94– 24 Å sphere of TIP3P water and neutralized by adding counter
ions• MD simulations -- Amber 6 for MD T = 300, Δt = 1.5fs, shake on
– equilibration: 150 ps– snapshots every 5 ps for 50 ps– 10 structures ensemble
• Minimization -- Related structure – minimized for 1000 steps
Journal of Medicinal Chemistry, 2005, Vol. 48, No. 12

Computational Details • MM-PBSA calculations
– PB calculated using MEAD program package– Normal mode analysis -- mfebd module of MOLOC– SA -- in-house program XSAE
Journal of Medicinal Chemistry, 2005, Vol. 48, No. 12

Journal of Medicinal Chemistry, 2005, Vol. 48, No. 12
( )
( )'max dev. max.
'1RMSD1
2
ii
n
iii
EE
EEn
−=
−= ∑=
Energy Comparison

calculated vs. experimental of 12 Roche p38 MAP kinase inhibitors.MM-PBSA using the MAB* force field (filled circles) with FlexX/ScreenScore(empty triangles) Dashed lines at pIC50 = 6.0 indicate a threshold of IC50 = 1 µM.
Journal of Medicinal Chemistry, 2005, Vol. 48, No. 12

Predicting Correct Binding Modes
Journal of Medicinal Chemistry, 2005, Vol. 48, No. 12
Illustration of handling of solvation effects. (a) Binding mode suggested by FRED/ChemScore (Rank 7); corresponding MM-PBSA result (Rank 122, ΔGbind ) +7.8 kcal/mol). (b) X-ray binding mode obtained by rotation around the pyrimidine imidazole bond (MM-PBSA: Rank 57, ΔGbind = -2.6 kcal/mol). R = CH2-phenyl.

The enrichment curves show the percentage of inhibitors retrieved as a function of the percentage of total molecules in the database. random selection (black, dashed)ideal performance (black, solid)FRED/ChemScore ranking (red)MM-RDIEL ranking with MAB* force field (orange)MM-PBSA ranking with MAB* force field (blue)MM-PBSA ranking with GAFF force field (cyan).
Ranking of p38 MAP kinase inhibitors with correct binding mode (N = 11). The diagrams show the ranking obtained with FRED/ChemScore (left) and MM-PBSA (right).
Journal of Medicinal Chemistry, 2005, Vol. 48, No. 12

Journal of Medicinal Chemistry, 2005, Vol. 48, No. 12
Assessment of multipose MM-PBSA. random selection (black, dashed)ideal performance (black,solid)FRED/ChemScore ranking (red)MM-PBSA (MAB*) ranking using the top
scored docking pose (blue)MMPBSA (MAB*) ranking using the three
highest scored docking poses (magenta)
Comparison of MM-PBSA vs MD-PBSA performance for five different proteins. random selection (black, dashed)ideal performance (black, solid)FRED/Chem-Score ranking (red),MM-PBSA (MAB*) ranking (blue), MDPBSA ranking with the MAB force field (green)MD-PBSA ranking with GAFF (light green)

Lead Optimization \ De Novo Design
Journal of Medicinal Chemistry, 2005, Vol. 48, No. 12
Superimposed pairs of modeled COX-2 ligands (cyan) and molecules designed by Skelgen (magenta). 2D representations of the general inhibitor topologies are displayed in black. Numbers inside the rings indicate that active ligands with alternative ring sizes are known. The MM-PBSA ranking of the Skelgen structures are: (a) 2, (b) 3, (c) 5, (d)11.

Findings of the Paper• MM-PBSA on a single structure:
– post docking filter which enrich virtual screening results– tool to rank de novo design solutions– distinguisher between strong and weak binders
• ΔpIC50 ≥ 2-3 • not small free energy differences
• MD-PBSA did not improve ranking
Journal of Medicinal Chemistry, 2005, Vol. 48, No. 12