MIT Sloan School of Management - University of Virginia ... · MIT Sloan School of Management...
45
MIT Sloan School of Management Working Paper 4307-03 April 2003 Accounting for Taste: Board Member Preferences and Corporate Policy Choices Scott Richardson, A. Irem Tuna, Peter D. Wysocki © 2003 by Scott Richardson, A. Irem Tuna, Peter D. Wysocki. All rights reserved. Short sections of text, not to exceed two paragraphs, may be quoted without explicit permission, provided that full credit including © notice is given to the source. This paper also can be downloaded without charge from the Social Science Research Network Electronic Paper Collection: http://ssrn.com/abstract=405101
Transcript of MIT Sloan School of Management - University of Virginia ... · MIT Sloan School of Management...

MIT Sloan School of ManagementWorking Paper 4307-03
April 2003
Accounting for Taste: Board MemberPreferences and Corporate Policy Choices
Scott Richardson, A. Irem Tuna, Peter D. Wysocki
© 2003 by Scott Richardson, A. Irem Tuna, Peter D. Wysocki. All rights reserved.Short sections of text, not to exceed two paragraphs, may be quoted without
explicit permission, provided that full credit including © notice is given to the source.
This paper also can be downloaded without charge from theSocial Science Research Network Electronic Paper Collection:
http://ssrn.com/abstract=405101

Accounting for Taste:
Board Member Preferences and Corporate Policy Choices
Scott Richardson
The Wharton School of the University of Pennsylvania, Philadelphia, PA 19104 USA Telephone: + 215-898-2063 [email protected]
A. Irem Tuna
The Wharton School of the University of Pennsylvania, Philadelphia, PA 19104 USA Telephone: + 215-898-6769 [email protected]
Peter D. Wysocki#
MIT Sloan School of Management, E52-325, Cambridge, MA 02142 USA Telephone: + 617-253-6623 E-mail: [email protected]
First Version: December 2001 This Version: April 2003
Abstract This paper explores whether firms that share common directors also pursue similar corporate policies. Using a sample of 885 U.S. firms with common directors, we find that director fixed effects strongly explain variation in firms’ governance, financial, disclosure, and strategic policy choices. Moreover, the director fixed effects provide incremental explanatory power over traditional economic determinants of firms’ policies. Consistent with our hypotheses, the director effects are less pronounced in large firms, in firms with more outside board members, and for directors with numerous outside board appointments. Our evidence is more consistent with directors and firms “matching” their policy preferences rather than directors “imposing” their policy preferences on firms.
Key words: Board of directors; Corporate governance; Corporate policies; Disclosure
JEL classification: D21, G34, M41 ______________ # Corresonding author. We would like to thank the Investor Responsibility Research Center for providing access to their Corporate Governance Service Database, Stan Levine of First Call for providing the management forecast data, and I/B/E/S for the analyst following data. We gratefully acknowledge the comments and suggestions of Klaus Fischer, Andreas Gintschel, Peter Joos, Dave Larcker, DJ Nanda, an anonymous referee, and seminar participants at Georgetown University, Laval University, USC, and the 2003 EAA Conference in Seville.
1
“De gustibus non est disputandum”
…Latin maxim
1. Introduction
In this paper, we explore whether commonality in firms’ corporate policies is associated
with the presence of common directors across firms. Recent corporate governance scandals have
placed the spotlight on directors with multiple board appointments and raised concerns that
corporate misdeeds can be traced across directorships (Weil 2002, Wall Street Journal). This
study provides some of the first evidence on the association between firms’ portfolios of policy
choices and the presence of common directors across firms. While prior research examines the
relation between overall board characteristics and corporate policies (see, Hermalin and
Weisbach, 2001, for a general survey and Klein, 2002, for evidence on accounting choices),
these studies do not address the important question of whether there is an association between
firms’ policy choices and individual director policy preferences. We directly tackle the old adage
“there is no accounting for taste” by using an empirical approach that directly accounts for
individual director effects. Our evidence strongly supports the existence and importance of
individual director effects for a range of corporate policies directly overseen by boards of
directors. These findings provide a new and different perspective on the relation between
corporate board attributes and firms’ governance, financial, disclosure, and strategic policies.
The business press is replete with examples of how certain managers and directors pursue
their own distinctive corporate policies or business strategies. “Neutron” Jack Welch, former
CEO of General Electric, and “Chainsaw” Al Dunlop, former CEO of Scott Paper, were both
renowned for their willingness to initiate mass firings in the early 1990’s. These individuals

2
clearly took actions that resulted in layoffs. However, were the layoff decisions uniquely
attributable to the specific managers or would any executive have taken the same actions in
similar circumstances?
While anecdotes support the notion of an “individual effect”, it is difficult to separate
firm and manager effects because they are almost always observed together. Bertrand and Schoar
(2002) attempt to get around this problem by examining the consistency of corporate policy
choices across time by tracking CEOs who move from one firm to another.1 We undertake a
similarly novel investigation in a slightly different setting by examining the consistency of
corporate policy choices across firms by identifying corporate directors who simultaneously
serve on multiple corporate boards. For example, Franklin D. Raines is the CEO and executive
board member of Fannie Mae and he simultaneously serves as an outside director of PepsiCo.
These multi-board membership cases provide a unique experimental setting to test whether an
individual’s skills or preferences are systematically and consistently reflected in firms’ policies.
Recent studies have highlighted a board member’s role as a strategic policy consultant to
top managers (see, for example, Carpenter and Westphal, 2001). Therefore, we explore
individual director influence across four key corporate policy categories: governance, financial,
disclosure and investor relations, and strategic policies. We specifically focus on policies that are
vetted through, approved by, or overseen by the board of directors. The governance policies
include the structure of CEO compensation, the existence of a dual CEO/Chairman appointment,
the number of outside directors, and the frequency of board meetings. The financial policies
include dividend payouts, stock repurchases, cash holdings and leverage. The disclosure and
investor relations policies include the frequency of management forecasts, and the outcomes of
1 In a related study on mutual funds, Baks (2001) attempts to distinguish between the performance attributable to a mutual fund and the performance attributable to the fund manager. Similar to the approach of Bertrand and Schoar (2002), he examines a sample of managers that switch funds during the 1990’s.

3
investor relations activities such as analyst and institutional following. Finally, the strategic
policies relate to firms’ acquisition and restructuring decisions that must be vetted by the board
of directors.
Given that it is difficult to specify ex ante which of these policies will be most influenced
by which directors, we also create an aggregate director fixed effect measure that captures the
average director impact across policies. This aggregate measure is estimated across all 18 policy
policies and only those policies with statistically significant individual director fixed effects.
These approaches allow us to capture the differential impact of individual directors across a full
range of firms’ corporate policies.
We begin our analysis by examining how much of the variation in firms’ corporate
policies can be attributed to the presence of individual board members. Similar to Bertrand and
Schoar (2002), we attempt to separate the influence of individuals associated with a firm from
those of the firm itself. In our unique multiple-board sample, we examine the role of individual
skills or preferences in a cross-sectional setting by considering board members who sit on at
least two different corporate boards at the same time. This approach avoids potential time-
varying and performance-related confounding effects in a CEO-turnover setting. We first
determine how much of the cross-sectional variability in firms’ policy choices can be explained
by board member fixed effects. Our results show that director-specific effects are economically
and statistically significant determinants of a broad range of corporate policy choices. However,
there are several competing explanations for this finding: (i) directors match with firms that all
face similar economic circumstances, (ii) directors match with firms for reasons not captured by
traditional economic factors, and/or (iii) directors impose their preferences on firms resulting in
policies unrelated to traditional economic factors.

4
To distinguish between explanation (i) and explanations (ii) and (iii), we investigate how
much of the residual variability in firms’ policy choices can be explained by director fixed
effects after controlling for traditional economic determinants of these policies. Consistent with
prior research, we find that a comprehensive set firm-specific economic factors (i.e., size,
performance, growth opportunities, risk, and lifecycle stage) and industry effects explain a
significant fraction of firms’ policies. However, director fixed effects provide significant
incremental explanatory power for firms’ policies over and above the traditional economic
factors. This finding suggests that the commonality in firms’ policies can result from directors
imposing their preferences on firms (explanation (iii)) or traditional economic factors not
completely capturing the matching process between director and firms (explanation (ii)). Under
explanation (iii), corporate policies are initiated by directors and may come as a surprise to other
stakeholders possibly because of corporate governance imperfections. Our follow-on empirical
tests suggest that the matching interpretation (explanation (ii)) is more plausible because the
magnitude of director fixed effects is unrelated to a director’s tenure at a firm. In sum, our
findings suggest a matching of firms and directors with similar economic characteristics and
consistent policy preferences.
Finally, we examine factors that may mitigate or strengthen an individual director’s
influence on corporate policy choices. For a broad range of policies, we find that director
influence decreases for (a) directors with many outside board appointments, (b) directors serving
on boards with a large fraction of outside directors, and (c) directors serving on boards of large
firms. We also examine whether an individual director’s influence increases if he/she serves on a
specific policy committee of the board of directors. The empirical tests demonstrate that director
fixed effects for compensation policy choices are significant for directors who serve on a firm’s

5
compensation committee, but are insignificant for directors not appointed to this committee.
Together, these results suggest an important interplay between director influence and board and
firm structure.
In summary, we document that individual director effects are important for a range of
policies not previously considered in the literature. The innovative contribution of this paper is
that we show that individual board member skills or preferences are often as important as
traditional economic factors in determining a full range of firms’ corporate policies. In addition,
director effects are affected by the structure of the board and board members’ competing outside
activities.
The remainder of the paper is organized as follows. Section 2 outlines our empirical
approach. Section 3 discusses the unique data used in the empirical tests. Section 4 discusses the
results and section 5 concludes.
2. Empirical Approach
In this section, we outline an empirical approach to test for similarities in corporate
policies across firms sharing common directors. Our main tests use director fixed effects to
capture commonality in firms’ policies. However, commonalities in firms’ economic
characteristics may explain the director fixed effects. Therefore, we also investigate how much
of the variability in firms’ policy choices is explained by director fixed effects after controlling
for traditional economic determinants of these policies. We then undertake tests to distinguish
between “matching” and “imposition” explanations for the director effects. Finally, we present
empirical tests that examine whether a director’s influence is affected by firm size, board

6
structure, the number of outside board appointments held by the director, and the director’s
committee assignments.
2.1 Existence of director effects
The literature on interlocking directorates supports the view that directors from other
boards provide a potentially important conduit for information flows about business practices
and policies (e.g., Mizruchi, 1996). Directors can transfer information about the implementation
and efficiency of different practices by observing the consequences of management decisions
(e.g., Haunschild, 1993). Directors can also learn about policy approaches through their
communications with other directors in board meetings (e.g., Davis, 1991).
Prior studies in the economic and sociology literature have investigated individual policy
choices in isolation. For example, Hallock (1997) investigates whether firms that have
reciprocally interlocking boards of directors pay their CEOs more than other firms. The business
sociology literature also investigates the individual outcomes of reciprocally interlocking boards
(see, for example, Haunschild and Beckman, 1998, and Mizruchi, 1996).
Our approach is more general in that we attempt to quantify the extent to which firms’
portfolios of corporate policies are associated with specific board members. The analysis focuses
on 18 corporate policies under the direct oversight of a company’s board of directors. We test for
the existence of director effects for each policy in a cross-sectional setting using a sample of
directors who sit on multiple firms’ boards at the same time. The tests are based on a sequential
series of nested and non-nested regressions that explain variation in firms’ policy choices using
(a) only director fixed effects, (b) only traditional economic factors captured by firm
characteristics and industry fixed effects, and (c) the combination of firm characteristics, industry

7
fixed effects, and director fixed effects. Specifically, we estimate the following regressions to
determine the relative and incremental explanatory power of traditional economic variables and
director fixed effects:
Policyi = α + ΣzγzDirectorz,i + εi [1a]
Policyi = α + ΣxβxEconomic_Determinantx,i + εi [1b]
Policyi = α + ΣxβxEconomic_Determinantx,i + ΣyλyIndustryy,i + εi [1c]
Policyi = α + ΣxβxEconomic_Determinantx,i + ΣyλyIndustryy,i + ΣzγzDirectorz,i + εi [1d]
where Policyi is a corporate policy variable for firm i. Directorz,i is a board member fixed effect
for director z. Economic_Determinantx,i represents five firm-level control variables (x=1-5) for
firm i. In all specifications, we include firm size (log(MV)), performance (ROA), risk (σ2(ROA)),
growth opportunities (M/B), and firm lifecycle stage (firm age) as firm-level economic
determinants of corporate policies. These firm-level characteristics represent a comprehensive
set of major firm-level economic factors correlated with each of the corporate policy variables.
Industryy,i represents the industry y fixed effect for firm i. The industry fixed effects capture a
range of industry-related economic factors such as regulation, product market competition, and
other institutional features that affect firms’ corporate policies.
We begin the analysis by focusing on regression model [1a]. This model includes only
the director fixed effects as explanatory variables for firms’ corporate policies. If firms with
common directors also pursue similar corporate policies, then this model should explain a
statistically and economically significant fraction of the cross-sectional variation in firms’
policies.

8
2.2 Do economic factors explain director effects?
While model [1a] can test for the existence of commonality in firms’ policies, it cannot
explain the root cause of the director effects. In particular, commonality in corporate policies can
be explained by: (i) policy matching of directors with firms facing similar economic factors, (ii)
policy matching of directors and firms for reasons not captured by traditional economic factors,
and/or (iii) directors imposing their preferences on firms resulting in policies unrelated to
traditional economic factors. It should be noted that self-selection by directors is a common
feature of all of these explanations. In fact, active choices by directors to select or accept board
appointments is a necessary condition for individual director preferences to actually matter.
However, the underlying motives and outcomes of directors’ decisions is very different for each
of the explanations. Given the commonality of self-selection, we must find other ways to
discriminate between the explanations for the observed director effects.
One key distinction between these explanations is that the first explanation predicts that
traditional economic factors will subsume the explanatory power of the director fixed effects
estimated in model [1a].2 Therefore, to distinguish between explanation (i) and explanations (ii)
and (iii), we test whether director fixed effects have incremental explanatory power over
traditional economic determinants of corporate policies. Regression model [1c] is used as a
benchmark for the explanatory power of traditional economic factors. This regression includes
firm-specific variables as well as industry fixed effects to capture the economic determinants of
firms’ policies choices. The incremental explanatory power of the director fixed effects, over and
above the traditional economic factors, is then estimated with regression model [1d]. The
2 This approach assumes that traditional proxies used in the literature can fully capture the underlying economic determinants of firms’ policies. We rely on previous literature to define these proxies.

9
incremental impact of the director fixed effects is calculated by comparing the adjusted R2 from
the economic model [1c] with the adjusted R2 from the expanded model [1d] that includes the
director fixed effects.
Jointly significant director fixed effects in model [1d] would indicate that traditional
economic factors do not fully subsume the influence of individual directors. The joint statistical
significance of the director fixed effects is determined using an F-test on the entire set of director
fixed effects. One can also characterize the economic significance of the director fixed effects by
comparing the difference in the adjusted R2 between models [1c] and [1d] (i.e. with/without the
director effects).
2.3 Do directors match or impose policy preferences?
If director fixed effects have incremental explanatory power over and above traditional
economic determinants of corporate policies, then there are two remaining explanations for the
director effects. Explanation (ii) suggests that directors and firms match policy preferences for
reasons not captured by traditional economic factors. If matching is the explanation, then a firm’s
policies should pre-date the director’s board appointment arrival and the director’s tenure should
be unrelated to the magnitude of the director fixed effects. On the other hand, explanation (iii)
suggests a “push” (or “imposition”) phenomenon where policy choices are initiated by a director,
possibly to the surprise of other stakeholders. If this explanation is correct, then a director’s
influence on a firm’s policies should become more pronounced the longer the director serves on
the board of directors.
To test the effect of tenure on director fixed effects, we examine the association between
the estimated magnitude of a director fixed effect and the director’s tenure on the board of

10
directors. This association can be estimated for each of the 18 individual policy variables and for
an aggregate model based on the average standardized magnitude of the director fixed effects
across all 18 policy variables. The basic regression specification is as follows:
|F.E.(Policy Variable)j|=α+β1Tenurej+εj [2a]
where the dependent variable is either (a) the magnitude (absolute value) of the director j fixed
effect estimated for a single policy variable from regression model [1d] or (b) the average of the
magnitude (absolute value) of the 18 standardized director fixed effects estimated for director j
from the regression models [1d]. We measure Tenurej as the across-firm average of the natural
logarithm of the tenure of director j for his/her multiple board appointments.
This tenure regression allows us to differentiate between directors imposing their policy
preferences on a firm versus directors and firms matching their policy preferences. If the
“imposing” hypothesis is correct, then the director fixed effect should be stronger when the
director has had more time to influence a firm’s policies. An underlying assumption of the
“imposing” explanation is that directors dictate policies that are in direct conflict with
shareholders’ interests. Recent research has shown that corporate governance imperfections and
limitations in board structures can exacerbate these problems (see, for example, Hermalin and
Weisbach, 2001). Therefore, in the next section, we outline an extension of model [2a] that
includes additional control variables to capture cross-sectional differences in the ability of
individual board members to pursue (potentially) inefficient policies.

11
2.4 Determinants of individual director influence
In this section, we examine factors that can affect the magnitude of individual director
fixed effects. First, the media has recently spotlighted directors with multiple board appointments
and raised questions whether patterns of mismanagement across firms are associated with these
directors. In particular, there are claims that “professional” directors serving on numerous boards
have little time to actually influence or monitor corporate decisions at any of the firms (see, for
example, Carpenter and Westphal, 2001). As a result, these directors have little or no consistent
influence on firms’ policies. If more outside appointments limit a director’s policy influence for
any given firm, then:
(H1a) The magnitude of director fixed effects decrease in the number of outside board
appointments.
However, Pritchard et al (2002) find little evidence that directors who sit on multiple
boards shirk their responsibilities. This implies a plausible competing hypothesis that directors
who serves on numerous boards are the most influential directors because their multiple
appointments signal their skills, influence and unique tastes that are demanded by these firms. If
multiple board appointments are correlated with a director’s influence, then:
(H1b) The magnitude of director fixed effects increases in the number of outside board
appointments.
Recent corporate governance scandals have also highlighted the importance of including
more outside/independent directors on corporate boards. In fact, the new stock exchange listing
requirements now stipulate minimum outside/independent director representation on boards. The

12
presence of numerous competing outside directors on a corporate board can mitigate the undue
influence of any particular board member. This leads to the second hypothesis:
(H2) The magnitude of a director fixed effect decreases in the fraction of outsiders on
the board of directors.
Prior research has shown that CEO’s have a strong influence on firms’ financial policies
(see, for example, Bertrand and Schoar, 2002). If CEOs serve as both an inside director for their
own firm and as outside directors for other firms, then the influence of these individuals may be
more pronounced than directors who serve exclusively as outside directors (i.e. “professional”
board members). If CEO-directors have more influence over firms’ policies compared to
professional directors, then:
(H3) The magnitude of a director fixed effect is larger if the director is a CEO of one of
the firms he/she serves as a director.
Finally, directors who serve on the boards of large firms may face higher scrutiny and
additional monitoring from other stakeholders such as securities regulators, analysts, institutional
investors, and labor unions. These stakeholders are likely to be more prevalent and active in
large firms. Therefore, if directors in large firms face additional oversight that limits their
individual influence, then:
(H4) The magnitude of a director fixed effect decreases in firm size.
To test hypotheses H1-H4, we extend model [2a] as follows:

13
|F.E.(Policy Variable)j|=α+β1Tenurej+β2NumBoardsj+β3FracOutsidej+β4CEOj+β5Sizej+εj [2b]
where the dependent variable is the same as defined in model [2b]. NumBoardsj is the total
number of corporate boards that director j serves on. FracOutsidej is the average fraction of
outside directors appointed to each board that director j serves on. CEOj is an indicator variable
that is equal to one if the director serves as CEO on one of the firms’ boards, and zero otherwise.
Sizej is the average of the natural logarithm of the market capitalization of each firm that director
j has a board appointment. Tenurej is the same as defined in regression model [2a].
2.5 Committee appointments and director influence
An individual director’s influence on a specific policy is likely to increase if he/she
serves on a related policy committee of the board of directors. The particular case of
compensation committee appointments provides a unique context to test for director influence on
a firm’s compensation policies. Therefore, we re-estimate regression model [1d] for CEO
compensation for two sub-samples. The first sub-sample consists of directors who serve on the
compensation committee for all their board appointments. The second sub-sample consists of
directors who never serve on the compensation committee of their boards. If there is a link
between decision rights for and individual director influence on CEO compensation policy, then
we predict that the director fixed effects will be less pronounced, or even nonexistent, in the
second sub-sample.
3. Sample Selection
The empirical tests rely on several data sources. Data on director and board attributes are
obtained for the year 1999 from the Investor Responsibility Research Center (IRRC) database.
14
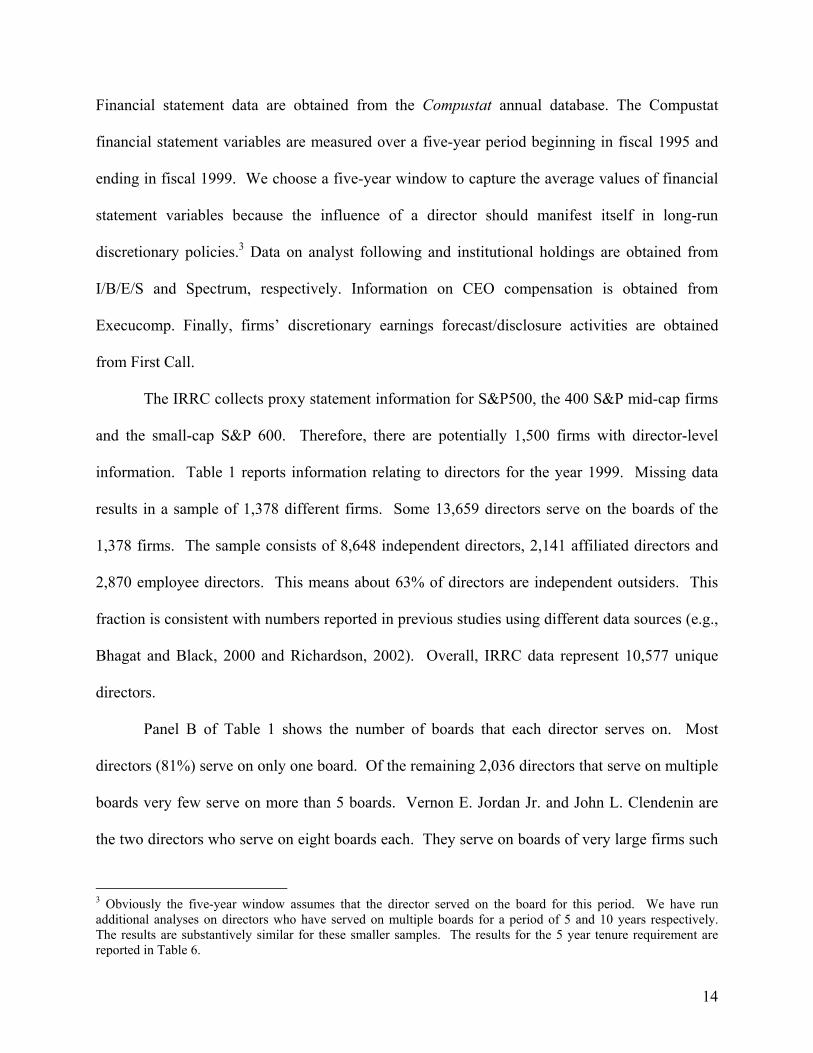
Financial statement data are obtained from the Compustat annual database. The Compustat
financial statement variables are measured over a five-year period beginning in fiscal 1995 and
ending in fiscal 1999. We choose a five-year window to capture the average values of financial
statement variables because the influence of a director should manifest itself in long-run
discretionary policies.3 Data on analyst following and institutional holdings are obtained from
I/B/E/S and Spectrum, respectively. Information on CEO compensation is obtained from
Execucomp. Finally, firms’ discretionary earnings forecast/disclosure activities are obtained
from First Call.
The IRRC collects proxy statement information for S&P500, the 400 S&P mid-cap firms
and the small-cap S&P 600. Therefore, there are potentially 1,500 firms with director-level
information. Table 1 reports information relating to directors for the year 1999. Missing data
results in a sample of 1,378 different firms. Some 13,659 directors serve on the boards of the
1,378 firms. The sample consists of 8,648 independent directors, 2,141 affiliated directors and
2,870 employee directors. This means about 63% of directors are independent outsiders. This
fraction is consistent with numbers reported in previous studies using different data sources (e.g.,
Bhagat and Black, 2000 and Richardson, 2002). Overall, IRRC data represent 10,577 unique
directors.
Panel B of Table 1 shows the number of boards that each director serves on. Most
directors (81%) serve on only one board. Of the remaining 2,036 directors that serve on multiple
boards very few serve on more than 5 boards. Vernon E. Jordan Jr. and John L. Clendenin are
the two directors who serve on eight boards each. They serve on boards of very large firms such
3 Obviously the five-year window assumes that the director served on the board for this period. We have run additional analyses on directors who have served on multiple boards for a period of 5 and 10 years respectively. The results are substantively similar for these smaller samples. The results for the 5 year tenure requirement are reported in Table 6.
15
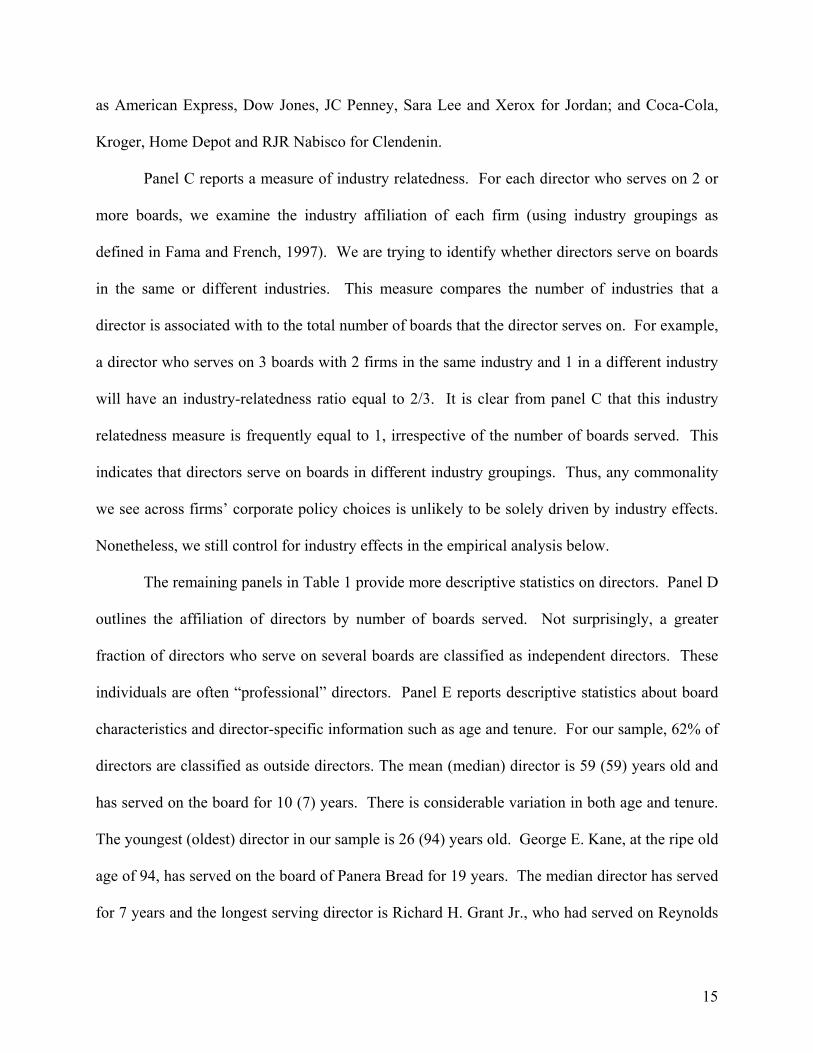
as American Express, Dow Jones, JC Penney, Sara Lee and Xerox for Jordan; and Coca-Cola,
Kroger, Home Depot and RJR Nabisco for Clendenin.
Panel C reports a measure of industry relatedness. For each director who serves on 2 or
more boards, we examine the industry affiliation of each firm (using industry groupings as
defined in Fama and French, 1997). We are trying to identify whether directors serve on boards
in the same or different industries. This measure compares the number of industries that a
director is associated with to the total number of boards that the director serves on. For example,
a director who serves on 3 boards with 2 firms in the same industry and 1 in a different industry
will have an industry-relatedness ratio equal to 2/3. It is clear from panel C that this industry
relatedness measure is frequently equal to 1, irrespective of the number of boards served. This
indicates that directors serve on boards in different industry groupings. Thus, any commonality
we see across firms’ corporate policy choices is unlikely to be solely driven by industry effects.
Nonetheless, we still control for industry effects in the empirical analysis below.
The remaining panels in Table 1 provide more descriptive statistics on directors. Panel D
outlines the affiliation of directors by number of boards served. Not surprisingly, a greater
fraction of directors who serve on several boards are classified as independent directors. These
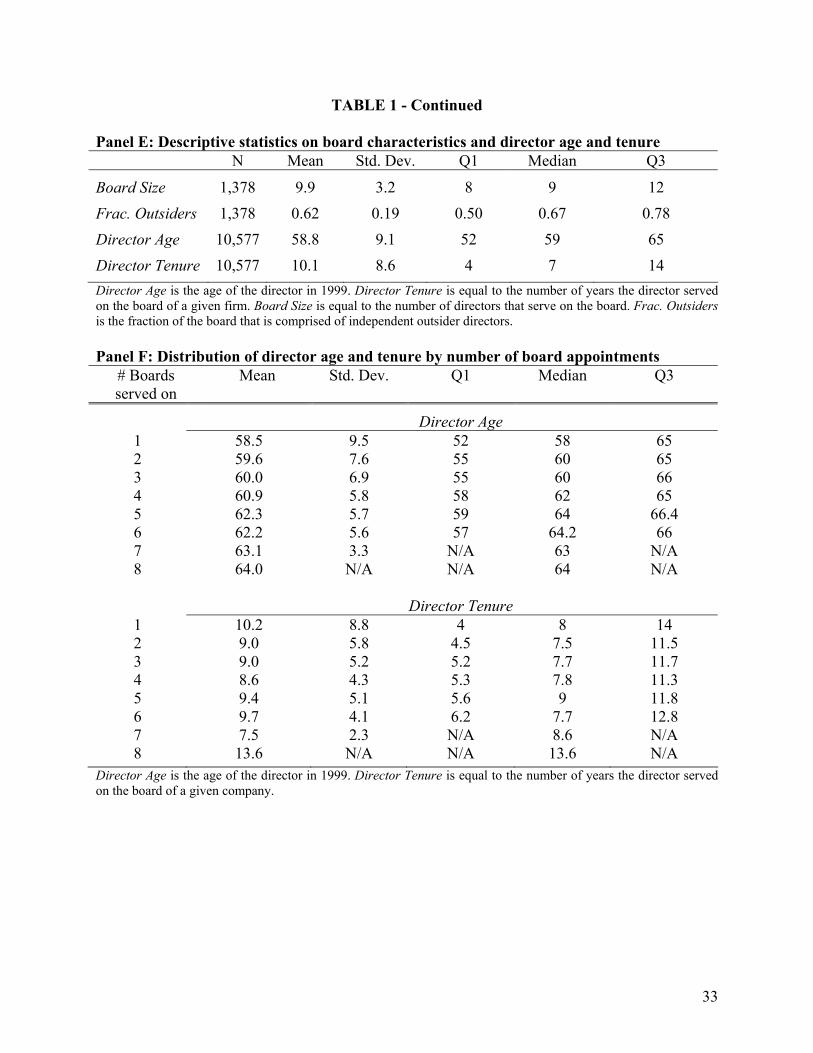
individuals are often “professional” directors. Panel E reports descriptive statistics about board
characteristics and director-specific information such as age and tenure. For our sample, 62% of
directors are classified as outside directors. The mean (median) director is 59 (59) years old and
has served on the board for 10 (7) years. There is considerable variation in both age and tenure.
The youngest (oldest) director in our sample is 26 (94) years old. George E. Kane, at the ripe old
age of 94, has served on the board of Panera Bread for 19 years. The median director has served
for 7 years and the longest serving director is Richard H. Grant Jr., who had served on Reynolds

16
& Reynolds for 61 years as of 1999. We also provide descriptive statistics on board size and
board composition. Similar to the results in Richardson (2002), the average board is comprised
of 10 directors and the mean fraction of independent outsiders is 63 percent.
Finally, Panel F of Table 1 provides a breakdown of director age and tenure by the
number of boards each director serves on. It is clear that older directors tend to serve on more
boards. This is not surprising since experience is a critical factor in board selection (NACD,
2000 – Board Evaluation – Improving Director Effectiveness). There is no discernable pattern
with tenure and the number of boards served on. The mean tenure is about 9-10 years
irrespective of the number of boards a director serves on. It is difficult to interpret the results for
directors who serve on 7 and 8 boards because there are very few observations in these
categories.
3.1 Policy variables
We focus on corporate policy categories that are directly influenced by the board of
directors. The four key categories are governance, financial, disclosure and investor relations,
and strategic policies. Moreover, we specifically focus on 18 policies that are vetted through,
approved by, or overseen by the board of directors. These policies are not fixed in stone and can
vary over the tenure of a director. Following our discussion in section 2, we focus on the relation
between director specificity and firms’ longer-run policy choices. Therefore, all financial policy
variables are calculated using averages of yearly data for the period 1995-1999. We choose this
period as it immediately precedes the year for which have director data from IRRC. The
averaging of the policy variables also smoothes out year-to-year fluctuations unrelated to
director-specific effects.

17
Our final sample is restricted to the following set of firms: (1) firms with non-missing
financial statement data from 1995-1999 from Compustat, CEO compensation data available for
1999, institutional ownership in 1999 from Spectrum, and director information available from
IRRC; and (2) directors who serve on multiple boards.4 This reduces the sample to 885 unique
firms and 1,438 directors serving on multiple boards. The sample used for the primary
regression tests in Table 3 consists of 3,428 director-firm observations. In the regression
analysis in section 4, each director is assigned an indicator variable. This set of indicator
variables identifies director fixed effects for our regression tests. Table 2 provides descriptive
statistics for the four corporate policy categories.
3.1.1 Governance policy variables
We examine five major governance policies directly set by the board of directors
including compensation, dual CEO-Chairman appointments, outsiders on the board, board size,
and frequency of board meetings. Prior research has shown that the primary firm-level economic
determinants of these policies are firm size, growth opportunities, and industry affiliation (see,
for example, Murphy, 1999, Brickley, Coles, and Jarrell, 1997, and Hermalin and Weisbach,
2001). The descriptive statistics for these policy variables are presented in Panel A of Table 2.
CEO Stock Compensationi is the fraction of total CEO compensation that is stock based (value of
restricted stock grants plus Black-Scholes value of stock option grants) for firm i. For our sample
of the firms, approximately 1/3 of a CEO’s current compensation is tied to share price. Dual
CEO/Chairman is a dummy variable equal to one of the CEO is also the chairman of the board
of the company, and zero otherwise. In this sample, approximately one quarter of the firms have
CEOs who also hold the title of Chairman. # Outsiders on Board is the number of independent
4 We do not place a data availability requirement for the analyst following data (I/B/E/S) and management earnings forecasts (First Call). We assume that missing firm observations for these variables indicates that the firm had zero analyst following and the firm made no management forecasts.

18
directors serving on the board and Board Size is the total number of directors serving on board in
1999 as reported by IRRC. The mean values of # Outsiders on Board and Board Size are 6.65
and 10.32, respectively. # Board Meetings captures formal director meetings in fiscal year 1999
as reported by IRRC. Firms held an average of 7 formal board meetings in 1999.
3.1.2 Disclosure and investor relation policy variables
The key disclosure and investor relations policies we examine are related to management
forecast activity and investor relations outcomes as measured by analyst and institutional
following. Prior research has shown that the primary firm-level economic determinants of these
policies are firm size, growth opportunities, performance, variance in earnings, and industry
affiliation (see, for example, Bhushan, 1989, O’Brien and Bhushan, 1990, and Waymire, 1985).
Panel B of Table 2 provides summary statistics for the disclosure and investor relations
variables. Given that management forecasts (as captured by First Call) occurs infrequently in the
overall population of firms5, we characterize both (a) whether a firm made a management
forecast in any year from 1995-1999, Issue Mgmt Forecast, and (b) the average annual number
of management forecasts between 1995 and 1999, # Mgmt Forecasts.6 The mean value of Issue
Mgmt Forecast (# Mgmt Forecasts) is 0.13 (0.19).
Finally to indirectly capture the outcomes of firms’ investor relations activities, we
examine the extent to which analysts and institutional investors actively follow or invest in the
firm. Analyst Following is the number of analysts following the firm in 1999 as reported by
I/B/E/S. The mean analyst following is 12.12. Institutional Holdings is a percentage of a firm’s
common shares held by Institutional investors (as indicated by 13-F filings tabulated by
5 See, for example, Nagar, Nanda and Wysocki (2002). They use management forecast activity (likelihood and frequency) as a measure of firms’ discretionary disclosure activities. 6 Frequent management forecasts suggest that a firm has explicit policy of frequent disclosures to investors.

19
Spectrum). At the end of 1999, 58% of shares were held by institutional investors as classified by
Spectrum.
3.1.3 Financial policy variables
Important financial policies include dividend payouts, share repurchases, the choice to
stock-pile cash in anticipation of future acquisitions and investment acitivity, and financial
leverage. Prior research has shown that the primary firm-level economic determinants of these
policies are firm size, growth opportunities, stage in life cycle, performance, risk, and industry
affiliation (see, for example, Fama and French, 2001, Opler, Pinkowitz, Stulz and Williamson,
1999). The descriptive statistics for the financial variables are reported in Panel C of Table 2.
The key financial policy variables we investigate are Dividends (dividend scaled by average total
assets), Repurchases (stock repurchases on common and preferred stock scaled by average total
assets), Cash Holdings (dollar value of cash and market securities on the balance sheet scaled by
total assets), and Leverage (book value of short term and long term debt scaled by total assets).
These long-run policies require the explicit approval of the board and are periodically reviewed
by the board of directors. The mean values of the payout variables, Dividends and Repurchases,
are 0.016 and 0.023, respectively. Average (median) cash holdings are 10% (5%) of total assets
which indicates outlier firms with large cash stockpiles. Leverage captures book leverage and has
an average value of 0.23 for the sample period.
3.1.4 Strategic policy variables
The descriptive statistics for the acquisitions and restructuring policy variables are
reported in Panel D of Table 2. Prior research has shown that the primary firm-level economic

20
determinants of these strategic policies are firm size, growth opportunities, stage in life cycle,
performance, risk, and industry affiliation (see, for example, Francis, Hanna and Vincent, 1996,
Aboody, Kasznik and Williams, 2000). The strategic policies we examine are directly reviewed
by the board of directors. For example, a special board committee is often established to review
and implement major corporate acquisition and merger transactions. We measure acquisition
activity on three dimensions. Acquisitions is measured as cash outlays on acquisitions scaled by
average total assets and captures the average value of takeover activity between 1995 and 1999.
Average acquisitions were valued at 3% of total assets over this period. ACQCNT reflects the
number of times that the firm reported material acquisition activities from 1995-1999. The
median number of active acquisition years is 2 for the 5 year sample period. Goodwill (value of
goodwill on the balance sheet scaled by average total assets) reflects the firm’s tendency to
implement certain acquisition strategies (stock or cash-based) and is captured in the accounting
for these transactions. Average recorded goodwill is 3% of total assets.
Finally, we look at the tendency of the firm to engage in restructuring transactions that
result in special items. This is captured in the average value and the frequency of special items
reported in net income. Special items is the average value of special items scaled by total assets.
SPECCNT is the number of times annual special items were recorded from 1995-1999. If a
director has a strong preference for axing divisions this will reflect itself in special
items/writedowns.
4. Regression analysis
In our regression analysis of the determinants of the policy variables, we include a
exhaustive set of controls to capture firm-specific economic factors that determine these policies.

21
In regressions [1b], (1c] and [1d], we include firm size, growth, performance, risk, and life cycle
stage as firm-specific economic determinants of all policy choices. As surveyed in section 3,
these variables cover a comprehensive set of major economic determinants of the policy
variables in our study. The size variable is defined as the log of market capitalization (Compustat
item 25 * Compustat item 199). Growth opportunities are measured using the market-to-book
ratio. This is market capitalization scaled by book value of equity (Compustat item 60). The
performance control is core return on assets (ROA), measured as operating income after
depreciation (Compustat item 178) scaled by average total assets. Firm risk is calculated as the
variance in ROA between 1995 and 1999. Finally, lifecycle stage is defined as number of years
the firm has been listed on CRSP.
We also include a vector of 45 industry indicator variables based on the industry
classification scheme outlined in Fama and French (1997). These indicator variables will tend to
explain much of the variation in policies because industry economic factors such as competition,
regulation, and technology tend to influence firms’ policy choices. Therefore, regression model
[1c] and [1d] include a fairly exhaustive set of traditional economic factors that are likely to
influence firms’ corporate policies.
4.1 Are director fixed effects significant?
Our primary empirical analysis is reported in Table 3. We report the impact of director
fixed effects on governance, financial, disclosure and investor relations, and strategic policies in
Panels A-C, respectively. We report the adjusted R2 for the four separate estimations of model
[1]. Regression model [1a] tests the explanatory power of the director fixed effects in isolation.
In all cases, the director fixed effects explain a statistically significant fraction of the variation of

22
the 18 policy variables. The adjusted R2 of these regressions ranges from 2.3% for the number of
management forecasts to 38.3% for cash holdings. These numbers are certainly economically
significant in comparison to the explanatory power of the firm-level economic determinants
regressions (model [1b]). In fact, eight of the eighteen director effects regressions (model [1a])
have higher explanatory power than the firm-level economic determinants regressions (model
[1b]).
4.2 Are director effects subsumed by economic factors?
In order to determine if the director effects merely capture firm-level economic attributes,
we must determine if the director fixed effects have explanatory power incremental to traditional
economic determinants of these policies. The second last column in the table presents the
incremental explanatory power of the director effects over and above the firm-level and industry
economic factors {adj.R2(model [1d]) – adj.R2(model [1c])}. The incremental explanatory power
is economically significant for a number of policy variables including CEO stock compensation
(4.3%), dividends (6.3%), cash holdings (14.0%), frequency of special items (4.7%), and
goodwill (7.2%). In the last column, we report an F-test that tests the joint statistical significance
of the director effects from regression model [1d]. The director effects are statistically significant
for 15 of the 18 policy variables.
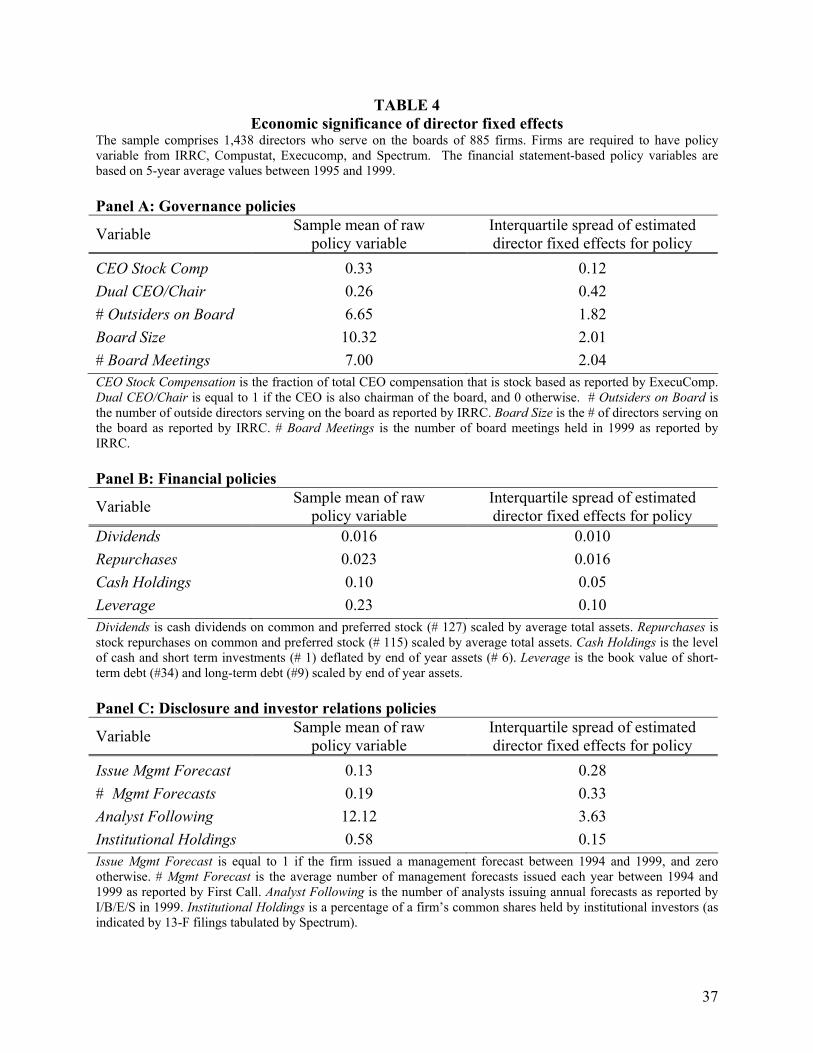
Table 4 presents additional evidence on the economic significance of the director effects
for the 18 policy variables. For comparative purposes, we present the unconditional mean of each
policy variable along side the interquartile spread of the director effects for each policy variable.
For all policies, the interquartile spread for the estimated director effects is at least 20% of the
mean of the each policy variable. In fact, the interquartile spread equals or exceeds the mean
23
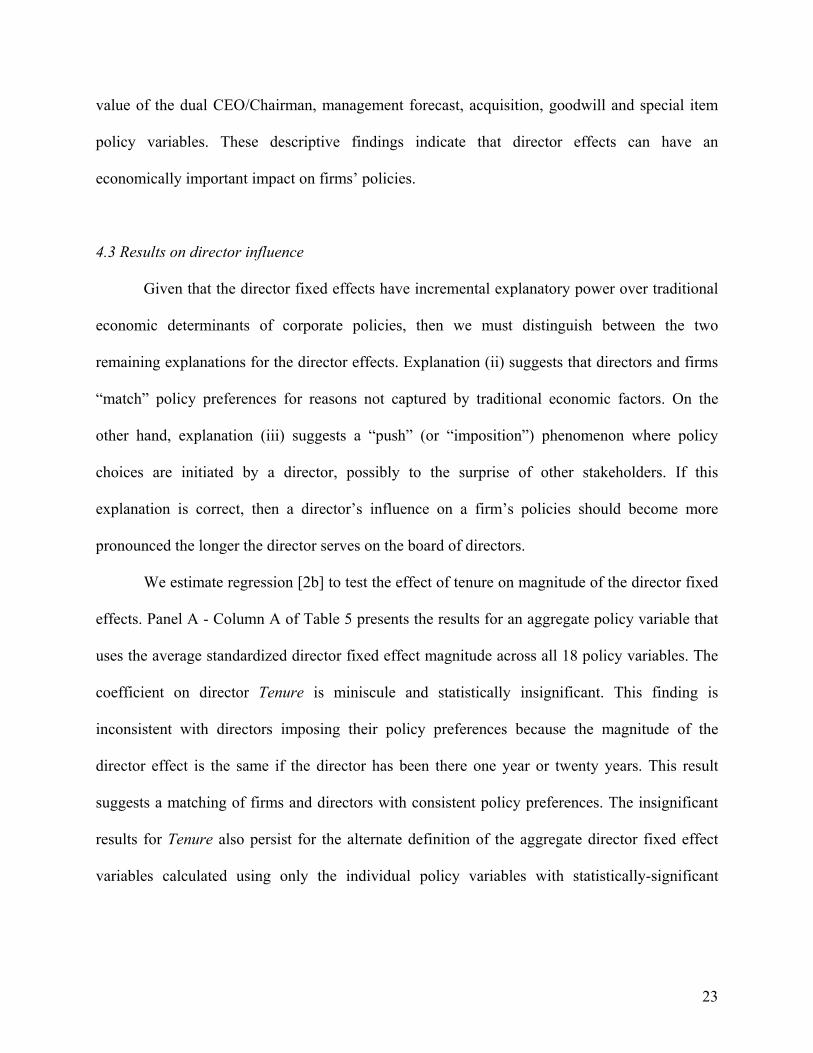
value of the dual CEO/Chairman, management forecast, acquisition, goodwill and special item
policy variables. These descriptive findings indicate that director effects can have an
economically important impact on firms’ policies.
4.3 Results on director influence
Given that the director fixed effects have incremental explanatory power over traditional
economic determinants of corporate policies, then we must distinguish between the two
remaining explanations for the director effects. Explanation (ii) suggests that directors and firms
“match” policy preferences for reasons not captured by traditional economic factors. On the
other hand, explanation (iii) suggests a “push” (or “imposition”) phenomenon where policy
choices are initiated by a director, possibly to the surprise of other stakeholders. If this
explanation is correct, then a director’s influence on a firm’s policies should become more
pronounced the longer the director serves on the board of directors.
We estimate regression [2b] to test the effect of tenure on magnitude of the director fixed
effects. Panel A - Column A of Table 5 presents the results for an aggregate policy variable that
uses the average standardized director fixed effect magnitude across all 18 policy variables. The
coefficient on director Tenure is miniscule and statistically insignificant. This finding is
inconsistent with directors imposing their policy preferences because the magnitude of the
director effect is the same if the director has been there one year or twenty years. This result
suggests a matching of firms and directors with consistent policy preferences. The insignificant
results for Tenure also persist for the alternate definition of the aggregate director fixed effect
variables calculated using only the individual policy variables with statistically-significant

24
director fixed effects (see Table 5, Panel A: Column 2).7 It should be noted that the regressions
control for other cross-sectional board attributes that limit an individual director’s ability to
impose his/her inefficient policy preferences.
We further explore the role of director influence by directly testing hypotheses H1-H4.
We implement these tests using regression model [2b] and initially focus on the aggregate model
that uses the average of the standardized director fixed effect magnitudes across the 18 policy
variables (Table 5, Panel A: Column 1). The competing hypotheses H1a and H1b relate to
whether a director’s outside appointments mitigates or strengthens the director fixed effects. We
find that the coefficient on the number of board appointments is negative and strongly
significant. This finding is more consistent with hypothesis H1a and suggests that director
influence becomes less pronounced when a director has many board appointments.
Hypothesis H2 predicts that director fixed effects are decreasing in the fraction of
(competing) outsiders on the board of directors. As shown in Table 5, Panel A: Column 1, the
coefficient on the average fraction of outside directors on the board is negative and statistically
significant. This suggests that individual director effects are weaker in the presence of competing
outside directors.
Hypothesis H3 predicts that director effects are more pronounced for directors who also
serve as a CEO on one of the firms’ boards. However, we find that the CEO dummy variable is
not significant which indicates that director effects are no different for directors who serve as a
CEO compared to “professional” directors (see Table 5, Panel A: Column 1).
7 Note that the director sample size drops from 1,438 to 1,433 observations for the alternate aggregate fixed effect variable. The alternate aggregate director fixed effect variable uses only significant individual director fixed effects. In our sample, 5 directors have insignificant director fixed effects for all 18 policy variables and, therefore, are dropped from the regression.

25
Hypothesis H4 predicts that individual directors of large firms will have a weaker
influence on the firm’s policies because they face additional monitoring from other stakeholders.
Consistent with this hypothesis, we find that the coefficient on firm size is negative and strongly
significant.
The empirical findings for hypotheses H1-H4 are essentially the same using the alternate
definition of the aggregate director fixed effect variables calculated using only the individual
policy variables with statistically-significant director fixed effects (see Table 5, Panel A: Column
2). Moreover, tests of hypotheses H1-H4 are also generally consistent for each of the 18
individual policy variables. Panel B of Table 5 summaries these findings results. Because it is
difficult to interpret and compare the coefficient estimates, we present only the coefficient t-
statistics from the 18 regressions in Panel B.
Finally, we present evidence on whether an individual director’s influence increases if
he/she serves on a specific policy committee of the board of directors. The particular case of the
compensation committee provides a unique test of director influence on firms’ compensation
policies. Therefore, we again use model [1d] to estimate director fixed effects for the CEO
compensation policy variable for two sub-samples of directors. The first sub-sample consists of
825 director-firm observations for directors who serve on the compensation committee for all
board appointments. The F-test of the joint significance of the director fixed effects is
statistically significant with a p-value of 0.05 (F-statistic=1.17). The second sub-sample consists
of 1,316 director-firm observations for directors who never serve on the compensation
committee of their boards. The F-test of the joint significance of the director fixed effects in this
sub-sample is not significant (p-value=0.21, F-statistic=1.07). These results are consistent with

26
the notion that individual director influence on a specific policy is more pronounced if the
director sits on the board committee with decision rights over that policy.
4.4 Robustness analysis
Finally, we conduct a robustness test for our previous regressions. In Table 6, we re-
estimate impact of director fixed effects for a sample of firms where the directors have served on
each board for a minimum of five years. We implement this test because the policy variables are
averaged over the 1995-1999 period. Therefore, we limit the set of directors to those who have
had a chance to influence the policy variables of interest over the whole period. The impact of
director fixed effects for each of the policy variables are very similar to those presented in our
main regression results in Table 3. Therefore, the tenor of our conclusions is unchanged.
5. Conclusion
This study takes a first step toward answering the question of whether an individual board
member’s preferences or skills are reflected in firms portfolios of corporate policy choices. We
extend the prior literature on corporate board structure and interlocks (i.e., Hermalin and
Weishbach, 2001, and Mizruchi, 1996) by examining the role of individual directors on a full
range of key policies. We begin our analysis by providing an indication of the importance of
board members’ effects on firms’ observed corporate policies. Our objective is to document how
much of the variation in firms’ policies can be attributed to board member fixed effects. In our
unique board member setting, we can examine the role of individual preferences in a cross-
sectional setting by considering board members who sit on two or more different company
boards at the same time. We then ask, after controlling for industry fix effects and other
27
important firm characteristics, how much of the unexplained variation in firms’ policy choices
can be explained by board member fixed effects.
Our results show that board of director effects are economically and statistically
important determinants of a broad range of governance, disclosure, financial and strategic policy
choices. We then attempt to distinguish between three competing interpretations of the
significant director fixed effects. The commonality in corporate policies can potentially be
explained by: (i) policy matching of directors with firms facing similar economic factors, (ii)
policy matching of directors and firms for reasons not captured by traditional economic factors,
and/or (iii) directors imposing their preferences on firms resulting in policies unrelated to
traditional economic factors. Active choice by directors to select or accept board appointments is
a common feature of each of these explanations. However, our empirical evidence is more
consistent with the matching interpretation because (a) economic factors subsume some of the
director effects (i.e., the director effects and the economic factors are correlated and have
overlapping explanatory power for firms’ policies), and (b) director-specific fixed effects are the
same regardless of a director’s tenure at a firm. We also document that the magnitude of director
effects are decreasing in firm size, the number of outside board appointments held by a director,
and the fraction of competing outside directors on the board. This is consistent with the notion
that an individual director’s influence is mitigated when there are more outside competing
interests. Board committee assignments also appear to impact director influence for specific
policies.
A caveat to our analysis is that we may actually understate the impact or importance of
directors for firms’ policies. This possibility arises because firms’ selection of directors is likely
to be endogenous. While we show that traditional economic factors subsume some of the director

28
fixed effects, it is possible that firms choose directors with the unique skills necessary to
implement the economically-optimal policies. As a result, director effects may not provide
incremental explanatory power over and above economic factors because the optimal policies are
already determined by the underlying economic factors. However, the unique director is still
vitally important in the implementation of these optimal policies.
The innovative contribution of this paper is that we show that individual director effects
are an important determinant of firms’ portfolios of policy choices. Given that corporate boards
help establish and monitor firms’ corporate policies, we show that individual director’s help
explain commonality in policies. While we document the existence of director fixed effects, we
provide little evidence on what determines why a director tends to be conservative versus
aggressive in his/her policy preferences. Recent research by Malmendier (2001) examines
whether CEO “overconfidence” affects corporate investment and financing choices. Bertrand
and Shoar (2001) also examine observable CEO characteristics such as education and age as
determinants of policy choices. This type of analysis could be extended to our director setting.

29
REFERENCES
Aboody, D., Kasznik, R., Williams, M., 2000, Purchase versus pooling in stock-for-stock acquisitions: Why do firms care? Journal of Accounting and Economics 29 261-286.
Baks, K., 2001. On the performance of mutual fund managers. Wharton School, University of
Pennsylvania working paper. Bertrand, M., Shoar, A., 2002. Managing with style: The effect of managers on firm policies.
MIT Sloan School of Management working paper. Bhagat, S., Black, B., 2000. Board independence and long-term firm performance. Stanford Law
School working paper. Brickley, J., Coles, J., Jarrell, G., 1997. Leadership structure: Separating the CEO and chairman
of the board. Journal of Corporate Finance 3, 189-220. Bhushan, R., 1989. Firm characteristics and analyst following. Journal of Accounting and
Economics 11, 255–274. Carpenter, M., Westphal, J, 2001. The strategic context of external network ties: Examining the
impact of director appointments on board involvement in strategic decision making. Academy of Management Journal. 44, 639-660.
Davis, G., 1991. Agents without principles? The spread of the poison pill through the
intercorporate network. Administrative Science Quarterly 36, 583-613. Fama, E., French, K., 1997. Industry costs of capital. Journal of Financial Economics 43, 153-
193. Fama, E., French, K., 2001. Disappearing dividends: changing firm characteristics or lower
propensity to pay? Journal of Financial Economics 60, 3-43. Francis, J., Hanna, J., Vincent, L., 1996, Causes and effects of discretionary asset write-offs.
Journal of Accounting Research 34 (Supplement), 117-34. Hallock, K., 1997. Reciprocally interlocking boards of directors and executive compensation.
Journal of Financial and Quantitative Analysis 32, 331-44. Haunschild, P., 1993. Interorganizational imitation: The impact of interlocks on corporate
acquisition activity. Administrative Science Quarterly 38, 564-592. Haunschild, P., Beckman, C., 1998. When do interlocks matter? Alternate sources of information
and interlock influence. Administrative Science Quarterly 43, 815-844.

30
Hermalin, B., Weisbach, M., 2001. Boards of directors as an endogenously determined institution: A survey of the economic literature, NBER working paper.
Klein, A., 2002. Audit committee, board of director characteristics, and earnings management.
Journal of Accounting and Economics 33, 375-400. Malmendier, U., 2001. CEO overconfidence and corporate investment, Harvard University
Department of Economics working paper. Mizruchi, M., 1996. What do interlocks do? An analysis, critique, and assessment of research on
interlocking directorates. Annual Review of Sociology 22, 271-298. Murphy, K.J., 1999. Executive compensation. USC Marshall School of Business working paper. Nagar, V., Nanda, D., Wysocki, P., 2002. Discretionary disclosure and stock-based incentives.
Journal of Accounting and Economics 34, 283-309. O'Brien, P., Bhushan, R., 1990. Analyst following and institutional ownership. Journal of
Accounting Research 28, 55-76. Opler, T., Pinkowitz, L., Stulz, R. and Williamson, R., 1999. The determinants and implications
of corporate cash holdings, Journal of Financial Economics 52, 3-46. Pritchard, A., Ferris, S., Jagannathan, M., 2002, Too busy to mind the business? Monitoring by
Directors with Multiple board appointments. University of Michigan Law School Working Paper.
Richardson, S., 2002. Corporate governance and the over-investment of surplus cash. Working
paper, University of Pennsylvania. Waymire, G., 1985, Earnings volatility and voluntary management forecast disclosure. Journal
of Accounting Research 23, 268-95. Weil, J., 2002. Board Members Draw Scrutiny for roles at other companies, Wall Street Journal,
December 9, 2002.

31
TABLE 1 Descriptive statistics on attributes of directors serving on boards of U.S. firms
Data from 1999 Investor Responsibility Research Center (IRRC) database
Panel A: Number of observations Category Number of observations
Unique firms 1,378
Unique directors 10,577
Director-firm observations 13,659
Employee directors 2,870
Independent directors 8,648
Affiliated directors 2,141
IRRC classifies each director on the board as either an (i) insider, (ii) affiliated, or (iii) independent outsider. Directors are classified as insiders if they are an employee of the firm, or an officer of the firm (if among the five most highly compensated individuals) or they have beneficial ownership of more than 50% of the firm’s voting power (this may be aggregated if voting power is distributed among more than one member of a defined group; e.g. members of a family beneficially own less than 50% individually, but combined own more than 50%). Affiliated directors include former employees of the firm or its affiliates, relatives of current employee of the firm or its affiliates, directors who provides professional services to the firm or its affiliates or to its officers, has any transactional relationship with the firm or its affiliates, founders who are no longer employees, and directors employed by a significant customer or supplier. An independent director is one who has no connection to the firm other than board seat or that the connection is not significant enough to be reported in the proxy statement.
Panel B: Distribution of number of boards each director serves on
Number of boards Frequency
1 8,541
2 1,336
3 464
4 161
5 51
6 15
7 7
8 ___2___
Total 10,577

32
TABLE 1 – Continued
Panel C: Industry relatedness of the corporate boards that directors serve on Industry_relatedness
Number boards N Mean Std. Dev. Q1 Median Q3
2 1,336 0.96 0.14 1 1 1
3 464 0.95 0.13 1 1 1
4 161 0.95 0.12 1 1 1
5 51 0.95 0.11 1 1 1
6 15 0.97 0.07 1 1 1
7 7 0.86 0.08 0.86 0.86 0.86
8 2 0.94 0.09 0.88 0.94 1
Total 2,036 0.95 0.13 1 1 1
The variable Industry_relatedness is equal to the number of unique industry groupings that the director is associated with divided by the number of unique boards the director serves on. For example, a director who serves on the board of directors of 4 firms that are in 3 different industries will have an Industry_relatedness ratio equal to 3/4. Panel D: Director affiliation by number of boards served on
Number of boards
Number unique
directors
Number director-firm observations
Employee Affiliated Independent
1 8,541 8,541 2,193 1,500 4,848
2 1,336 2,672 425 338 1,909
3 464 1,392 178 172 1,042
4 161 644 55 74 515
5 51 255 15 42 198
6 15 90 3 7 80
7 7 49 1 1 47
8 2 16 0 7 9
TOTAL 10,577 13,659
IRRC classifies each director on the board as either an (i) insider, (ii) affiliated, or (iii) independent outsider. Directors are classified as insiders if they are an employee of the firm, or an officer of the firm (if among the five most highly compensated individuals) or they have beneficial ownership of more than 50% of the firm’s voting power (this may be aggregated if voting power is distributed among more than one member of a defined group; e.g. members of a family beneficially own less than 50% individually, but combined own more than 50%). Affiliated directors include former employees of the firm or its affiliates, relatives of current employee of the firm or its affiliates, directors who provides professional services to the firm or its affiliates or to its officers, has any transactional relationship with the firm or its affiliates, founders who are no longer employees, and directors employed by a significant customer or supplier. An independent director is one who has no connection to the firm other than board seat or that the connection is not significant enough to be reported in the proxy statement.
33
TABLE 1 - Continued
Panel E: Descriptive statistics on board characteristics and director age and tenure N Mean Std. Dev. Q1 Median Q3
Board Size 1,378 9.9 3.2 8 9 12
Frac. Outsiders 1,378 0.62 0.19 0.50 0.67 0.78
Director Age 10,577 58.8 9.1 52 59 65
Director Tenure 10,577 10.1 8.6 4 7 14
Director Age is the age of the director in 1999. Director Tenure is equal to the number of years the director served on the board of a given firm. Board Size is equal to the number of directors that serve on the board. Frac. Outsiders is the fraction of the board that is comprised of independent outsider directors. Panel F: Distribution of director age and tenure by number of board appointments
# Boards served on
Mean Std. Dev. Q1 Median Q3
Director Age 1 58.5 9.5 52 58 65 2 59.6 7.6 55 60 65 3 60.0 6.9 55 60 66 4 60.9 5.8 58 62 65 5 62.3 5.7 59 64 66.4 6 62.2 5.6 57 64.2 66 7 63.1 3.3 N/A 63 N/A 8 64.0 N/A N/A 64 N/A Director Tenure 1 10.2 8.8 4 8 14 2 9.0 5.8 4.5 7.5 11.5 3 9.0 5.2 5.2 7.7 11.7 4 8.6 4.3 5.3 7.8 11.3 5 9.4 5.1 5.6 9 11.8 6 9.7 4.1 6.2 7.7 12.8 7 7.5 2.3 N/A 8.6 N/A 8 13.6 N/A N/A 13.6 N/A
Director Age is the age of the director in 1999. Director Tenure is equal to the number of years the director served on the board of a given company.

34
TABLE 2 Descriptive statistics on firms’ policy choice variables
The sample includes 885 firms with data available from IRRC, Compustat, Execucomp, and Spectrum with directors who serve on multiple boards. The financial statement-based policy variables are based on 5-year average values between 1995-1999. Panel A: Governance policies Variable Mean Std. Dev. Q1 Median Q3
CEO Stock Comp 0.33 0.17 0.21 0.32 0.44
Dual CEO/Chair 0.26 - - - -
# Outsiders on Board 6.65 2.75 5 6 8
Board Size 10.32 3.04 8 10 12
# Board Meetings 7.00 2.70 5 6 8
CEO Stock Compensation is the fraction of total CEO compensation that is stock based as reported by ExecuComp. Dual CEO/Chair is equal to 1 if the CEO is also chairman of the board, and 0 otherwise. # Outsiders on Board is the number of outside directors serving on the board as reported by IRRC. Board Size is the # of directors serving on the board as reported by IRRC. # Board Meetings is the number of board meetings held in 1999 as reported by IRRC. Panel B: Financial policies Variable Mean Std. Dev. Q1 Median Q3 Dividends 0.016 0.023 0.001 0.010 0.023
Repurchases 0.023 0.034 0.002 0.011 0.030
Cash Holdings 0.10 0.14 0.02 0.05 0.12
Leverage 0.23 0.15 0.12 0.23 0.34
Dividends is cash dividends on common and preferred stock (# 127) scaled by average total assets. Repurchases is stock repurchases on common and preferred stock (# 115) scaled by average total assets. Cash Holdings is the level of cash and short term investments (# 1) deflated by end of year assets (# 6). Leverage is the book value of short-term debt (#34) and long-term debt (#9) scaled by end of year assets.

35
TABLE 2 - Continued Panel C: Disclosure and investor relations policies Variable Mean Std. Dev. Q1 Median Q3
Issue Mgmt Forecast 0.13 - - - -
# Mgmt Forecasts 0.19 0.56 0 0 0
Analyst Following 12.12 7.94 5.8 10.2 17.2
Institutional Holdings 0.58 0.21 0.47 0.61 0.73
Issue Mgmt Forecast is equal to 1 if the firm issued a management forecast between 1995 and 1999, and zero otherwise. # Mgmt Forecast is the average number of management forecasts issued each year between 1995 and 1999 as reported by First Call. Analyst Following is the number of analysts issuing annual forecasts as reported by I/B/E/S in 1999. Institutional Holdings is a percentage of a firm’s common shares held by institutional investors (as indicated by 13-F filings tabulated by Spectrum). Panel D: Strategic policies Variable Mean Std. Dev. Q1 Median Q3
Acquisitions 0.03 0.05 0 0.01 0.04
ACQCNT 2.24 1.92 0 2 4
Goodwill 0.06 0.10 0 0.01 0.09
SpecialItems -0.001 0.021 -0.014 -0.003 0
SPECCNT 2.43 1.54 1 2 4
Acquisitions is the average from 1995-1999 of outlays on new acquisitions (# 129) scaled by average total assets. ACQCNT is the sum of firm-year indicator variables equal to 1 if Acquisitions is different from 0 in a given year, 0 otherwise. For example, a firm reporting non-zero acquisitions in 3 years out of the 5 years we examine (1995-1999) would have ACQCNT equal to 3. Special Items is the average from 1995-1999 of item #17, deflated by annual average total assets. SPECCNT is the sum of firm-year indicator variables equal to 1 if Special Items is different from 0 in a given year, 0 otherwise. For example, a firm reporting non-zero special items in 3 years out of the 5 we examine (1995-1999) would have SPECCNT equal to 3. Goodwill is the average value (1995-1999) of the level of goodwill (#204) scaled by average total assets.

35
TABLE 3 Regression of policy variables on firm factors and industry and director fixed effects
Regression of policy choice variables on firm economic characteristics and industry and director fixed effects. All regressions have 3,428 director-firm observations, comprising 1,438 unique directors across 885 firms.
Policyi = α + ΣzγzDirectorz,i + εi (1a) Policyi = α + ΣxβxEconomic_Determinantx,i + εi (1b) Policyi = α + ΣxβxEconomic_Determinantx,i + ΣyλyIndustryy,i + εi (1c) Policyi = α + ΣxβxEconomic_Determinantx,i + ΣyλyIndustryy,i + ΣzγzDirectorz,i + εi (1d)
Panel A: Determinants of governance policies
Model Adjusted R2 Incremental F-test on Policy Variable (1a) (1b) (1c) (1d) R2 (1d) – (1c) Director
CEO Stock Compensation 20.2% 26.7% 36.8% 41.1% 4.3% 1.17**
Dual CEO/Chair 4.8% 3.1% 7.4% 9.5% 2.1% 1.05
# Outsiders on Board 17.2% 31.6% 46.7% 49.6% 2.9% 1.14**
Board Size 15.2% 36.2% 52.1% 55.3% 3.2% 1.16**
# Board Meetings 6.4% 9.3% 20.1% 22.5% 2.4% 1.07^
Panel B: Determinants of financial policies
Model Adjusted R2 Incremental F-test on Policy Variable (1a) (1b) (1c) (1d) R2 (1d) – (1c) Director
Dividends 10.2% 36.3% 53.7% 60.0% 6.3% 1.37**
Repurchases 8.1% 32.7% 39.7% 42.7% 3.0% 1.12*
Cash Holdings 38.3% 23.8% 43.8% 57.8% 14.0% 1.78**
Leverage 4.1% 7.8% 30.1% 32.3% 2.2% 1.07^

36
TABLE 3 - Continued Panel C: Determinants of disclosure and investor relations policies
Model Adjusted R2 Incremental F-test on Policy Variable (1a) (1b) (1c) (1d) R2 (d - c) Director
Issue Mgmt Forecast 3.0% 0.5% 7.0% 9.5% 2.5% 1.06^
# Mgmt Forecasts 2.3% 1.1% 10.9% 13.7% 2.8% 1.07^
Analyst Following 20.2% 69.9% 78.1% 78.7% 0.6% 1.06
Institutional Holdings 6.1% 0.5% 14.9% 17.6% 2.7% 1.08^
Panel D: Determinants of strategic policies
Model Adjusted R2 Incremental F-test on Policy Variable (1a) (1b) (1c) (1d) R2 (d - c) Director
Acquisitions 5.6% 9.8% 20.6% 23.4% 2.8% 1.08*
Special Items 9.9% 8.3% 17.5% 20.8% 3.3% 1.10*
ACQCNT 2.5% 4.0% 23.6% 24.5% 0.9% 1.03
SPECCNT 6.9% 3.2% 16.9% 21.6% 4.7% 1.14**
Goodwill 5.6% 3.7% 16.9% 24.1% 7.2% 1.22**
**, *, and ^ indicate significance at better than the 1%, 5% and 10% levels. All policy variables are as defined in Table 2. Economic determinants included in the regressions are Size (log of market capitalization [25*#199]), Book-to-market (book value of common equity [#60], divided by market capitalization), ROA (operating income after depreciation [#178] scaled by average total assets), FirmAge (log of the number of years the firm has returns data available on CRSP) and the variability of ROA from 1995-1999. Industry is a vector of industry indicator variables defined according to Fama-French industry classifications. There are 46 unique industry groupings in this analysis. Director is a vector of director indicator variables. There are 1,438 unique directors in this analysis.
37
TABLE 4 Economic significance of director fixed effects
The sample comprises 1,438 directors who serve on the boards of 885 firms. Firms are required to have policy variable from IRRC, Compustat, Execucomp, and Spectrum. The financial statement-based policy variables are based on 5-year average values between 1995 and 1999. Panel A: Governance policies
Variable Sample mean of raw policy variable
Interquartile spread of estimated director fixed effects for policy
CEO Stock Comp 0.33 0.12
Dual CEO/Chair 0.26 0.42
# Outsiders on Board 6.65 1.82
Board Size 10.32 2.01
# Board Meetings 7.00 2.04
CEO Stock Compensation is the fraction of total CEO compensation that is stock based as reported by ExecuComp. Dual CEO/Chair is equal to 1 if the CEO is also chairman of the board, and 0 otherwise. # Outsiders on Board is the number of outside directors serving on the board as reported by IRRC. Board Size is the # of directors serving on the board as reported by IRRC. # Board Meetings is the number of board meetings held in 1999 as reported by IRRC. Panel B: Financial policies
Variable Sample mean of raw policy variable
Interquartile spread of estimated director fixed effects for policy
Dividends 0.016 0.010
Repurchases 0.023 0.016
Cash Holdings 0.10 0.05
Leverage 0.23 0.10
Dividends is cash dividends on common and preferred stock (# 127) scaled by average total assets. Repurchases is stock repurchases on common and preferred stock (# 115) scaled by average total assets. Cash Holdings is the level of cash and short term investments (# 1) deflated by end of year assets (# 6). Leverage is the book value of short-term debt (#34) and long-term debt (#9) scaled by end of year assets. Panel C: Disclosure and investor relations policies
Variable Sample mean of raw policy variable
Interquartile spread of estimated director fixed effects for policy
Issue Mgmt Forecast 0.13 0.28
# Mgmt Forecasts 0.19 0.33
Analyst Following 12.12 3.63
Institutional Holdings 0.58 0.15
Issue Mgmt Forecast is equal to 1 if the firm issued a management forecast between 1994 and 1999, and zero otherwise. # Mgmt Forecast is the average number of management forecasts issued each year between 1994 and 1999 as reported by First Call. Analyst Following is the number of analysts issuing annual forecasts as reported by I/B/E/S in 1999. Institutional Holdings is a percentage of a firm’s common shares held by institutional investors (as indicated by 13-F filings tabulated by Spectrum).

38
Panel D: Strategic policies
Variable Sample mean of raw policy variable
Interquartile spread of estimated director fixed effects for policy
Acquisitions 0.03 0.03
ACQCNT 2.24 1.64
Goodwill 0.06 0.06
SpecialItems -0.01 0.01
SPECCNT 2.43 1.40
Acquisitions is the average from 1995-1999 of outlays on new acquisitions (# 129) scaled by average total assets. ACQCNT is the sum of firm-year indicator variables equal to 1 if Acquisitions is different from 0 in a given year, 0 otherwise. For example, a firm reporting non-zero acquisitions in 3 years out of the 5 years we examine (1995-1999) would have ACQCNT equal to 3. Special Items is the average from 1995-1999 of item #17, deflated by annual average total assets. SPECCNT is the sum of firm-year indicator variables equal to 1 if Special Items is different from 0 in a given year, 0 otherwise. For example, a firm reporting non-zero special items in 3 years out of the 5 we examine (1995-1999) would have SPECCNT equal to 3. Goodwill is the average value (1995-1999) of the level of goodwill (#204) scaled by average total assets.

39
TABLE 5 Relation between director fixed effects and director/firm characteristics
This table presents cross-sectional regressions of the estimated magnitude of director fixed effects (derived from regression results in Table 3) on Director Tenure (average natural logarithm of director tenure across board appointments), the # Boards Director Serves On, the Fraction of Outside Directors on Board (average across director’s multiple board appointments), a dummy variable if the Director is CEO for at Least One Firm, and Firm Size (average of log(market value of equity) across firm appointments. The sample consists of 1,438 unique director observations.
|Avg director fixed effectj|=α+β1Tenurej+β2NumBoardsj+β3FracOutsidej+β4CEOj+β5Sizej+εj [2b]
Panel A – Average standardized director fixed effects The dependent variable is calculated as the average magnitude of the standardized director fixed effect across the separate policy regressions estimated in Table 3. The director effect for each policy is standardized to a mean zero and unit variance variable. The dependent variable is the last column is recalculated for each director to include only those director effects for that individually significant at the 10% level.
Determinants of
Director Influence
Predicted
Sign
Dependent variable: Average standardized director fixed effect
across 18 policy variables
Dependent variable: Average standardized director fixed effect across policies with
statistically significant individual director fixed effects
Director Tenure (director average)
+/0
-0.003 (-0.25)
-0.02
(-0.95)
# Boards Director Serves On
+/-
-0.06**
(-5.61)
-0.22**
(-10.97)
Fraction of Outside Directors on Board (director average)
-
-0.35**
(-5.28)
-0.79**
(-6.58)
Director is CEO for at least one firm (dummy variable)
+
0.02 (1.46)
-0.01
(-0.24)
Firm Size (director average)
-
-0.01
(-1.64)
-0.06** (-5.27)
Regression R2 # Obs (see footnote 7)
4.8% 1,438
14.4% 1,433

40
TABLE 5 - Continued Panel B: Individual policies: Determinants of magnitude of director fixed effects Policy variable Tenure #Boards FracOutside CEO dum Firm Size
Stock Compensation -0.25 1.60 -2.89 1.27 -3.92
Dual CEO/Chair -0.94 -1.38 3.27 3.34 -1.67
# Outsiders on Board 0.42 -4.50 -0.14 -1.32 -0.59
Board Size -1.02 -2.91 -4.36 -1.14 -0.48
# Board Meetings -0.05 -3.87 -1.92 0.34 -1.02
Dividends 0.97 -0.64 0.26 0.17 2.39
Repurchases 0.16 0.17 -1.52 -0.38 -4.05
Cash Holdings -0.56 0.55 5.69 1.06 -1.28
Leverage -1.80 1.40 -0.44 -0.69 1.54
Issue Mgmt Forecast -0.17 -8.59 -1.56 2.16 0.49
# Mgmt Forecasts -0.91 -1.77 1.23 0.02 3.17
Analyst Following 1.43 -4.46 -4.46 -0.46 4.47
Institutional Holdings 1.34 -0.74 -7.04 2.87 -0.17
Acquisitions -2.07 -1.31 -2.91 -0.99 -6.50
ACQCNT -1.10 -1.46 -1.89 0.34 1.52
Goodwill -1.71 -0.69 -3.86 1.62 -1.05
SpecialItems 2.56 -0.56 -1.69 -1.08 -1.50
SPECCNT 2.36 -0.58 -3.68 0.59 -0.03
** indicates significance at better than the 1% level. The governance, disclosure, financial, and strategic policy variables are defined in Table 2. The dependent variable in each of these regressions is the estimated magnitude of the director fixed effect for the respective policy variable. These fixed effects are from regression model (1d) in Table 3. We take the absolute value of these fixed effects as we are interested in the magnitude of director’s influence on policy variables.
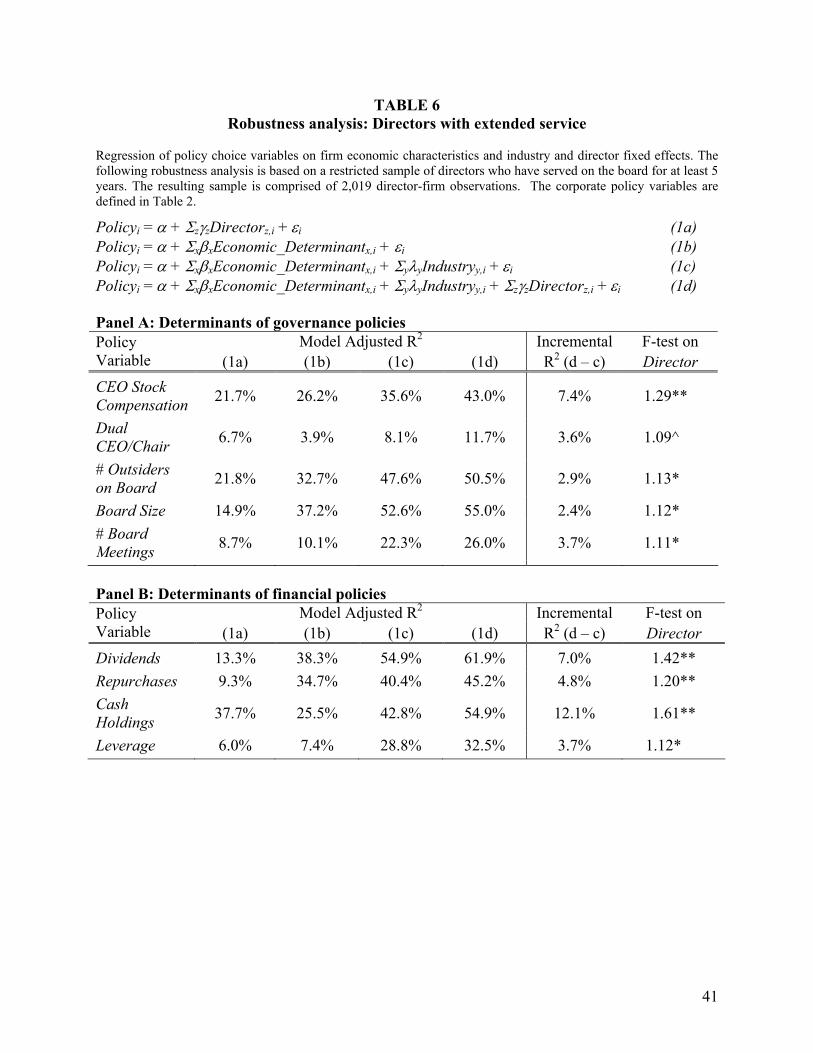
41
TABLE 6 Robustness analysis: Directors with extended service
Regression of policy choice variables on firm economic characteristics and industry and director fixed effects. The following robustness analysis is based on a restricted sample of directors who have served on the board for at least 5 years. The resulting sample is comprised of 2,019 director-firm observations. The corporate policy variables are defined in Table 2.
Policyi = α + ΣzγzDirectorz,i + εi (1a) Policyi = α + ΣxβxEconomic_Determinantx,i + εi (1b) Policyi = α + ΣxβxEconomic_Determinantx,i + ΣyλyIndustryy,i + εi (1c) Policyi = α + ΣxβxEconomic_Determinantx,i + ΣyλyIndustryy,i + ΣzγzDirectorz,i + εi (1d)
Panel A: Determinants of governance policies
Model Adjusted R2 Incremental F-test on Policy Variable (1a) (1b) (1c) (1d) R2 (d – c) Director
CEO Stock Compensation 21.7% 26.2% 35.6% 43.0% 7.4% 1.29**
Dual CEO/Chair 6.7% 3.9% 8.1% 11.7% 3.6% 1.09^
# Outsiders on Board 21.8% 32.7% 47.6% 50.5% 2.9% 1.13*
Board Size 14.9% 37.2% 52.6% 55.0% 2.4% 1.12*
# Board Meetings 8.7% 10.1% 22.3% 26.0% 3.7% 1.11*
Panel B: Determinants of financial policies
Model Adjusted R2 Incremental F-test on Policy Variable (1a) (1b) (1c) (1d) R2 (d – c) Director
Dividends 13.3% 38.3% 54.9% 61.9% 7.0% 1.42**
Repurchases 9.3% 34.7% 40.4% 45.2% 4.8% 1.20**
Cash Holdings 37.7% 25.5% 42.8% 54.9% 12.1% 1.61**
Leverage 6.0% 7.4% 28.8% 32.5% 3.7% 1.12*
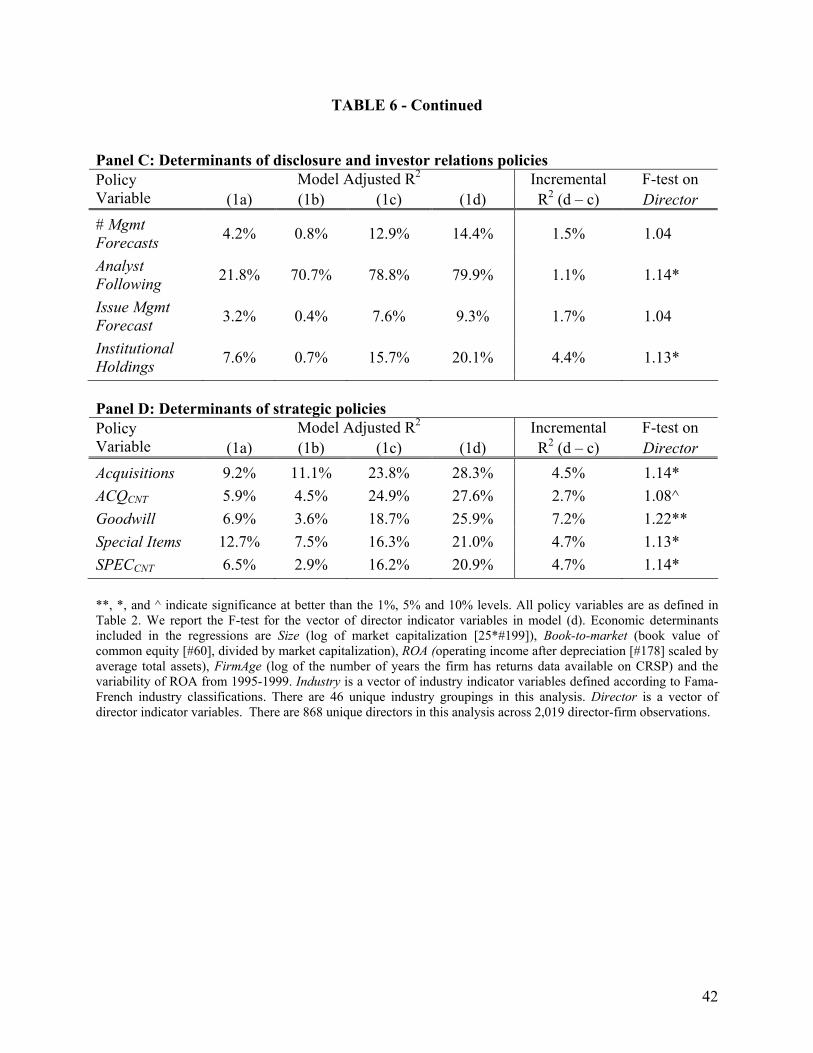
42
TABLE 6 - Continued Panel C: Determinants of disclosure and investor relations policies
Model Adjusted R2 Incremental F-test on Policy Variable (1a) (1b) (1c) (1d) R2 (d – c) Director
# Mgmt Forecasts 4.2% 0.8% 12.9% 14.4% 1.5% 1.04
Analyst Following 21.8% 70.7% 78.8% 79.9% 1.1% 1.14*
Issue Mgmt Forecast 3.2% 0.4% 7.6% 9.3% 1.7% 1.04
Institutional Holdings 7.6% 0.7% 15.7% 20.1% 4.4% 1.13*
Panel D: Determinants of strategic policies
Model Adjusted R2 Incremental F-test on Policy Variable (1a) (1b) (1c) (1d) R2 (d – c) Director
Acquisitions 9.2% 11.1% 23.8% 28.3% 4.5% 1.14*
ACQCNT 5.9% 4.5% 24.9% 27.6% 2.7% 1.08^
Goodwill 6.9% 3.6% 18.7% 25.9% 7.2% 1.22**
Special Items 12.7% 7.5% 16.3% 21.0% 4.7% 1.13*
SPECCNT 6.5% 2.9% 16.2% 20.9% 4.7% 1.14*
**, *, and ^ indicate significance at better than the 1%, 5% and 10% levels. All policy variables are as defined in Table 2. We report the F-test for the vector of director indicator variables in model (d). Economic determinants included in the regressions are Size (log of market capitalization [25*#199]), Book-to-market (book value of common equity [#60], divided by market capitalization), ROA (operating income after depreciation [#178] scaled by average total assets), FirmAge (log of the number of years the firm has returns data available on CRSP) and the variability of ROA from 1995-1999. Industry is a vector of industry indicator variables defined according to Fama-French industry classifications. There are 46 unique industry groupings in this analysis. Director is a vector of director indicator variables. There are 868 unique directors in this analysis across 2,019 director-firm observations.