MISSION POSSIBLE - IETA Media Files/Dec7/SE16 (3).pdfIn its new report “Mission Possible”, the...
19
MISSION POSSIBLE REACHING NET-ZERO CARBON EMISSIONS FROM HARDER-TO-ABATE SECTORS BY MID-CENTURY
Transcript of MISSION POSSIBLE - IETA Media Files/Dec7/SE16 (3).pdfIn its new report “Mission Possible”, the...

MISSION POSSIBLEREACHING NET-ZERO CARBON EMISSIONS FROM
HARDER-TO-ABATE SECTORS BY MID-CENTURY

The Energy Transitions Commission
Adair Turner Ajay Mathur
Dominic Emery Will Gardiner
Philip New Changwen Zhao
Didier Holleaux Lei ZhangRichard Lancaster
Nicholas Stern
Laurence Tubiana
Robert Trezona
Arvid Moss
Nandita Parshad
Auke LontChad Holliday
JP TricoireAlex Laskey Jules Kortenhorst
Cathy Zoi
Mark Laabs
Gopi Katragadda Nigel ToppingAndrew SteerLaurent Auguste Timothy Wirth
Rachel KytePA de Chalendar
Mahendra Singhi
Andreas Regnell
Zoe Knight

Source: IPCC (2018), Global Warming of 1.5˚C
Global emissions pathway characteristics in the IPCC 1.5˚C reportGt CO2/year
Four illustrative model pathways
P1P2P3
P4
40 50 60 70 80 90 21002010 20 30
Timing of net zero CO2Line widths depict the 5-95th
percentile and the 25-75th
percentile of scenarios
Pathways limiting global warming to 1.5˚C with no or low overshoot
Pathways with high overshootPathways limiting global warming below 2˚C (not shown above)
-20
-10
0
10
20
30
40
50
To limit harmful impact of climate change on humanity and the planet, CO2 emissions must reach net-zero globally by around 2050

In its new report “Mission Possible”, the Energy Transitions Commission focuses on 6 major activities, which are the harder-to-abate sectors of the economy

0.9
2.2
1.6
1.1 0.3
2014
2.3
1.0
0.3
2.5
0.4
10.3
2.2
2.3
3.3
1.7
1.8
4.6
2050 Reference Technology
Scenario
1.01.71.3
0.90.7
2050 2°C scenario
15.7
8.1
~30% of global emissions
~40% of global emissions
~60% of global emissions
Source: IEA (2017), Energy Technology Perspectives
Shipping
Aluminum
Iron and steelCement
Chemicals and petrochemicals
AviationHeavy road transport
Direct and process emissions from the harder-to-abate sectorsGt CO2,
With no action, emissions from these harder-to-abate sectors could increase by 50% by mid-century

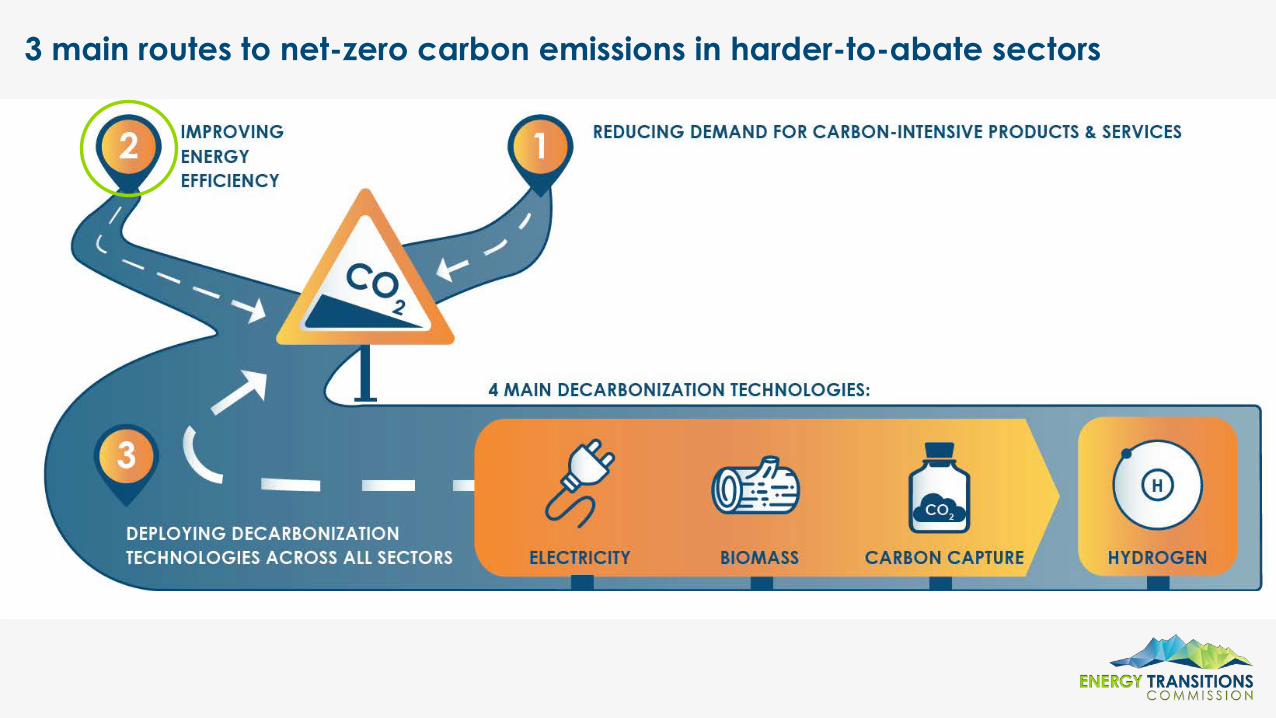
3 main routes to net-zero carbon emissions in harder-to-abate sectors

3 main routes to net-zero carbon emissions in harder-to-abate sectors

9.3
2.0
1.9
0.9
0.8
Current practice scenario
Materials circulation Product circulation
1.7
Circular scenario 2050
2.0
5.6
-40%Aluminium
Cement
PlasticsSteel
2.9
2.8
2.2
1.3
Source: Material Economics analysis for the Energy Transitions Commission (2018)
A more circular economy can cut emissions from the harder-to-abate sectors in industry by 40% by 2050
Global emissions reductions potential from a more circular economy Gt CO2 per year

1.7
1.8
4.6
Current practice scenario (IEA RTS)
Logistics andOperationalefficiency
1.7
Modal shift Reduced demand
1.5
3.3
Demand management
scenario
8.2 0.60.1 0.9
6.5
-20%
ShippingAviationHeavy road
Source: SYSTEMIQ analysis for the Energy Transitions Commission (2018)
Demand management can cut emissions from the harder-to-abate sectors in transport by 20% by 2050
Global emissions reductions potential from demand managementGt CO2 per year, 2050
3 main routes to net-zero carbon emissions in harder-to-abate sectors

The potential for energy efficiency improvement is greater in heavy-duty transport than in heavy industry
• Engine efficiency• Aerodynamics and tyre
design-30/45%
• Switch to dry kilns• Multistage cyclone heaters• Decrease in clinker-to-
cement ratio
-10%
• Machinery efficiency• Wind assistance• Ship design, hull and
propulsion
-30/55%
• Engine efficiency• Aircraft design-30/45%
• Re-use of high pressure gas• Coke dry quenching-15-20%
• Energy efficiency in monomer production
• Naphtha catalytic craking-15-20%

3 main routes to net-zero carbon emissions in harder-to-abate sectors

Source: McKinsey & Company (2018), Decarbonization of the industrial sectors: the next frontier
In each industry sector, there is a trade-off between three major technology pathways: electrification (direct or indirect), carbon capture or use of biomass
0
50
100
150
200
250
300
0 10 20 30 40 50 60 70 80
Electricity price US$/MWh
Carbon capture route
Abatement costUS$ per tonne of CO2
Biomass-based route
Electricity-based route
Breakeven point at which electricity-based solutions
become lower-cost than CCS
Source: SYSTEMIQ analysis for the Energy Transitions Commission (2018)
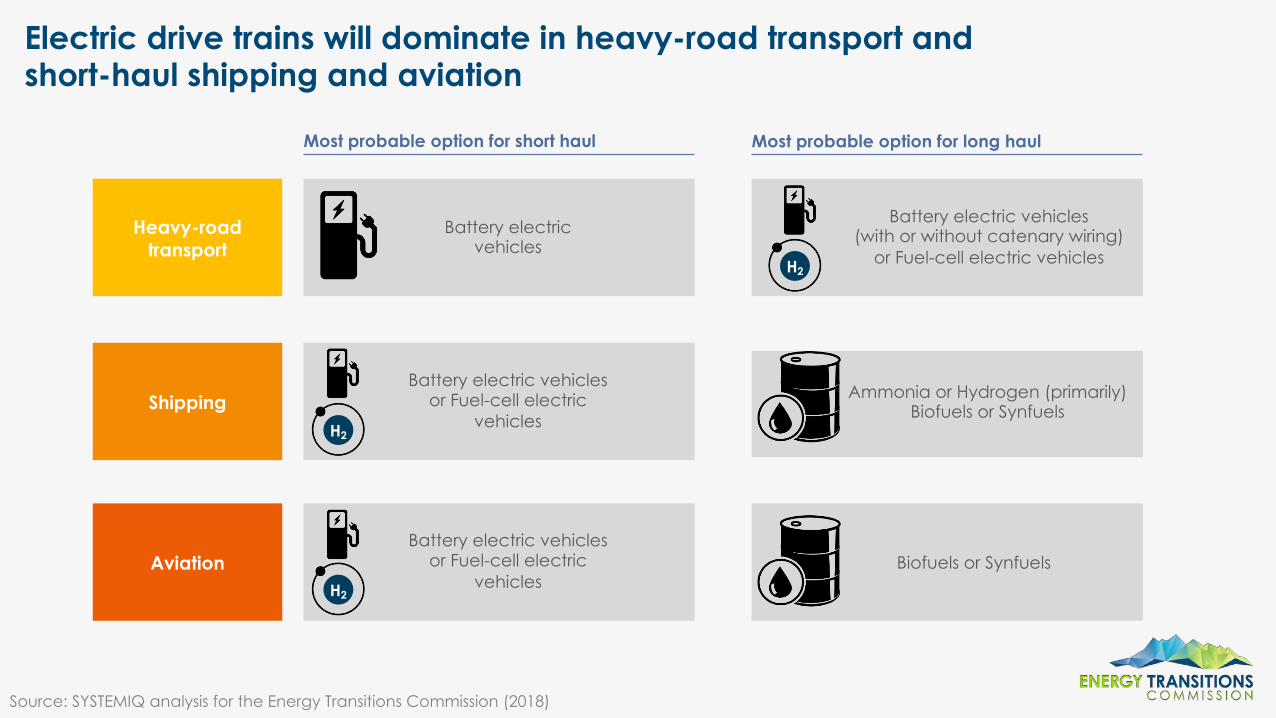
Battery electric vehicles or Fuel-cell electric
vehicles
Ammonia or Hydrogen (primarily)Biofuels or Synfuels
Most probable option for short haul Most probable option for long haul
Biofuels or Synfuels
Battery electric vehicles or Fuel-cell electric
vehicles
H2
Shipping
Aviation
H2
Battery electric vehicles
Heavy-road transport
Battery electric vehicles(with or without catenary wiring)
or Fuel-cell electric vehiclesH2
Electric drive trains will dominate in heavy-road transport and short-haul shipping and aviation

1.5
Supply-side decarbonization - Low-cost scenario
Supply-side decarbonization - High-cost scenario
0.8
Supply-side decarbonization and efficiency - Low-cost scenario
0.5
-46%-67%
0.25%0.45% 0.15%
Note: The term “efficiency” covers energy efficiency, materials efficiency, materials circularity, and demand management in transport.Source: SYSTEMIQ analysis for the Energy Transitions Commission (2018) based on McKinsey & Company (2018), Decarbonization ofindustrial sectors: the next frontier and Material Economics analysis for the Energy Transitions Commission (2018)
X% Share of global projected GDP, 2050
Total cost of decarbonizationTrillion US$ per year, 2050
Decarbonizing harder-to-abate sectors will cost less than 0.5% of global GDP
Ammonia
Heavy-road transportAviation
SteelEthyleneCement
Shipping

Source: SYSTEMIQ analysis for the Energy Transitions Commission (2018)
Decarbonization of the harder-to-abate sectors will havea very small impact on prices for end consumers

Policy-makers
Policy-makers
Policy-makersHarder-to-abate industries
Policy-makersHarder-to-abate industries
Investors
Buyers
Energy companiesInvestors
Action agenda for policy-makers, investors and businesses

Adequate carbon prices must play a central role in driving decarbonization of the harder-to-abate sectors

Indicative supply-side abatement cost, US$/tonne CO2