Missing Movers most troublesome group is that of the mortgaged mover. These households account for...
70
CML RESEARCH www.cml.org.uk Missing Movers A report for the Council of Mortgage Lenders June 2017 A Long-Term Decline in Housing Transactions?
Transcript of Missing Movers most troublesome group is that of the mortgaged mover. These households account for...
CML RESEARCH
www.cml.org.uk
Missing Movers
A report for the Council of Mortgage Lenders
June 2017
A Long-Term Decline in Housing Transactions?

978-1-905257-19-5
33Council of Mortgage LendersMissing Movers
Missing MoversA Long-Term Decline in Housing Transactions?

4 Council of Mortgage LendersMissing Movers
Neal Hudson
Neal Hudson is a housing market analyst and commentator. He is director of Residential Analysts Limited. He previously worked in the Savills residential research team for 11 years. He also worked on the Lyons Housing Review while on secondment at Legal & General in 2014.
Brian Green
Brian Green is an analyst, commentator and consultant specialising in construction, housing and property. He edits Housing Market Intelligence and comments on construction industry trends through the Brickonomics blog.
Thanks, and acknowledgements
The authors’ thanks go to Bob Pannell and Mohammad Jamei at the Council of Mortgage Lenders. We are especially grateful to Mo for his help with the econometric modelling.
This report was also greatly helped by the work of the late Alan Holmans on first-time buyers.
_
The views expressed in this report are those of the authors and do not necessarily reflect those of the Council of Mortgage Lenders.
About the authors

5Council of Mortgage LendersMissing Movers
Contents1 Executive Summary 7
2 What’s the Problem? 12
Introduction 13
Where Is the Problem? 15
Why Does It Matter? 16
3 Who Is Affected? 20
Buyer Types 21
First-Time Buyers 23
Mortgaged Movers 26
Cash Buyers 27
4 Why Is It Happening? 29
Demographic Drivers 30
Willing and Financially Able 32
Econometric Modelling 36
Second Steppers’ Available Budget 39
Non-Financial Factors 43
5 What Does the Future Hold in Store? 45
Looking Ahead 46
Mortgaged First-Time Buyer Scenarios 47
Forecasting Home-Ownership 48
Forecasting the Mortgaged Mover Rate 50
Forecasting Mortgaged Movers 52
6 What Can We Do About It? 54
Policy Context 55
Equity, Lending, and Affordability 57
Support For Mortgaged Movers 58
7 Conclusions 63
References 69

6 Council of Mortgage LendersMissing Movers
Chapter 1:Executive Summary
7Council of Mortgage LendersMissing Movers
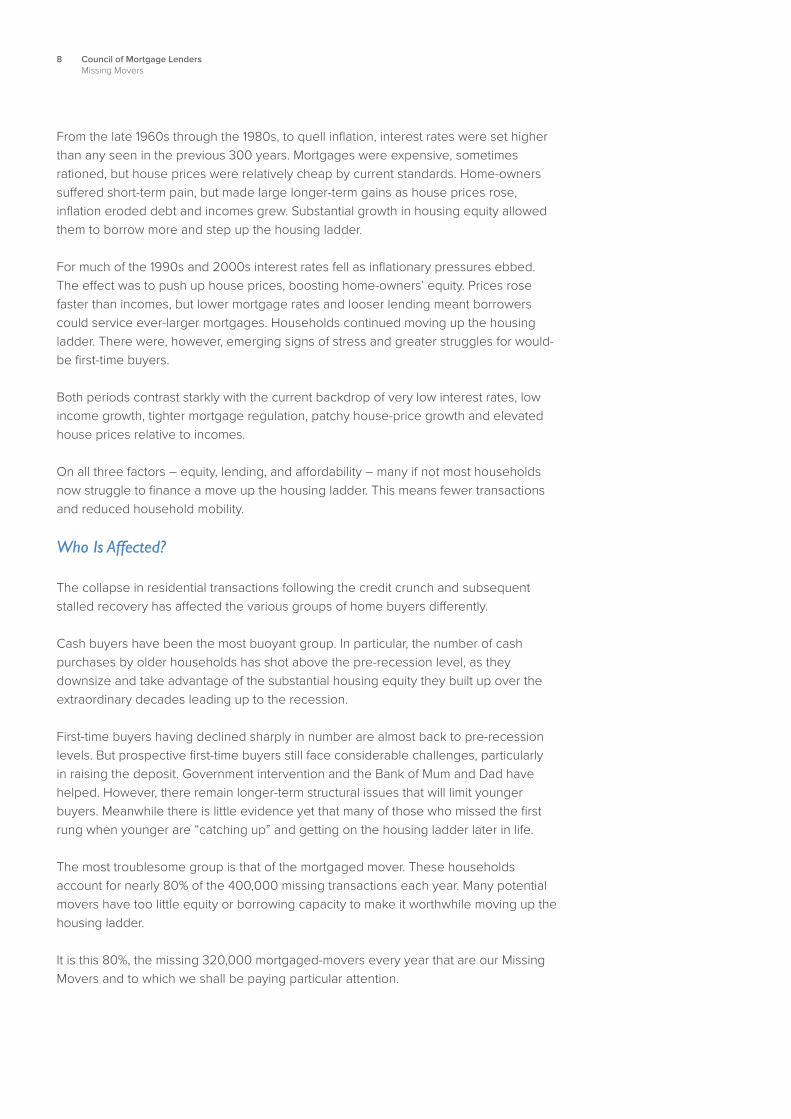
The housing crisis is often characterised in terms of young families struggling to get a footing on the housing ladder and the major hurdle presented by high house prices and deposits and low rates of new housebuilding. This has in many ways shaped housing policy.
Less attention tends to be paid to those who already own homes and their ability to move to homes that better suit their needs. Yet movement among home-owners has been in deep decline for almost three decades. Despite many more homes in private hands, buying and selling activity has halved over that time.
The scale and significance of this long-term decline in movement of home-owners has been highlighted by the latest recession and recovery. Before the recession, there were about 1.6 million home sales in the UK. Home sales fell to 860,000 in 2009 but had recovered to 1.2 million by 2014. This means there are 400,000 fewer transactions each year, with the majority of those being mortgaged-movers.
This report seeks to identify why this has happened and what it means for the housing market and the wider economy. It also considers what might be done to fix the problems caused.
The Extraordinary Past
As for so many things, the past of the housing market has a massive bearing on the present. And there is no ignoring the extraordinary nature of the five decades or so leading up to the 2008 recession. A unique set of changing economic conditions lifted millions of households into home-ownership. Indeed, this period cemented the notion of the housing ladder and the aspirations of most individuals to be home-owners.
Three factors played vital roles:
• Increases in housing EQUITY
• Improvements in LENDING conditions
• And changes in what was AFFORDABLE
But the workings of these factors and the forces exerted dramatically varied over two distinct periods.
Executive Summary
8 Council of Mortgage LendersMissing Movers
From the late 1960s through the 1980s, to quell inflation, interest rates were set higher than any seen in the previous 300 years. Mortgages were expensive, sometimes rationed, but house prices were relatively cheap by current standards. Home-owners suffered short-term pain, but made large longer-term gains as house prices rose, inflation eroded debt and incomes grew. Substantial growth in housing equity allowed them to borrow more and step up the housing ladder.
For much of the 1990s and 2000s interest rates fell as inflationary pressures ebbed. The effect was to push up house prices, boosting home-owners’ equity. Prices rose faster than incomes, but lower mortgage rates and looser lending meant borrowers could service ever-larger mortgages. Households continued moving up the housing ladder. There were, however, emerging signs of stress and greater struggles for would-be first-time buyers.
Both periods contrast starkly with the current backdrop of very low interest rates, low income growth, tighter mortgage regulation, patchy house-price growth and elevated house prices relative to incomes.
On all three factors – equity, lending, and affordability – many if not most households now struggle to finance a move up the housing ladder. This means fewer transactions and reduced household mobility.
Who Is Affected?
The collapse in residential transactions following the credit crunch and subsequent stalled recovery has affected the various groups of home buyers differently. Cash buyers have been the most buoyant group. In particular, the number of cash purchases by older households has shot above the pre-recession level, as they downsize and take advantage of the substantial housing equity they built up over the extraordinary decades leading up to the recession.
First-time buyers having declined sharply in number are almost back to pre-recession levels. But prospective first-time buyers still face considerable challenges, particularly in raising the deposit. Government intervention and the Bank of Mum and Dad have helped. However, there remain longer-term structural issues that will limit younger buyers. Meanwhile there is little evidence yet that many of those who missed the first rung when younger are “catching up” and getting on the housing ladder later in life.
The most troublesome group is that of the mortgaged mover. These households account for nearly 80% of the 400,000 missing transactions each year. Many potential movers have too little equity or borrowing capacity to make it worthwhile moving up the housing ladder. It is this 80%, the missing 320,000 mortgaged-movers every year that are our Missing Movers and to which we shall be paying particular attention.
9Council of Mortgage LendersMissing Movers
Why Is It Happening?
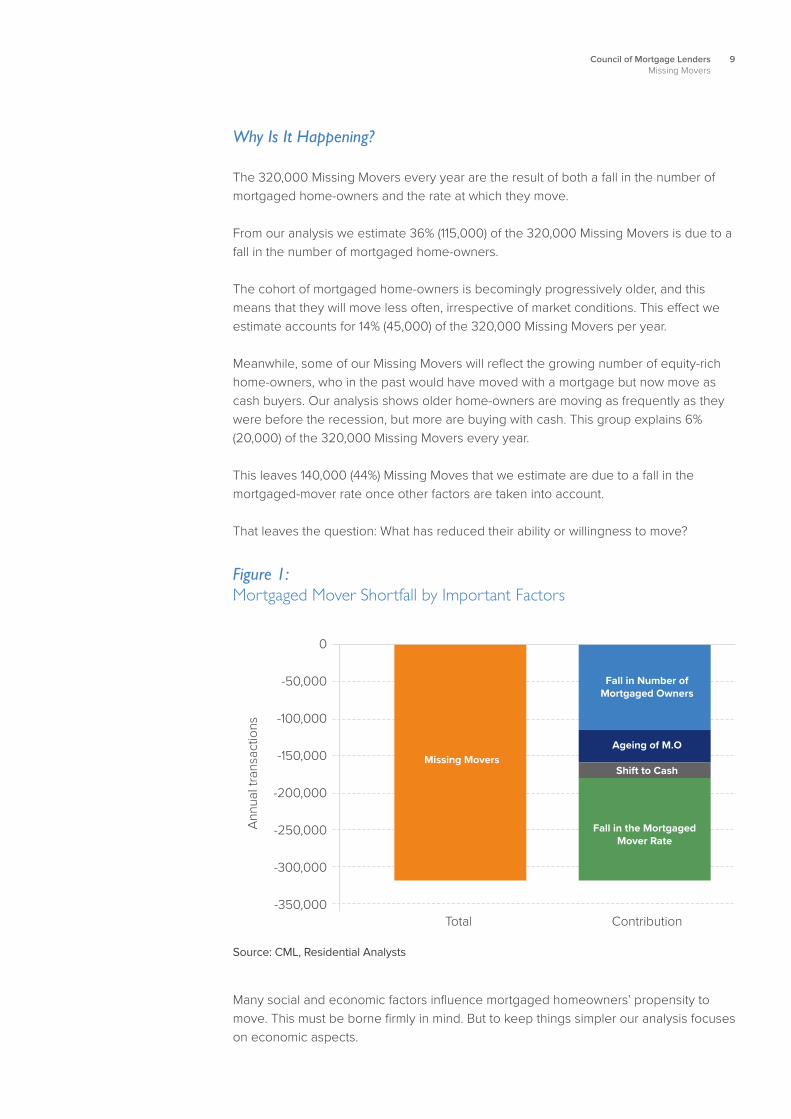
The 320,000 Missing Movers every year are the result of both a fall in the number of mortgaged home-owners and the rate at which they move.
From our analysis we estimate 36% (115,000) of the 320,000 Missing Movers is due to a fall in the number of mortgaged home-owners.
The cohort of mortgaged home-owners is becomingly progressively older, and this means that they will move less often, irrespective of market conditions. This effect we estimate accounts for 14% (45,000) of the 320,000 Missing Movers per year.
Meanwhile, some of our Missing Movers will reflect the growing number of equity-rich home-owners, who in the past would have moved with a mortgage but now move as cash buyers. Our analysis shows older home-owners are moving as frequently as they were before the recession, but more are buying with cash. This group explains 6% (20,000) of the 320,000 Missing Movers every year.
This leaves 140,000 (44%) Missing Moves that we estimate are due to a fall in the mortgaged-mover rate once other factors are taken into account.
That leaves the question: What has reduced their ability or willingness to move?
Figure 1: Mortgaged Mover Shortfall by Important Factors
Source: CML, Residential Analysts
0
-50,000
-100,000
-150,000
-200,000
-250,000
-300,000
-350,000Total Contribution
Ann
ual t
rans
actio
ns
Missing Movers
Fall in Number of Mortgaged Owners
Ageing of M.O
Shift to Cash
Fall in the Mortgaged Mover Rate
Many social and economic factors influence mortgaged homeowners’ propensity to move. This must be borne firmly in mind. But to keep things simpler our analysis focuses on economic aspects.
10 Council of Mortgage LendersMissing Movers
For existing home-owners to move, they must have a desire to move, sufficient funds, and find an available home to buy that meets their desire and budget.
Three factors determine whether they have sufficient funds and can find a home within their budget - their housing equity, what they can borrow, and whether what they can afford meets their desires and is sufficient to make the move worthwhile. Clearly if house prices were lower, reducing the size of each step on the housing ladder, the funds needed to finance a move would reduce. Similarly, if prospective buyers could borrow more, the existing gap between what they own and what they aspire to would be more easily met through borrowing. But while affordability and prevailing lending conditions matter, our analysis very definitely pointed to the ability to release sufficient available equity as the dominant factor determining the mortgaged-mover rate. This may seem odd, given that house prices nationally are above their pre-recession level. But regional variations mean that many households have seen insufficient growth in equity to prompt a move.
Looking to the future what we found was rather unsettling. Using our analytical models to project forward 10 years we considered two scenarios for first-time buyers to gauge the future number of mortgaged home-owners. Neither brought mortgaged home-ownership anywhere near back to its pre-recession level. Meanwhile, using Office for Budget Responsibility forecasts for economic variables to model our mortgage-mover rate, we found little prospect of an uplift in the mortgaged-mover rate.
The picture painted is daunting. Despite the possibility of a small short-term pick up, the number of mortgaged movers looked destined to remain weak over the coming 10 years.
What Can Be Done?
The levers available to raise the existing number of potential mortgaged movers are few and limited, beyond encouraging in more first-time buyers. The losses and gains caused by paying off mortgages, death, divorce, debt and decisions to move out of home-ownership are hard to control. Many will be “baked in”, created by demographic and economic conditions decades ago.
Given these limitations and the extensive measures already supporting first-time buyers, our attention was drawn less to the number of mortgaged movers and more towards the rate at which they move. The bulk of the 320,000 Missing Movers we now see each year are younger than 50, live in homes worth less than £300,000 which are more likely to be in urban locations or urban fringes. These households tend to be moving up the housing ladder rather than trading across or downsizing. While policies to boost the mover rate should not focus solely on these households, those that liberate this group are more likely to be effective.
11Council of Mortgage LendersMissing Movers
But in reality the scope seems limited to broad principles:
• Boosting equity relative to the price of the “next” house is key, either by squeezing the price gap between steps in the housing ladder or increasing their equity.
• Raising the borrowing capacity relative to the price of their target home.
• Kick starting more moves to increase the choice in the market, this should create positive feedback with more moves facilitating more moves.
• Build more homes to boost the available stock and choice for movers and to contain house price rises.
• Reducing the transaction costs on buyers to leave more finance for the purchase.
This all seems extremely straightforward and simple, and in one sense it is. But the trick in selecting actual policies is that they meet the objectives without causing lasting damage elsewhere in the market and are sustainable over time. Interventions that boost one of equity, lending or affordability might work counter to one or both of the others.
This highlights the need for any policy to be viewed in the round. It must also be viewed within the economic context. Furthermore, if policy makers were to be more holistic in their delivery they might look beyond housing for potential solutions. Given the centrality of housing to other policy areas, not least employment, health, and education, there would appear to be significant scope to look across policy areas for potential synergy, which go beyond benefits to individuals, and could see societal gains as well. In other words, housing policy should not be viewed in isolation.
Conclusions
The past naturally informs our view of the present. However, in respect of the housing market, the economic environment of the past 50 years has been extraordinary. Expecting or hoping for a return to those times or even something bearing close resemblance would seem unrealistic. The challenges of the future must be tackled on the basis of the context in which we find ourselves today. That is one of low interest rates, relatively low inflation, high and rising house prices relative to the incomes of prospective home-owners and an ageing population.
From our analysis, this combination is unlikely to unlock broad-based equity building or provide much scope for more relaxed lending.
Perhaps fresh, novel policies will emerge that facilitate more moving in the current much-changed economic environment. However, in their absence we should expect for the foreseeable future movement among mortgaged homeowners to remain constrained.
12 Council of Mortgage LendersMissing Movers
Chapter 2:What’s the Problem?This chapter introduces the nature of low housing market transactions and looks at why that is a problem
13Council of Mortgage LendersMissing Movers
Introduction
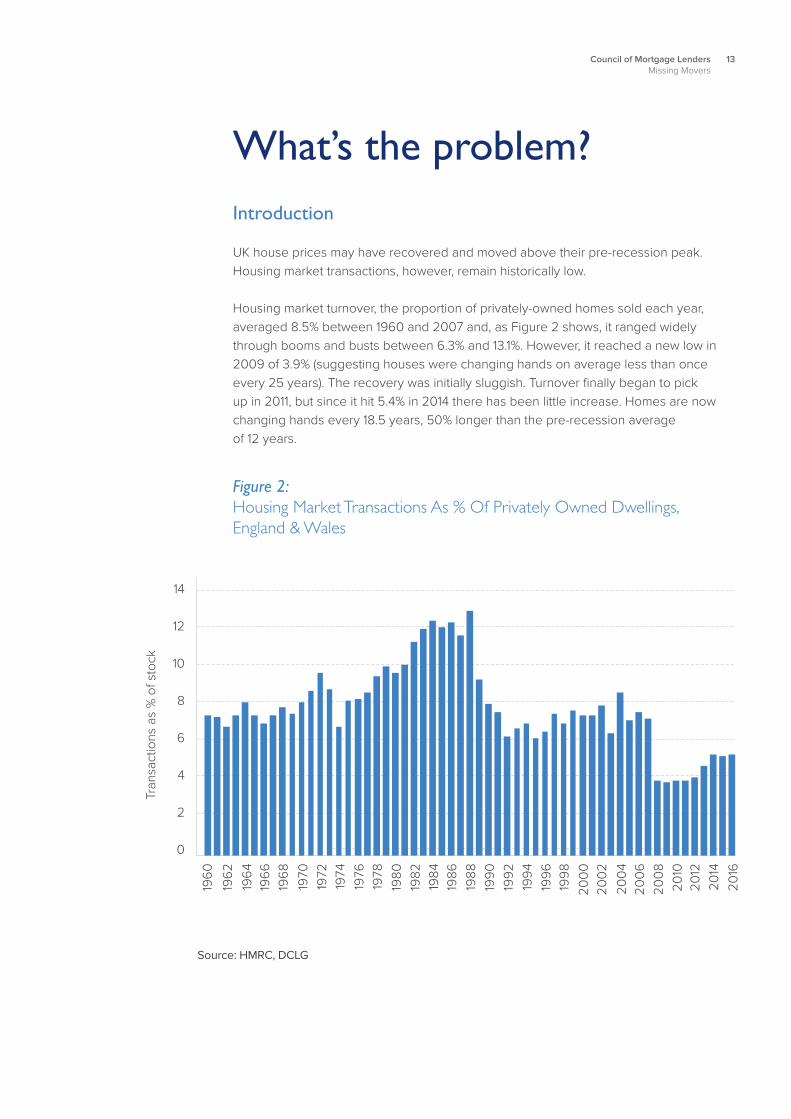
UK house prices may have recovered and moved above their pre-recession peak. Housing market transactions, however, remain historically low. Housing market turnover, the proportion of privately-owned homes sold each year, averaged 8.5% between 1960 and 2007 and, as Figure 2 shows, it ranged widely through booms and busts between 6.3% and 13.1%. However, it reached a new low in 2009 of 3.9% (suggesting houses were changing hands on average less than once every 25 years). The recovery was initially sluggish. Turnover finally began to pick up in 2011, but since it hit 5.4% in 2014 there has been little increase. Homes are now changing hands every 18.5 years, 50% longer than the pre-recession average of 12 years.
What’s the problem?
Figure 2: Housing Market Transactions As % Of Privately Owned Dwellings, England & Wales
14
12
10
8
6
4
2
0
1960
Source: HMRC, DCLG
Tran
sact
ions
as
% o
f sto
ck
1962
1964
1966
1968
1970
1972
1974
1976
1978
1980
1982
1984
1986
1988
1990
1992
1994
1996
1998
2000
2002
2004
2006
2008
2010
2012
2014
2016
14 Council of Mortgage LendersMissing Movers
Housing in the UK is mainly owned by private individuals. With new supply constrained, liquidity in the second-hand housing market is very important as it accounts for about nine in ten transactions. This means a low turnover among home movers is a barrier to an efficiently functioning housing market.
Low housing turnover creates a number of immediate problems and potentially stores up others. The housing stock is used less efficiently. It restricts labour mobility, leading to reduced productivity, lower economic growth and weaker government tax revenues. The tax base for stamp duty shrinks.
There are social costs too. Fewer household moves constrains household formation. The aspirations of householders are frustrated as it becomes tougher to find homes that meet their needs. This may mean longer commutes, being further away from friends and family or feeling trapped in a community that no longer suits. Put simply people are more likely to live in the wrong houses for longer in a low turnover housing market than if it were more liquid.
The purpose of this report is to identify the most important drivers of this lower housing turnover and to determine the causes, the impacts on the wider market and economy, and any potential remedies.
As with any analysis of complex issues assumptions and simplifications must be made. Our focus has been narrowed to financial and economic factors. There are however a complex mix of social, cultural, technological and other non-financial factors that lead to a desire to move and a further complex mix of factors that determine whether that desire is realised in an actual move. Among these factors is the liquidity in the market itself. Where there is less choice the probability of finding a home that satisfies the desire to move is reduced.
These non-financial factors are not included in the core analysis, but are considered in the interpretation.

15Council of Mortgage LendersMissing Movers
Where Is the Problem?
Housing market turnover is very closely related to the number of housing transactions, given that the stock of private homes remains fairly stable, at least in the short term.
The average number of residential transactions across the UK over 2006 and 2007 was 1.64 million. In 2016 transactions stood at 1.23 million having fallen to 860,000 in 2009, as the credit crunch throttled the housing market.
Figure 3 illustrates the fall and recovery which began in 2012 with the launch of Funding for Lending in July, followed by Help to Buy in March 2013. But the recovery has stalled leaving a gap of slightly over 400,000 missing transactions per year when compared to pre-recession levels.
Figure 3: Housing Market Transactions, UK
1,800,000
1,600,000
1,400,000
1,200,000
1,000,000
800,000
600,000
400,000
200,000
02006 2007 2008 2009 2010
Source: HMRC, DCLG
Tran
sact
ions
2011 2012 2013 2014 2015 2016
400,000
Looked at regionally across the UK there are significant variations. Northern Ireland has seen the greatest proportional fall in transactions. It is closely linked with the Republic of Ireland which suffered a far deeper housing recession than the UK. Meanwhile, proportionately, transactions are down least in the south of England. Although with signs of falling transactions again in London, which acts as a motor for the greater region, there must be a question over how much more the south can contribute in restoring housing transactions nationally to a pre-recession level.
Examining local authority data suggests transactions are down more in urban than rural areas. This trend possibly reflects the spatial distribution of the population by age. Younger people are more likely to live in urban areas and be constrained by the current housing market.
In general, the recovery in transactions has tended to be stronger within higher-priced markets, even after adjusting for the overall upward drift in prices.
16 Council of Mortgage LendersMissing Movers
Why Does It Matter?
The popular focus on household moves is encapsulated in the notion of the housing ladder. This notion is broadly aspirational relating essentially to home-ownership. It suggests a path (ladder) for households from first-time buyer, through a step or steps to the family home, a possible downsizing move for empty-nesters followed by a possible move to a retirement home.
For many years the housing ladder has characterised and informed the wider private housing market and the production of new homes.
In reality, households move for a variety of reasons. The reasons will differ for each household depending on a range and mix of factors, such as age, housing tenure, income, social group, life-stage, family circumstances or friendships, health, location, employment and aspirations. Some moves will be made more from choice, others will be driven more by obligations.
The ability of households to move will also depend on a range and mix of factors, not least the ability of others to move to create sufficient liquidity in the market. New housing adds relatively little to the overall stock each year, so the vast majority of moves in all tenures are made between existing homes.
Although most household moves are made within the same broad tenure – renting or ownership – households will move across tenures, from renting to ownership and ownership to renting.
It is not within the remit of this report to seek a detailed understanding of the reasons for household moves. The focus is on the economic and financial factors influencing household moves between private sector housing, particularly moves among mortgaged movers. But these moves are not made in isolation. Being aware of the general pattern and factors influencing the choices made by all households and how these have changed is important in appreciating the degree to which economic and financial factors have influenced the moves of mortgaged households over time and where other factors may have played a part
If we are to consider the broader economic and social impact of fewer mortgaged moves, it is important to appreciate the relative scale of the decline in the context of all residential moves. Here we can turn to data from English Housing Survey and its forerunner the Survey of English Housing. The survey covers England, but will be reasonably representative of the UK as a whole.
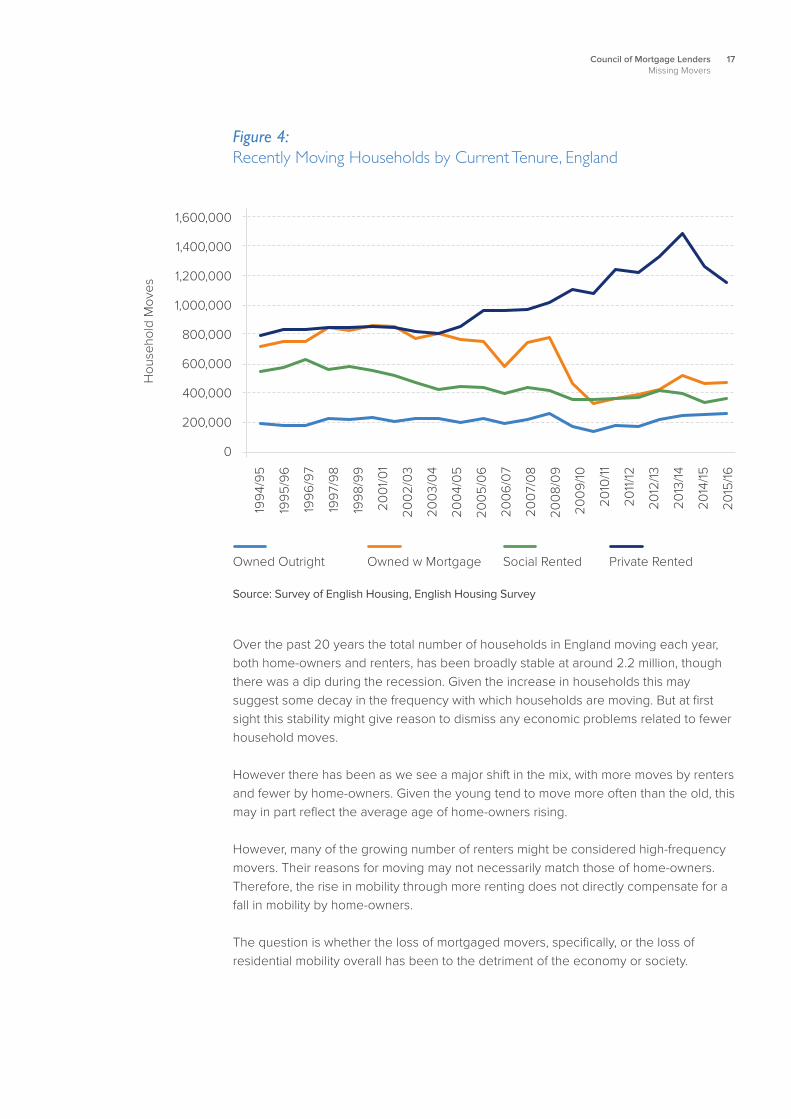
As Figure 4 shows, households moving into and within home-ownership accounted for 41% of moves across all tenures in the years 1999 to 2007. Mortgaged home-owners accounted for about 34%. In the years 2009 to 2015, after the recession, the respective figures were 25% and 18%. The share of moves by those owning outright did fall immediately after the recession. However, that share has subsequently risen above its pre-recession level.
17Council of Mortgage LendersMissing Movers
Figure 4: Recently Moving Households by Current Tenure, England
1,600,000
1,400,000
1,200,000
1,000,000
800,000
600,000
400,000
200,000
0
Source: Survey of English Housing, English Housing Survey
Hou
seho
ld M
oves
1994
/95
1995
/96
1996
/97
1997
/98
1998
/99
2001
/01
2002
/03
2003
/04
2004
/05
2005
/06
2006
/07
2007
/08
2008
/09
2009
/10
2010
/11
2011
/12
2012
/13
2013
/14
2014
/15
2015
/16
Owned Outright Owned w Mortgage Social Rented Private Rented
Over the past 20 years the total number of households in England moving each year, both home-owners and renters, has been broadly stable at around 2.2 million, though there was a dip during the recession. Given the increase in households this may suggest some decay in the frequency with which households are moving. But at first sight this stability might give reason to dismiss any economic problems related to fewer household moves.
However there has been as we see a major shift in the mix, with more moves by renters and fewer by home-owners. Given the young tend to move more often than the old, this may in part reflect the average age of home-owners rising.
However, many of the growing number of renters might be considered high-frequency movers. Their reasons for moving may not necessarily match those of home-owners. Therefore, the rise in mobility through more renting does not directly compensate for a fall in mobility by home-owners.
The question is whether the loss of mortgaged movers, specifically, or the loss of residential mobility overall has been to the detriment of the economy or society.
18 Council of Mortgage LendersMissing Movers
An obvious candidate for concern is labour mobility. There is much academic literature pointing to a positive link between labour mobility and economic performance. And various connections have been made between the residential mobility and labour mobility and the concern that reduced movement of households has negatively impacted on productivity and performance of the economy. However, the link between productivity and labour supply does not all pull in one direction, as a report by DTZ Consultingi for the then Department of Trade and Industry noted in 2005. It featured a survey showing companies cancelling investment as a result of labour shortages, while others invested to reduce dependency on labour.
There are, naturally, more parochial economic impacts from a fall in moves within home-ownership. It reduces the tax base for Stamp Duty Land Tax. All other things equal, fewer home sales also reduces the client base for estate agents and the demand for removal firms and other businesses associated with moves. Quantifying the precise impact of lower levels of household moves is far from straightforward. There will be positive and negative effects. But for our purposes here it seems reasonable to take judgement from OECD analysis. In its presentation on housing and the economy from its 2011 “Going for Growth” publicationii, it recommended the UK adopt policies to increase residential mobility.
From a housing market perspective, low turnover is likely to result in a poor allocation of homes, as households adjust more slowly to their changing needs. This is a point that should be noted when designing policies that seek to encourage first-time buyers into home-ownership. If first-time buyers are given incentives leading them into owning a home, thought should be given to their ability as mortgaged movers to move as freely as possible when circumstances change. Inherent in policies directed at increasing home-ownership among first-time buyers is the danger that they become trapped, unable to finance a desired move. This not only limits their aspirations, but has consequences for the whole of the housing market through reducing liquidity and frustrating the ability of others to move.
The significant gap between those who wish to move and those who actually move, particularly among home-owners and social renters, is clear from analysis by Understanding Society examining home moves between 2009 and 2010. It found just 9% of mortgaged home-owners saying they wished to move had moved within a year. The figure for outright owners was 5.7%.
It is, however, important to bear in mind that home-owners wishing to change their lot in housing are not faced with a simple binary choice of move or do without. Particularly if they wish to remain within their current community, they may have the option to improve or extend their home. There is evidenceiii that certain market conditions can prompt a shift from move to improve. This will impact on the number of moves made by owner occupiers.

19Council of Mortgage LendersMissing Movers
One economic effect that may be less well recognised is the close correlation between residential transactions and private sector housing completions since the late 1970s, approximating to one private sector home built for every 10 residential property transactionsiv. The mechanisms have not been tested, but it would appear that housebuilders respond to the level of liquidity in the market. Whether this relationship holds in future is uncertain, but if it does it suggests that lower numbers of home movers might act to suppress new house building, all other things being equal.
The above is an illustration of the social and economic impacts relating to reduced levels of household mobility. There are inevitably many more, positive and negative. The clear picture is that greater residential mobility does matter.

20 Council of Mortgage LendersMissing Movers
Chapter 3:Who is affected?This chapter investigates which buyer groups have been affected by the downturn in transactions

21Council of Mortgage LendersMissing Movers
Who is affected?Buyer Types
The collapse in residential transactions and the subsequent recovery has affected the various groups of buyers differently. The most dramatic fall is seen among mortgaged movers.
The effect of the recession and its aftermath was not only to drive down the overall number of transactions. It also reshaped the share of transactions between buyer groups. While there were 16% fewer first-time buyers since 2006, their share of transactions has increased from 24% to 27%. Mortgaged buy-to-let purchases in 2016 accounted for 8% of transactions, down from 10% in 2006. Meanwhile there were 13% more cash buyers in 2016 than in 2006 and their share of transactions rose from 23% to 35%.
But the biggest change is in the numbers of mortgaged movers. In 2006 these accounted for 43% of all UK residential transaction. In 2016 they accounted for just 29%. This collapse accounts for nearly 80% of the overall decline in transactions since the 2006/07 peak of the market.
Figure 5: Transactions by Buyer Type, UK
1,800,000
1,600,000
1,400,000
1,200,000
1,000,000
800,000
600,000
400,000
200,000
02006 2007 2008 2009 2010
Source: HMRC, CML
Tran
sact
ions
2011 2012 2013 2014 2015 2016
Cash Buyers Mortgaged Buy to Let
Mortgage Movers Mortgaged First Time Buyers
2005
22 Council of Mortgage LendersMissing Movers
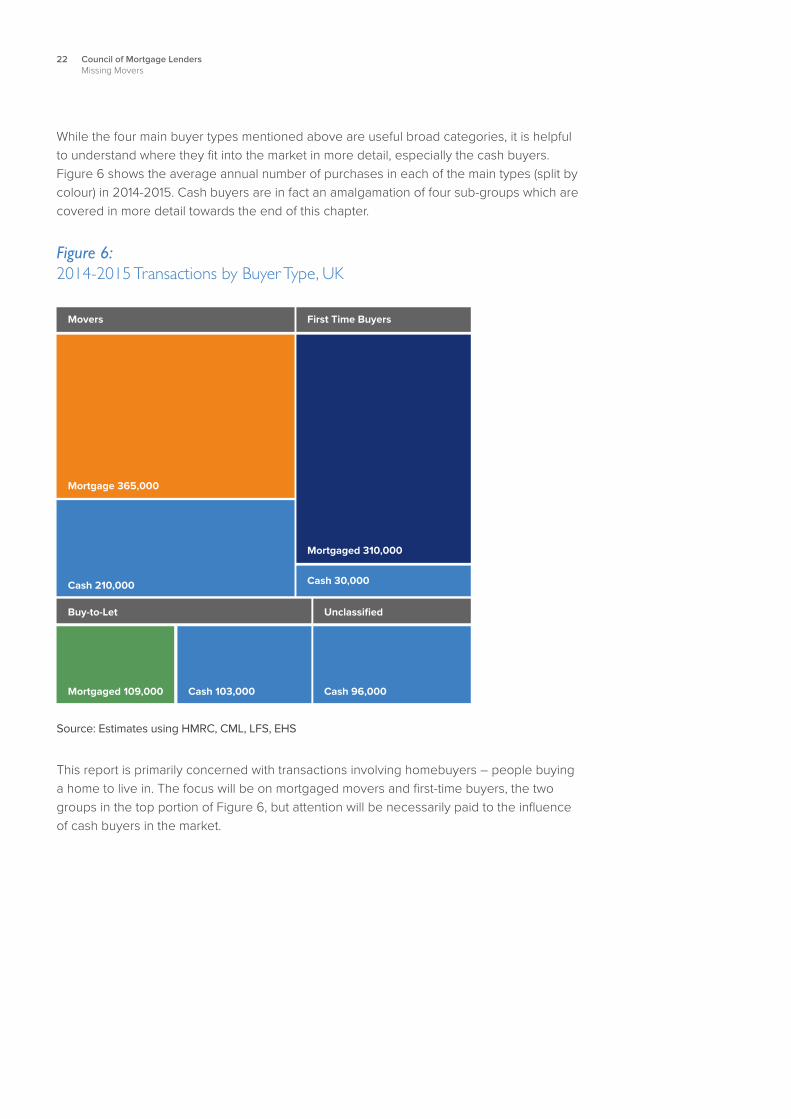
While the four main buyer types mentioned above are useful broad categories, it is helpful to understand where they fit into the market in more detail, especially the cash buyers. Figure 6 shows the average annual number of purchases in each of the main types (split by colour) in 2014-2015. Cash buyers are in fact an amalgamation of four sub-groups which are covered in more detail towards the end of this chapter.
Figure 6: 2014-2015 Transactions by Buyer Type, UK
Source: Estimates using HMRC, CML, LFS, EHS
Movers First Time Buyers
Mortgage 365,000
Mortgaged 310,000
Cash 210,000 Cash 30,000
Buy-to-Let Unclassified
Mortgaged 109,000 Cash 103,000 Cash 96,000
This report is primarily concerned with transactions involving homebuyers – people buying a home to live in. The focus will be on mortgaged movers and first-time buyers, the two groups in the top portion of Figure 6, but attention will be necessarily paid to the influence of cash buyers in the market.

23Council of Mortgage LendersMissing Movers
First-Time Buyers
The challenges facing prospective first-time buyers are well documentedv but there has been a partial recovery in numbers in recent years. Raising a sufficient deposit is the biggest barrier to buying a first home given elevated house prices and constrained mortgage lending at very high loan-to-value ratios. Many first-time buyers have found support from the ‘Bank of Mum & Dad’ and Government schemes, both of which reduce the burden for large deposits. The impact of this support appears evident in the divergent paths of mortgaged buyer types since 2012, with mortgaged movers having seen almost no recovery.
Figure 7: Mortgaged Buyers Indexed At 2006/07 Peak
Source: CML seasonally adjusted
100
90
80
70
60
50
40
30
20
10
0
Inde
xed
com
plet
ions
(100
=pea
k)
Mar
-05
Sep
-05
Mar
-06
Sep
-06
Mar
-07
Sep
-07
Mar
-08
Sep
-08
Mar
-09
Sep
-09
Mar
-10
Sep
-10
Mar
-11
Sep
-11
Mar
-12
Sep
-12
Mar
-13
Sep
-13
Mar
-14
Sep
-14
Mortgaged First Time Buyers Mortgaged Movers
Mar
-15
Sep
-15
Mar
-16
Sep
-16
Mar
-17
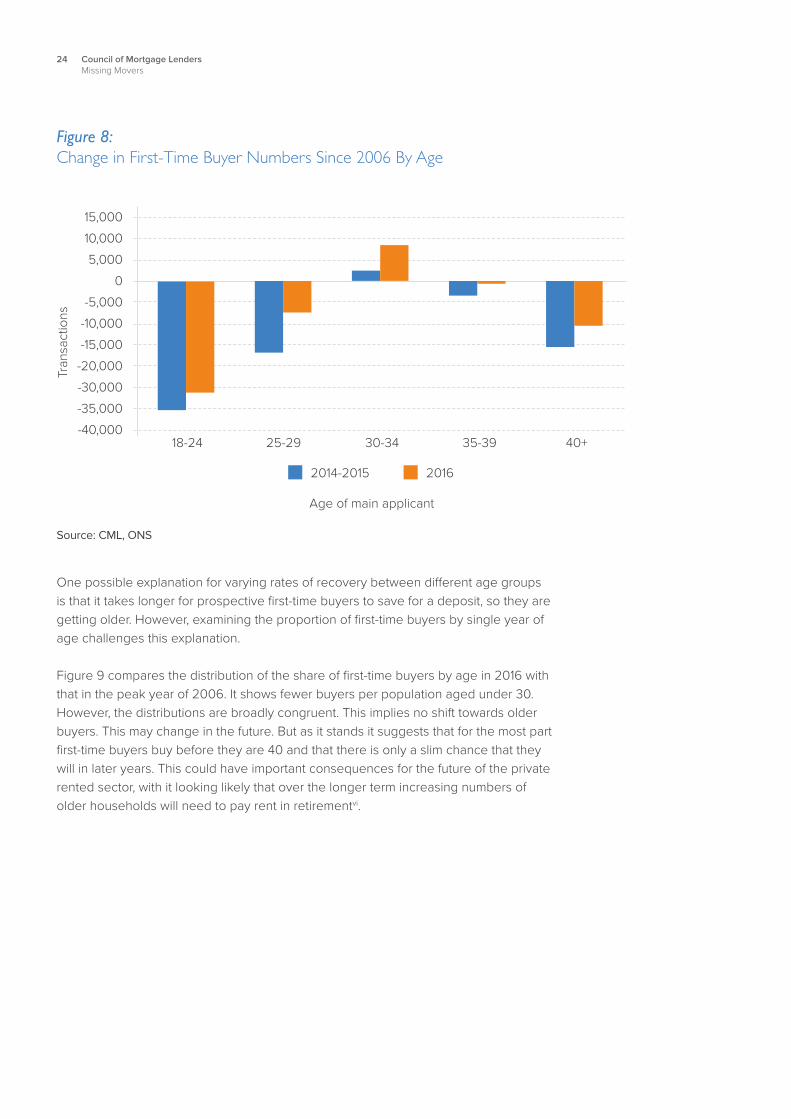
The recovery in first-time buyer numbers has not been equally distributed across age groups. The recovery has been strongest among those in their thirties where numbers have risen above the previous peak level. The number of first-time buyers aged 40 and above, and those in their early twenties remain below their previous peak but are showing signs of continued recovery. The biggest gap remains among the youngest first-time buyers, those aged under 25 for whom there are few signs of recovery.
Hel
p to
Buy
Fund
ing
for L
endi
ng
24 Council of Mortgage LendersMissing Movers
Figure 8: Change in First-Time Buyer Numbers Since 2006 By Age
15,000
10,000
5,000
0
-5,000
-10,000
-15,000
-20,000
-30,000
-35,000
-40,00018-24 25-29 30-34
Source: CML, ONS
Tran
sact
ions
35-39 40+
2014-2015 2016
Age of main applicant
One possible explanation for varying rates of recovery between different age groups is that it takes longer for prospective first-time buyers to save for a deposit, so they are getting older. However, examining the proportion of first-time buyers by single year of age challenges this explanation.
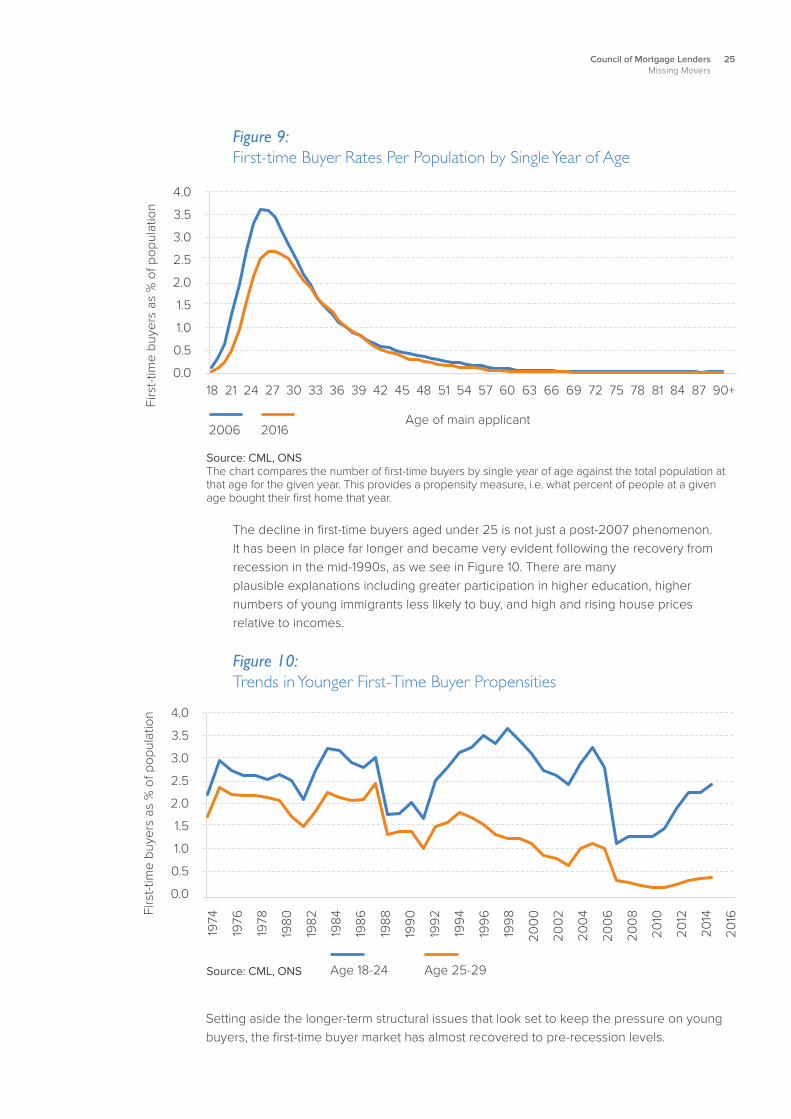
Figure 9 compares the distribution of the share of first-time buyers by age in 2016 with that in the peak year of 2006. It shows fewer buyers per population aged under 30. However, the distributions are broadly congruent. This implies no shift towards older buyers. This may change in the future. But as it stands it suggests that for the most part first-time buyers buy before they are 40 and that there is only a slim chance that they will in later years. This could have important consequences for the future of the private rented sector, with it looking likely that over the longer term increasing numbers of older households will need to pay rent in retirementvi.
25Council of Mortgage LendersMissing Movers
Figure 9: First-time Buyer Rates Per Population by Single Year of Age
Source: CML, ONS The chart compares the number of first-time buyers by single year of age against the total population at that age for the given year. This provides a propensity measure, i.e. what percent of people at a given age bought their first home that year.
Age of main applicant
4.0
3.5
3.0
2.5
2.0
1.5
1.0
0.5
0.0
Firs
t-tim
e bu
yers
as
% o
f pop
ulat
ion
2006 2016
18 21 24 27 30 33 36 39 42 45 48 51 54 57 60 63 66 69 72 75 78 81 84 87 90+
The decline in first-time buyers aged under 25 is not just a post-2007 phenomenon. It has been in place far longer and became very evident following the recovery from recession in the mid-1990s, as we see in Figure 10. There are many plausible explanations including greater participation in higher education, higher numbers of young immigrants less likely to buy, and high and rising house prices relative to incomes.
Figure 10: Trends in Younger First-Time Buyer Propensities
Source: CML, ONS
4.0
3.5
3.0
2.5
2.0
1.5
1.0
0.5
0.0
Firs
t-tim
e bu
yers
as
% o
f pop
ulat
ion
Age 18-24 Age 25-29
1974
1976
1978
1980
1982
1984
1986
1988
1990
1992
1994
1996
1998
2000
2002
2004
2006
2008
2010
2012
2014
2016
Setting aside the longer-term structural issues that look set to keep the pressure on young buyers, the first-time buyer market has almost recovered to pre-recession levels.
26 Council of Mortgage LendersMissing Movers
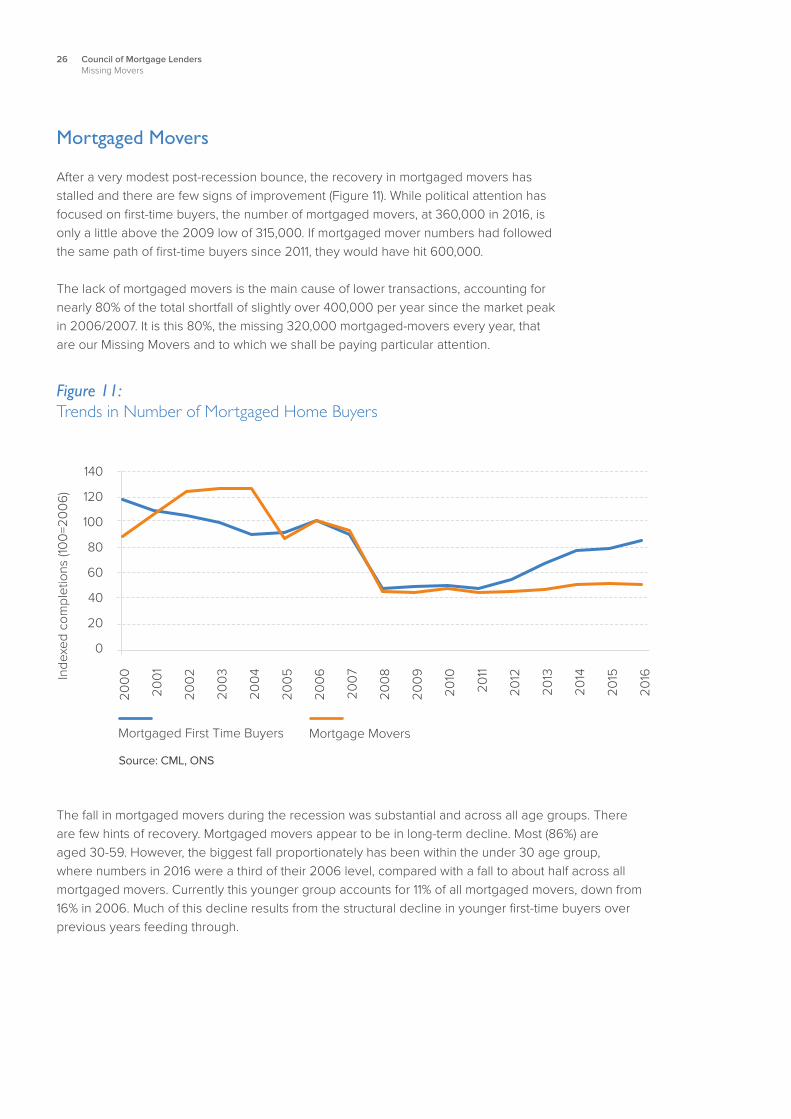
Mortgaged Movers
After a very modest post-recession bounce, the recovery in mortgaged movers has stalled and there are few signs of improvement (Figure 11). While political attention has focused on first-time buyers, the number of mortgaged movers, at 360,000 in 2016, is only a little above the 2009 low of 315,000. If mortgaged mover numbers had followed the same path of first-time buyers since 2011, they would have hit 600,000.
The lack of mortgaged movers is the main cause of lower transactions, accounting for nearly 80% of the total shortfall of slightly over 400,000 per year since the market peak in 2006/2007. It is this 80%, the missing 320,000 mortgaged-movers every year, that are our Missing Movers and to which we shall be paying particular attention.
Figure 11: Trends in Number of Mortgaged Home Buyers
Source: CML, ONS
140
120
100
80
60
40
20
0
Inde
xed
com
plet
ions
(100
=200
6)
Mortgaged First Time Buyers Mortgage Movers
2000
2001
2002
2003
2004
2005
2006
2007
2008
2009
2010
2011
2012
2013
2014
2015
2016
The fall in mortgaged movers during the recession was substantial and across all age groups. There are few hints of recovery. Mortgaged movers appear to be in long-term decline. Most (86%) are aged 30-59. However, the biggest fall proportionately has been within the under 30 age group, where numbers in 2016 were a third of their 2006 level, compared with a fall to about half across all mortgaged movers. Currently this younger group accounts for 11% of all mortgaged movers, down from 16% in 2006. Much of this decline results from the structural decline in younger first-time buyers over previous years feeding through.
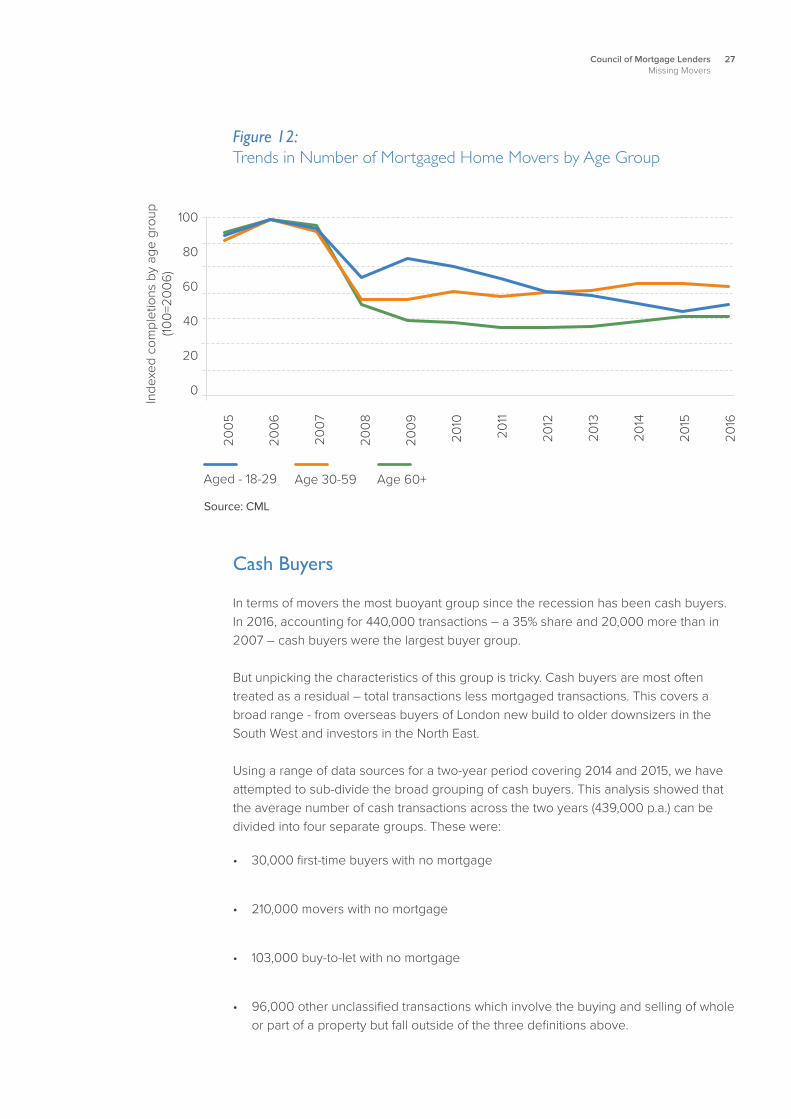
27Council of Mortgage LendersMissing Movers
Figure 12: Trends in Number of Mortgaged Home Movers by Age Group
Source: CML
100
80
60
40
20
0
Inde
xed
com
plet
ions
by
age
grou
p (10
0=20
06)
Aged - 18-29 Age 30-59
2005
2006
2007
2008
2009
2010
2011
2012
2013
2014
2015
2016
Age 60+
Cash Buyers
In terms of movers the most buoyant group since the recession has been cash buyers. In 2016, accounting for 440,000 transactions – a 35% share and 20,000 more than in 2007 – cash buyers were the largest buyer group.
But unpicking the characteristics of this group is tricky. Cash buyers are most often treated as a residual – total transactions less mortgaged transactions. This covers a broad range - from overseas buyers of London new build to older downsizers in the South West and investors in the North East.
Using a range of data sources for a two-year period covering 2014 and 2015, we have attempted to sub-divide the broad grouping of cash buyers. This analysis showed that the average number of cash transactions across the two years (439,000 p.a.) can be divided into four separate groups. These were:
• 30,000 first-time buyers with no mortgage
• 210,000 movers with no mortgage
• 103,000 buy-to-let with no mortgage
• 96,000 other unclassified transactions which involve the buying and selling of whole or part of a property but fall outside of the three definitions above.
28 Council of Mortgage LendersMissing Movers
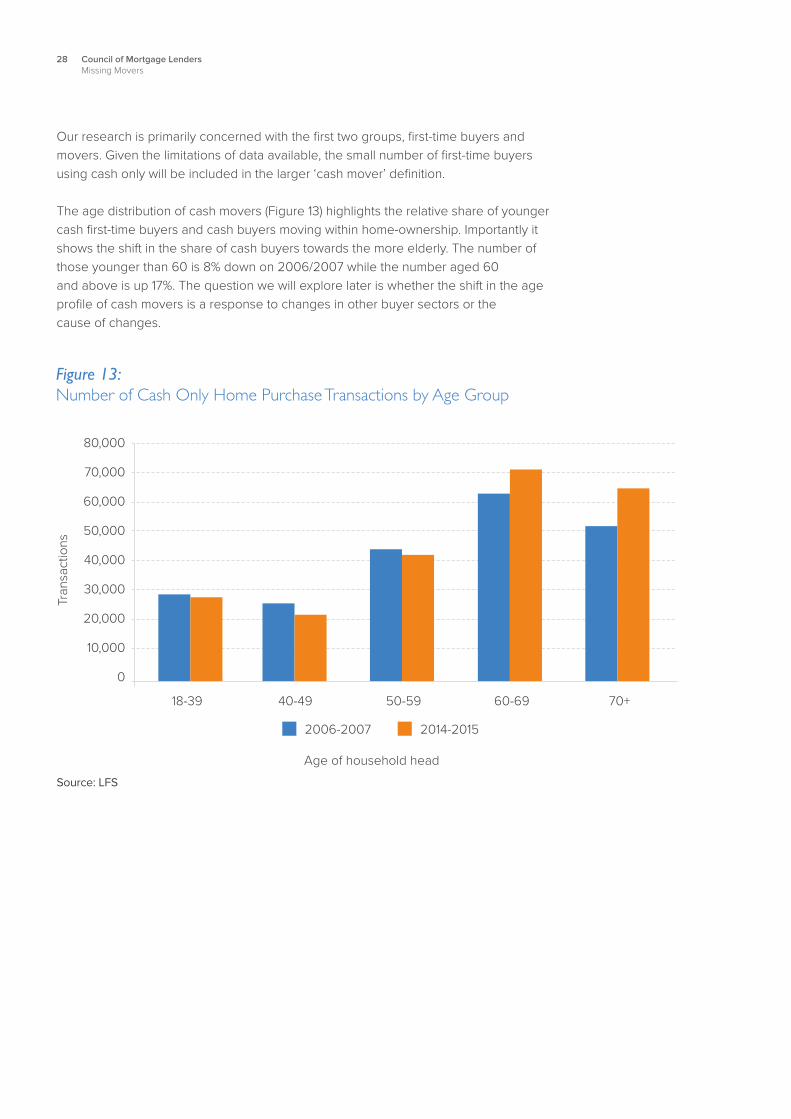
Our research is primarily concerned with the first two groups, first-time buyers and movers. Given the limitations of data available, the small number of first-time buyers using cash only will be included in the larger ‘cash mover’ definition.
The age distribution of cash movers (Figure 13) highlights the relative share of younger cash first-time buyers and cash buyers moving within home-ownership. Importantly it shows the shift in the share of cash buyers towards the more elderly. The number of those younger than 60 is 8% down on 2006/2007 while the number aged 60 and above is up 17%. The question we will explore later is whether the shift in the age profile of cash movers is a response to changes in other buyer sectors or the cause of changes.
Figure 13: Number of Cash Only Home Purchase Transactions by Age Group
80,000
70,000
60,000
50,000
40,000
30,000
20,000
10,000
0
Source: LFS
Tran
sact
ions
40-49 50-59 60-69 70+
2006-2007 2014-2015
18-39
Age of household head
2929Council of Mortgage LendersMissing Movers
Chapter 4:Why Is It Happening?This chapter investigates why the number of mortgaged movers has declined

30 Council of Mortgage LendersMissing Movers
Why Is It Happening?Demographic Drivers
Chapter 2 highlighted the fall in mortgaged movers as the main cause of lower transac-tions, accounting for 80% of the fall since 2006/2007. These are the 320,000 Missing Movers each year. Given the significance of these missing mortgaged-movers, this chapter focusses on understanding why mortgaged moves have dropped so far and why there is little sign of recovery.
The stock of mortgaged home-owners along with the rate at which they move ultimately determines the level of mortgage movers in the market at any one time. First we will look at how demographic changes have affected the stock of mortgaged home-owners.
The UK population is ageingvii. This is having profound effects on the housing mar-ket in general and the number of mortgaged movers in particular. Older households are less likely to move than younger households, irrespective of market conditions. A home-owner in their thirties is nearly twice as likely to move in any given year when compared to a home-owner in their fifties.
The number of mortgaged home-owners is also in decline. They first levelled off during the early 2000s at around 10.2 million households according to the Labour Force Sur-vey. This coincided with a decline in first-time buyer numbers and a rise in households paying off their mortgages. Rising unaffordability and the recession then led to large falls in first-time buyers which exacerbated the fall in mortgaged home-owners during the mid to late 2000s. Our analysis shows that the number of mortgaged home-owners has fallen by around 1.8million since 2000 but there could have been 2.7million more first-time buyers if they had continued buying at 2000 propensities.
Combine this fall in numbers with mortgaged home-owners on average being older, so less inclined to move, and there will be fewer mortgaged movers, all other things remain equal.
31Council of Mortgage LendersMissing Movers
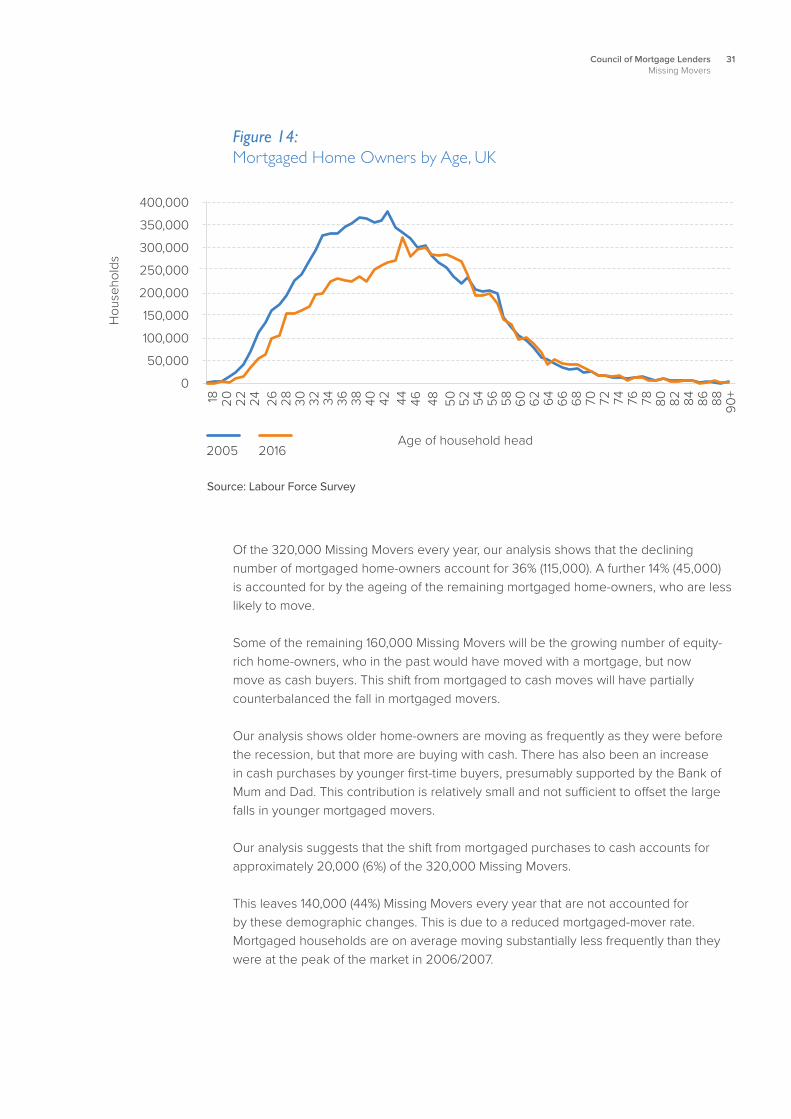
Figure 14: Mortgaged Home Owners by Age, UK
Source: Labour Force Survey
Age of household head
400,000
350,000
300,000
250,000
200,000
150,000
100,000
50,000
0
Hou
seho
lds
2005 2016
18 20 22 24 84 86 88 90+
26 28 30 32 34 36 38 40 42 44 46 48 50 5452 56 58 60 62 64 66 68 70 7472 76 78 80 82
Of the 320,000 Missing Movers every year, our analysis shows that the declining number of mortgaged home-owners account for 36% (115,000). A further 14% (45,000) is accounted for by the ageing of the remaining mortgaged home-owners, who are less likely to move.
Some of the remaining 160,000 Missing Movers will be the growing number of equity-rich home-owners, who in the past would have moved with a mortgage, but now move as cash buyers. This shift from mortgaged to cash moves will have partially counterbalanced the fall in mortgaged movers.
Our analysis shows older home-owners are moving as frequently as they were before the recession, but that more are buying with cash. There has also been an increase in cash purchases by younger first-time buyers, presumably supported by the Bank of Mum and Dad. This contribution is relatively small and not sufficient to offset the large falls in younger mortgaged movers.
Our analysis suggests that the shift from mortgaged purchases to cash accounts for approximately 20,000 (6%) of the 320,000 Missing Movers.
This leaves 140,000 (44%) Missing Movers every year that are not accounted for by these demographic changes. This is due to a reduced mortgaged-mover rate. Mortgaged households are on average moving substantially less frequently than they were at the peak of the market in 2006/2007.
32 Council of Mortgage LendersMissing Movers
0
-50,000
-100,000
-150,000
-200,000
-250,000
-300,000
-350,000Total Contribution
Ann
ual t
rans
actio
ns
Missing Movers
Fall in Number of Mortgaged Owners
Ageing of M.O
Shift to Cash
Fall in the Mortgaged Mover Rate
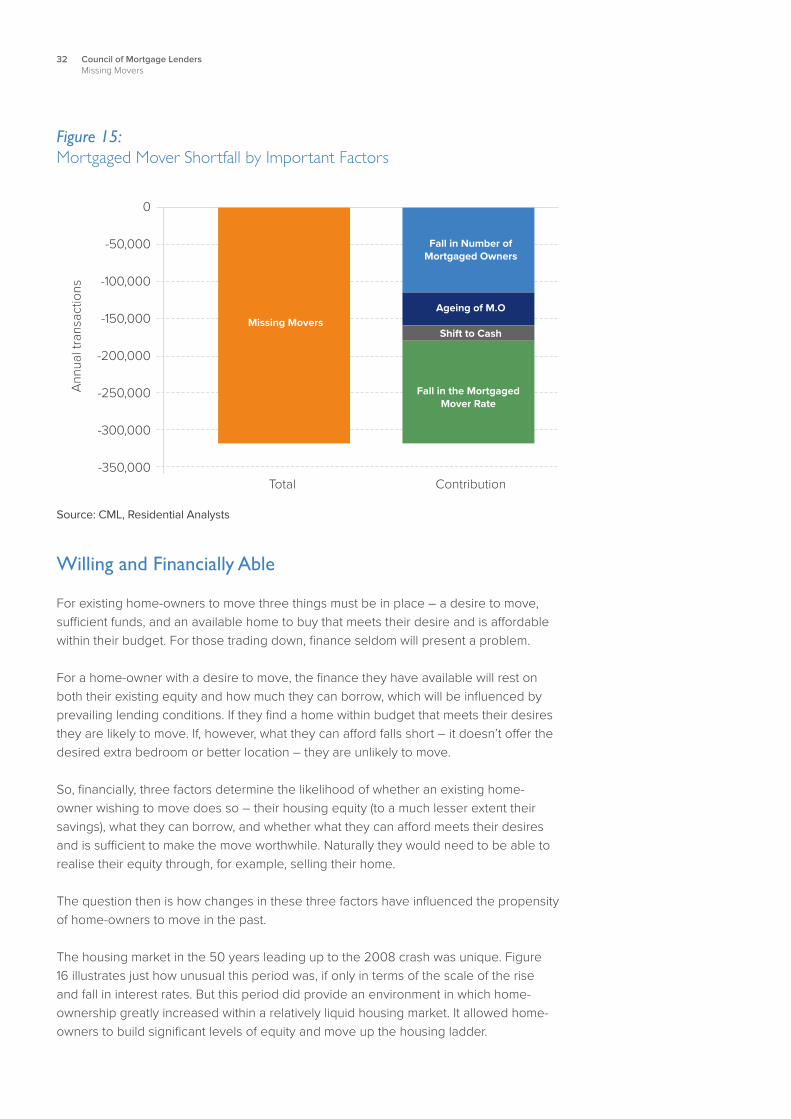
Figure 15: Mortgaged Mover Shortfall by Important Factors
Source: CML, Residential Analysts
Willing and Financially Able
For existing home-owners to move three things must be in place – a desire to move, sufficient funds, and an available home to buy that meets their desire and is affordable within their budget. For those trading down, finance seldom will present a problem.
For a home-owner with a desire to move, the finance they have available will rest on both their existing equity and how much they can borrow, which will be influenced by prevailing lending conditions. If they find a home within budget that meets their desires they are likely to move. If, however, what they can afford falls short – it doesn’t offer the desired extra bedroom or better location – they are unlikely to move.
So, financially, three factors determine the likelihood of whether an existing home-owner wishing to move does so – their housing equity (to a much lesser extent their savings), what they can borrow, and whether what they can afford meets their desires and is sufficient to make the move worthwhile. Naturally they would need to be able to realise their equity through, for example, selling their home.
The question then is how changes in these three factors have influenced the propensity of home-owners to move in the past.
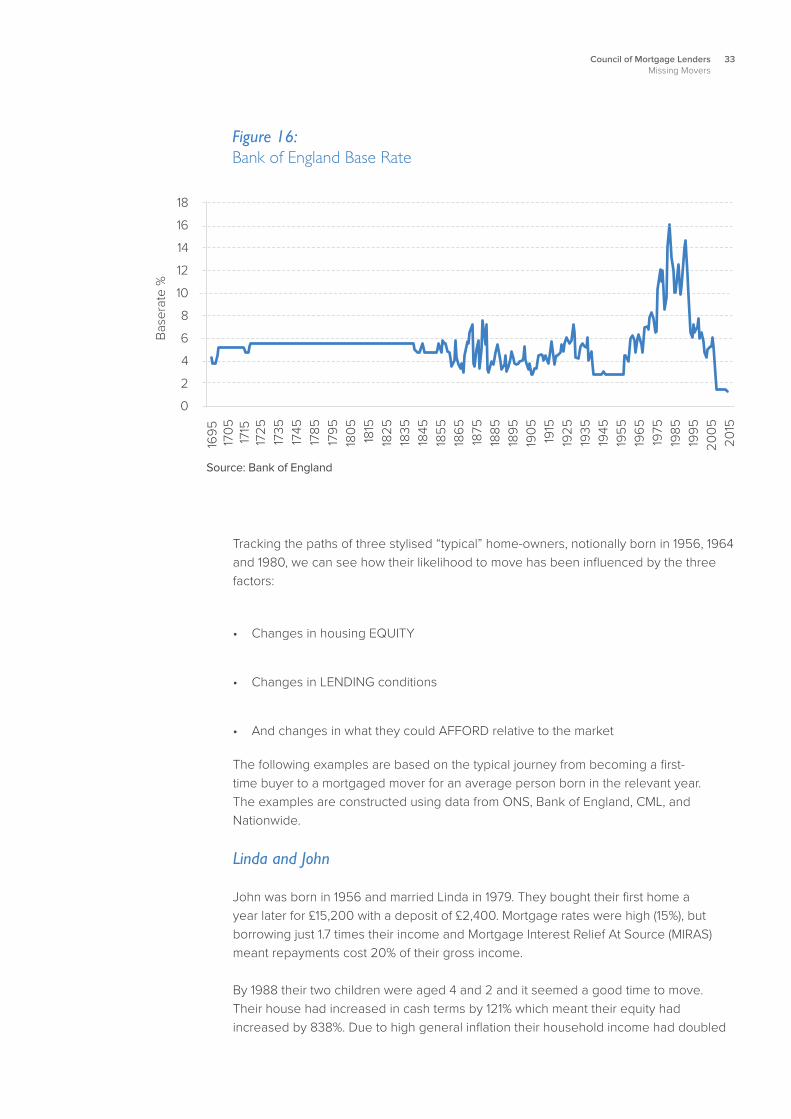
The housing market in the 50 years leading up to the 2008 crash was unique. Figure 16 illustrates just how unusual this period was, if only in terms of the scale of the rise and fall in interest rates. But this period did provide an environment in which home-ownership greatly increased within a relatively liquid housing market. It allowed home-owners to build significant levels of equity and move up the housing ladder.
33Council of Mortgage LendersMissing Movers
Figure 16: Bank of England Base Rate
Source: Bank of England
18
16
14
12
10
8
6
4
2
0
Bas
erat
e %
1695
1705
1715
1725
1735
1745
1785
1795
1805 1815
1825
1835
1845
1855
1865
1875
1885
1895
1905 1915
1925
1935
1945
1955
1965
1975
1985
1995
2005
2015
Tracking the paths of three stylised “typical” home-owners, notionally born in 1956, 1964 and 1980, we can see how their likelihood to move has been influenced by the three factors:
• Changes in housing EQUITY
• Changes in LENDING conditions
• And changes in what they could AFFORD relative to the market
The following examples are based on the typical journey from becoming a first-time buyer to a mortgaged mover for an average person born in the relevant year. The examples are constructed using data from ONS, Bank of England, CML, and Nationwide.
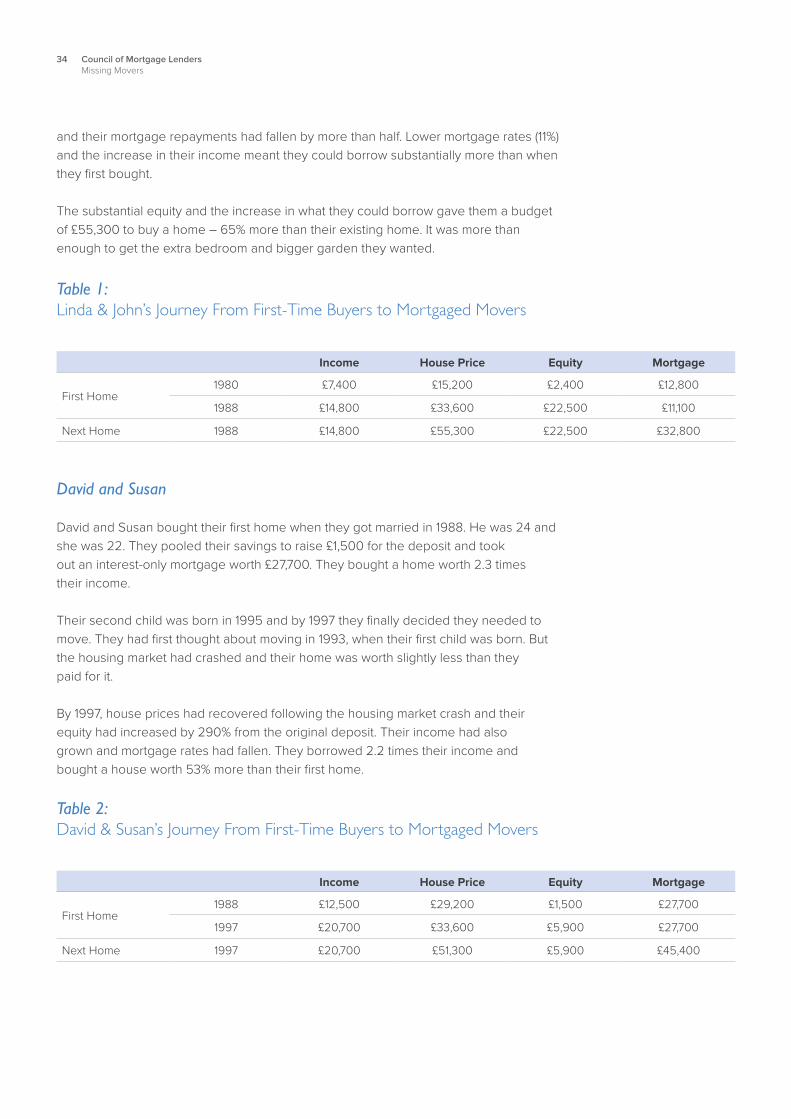
Linda and John
John was born in 1956 and married Linda in 1979. They bought their first home a year later for £15,200 with a deposit of £2,400. Mortgage rates were high (15%), but borrowing just 1.7 times their income and Mortgage Interest Relief At Source (MIRAS) meant repayments cost 20% of their gross income.
By 1988 their two children were aged 4 and 2 and it seemed a good time to move. Their house had increased in cash terms by 121% which meant their equity had increased by 838%. Due to high general inflation their household income had doubled
34 Council of Mortgage LendersMissing Movers
and their mortgage repayments had fallen by more than half. Lower mortgage rates (11%) and the increase in their income meant they could borrow substantially more than when they first bought.
The substantial equity and the increase in what they could borrow gave them a budget of £55,300 to buy a home – 65% more than their existing home. It was more than enough to get the extra bedroom and bigger garden they wanted.
Income House Price Equity Mortgage
First Home1980 £7,400 £15,200 £2,400 £12,800
1988 £14,800 £33,600 £22,500 £11,100
Next Home 1988 £14,800 £55,300 £22,500 £32,800
Table 1: Linda & John’s Journey From First-Time Buyers to Mortgaged Movers
David and Susan
David and Susan bought their first home when they got married in 1988. He was 24 and she was 22. They pooled their savings to raise £1,500 for the deposit and took out an interest-only mortgage worth £27,700. They bought a home worth 2.3 times their income.
Their second child was born in 1995 and by 1997 they finally decided they needed to move. They had first thought about moving in 1993, when their first child was born. But the housing market had crashed and their home was worth slightly less than they paid for it.
By 1997, house prices had recovered following the housing market crash and their equity had increased by 290% from the original deposit. Their income had also grown and mortgage rates had fallen. They borrowed 2.2 times their income and bought a house worth 53% more than their first home.
Income House Price Equity Mortgage
First Home1988 £12,500 £29,200 £1,500 £27,700
1997 £20,700 £33,600 £5,900 £27,700
Next Home 1997 £20,700 £51,300 £5,900 £45,400
Table 2: David & Susan’s Journey From First-Time Buyers to Mortgaged Movers
35Council of Mortgage LendersMissing Movers
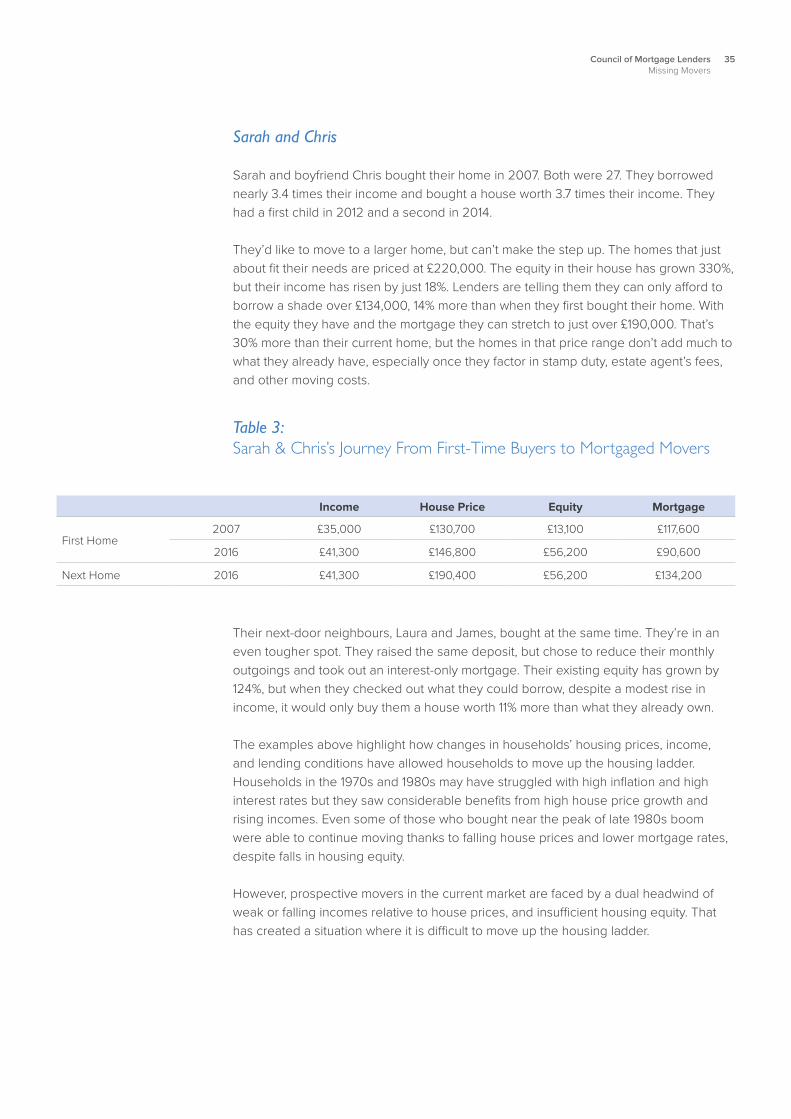
Sarah and Chris
Sarah and boyfriend Chris bought their home in 2007. Both were 27. They borrowed nearly 3.4 times their income and bought a house worth 3.7 times their income. They had a first child in 2012 and a second in 2014.
They’d like to move to a larger home, but can’t make the step up. The homes that just about fit their needs are priced at £220,000. The equity in their house has grown 330%, but their income has risen by just 18%. Lenders are telling them they can only afford to borrow a shade over £134,000, 14% more than when they first bought their home. With the equity they have and the mortgage they can stretch to just over £190,000. That’s 30% more than their current home, but the homes in that price range don’t add much to what they already have, especially once they factor in stamp duty, estate agent’s fees, and other moving costs.
Income House Price Equity Mortgage
First Home2007 £35,000 £130,700 £13,100 £117,600
2016 £41,300 £146,800 £56,200 £90,600
Next Home 2016 £41,300 £190,400 £56,200 £134,200
Table 3: Sarah & Chris’s Journey From First-Time Buyers to Mortgaged Movers
Their next-door neighbours, Laura and James, bought at the same time. They’re in an even tougher spot. They raised the same deposit, but chose to reduce their monthly outgoings and took out an interest-only mortgage. Their existing equity has grown by 124%, but when they checked out what they could borrow, despite a modest rise in income, it would only buy them a house worth 11% more than what they already own.
The examples above highlight how changes in households’ housing prices, income, and lending conditions have allowed households to move up the housing ladder. Households in the 1970s and 1980s may have struggled with high inflation and high interest rates but they saw considerable benefits from high house price growth and rising incomes. Even some of those who bought near the peak of late 1980s boom were able to continue moving thanks to falling house prices and lower mortgage rates, despite falls in housing equity.
However, prospective movers in the current market are faced by a dual headwind of weak or falling incomes relative to house prices, and insufficient housing equity. That has created a situation where it is difficult to move up the housing ladder.
36 Council of Mortgage LendersMissing Movers
Econometric Modelling
To explore what might be behind the unaccounted for 140,000 Missing Movers each year (44% of our 320,000), we have undertaken modelling to investigate how changes in economic and financial conditions may be influencing home-owners’ ability to move.
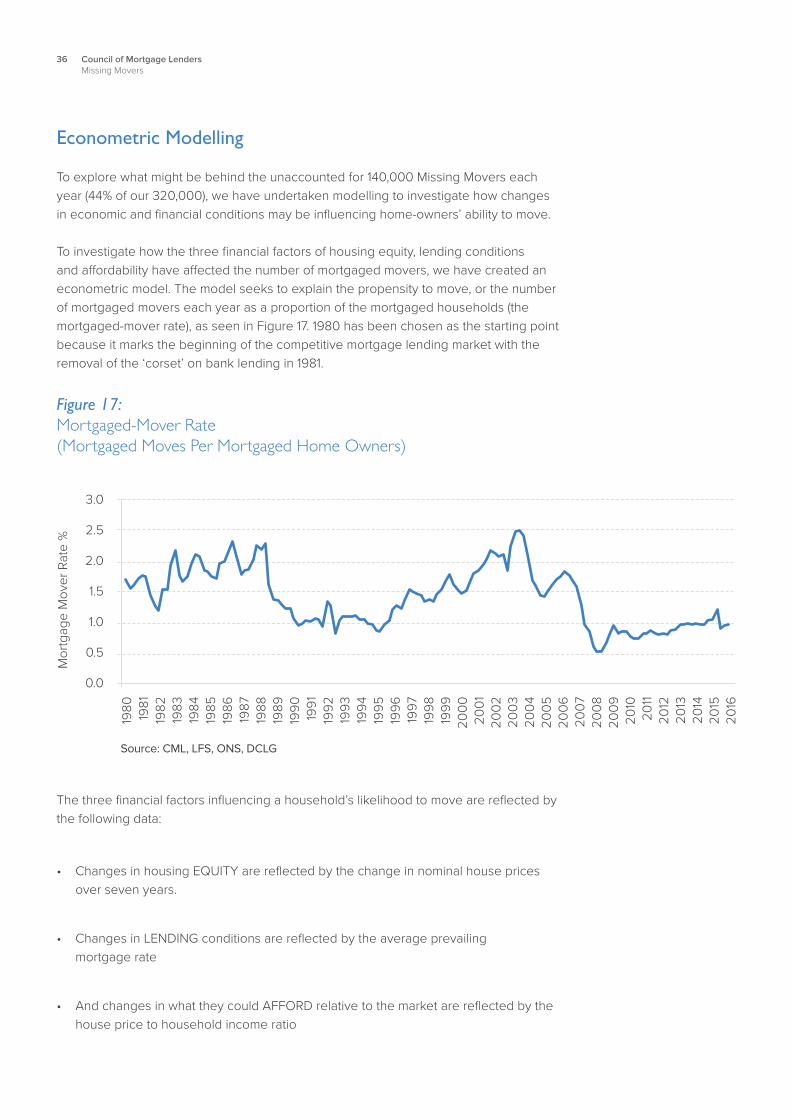
To investigate how the three financial factors of housing equity, lending conditions and affordability have affected the number of mortgaged movers, we have created an econometric model. The model seeks to explain the propensity to move, or the number of mortgaged movers each year as a proportion of the mortgaged households (the mortgaged-mover rate), as seen in Figure 17. 1980 has been chosen as the starting point because it marks the beginning of the competitive mortgage lending market with the removal of the ‘corset’ on bank lending in 1981.
The three financial factors influencing a household’s likelihood to move are reflected by the following data:
• Changes in housing EQUITY are reflected by the change in nominal house prices over seven years.
• Changes in LENDING conditions are reflected by the average prevailing mortgage rate
• And changes in what they could AFFORD relative to the market are reflected by the house price to household income ratio
Figure 17: Mortgaged-Mover Rate (Mortgaged Moves Per Mortgaged Home Owners)
Source: CML, LFS, ONS, DCLG
3.0
2.5
2.0
1.5
1.0
0.5
0.0
Mor
tgag
e M
over
Rat
e %
1980 1981
1982
1983
1984
1985
1986
1987
1988
1989
1990 1991
1992
1993
1994
1995
1996
1997
1998
1999
2000
2001
2002
2003
2004
2005
2006
2007
2008
2009
2010
2011
2012
2013
2014
2015
2016
37Council of Mortgage LendersMissing Movers
We have also included an additional variable based on the change in real house prices over one year, to reflect changes in consumer sentiment. If prices are rising, households also tend to be more confident and more willing to move. If prices fall, transactions dip. This offsets what might otherwise be a sharper price fall and explains to some extent the stickiness of prices in a downturnviii. Basically, buyers are reluctant to sell at an actual or perceived loss against what they believe their house should be worth.
The housing EQUITY built up by households since they first bought their home is represented by the changes in long-term nominal house prices. Through testing of different time periods, seven years was found to be the best indicator for the model.
Mortgage LENDING conditions are represented by the average mortgage rate. The mortgage rate is adjusted for Mortgage Interest Relief At Source (MIRAS) prior to 2000. This acts as a counterbalance to affordability. For example, if house prices are high relative to incomes but mortgage rates are low then households’ mortgage repayments may be similar to households’ repayments if house prices were lower relative to incomes but mortgage rates were higher.
What households can AFFORD to buy is reflected in the model by the house price to household income ratio. As house prices rise relative to incomes, a prospective mover will need more equity, a larger mortgage, or both to move to a higher-value home.
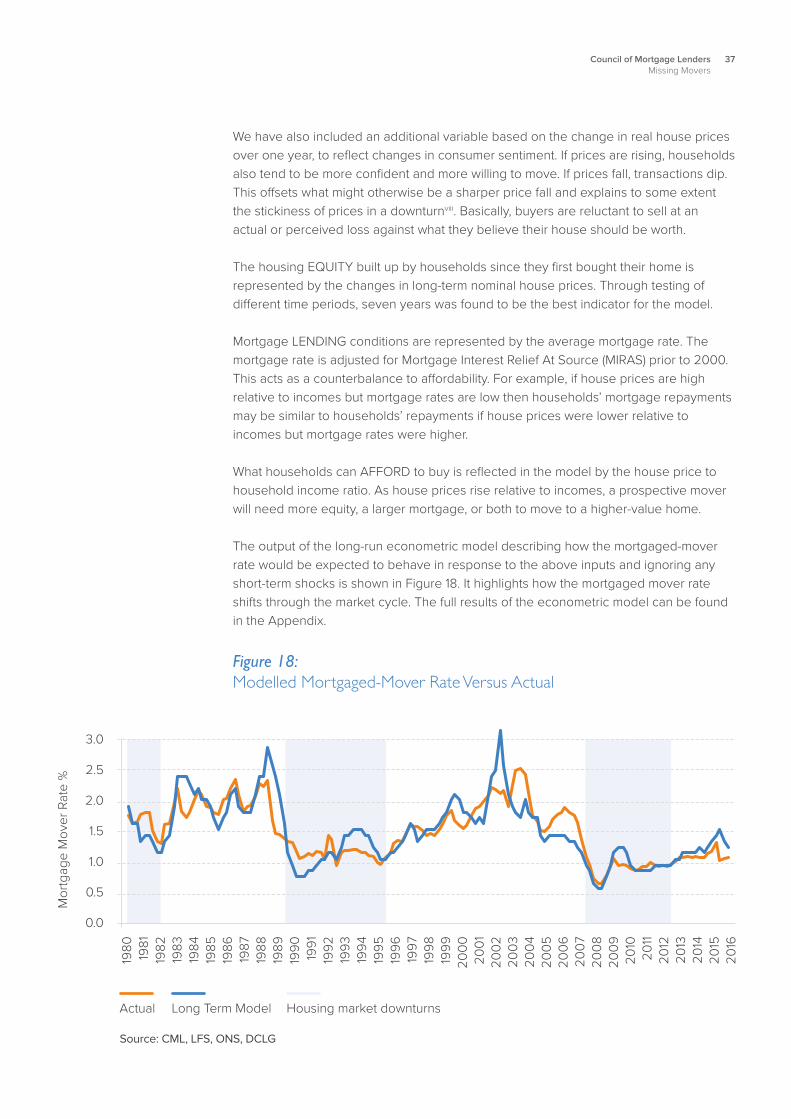
The output of the long-run econometric model describing how the mortgaged-mover rate would be expected to behave in response to the above inputs and ignoring any short-term shocks is shown in Figure 18. It highlights how the mortgaged mover rate shifts through the market cycle. The full results of the econometric model can be found in the Appendix.
Figure 18: Modelled Mortgaged-Mover Rate Versus Actual
Source: CML, LFS, ONS, DCLG
3.0
2.5
2.0
1.5
1.0
0.5
0.0
Mor
tgag
e M
over
Rat
e %
1980 1981
1982
1983
1984
1985
1986
1987
1988
1989
1990 1991
1992
1993
1994
1995
1996
1997
1998
1999
2000
2001
2002
2003
2004
2005
2006
2007
2008
2009
2010
2011
2012
2013
2014
2015
2016
Actual Long Term Model Housing market downturns

38 Council of Mortgage LendersMissing Movers
The long-run version of the model can be used to describe how the mortgaged-mover rate behaves over the course of a housing market cycle:
During a housing bust, falls in house prices ease affordability. The affordability is often further eased as central banks tend to cut interest rates in an economic downturn. This should lead to an increase in mortgaged movers, but the fall in house prices also reduces households’ housing equity, lenders’ risk appetite and hits short-term sentiment. The mortgaged-mover rate falls.
As the economy recovers and incomes start to rise, house prices rise again and home-owners’ housing equity increases. The return of economic confidence and growth in housing equity will reach a point where households become more inclined to move. There is evidence to suggest that households are more likely to move once the value of their home is back above the value they paid or re-mortgaged it forix. With the recovery in prices, the mortgaged mover rate begins to rise and continues to rise as house prices grow.
However, there is the risk that excessive house-price growth will lead to a fall in the mortgaged mover rate. At certain points in the cycle there might be prolonged periods of potentially unstable equilibrium with increasing unaffordability dampening the mortgaged mover rate while house price growth (and hence equity growth) drives it up. This may continue until the next housing market crash.
The model also shows that in the short-term, the mortgaged mover rate is particularly influenced by changes in the mortgage rate, annual real house-price growth, and previous changes in the mortgaged-mover rate. The results from the long-run model suggest that the fall in households’ housing equity has been the most important factor supressing the mortgaged-mover rate since the downturn. The improvement in affordability and decline in mortgage rates since the market peak would be expected to increase the rate. However, their improvement is out-weighed by effect of the fall in households’ housing equity.
We tested other factors in the model. But they were found not to be important drivers of the mortgaged-mover rate. These included unemployment, the stock of private housing, the share of population aged under 50 years old and the impact of Stamp Duty Land Tax. Stamp Duty was perhaps the most surprising exclusion, but its lack of effect may reflect how it was included in the model.
39Council of Mortgage LendersMissing Movers
Second Steppers’ Available Budget
The econometric modelling pinpoints housing equity as the key driver of the low mortgaged-mover rate since the recession. To understand in more detail how market conditions influence housing equity, we also created a simple model that proxies housing equity and borrowing capacity for second steppers by age cohort.
Using age distributions of first-time buyers over time, we can create a distribution across years for when different age cohorts first bought a home. By modelling the change in market conditions since buying, we can first estimate how housing equity changes over time for each cohort and secondly how changes in mortgage lending conditions affected their borrowing capacity. For simplicity, the model does not account for any further moves or re-mortgages. It is therefore only indicative of the available budget of potential second steppers (the first mortgaged move).
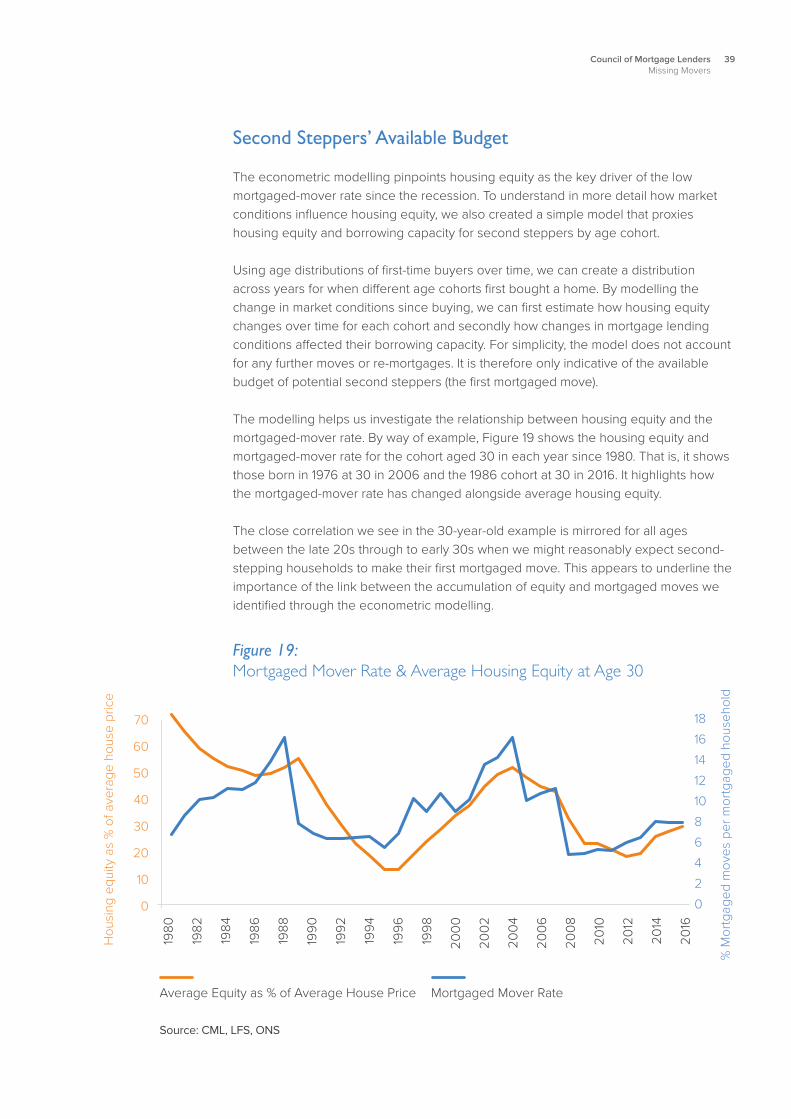
The modelling helps us investigate the relationship between housing equity and the mortgaged-mover rate. By way of example, Figure 19 shows the housing equity and mortgaged-mover rate for the cohort aged 30 in each year since 1980. That is, it shows those born in 1976 at 30 in 2006 and the 1986 cohort at 30 in 2016. It highlights how the mortgaged-mover rate has changed alongside average housing equity.
The close correlation we see in the 30-year-old example is mirrored for all ages between the late 20s through to early 30s when we might reasonably expect second-stepping households to make their first mortgaged move. This appears to underline the importance of the link between the accumulation of equity and mortgaged moves we identified through the econometric modelling.
Figure 19: Mortgaged Mover Rate & Average Housing Equity at Age 30
Source: CML, LFS, ONS
70
60
50
40
30
20
10
0
Hou
sing
equ
ity a
s %
of a
vera
ge h
ouse
pric
e
Average Equity as % of Average House Price Mortgaged Mover Rate
1980
1982
1984
1986
1988
1990
1992
1994
1996
1998
2000
2002
2004
2006
2008
2010
2012
2014
2016
18
16
14
12
10
8
6
4
2
0
% M
ortg
aged
mov
es p
er m
ortg
aged
hou
seho
ld
40 Council of Mortgage LendersMissing Movers
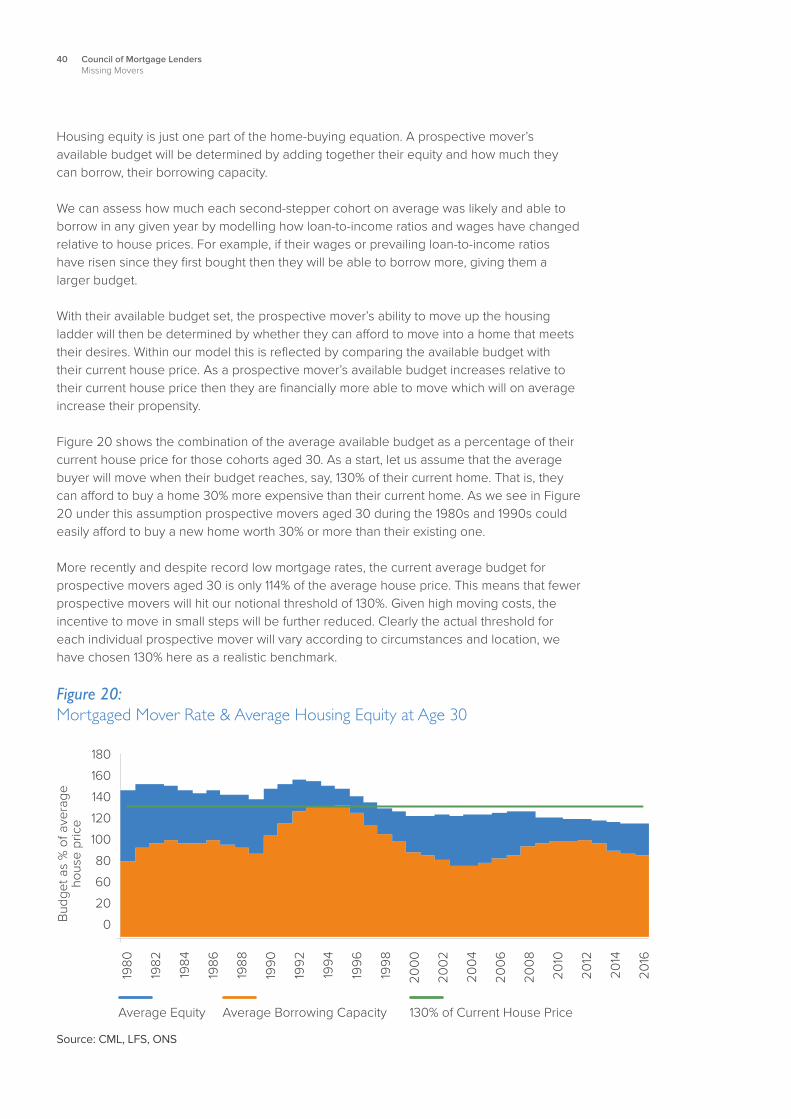
Housing equity is just one part of the home-buying equation. A prospective mover’s available budget will be determined by adding together their equity and how much they can borrow, their borrowing capacity.
We can assess how much each second-stepper cohort on average was likely and able to borrow in any given year by modelling how loan-to-income ratios and wages have changed relative to house prices. For example, if their wages or prevailing loan-to-income ratios have risen since they first bought then they will be able to borrow more, giving them a larger budget.
With their available budget set, the prospective mover’s ability to move up the housing ladder will then be determined by whether they can afford to move into a home that meets their desires. Within our model this is reflected by comparing the available budget with their current house price. As a prospective mover’s available budget increases relative to their current house price then they are financially more able to move which will on average increase their propensity.
Figure 20 shows the combination of the average available budget as a percentage of their current house price for those cohorts aged 30. As a start, let us assume that the average buyer will move when their budget reaches, say, 130% of their current home. That is, they can afford to buy a home 30% more expensive than their current home. As we see in Figure 20 under this assumption prospective movers aged 30 during the 1980s and 1990s could easily afford to buy a new home worth 30% or more than their existing one.
More recently and despite record low mortgage rates, the current average budget for prospective movers aged 30 is only 114% of the average house price. This means that fewer prospective movers will hit our notional threshold of 130%. Given high moving costs, the incentive to move in small steps will be further reduced. Clearly the actual threshold for each individual prospective mover will vary according to circumstances and location, we have chosen 130% here as a realistic benchmark.
Figure 20: Mortgaged Mover Rate & Average Housing Equity at Age 30
Source: CML, LFS, ONS
180
160
140
120
100
80
60
20
0Bud
get a
s %
of a
vera
ge
hous
e pr
ice
Average Equity Average Borrowing Capacity
1980
1982
1984
1986
1988
1990
1992
1994
1996
1998
2000
2002
2004
2006
2008
2010
2012
2014
2016
130% of Current House Price
41Council of Mortgage LendersMissing Movers
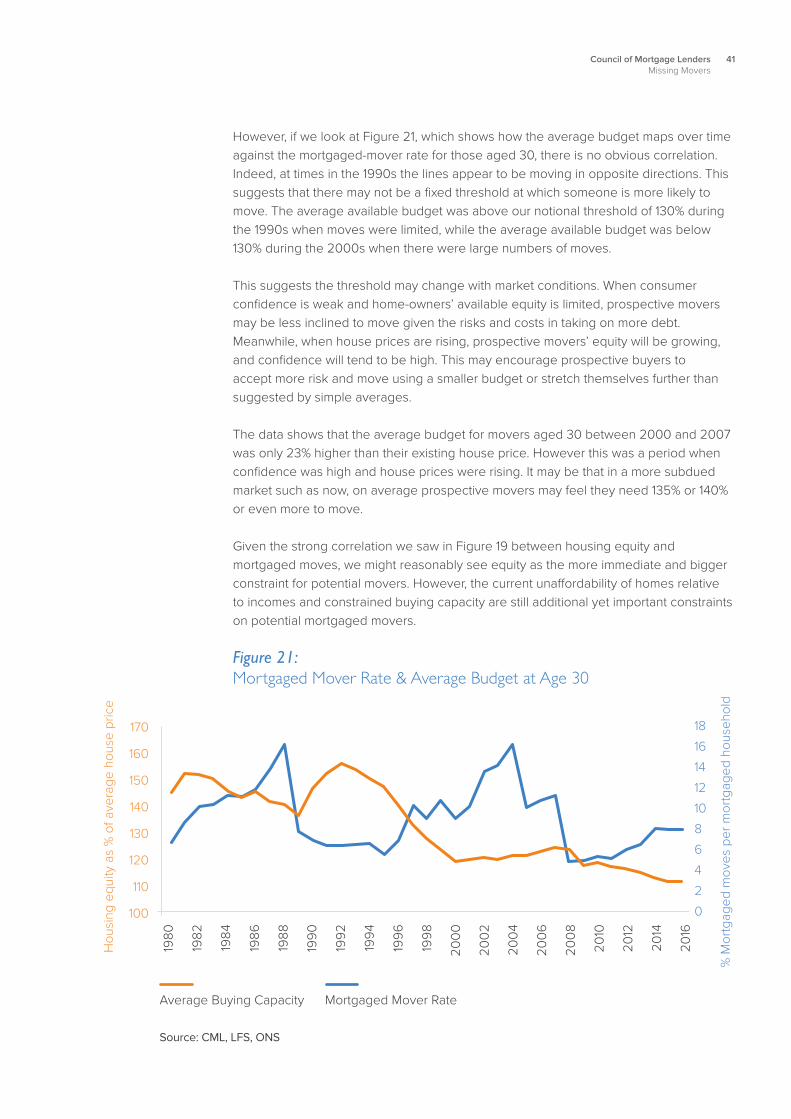
However, if we look at Figure 21, which shows how the average budget maps over time against the mortgaged-mover rate for those aged 30, there is no obvious correlation. Indeed, at times in the 1990s the lines appear to be moving in opposite directions. This suggests that there may not be a fixed threshold at which someone is more likely to move. The average available budget was above our notional threshold of 130% during the 1990s when moves were limited, while the average available budget was below 130% during the 2000s when there were large numbers of moves. This suggests the threshold may change with market conditions. When consumer confidence is weak and home-owners’ available equity is limited, prospective movers may be less inclined to move given the risks and costs in taking on more debt. Meanwhile, when house prices are rising, prospective movers’ equity will be growing, and confidence will tend to be high. This may encourage prospective buyers to accept more risk and move using a smaller budget or stretch themselves further than suggested by simple averages.
The data shows that the average budget for movers aged 30 between 2000 and 2007 was only 23% higher than their existing house price. However this was a period when confidence was high and house prices were rising. It may be that in a more subdued market such as now, on average prospective movers may feel they need 135% or 140% or even more to move.
Given the strong correlation we saw in Figure 19 between housing equity and mortgaged moves, we might reasonably see equity as the more immediate and bigger constraint for potential movers. However, the current unaffordability of homes relative to incomes and constrained buying capacity are still additional yet important constraints on potential mortgaged movers.
Figure 21: Mortgaged Mover Rate & Average Budget at Age 30
Source: CML, LFS, ONS
170
160
150
140
130
120
110
100
Hou
sing
equ
ity a
s %
of a
vera
ge h
ouse
pric
e
1980
1982
1984
1986
1988
1990
1992
1994
1996
1998
2000
2002
2004
2006
2008
2010
2012
2014
2016
18
16
14
12
10
8
6
4
2
0
% M
ortg
aged
mov
es p
er m
ortg
aged
hou
seho
ld
Average Buying Capacity Mortgaged Mover Rate

42 Council of Mortgage LendersMissing Movers
As we’ve shown, understanding the influence of our third factor – what mortgaged home owners can afford to match their desires – presents some difficulty. The reasons for their move become very pertinent. For instance, if having a second or third bedroom is the overriding factor, households can choose to trade space for location if they currently live in a higher price area relative to the one they will accept. They can in effect trade across rather than trade up. Many will also have the choice of improving rather than moving. This is an area that would benefit from more research.
Naturally, within the mix of potential movers there will also be those looking to trading down in value, with or without a mortgage. As the proportion of older home owners has increased, this group is likely to have increased.
Seeking to model such a range of factors with highly limited hard data presents problems. The final decision to move will be highly individual to the household and will be based on a wide range of circumstances and conflicting motivations.
What we do know is that the choices available to prospective mortgaged movers overall will vary with the level of liquidity. The sale of existing homes accounts for about 90% of those traded. It dominates. When mobility falls among householders as a group it reduces the options for prospective buyers and one must assume the likelihood of finding a suitable home to match their budget. This effect of illiquidity will be exacerbated by the formation of chains of buyers, each reliant on each other moving.
We can assume then that our “Afford” factor will produce positive feedback to reinforce changes in housing liquidity.
It is difficult to unpick the numerous reasons for why the mortgaged-mover rate has fallen. However, a key finding from our analysis suggests that the ability of mortgaged home-owners to build equity is the most important factor.
The ability of a mortgaged home-owner to move is affected by housing market and lending conditions. The cost of a mortgage in a high house-price-to-income housing market is eased by low interest rates. But, the high upfront deposit costs and the relative lack of inflation or wage growth implies many buyers will struggle to borrow much more than when they first bought. That means their available funds will purchase a home not that much of a step up from the one they already live in. This will, across the pool of potential movers, reduce the ability and incentive to move.
Beyond these narrow housing market factors there will inevitably be other reasons why mortgaged-home-owners are moving less often. These will include tighter mortgage lending regulation, the shift from interest-only repayments to capital and interest, and other factors not relating to a household’s finances.
43Council of Mortgage LendersMissing Movers
Non-Financial Factors
We noted earlier that there may be non-financial factors causing households to move less often. These may be structural. Technological or cultural changes may, for example, influence the propensity of home-owners to move over time.
While we can use financial, economic and demographic data to suggest how their changing financial circumstances might influence household moves on average, it is much harder to assess the effects of non-financial factors. What finally prompts households to move will ultimately depend on individual responses to a complex mix of factors and choices. While in surveys people might give one main reason for moving, the likelihood is that there will be multiple factors in their equation.
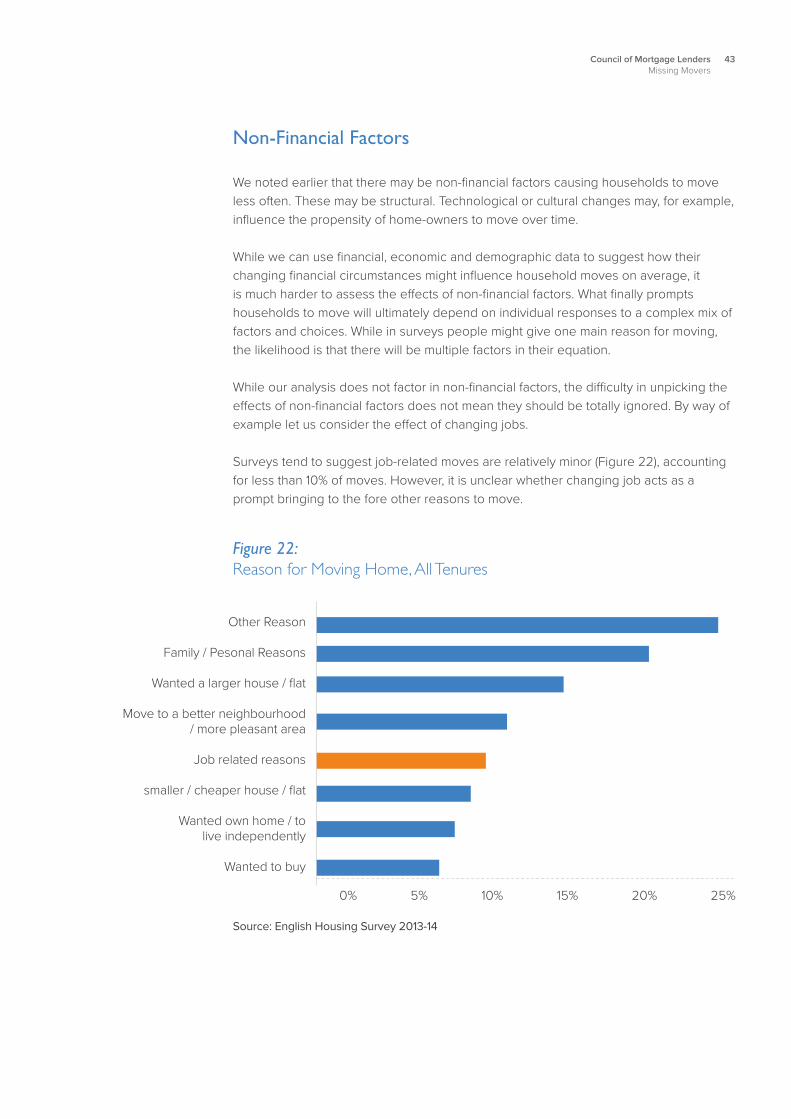
While our analysis does not factor in non-financial factors, the difficulty in unpicking the effects of non-financial factors does not mean they should be totally ignored. By way of example let us consider the effect of changing jobs.
Surveys tend to suggest job-related moves are relatively minor (Figure 22), accounting for less than 10% of moves. However, it is unclear whether changing job acts as a prompt bringing to the fore other reasons to move.
Figure 22: Reason for Moving Home, All Tenures
Other Reason
Family / Pesonal Reasons
Wanted a larger house / flat
Move to a better neighbourhood / more pleasant area
Job related reasons
smaller / cheaper house / flat
Wanted own home / to live independently
Wanted to buy
0% 5%
Source: English Housing Survey 2013-14
10% 15% 20% 25%

44 Council of Mortgage LendersMissing Movers
However, with regard to job-related moves, we know people now commute longer distances than in the past. This metric is tracked. It is fair to assume people’s apparent willingness to commute longer distances to work, or at least live further away from their designated place of work, has a bearing on whether they move home.
On commuting, the data are clear. The number of UK travel to work areas (TTWA) has fallen over time. These are in effect catchment areas for employment. The larger they are, the fewer there will be and the longer commutes will be. The number of TTWAs defined by the Office for National Statistics fell from 308 in 1991 to 226 in 2011, suggesting employment hotspots are drawing people from an ever wider area and people are commuting longer distancesx. ONS found the proportion of UK commuters traveling more than 30 km rose from 8.4% to 9.9% between the 2001 and 2011xi.
Without further data, we don’t know whether people’s preparedness to commute longer distances means they need to move less, or whether the unwillingness or inability to move means commuting longer distances to work. We can assume that, all other factors equal, their need to move home to take up a new job should fall as their “employment catchment area” expands.
Also, strong evidence from the Workforce Employment Relations Study shows that employers are more willing to allow working from home. Indeed, new working practices resulting from technology changes such as high-speed internet and shared access to paperless documentation has spawned more flexible workingxii. In addition to more people working mainly from home, more people are working partly from home, perhaps offsetting longer commute with less frequent commuting. This would reduce one reason to move.
This all points to a changing jobs market either reducing the need to move or facilitating the ability not to move home.
There will be other non-financial factors similarly influencing home moves, both positively and negatively. As we said at the outset, these fall outside our immediate remit, but it is important their potential influence is not ignored. However, as data on their influence would at this stage be unreliable, in the following chapter these external factors will not be included as we consider how the number of mortgaged-movers might change in the future.
4545Council of Mortgage LendersMissing Movers
Chapter 5:What Does the Future Hold in Store?This chapter consider how the number of mortgaged-movers might change in the future
46 Council of Mortgage LendersMissing Movers
Looking Ahead
We have identified the most important drivers behind lower mortgaged movers and how different age cohorts have reacted to changing housing market conditions. Based on these findings, we can consider how the number of mortgaged movers might change in the future.
To recap, these drivers are:
• A fall in the number of and the ageing of mortgaged home-owners.
• A shift to cash-only purchases by some movers, particularly in older age groups, has replaced some mortgaged moves.
• A lower propensity to move among mortgaged home-owners has reduced the number of moves. This is primarily due to lower levels of housing equity and the unaffordability of house prices relative to incomes.
There are of course limits to the reliability of forecasts. Their accuracy rests on the assumptions made. Furthermore, the following forecasts are based on many different data inputs, including the ONS population projections. Each of these inputs has its own range of potential outcomes and uncertainty. It would be surprising if, in ten years’ time, the market exactly matched the forecasts described here.
The use of forecasting, however, help gauge likely outcomes and the probable influence and varying strength of the economic, social, technological or policy changes that shape the housing market. Some of these changes may be controllable, some not. These forecasts, then, should be seen as guidance to help inform choices that might be made to influence outcomes over which we can exercise some control. They are not intended as a prediction of the future.
It is important to note that the ONS 2014 principal population projections have been taken as a starting point for the forecasts. The history of population projections is littered with failures to account for changing trendsxiii and it is quite probable that the 2014 principal projections will fail to accurately reflect the future path of population growth. However, it offers a reasonable starting point given the current uncertainty around the future of population changes in a post-Brexit UK.
The biggest uncertainty in the population projections is likely to be the future trajectory of immigration, specifically net migration. Lower than projected population growth would mean fewer people within the prime first-time buyer age bracket. However, this does not necessarily mean there would be fewer first-time buyers, at least over the short to medium-term.
What Does the Future Hold in Store?
47Council of Mortgage LendersMissing Movers
Analysis of 2011 Census data shows that most recent migrants rent, particularly privately. Only 16% of people born in the EU accession countries that arrived in the UK in the ten years before the census lived in owner-occupied housing. In the event of lower migration, it is quite likely that first-time buyer propensities will increase, reflecting a similar number of first-time buyers but from a lower base population.
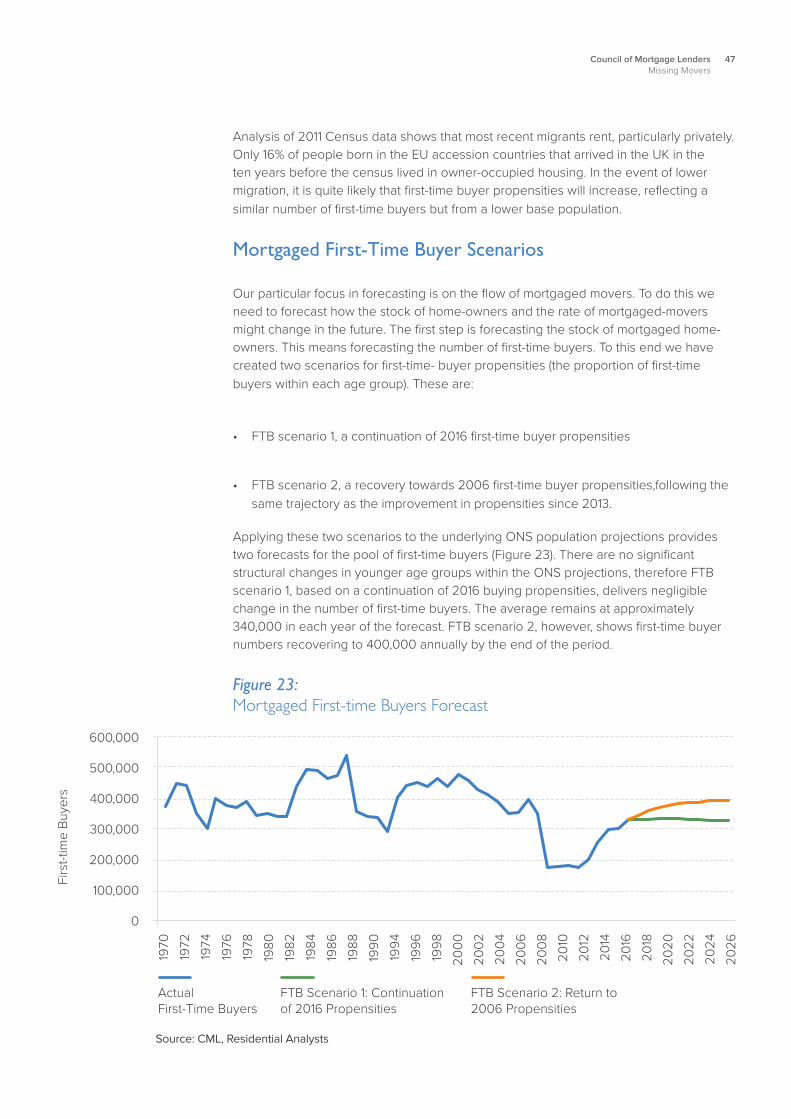
Mortgaged First-Time Buyer Scenarios
Our particular focus in forecasting is on the flow of mortgaged movers. To do this we need to forecast how the stock of home-owners and the rate of mortgaged-movers might change in the future. The first step is forecasting the stock of mortgaged home-owners. This means forecasting the number of first-time buyers. To this end we have created two scenarios for first-time- buyer propensities (the proportion of first-time buyers within each age group). These are:
• FTB scenario 1, a continuation of 2016 first-time buyer propensities
• FTB scenario 2, a recovery towards 2006 first-time buyer propensities,following the same trajectory as the improvement in propensities since 2013.
Applying these two scenarios to the underlying ONS population projections provides two forecasts for the pool of first-time buyers (Figure 23). There are no significant structural changes in younger age groups within the ONS projections, therefore FTB scenario 1, based on a continuation of 2016 buying propensities, delivers negligible change in the number of first-time buyers. The average remains at approximately 340,000 in each year of the forecast. FTB scenario 2, however, shows first-time buyer numbers recovering to 400,000 annually by the end of the period.
Figure 23: Mortgaged First-time Buyers Forecast
Source: CML, Residential Analysts
600,000
500,000
400,000
300,000
200,000
100,000
0
Firs
t-tim
e B
uyer
s
1970
1972
1974
1976
1978
1980
1982
1984
1986
1988
1990
1994
1996
1998
2000
2002
2004
2006
2008
2010
2012
2014
2016
2018
2020
2022
2024
2026
Actual First-Time Buyers
FTB Scenario 1: Continuation of 2016 Propensities
FTB Scenario 2: Return to 2006 Propensities
48 Council of Mortgage LendersMissing Movers
Forecasting Home-Ownership
In assessing the flow of home-movers it is critical first to establish the stock (number) of home-owners. The change in the number of home-owners will be driven by the number of new home-owners and the number ceasing to be home-owners. The main driver of new home-owners will be first-time buyers, for which we have our two scenarios from earlier, and the primary loss of home-owners will be from deaths, particularly those of the elderly.
However, the actual net change in home-owners is more complex. Some, but not all, home-owner deaths directly lead to the sale of a home and one less home-owning household. Some homes pass to the surviving spouse or other family members. The ONS Wealth and Assets Survey shows 50% of inherited properties are sold directly. However, a family member may move into the inherited home leaving another owned home. This will cause the loss of a home-owner. Similarly, where the home is rented it will mean the loss of a home-owner, but for our purposes no relevant residential transaction.
There are other factors to consider. There will be losses through repossession, especially during recessions. Meanwhile divorces, where the divorcees buy separately rather than together, and households returning from periods in other tenures will increase the stock of home-owners above the rate dictated by first-time buyers.
Forecasting for each of these factors individually would be highly complex and may lead to more confusion than clarity. To avoid this, we have created a home-owner ‘loss’ ratio. This ratio accounts for average net change in home-owners by single year of age and is based on historic trends since 1996. It covers the actual mortality of home-owners and all factors affecting the number of home-owners with the exception of first-time buyers. The number of first-time buyers are covered by our two scenarios.
Using the existing number of home-owners from the Labour Force Survey, our two scenarios for first-time buyers, and our home-owner ‘loss’ ratio, we can create two forecasts for the number of home-owners. Figure 24 shows the results of our forecasts. Under our FTB scenario 1, the number of home-owners slowly rises, just reaching the previous peak by the end of the forecast period. Our FTB scenario 2 shows the number of home-owners is forecast to pass the previous peak by 2021 and reach 18.4 million by 2026.
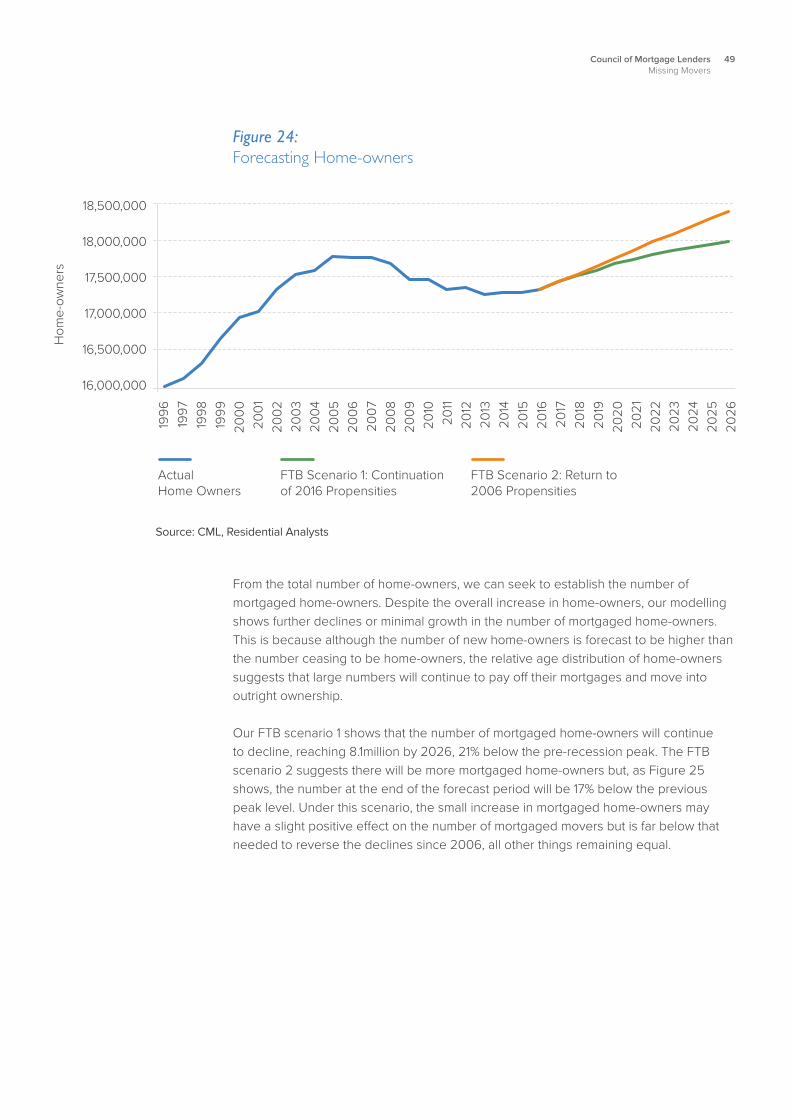
49Council of Mortgage LendersMissing Movers
Figure 24: Forecasting Home-owners
Source: CML, Residential Analysts
Actual Home Owners
FTB Scenario 1: Continuation of 2016 Propensities
FTB Scenario 2: Return to 2006 Propensities
18,500,000
18,000,000
17,500,000
17,000,000
16,500,000
16,000,000
Hom
e-ow
ners
1996
1997
1998
1999
2000
2001
2002
2003
2004
2005
2006
2007
2008
2009
2010
2011
2012
2013
2014
2015
2016
2017
2018
2019
2020
2021
2022
2023
2024
2025
2026
From the total number of home-owners, we can seek to establish the number of mortgaged home-owners. Despite the overall increase in home-owners, our modelling shows further declines or minimal growth in the number of mortgaged home-owners. This is because although the number of new home-owners is forecast to be higher than the number ceasing to be home-owners, the relative age distribution of home-owners suggests that large numbers will continue to pay off their mortgages and move into outright ownership.
Our FTB scenario 1 shows that the number of mortgaged home-owners will continue to decline, reaching 8.1million by 2026, 21% below the pre-recession peak. The FTB scenario 2 suggests there will be more mortgaged home-owners but, as Figure 25 shows, the number at the end of the forecast period will be 17% below the previous peak level. Under this scenario, the small increase in mortgaged home-owners may have a slight positive effect on the number of mortgaged movers but is far below that needed to reverse the declines since 2006, all other things remaining equal.
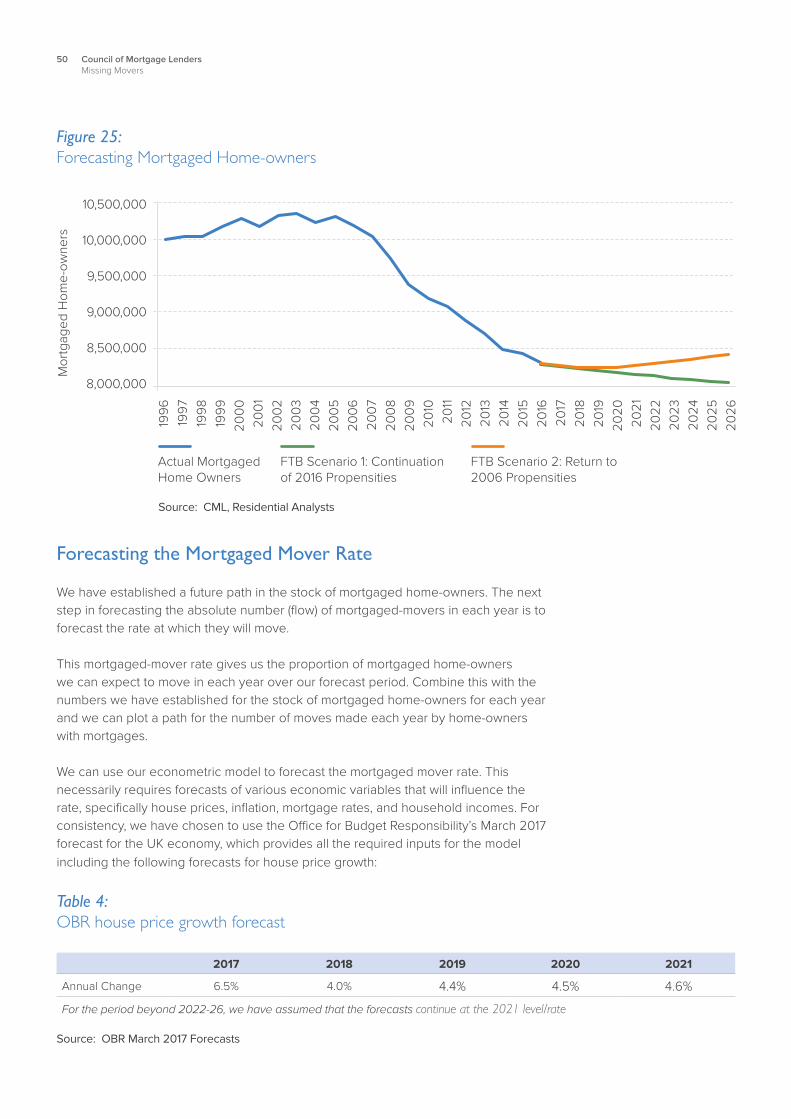
50 Council of Mortgage LendersMissing Movers
Figure 25: Forecasting Mortgaged Home-owners
Source: CML, Residential Analysts
Actual Mortgaged Home Owners
FTB Scenario 1: Continuation of 2016 Propensities
FTB Scenario 2: Return to 2006 Propensities
10,500,000
10,000,000
9,500,000
9,000,000
8,500,000
8,000,000
Mor
tgag
ed H
ome-
owne
rs
1996
1997
1998
1999
2000
2001
2002
2003
2004
2005
2006
2007
2008
2009
2010
2011
2012
2013
2014
2015
2016
2017
2018
2019
2020
2021
2022
2023
2024
2025
2026
Forecasting the Mortgaged Mover Rate
We have established a future path in the stock of mortgaged home-owners. The next step in forecasting the absolute number (flow) of mortgaged-movers in each year is to forecast the rate at which they will move. This mortgaged-mover rate gives us the proportion of mortgaged home-owners we can expect to move in each year over our forecast period. Combine this with the numbers we have established for the stock of mortgaged home-owners for each year and we can plot a path for the number of moves made each year by home-owners with mortgages.
We can use our econometric model to forecast the mortgaged mover rate. This necessarily requires forecasts of various economic variables that will influence the rate, specifically house prices, inflation, mortgage rates, and household incomes. For consistency, we have chosen to use the Office for Budget Responsibility’s March 2017 forecast for the UK economy, which provides all the required inputs for the model including the following forecasts for house price growth:
Table 4: OBR house price growth forecast
2017 2018 2019 2020 2021
Annual Change 6.5% 4.0% 4.4% 4.5% 4.6%
For the period beyond 2022-26, we have assumed that the forecasts continue at the 2021 level/rate
Source: OBR March 2017 Forecasts
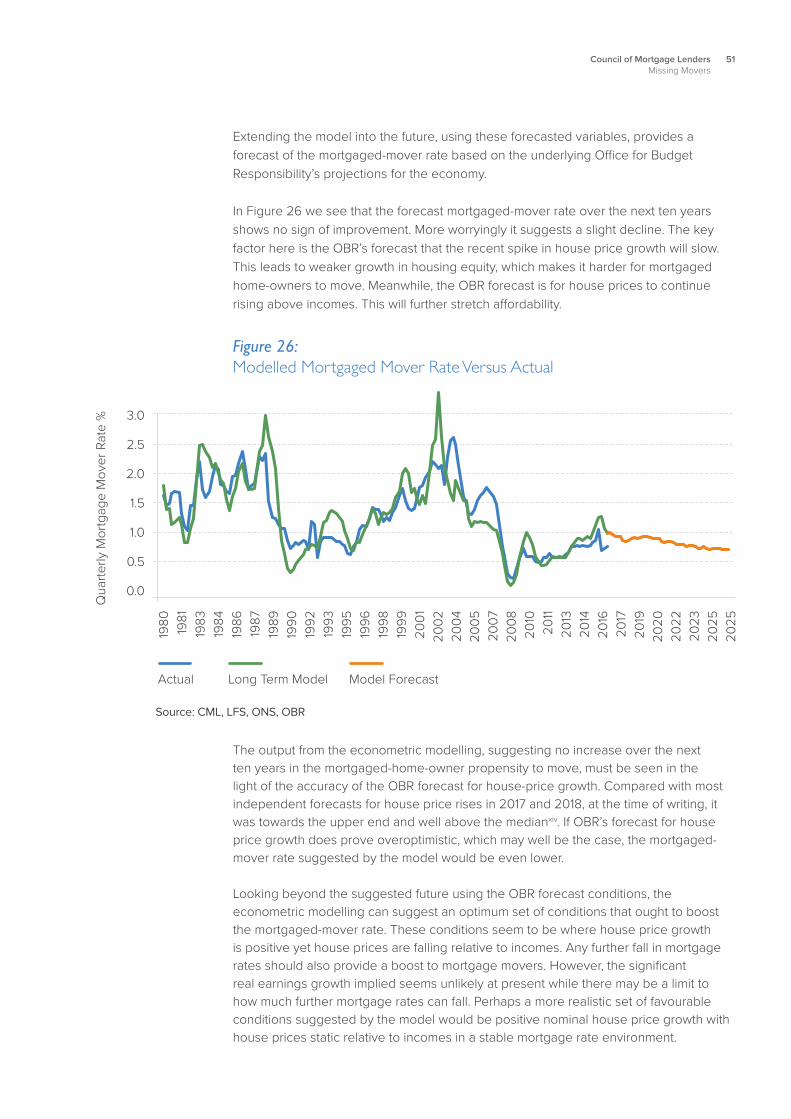
51Council of Mortgage LendersMissing Movers
Extending the model into the future, using these forecasted variables, provides a forecast of the mortgaged-mover rate based on the underlying Office for Budget Responsibility’s projections for the economy.
In Figure 26 we see that the forecast mortgaged-mover rate over the next ten years shows no sign of improvement. More worryingly it suggests a slight decline. The key factor here is the OBR’s forecast that the recent spike in house price growth will slow. This leads to weaker growth in housing equity, which makes it harder for mortgaged home-owners to move. Meanwhile, the OBR forecast is for house prices to continue rising above incomes. This will further stretch affordability.
Figure 26: Modelled Mortgaged Mover Rate Versus Actual
Source: CML, LFS, ONS, OBR
Actual Long Term Model Model Forecast
3.0
2.5
2.0
1.5
1.0
0.5
0.0
Qua
rterly
Mor
tgag
e M
over
Rat
e %
1980 1981
1983
1984
1986
1987
1989
1990
1992
1993
1995
1996
1998
1999
2001
2002
2004
2005
2007
2008
2010
2011
2013
2014
2016
2017
2019
2020
2022
2023
2025
2025
The output from the econometric modelling, suggesting no increase over the next ten years in the mortgaged-home-owner propensity to move, must be seen in the light of the accuracy of the OBR forecast for house-price growth. Compared with most independent forecasts for house price rises in 2017 and 2018, at the time of writing, it was towards the upper end and well above the medianxiv. If OBR’s forecast for house price growth does prove overoptimistic, which may well be the case, the mortgaged-mover rate suggested by the model would be even lower. Looking beyond the suggested future using the OBR forecast conditions, the econometric modelling can suggest an optimum set of conditions that ought to boost the mortgaged-mover rate. These conditions seem to be where house price growth is positive yet house prices are falling relative to incomes. Any further fall in mortgage rates should also provide a boost to mortgage movers. However, the significant real earnings growth implied seems unlikely at present while there may be a limit to how much further mortgage rates can fall. Perhaps a more realistic set of favourable conditions suggested by the model would be positive nominal house price growth with house prices static relative to incomes in a stable mortgage rate environment.
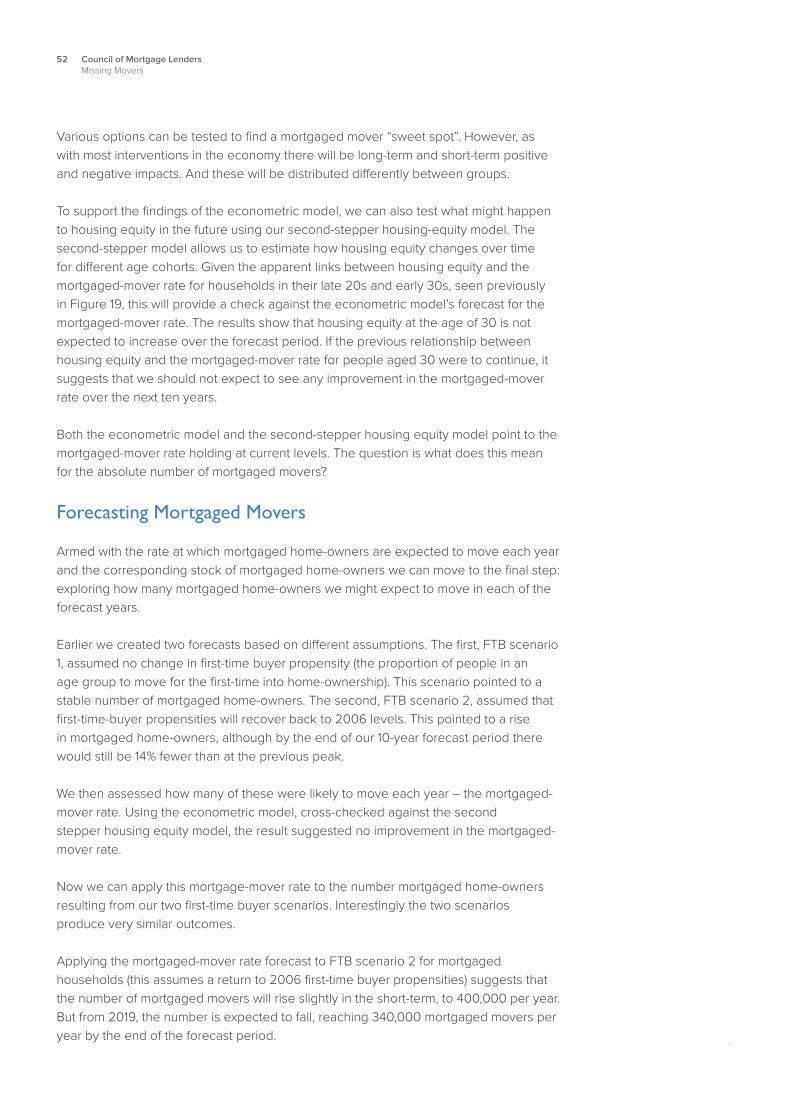
52 Council of Mortgage LendersMissing Movers
Various options can be tested to find a mortgaged mover “sweet spot”. However, as with most interventions in the economy there will be long-term and short-term positive and negative impacts. And these will be distributed differently between groups.
To support the findings of the econometric model, we can also test what might happen to housing equity in the future using our second-stepper housing-equity model. The second-stepper model allows us to estimate how housing equity changes over time for different age cohorts. Given the apparent links between housing equity and the mortgaged-mover rate for households in their late 20s and early 30s, seen previously in Figure 19, this will provide a check against the econometric model’s forecast for the mortgaged-mover rate. The results show that housing equity at the age of 30 is not expected to increase over the forecast period. If the previous relationship between housing equity and the mortgaged-mover rate for people aged 30 were to continue, it suggests that we should not expect to see any improvement in the mortgaged-mover rate over the next ten years. Both the econometric model and the second-stepper housing equity model point to the mortgaged-mover rate holding at current levels. The question is what does this mean for the absolute number of mortgaged movers?
Forecasting Mortgaged Movers
Armed with the rate at which mortgaged home-owners are expected to move each year and the corresponding stock of mortgaged home-owners we can move to the final step: exploring how many mortgaged home-owners we might expect to move in each of the forecast years.
Earlier we created two forecasts based on different assumptions. The first, FTB scenario 1, assumed no change in first-time buyer propensity (the proportion of people in an age group to move for the first-time into home-ownership). This scenario pointed to a stable number of mortgaged home-owners. The second, FTB scenario 2, assumed that first-time-buyer propensities will recover back to 2006 levels. This pointed to a rise in mortgaged home-owners, although by the end of our 10-year forecast period there would still be 14% fewer than at the previous peak.
We then assessed how many of these were likely to move each year – the mortgaged-mover rate. Using the econometric model, cross-checked against the second stepper housing equity model, the result suggested no improvement in the mortgaged-mover rate.
Now we can apply this mortgage-mover rate to the number mortgaged home-owners resulting from our two first-time buyer scenarios. Interestingly the two scenarios produce very similar outcomes.
Applying the mortgaged-mover rate forecast to FTB scenario 2 for mortgaged households (this assumes a return to 2006 first-time buyer propensities) suggests that the number of mortgaged movers will rise slightly in the short-term, to 400,000 per year. But from 2019, the number is expected to fall, reaching 340,000 mortgaged movers per year by the end of the forecast period.
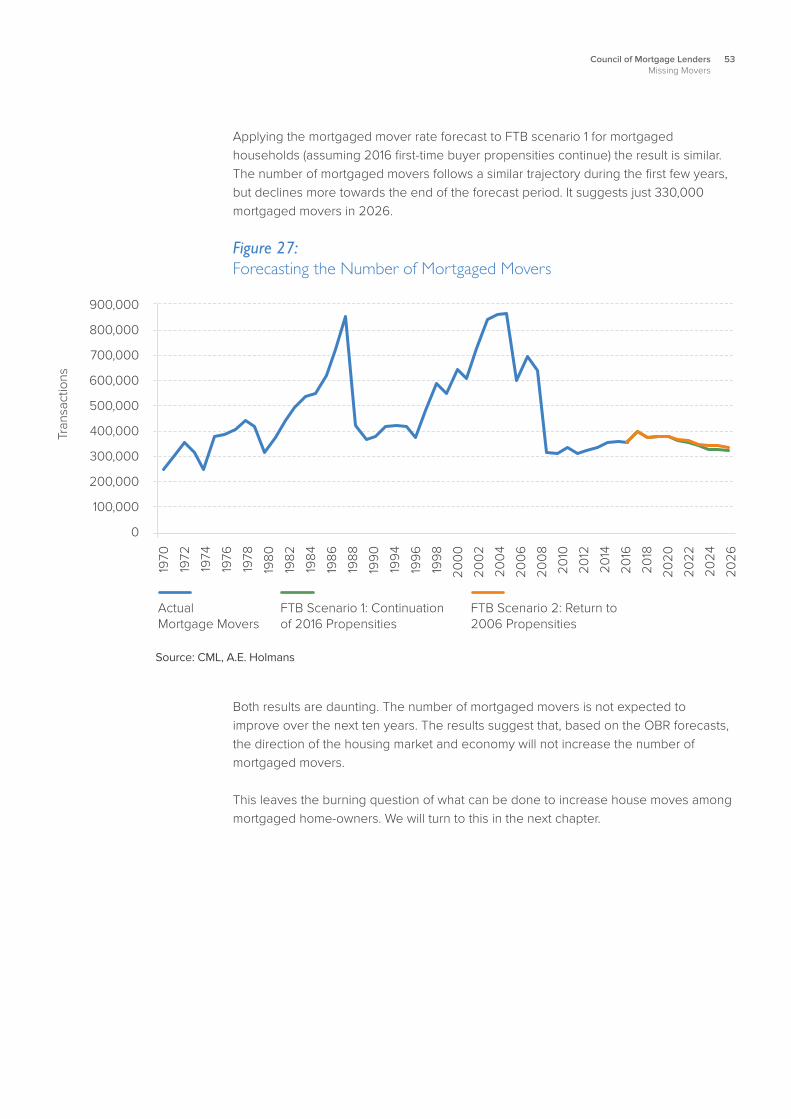
53Council of Mortgage LendersMissing Movers
Applying the mortgaged mover rate forecast to FTB scenario 1 for mortgaged households (assuming 2016 first-time buyer propensities continue) the result is similar. The number of mortgaged movers follows a similar trajectory during the first few years, but declines more towards the end of the forecast period. It suggests just 330,000 mortgaged movers in 2026.
Figure 27: Forecasting the Number of Mortgaged Movers
900,000
800,000
700,000
600,000
500,000
400,000
300,000
200,000
100,000
0
Tran
sact
ions
Source: CML, A.E. Holmans
1970
1972
1974
1976
1978
1980
1982
1984
1986
1988
1990
1994
1996
1998
2000
2002
2004
2006
2008
2010
2012
2014
2016
2018
2020
2022
2024
2026
Actual Mortgage Movers
FTB Scenario 1: Continuation of 2016 Propensities
FTB Scenario 2: Return to 2006 Propensities
Both results are daunting. The number of mortgaged movers is not expected to improve over the next ten years. The results suggest that, based on the OBR forecasts, the direction of the housing market and economy will not increase the number of mortgaged movers.
This leaves the burning question of what can be done to increase house moves among mortgaged home-owners. We will turn to this in the next chapter.

54 Council of Mortgage LendersMissing Movers
Chapter 6:What Can We Do About It?This chapter investigates whether there are any solutions to the low number of mortgaged movers

55Council of Mortgage LendersMissing Movers
Policy Context
House sales plunge in a recession. Rather than prices adjusting as they might in a downturn, people adjust their behaviour. Potential sellers, reluctant to sell at lower prices, choose to stay put – this supports house prices, but at the cost of liquidity.
In the wake of the global financial crisis residential transaction fell very sharply. The problem is they have made such a pallid recovery. A mild bounce back has fizzled out and our analysis found few signs of what might be considered a full recovery ahead.
Turnover of privately-owned homes looks set to remain well below any level seen over the thirty years before the recession. Such low levels of sales are not healthy for the housing market.
Our research points to the lack of mortgaged home movers as the main reason why turnover rates are and have remained low. The fall in mortgage movers accounts for about 80% of the total fall in housing transactions.
In the following pages, we will explore how policy might help lift turnover. Our focus will be on mortgaged households, as they represent the biggest element of the Missing Movers in the market. Furthermore, much of the policy thrust since the recession, and indeed before, has been aimed at lifting the number of first-time buyers. Far less attention has been paid to mortgaged movers.
That said, for a healthy mortgaged mover market a ready supply of first-time buyers is essential. But having bought their first home, as their circumstances change, they need to able to move as freely as possible as mortgaged movers.
The stock of mortgaged home-owners along with the rate at which they move ultimately determines the level of mortgage movers in the market at any one time.
There will be households that move in and out of home-ownership at various points on the housing ladder, but in the main the stock of mortgaged home-owners is supported by the entry of first-time buyers. These new mortgaged households also refresh the stock in that as, being generally younger, they are more likely to move. This slows the reduction in the propensity to move caused by an otherwise ageing pool of mortgage home-owners.
To maintain the pool of mortgaged home-owners, these first-time buyers need to compensate for losses caused by, for example, paying off the mortgage, death, divorce, debt. After decades of rising home-ownership the loss of mortgage home-owners is understandably rising.
There is little policy can do to reduce the attrition of mortgaged households. Meanwhile, the policy package to support first-time buyers is extensive.
What Can We Do About It?

56 Council of Mortgage LendersMissing Movers
So, new levers available to maintain the existing stock of potential mortgaged movers are limited, beyond potentially further measures to encourage first-time buyers.
Given these limitations and the already extensive measures supporting first-time buyers, we will concentrate less on the stock of mortgaged movers and more on the rate at which they move. To do this we will work within our framework of Equity, Lending and Affordability (within which we include Availability at a price).
Some Guiding Principles and Caveats
Before considering policy options it is important to note that, in a complex market such as housing, policies can have unintended or unhelpful side effects, many of which can go unnoticed or ignored for a long while. From our analysis, we know we need to be very cautious about interventions that might:
• Raise the ratio of house prices to incomes
• Encourage people into home-ownership that are ill equipped to move relatively freely as home-owners
• Encourage excessive or unsustainable borrowing
• Increase unhelpful price or affordability differentials between house types, regions or buyer or age groups
That does not mean, for instance, that a policy that temporarily increases house prices relative to incomes should be ignored, rather that it should be considered with caution.
Policies can be more effective if targeted at particular groups rather than at the market as a whole. Our research suggests that within the 320,000 Missing Movers each year that we have referred to throughout this report, the bulk are aged under 50 years old, they live in homes worth less than £300,000, and are typically more likely to be in urban locations or urban fringes. These households tend to be trading up rather than trading across or downsizing.
While policies should not focus solely on these households, those that liberate this group are more likely to be effective in improving the mortgaged-mover rate.
It should also be noted that policies that fix one element of the market may be, or appear to be, the reverse of what is needed elsewhere.
57Council of Mortgage LendersMissing Movers
Equity, Lending, and Affordability
Our research shows that moves are more likely if prospective movers have more equity relative to the price of the home to which they aspire. That means greater equity relative to the “next” house price is key. This can be achieved, either by reducing the price gap between the step up in housing or by increasing the value of equity. So, simplistically, what appears to be wanted is a boost to equity which does not excessively stretch house-price differentials.
Similarly, but to a lesser extent, higher borrowing relative to the price of their target home should increase moves, providing it also does not stretch the price differential between the current home and the desired next home.
Affordability and availability are perhaps more intriguing factors. Moves are more likely if there is greater affordability and availability of housing – that is partly because there is more choice. However, availability (and so the selection of affordable homes open to prospective movers within their budget) increases as more households move. There is a positive feedback. This opens up notions of “kick starting” or “pump priming”.
In addition to increasing the available stock on the market by generating more turnover in the existing stock, the addition of new housing – especially more-desired new homes – would also raise the available stock and act to contain house price rises. Reducing the gap between a prospective mover’s current home and their desired next home relative to the funds they have available would also prompt more moves, as would reducing financial and non-financial disincentives. However, this may be modest and could take decades to have a meaningful effect.
This all seems extremely straightforward and simple and in one sense it is. But the trick is in selecting policies that meet the objectives without causing lasting damage elsewhere in the market. As we will see, interventions to boosting one of equity, lending or affordability might work counter to one or both of the others.
There will also be conflict between short-term and long-term policy, possibly echoing what Sir Mervyn King as Governor of the Bank of England described in 2009 as the “paradox of policy at present – almost any policy measure that is desirable now appears diametrically opposite to the direction in which we need to go in the long term.”XV

58 Council of Mortgage LendersMissing Movers
Support For Mortgaged Movers
Having considered how equity, lending and affordability and availability influence the mover rate among mortgaged home owners, the next step is to consider policies that might stimulate more moves. By initially viewing the three strands in isolation, uninhibited by consideration of any unintended consequences or interconnection and without reference to the broader economic condition, we can see what policy tools might be available.
Boosting Equity
There are various ways in which housing equity might be encouraged to grow faster among mortgaged movers, particularly among first-time buyers entering the market. Assuming a rising market, increasing their leverage through higher loan-to-value lending would see them expand on their initial equity faster. Encouraging buyers into home-ownership at a younger age would provide more time for them to build equity.
Meanwhile, lowering the mortgage rate, shifting interest-only mortgagees to repayment mortgages, or shortening their mortgage term would build equity faster as a higher proportion of payments would go to paying off the loan value, as opposed to interest. In effect this is encouraging saving.
Lowering transaction costs for first-time buyers would mean prompt entry into home-ownership earlier or to enter with more equity. Both ultimately encouraging equity building. Transaction costs could be cut by reducing SDLT or shifting it to the seller rather than buyer or by lower agents’ fees.
Injections of funds through gifts, inheritance or a sponsor, such as the Government or Local Authority, would be another means of building equity. The reality is that this is increasingly happening on an informal basis with the Bank of Mum & Dad.
Clearly policies that reduce the price gap between the home sold by the prospective mortgaged mover and the home sought, relative to income, would promote mobility. In this area progressive land taxes might squeeze down more on higher priced homes than lower priced homes and reduce the level of funds needed to make a move possible.
59Council of Mortgage LendersMissing Movers
Boosting Lending
Relaxing mortgage lending conditions for movers would also facilitate greater mobility among mortgaged home-owners, particularly with regards to MMR and macro-prudential policy. This could be done by:
• Higher loan-to-income multiples
• Higher loan-to-value ratios
• Lower mortgage rates (or reducing the affordability stress rate)
• Longer mortgage terms (incorporating longer working age)
• Switching from repayment to interest-only mortgages
• More flexibility for specific groups
A critical factor in borrowing for a mover is their earnings. So policies that boost earnings growth among mortgaged movers, either generally or as people progress in life would support more moves.
As well as providing a boost to equity, gifts, inheritance or sponsorship would support lending as this would reduce the loan to value needed. This in turn would enable more prospective movers to move.
Restricting other unsecured lending would help would-be buyers borrow more easily as these are taken into account when loan applications are made. Particularly pertinent to first-time buyers would be student loans.
Boosting Affordability and Availability
The most obvious way to make homes more affordable is, by definition, to lower house prices relative to income. This implies policies to restrain house-price growth or boost incomes.
As we have said, more availability and choice would boost opportunities to move. The Bank of England NMG Survey 2015, found the most stated obstacle to moving was inability to find a suitable property.

60 Council of Mortgage LendersMissing Movers
Figure 28: Have You Considered Moving Since the Beginning of 2015?
Yes – but the costs of moving (stamp duty, estate agent and solicitor fees) are too high
Yes – but I haven’t been able to find a suitable property
Yes – but I would not be able to increase my mortgage sufficiently to make it
worthwhile to move
Yes – I’m in the process of moving
Yes – but my current mortgage deal is too good to change
Yes – but my house is worth less than when I bought it
Yes – but I can’t find anyone to buy my house
0% 5%
Source: Bank of England NMG Survey, 2015
10% 15% 20% 25% 30% 35% 40% 45%
Owned Outright Owned With Mortgage
Percentage of positive weighted responses
When it comes to availability building more new home is clearly important and would contribute to liquidity. Clearly building homes in key markets which might prompt more movement would be more effective still. The Bank of England survey found it is outright owners who are most put off by the lack of suitable homes, so this suggests building more retirement, downsizer or custom build.
But new build accounts for about one in every ten homes on the market, so creating more fluidity within the existing stock would seem to offer more scope for boosting movement. While increasing the pool of properties available to buy may increase the probability of potential buyers finding a suitable property to buy, a critical issue is increasingly the likelihood of actual deals completing and reducing the number of failed transactions. One well recognised area of frustration in completing deals, particularly in illiquid markets, is the housing chain. Liquidity itself creates positive feedback in that most home-buyers are also home-sellers.
Policies that might help to break chains might include easier or more favourable bridging loans or part exchange schemes as seen in the new build sector. One informal approach that seems to have grown in popularity is the encouragement of home-owners to hold onto their existing home as a buy-to-let property rather than wait for a suitable home-owner purchase.
61Council of Mortgage LendersMissing Movers
Providing help-to-move support would increase turnover. Given the particular lack of suitable homes for outright owners, who would be older on average and typically a pensioner, it may be that a move is thwarted by lack of funds. Providing tailored equity support might be appropriate, allowing them to move to a better home that provides more appropriate services than one they currently live in. Related to help-to-move support, given that moves generate more moves, incentives to move – temporary or permanent – might stimulate greater liquidity in the mortgaged-mover market. The range of incentives available could include direct positive incentives such as payments or loans, or negative incentives to stay, such as a progressive land or property tax.
One potential policy option which has gained momentum over recent years is land value taxation. This is policy which has remained controversial, but has growing support. The final report of the Mirrlees Review of taxationxvi was explicit. It concluded: “… stamp duty land tax should be abolished and the revenue replaced by part of the housing services tax (for domestic property) and land value tax (for business property).”
The benefits in regard to household moves are strong. In addition to the case made by The Mirrlees Review for the greater fairness of a land value tax, it suggested that the stamp duty defies the most basic of economic principals by taxing transactions. This clearly reduces the propensity to move. Furthermore, the introduction of a land value tax may encourage the more efficient use of the housing stock.
Policy Conflicts and the Broader Economy
The list of possible policy approaches above is far from comprehensive, but it provides an indication not only of the range of possible interventions, but also the inherent conflicts. This is seen starkly in how shifting interest only mortgages to repayment may boost equity building, but reversing the trend would tend to favour the strength of lending.
This highlights the need for policy to be viewed in the round. It must also be viewed within the economic context. That is the context of the prevailing and likely future broader economic environment. The above approaches are framed within the assumption of generally rising house prices. However, whatever mechanisms are adopted to boost equity the broader economic conditions matter greatly and will determine the effectiveness of any policy lever pulled. This makes policy choices conditional on the economic environment.
For instance, high inflation allows for nominal rises in house prices and potentially significant equity building, while in real terms house prices may be falling. This should accommodate a reduction in the house price to earnings ratio without the drop in transactions associated with nominal falls in house prices. The likely cost, however, would be higher interest rates. Conversely deflation where house prices fall but rise in real terms would lead to a squeeze on equity.
62 Council of Mortgage LendersMissing Movers
Inflation would also impact on the spending power of households, with short term effects of lower inflation on general household costs allowing households to spend more on housing. Meanwhile higher inflation would squeeze household budgets and the affordability of borrowing.
Importantly what also emerges from examining policy options is how much less attention has been paid directly to affordability and availability, particularly the impact of movement within the market. There seems far more emphasis placed on moderating or stimulating the market through equity or lending.
This suggests that there may be less directly-related options available to increase movement among mortgaged home-owners through more directly prompting movement itself, particularly given the wider benefits associated with higher liquidity.
Taking this further, given the centrality of housing to other policy areas, not least employment, health, and education, there would appear to be significant scope to look across policy areas for potential synergy, gains from positive externalities and pooling of resources fund incentives or other initiatives. So, by way of example, if there is a recognised financial benefit to the health service of older home-owners living in more suitable housing, there may well be a case to provide incentives to move, which would be covered by the savings on health spending.

6363Council of Mortgage LendersMissing Movers
Chapter 7:Conclusions

64 Council of Mortgage LendersMissing Movers
The turnover of private homes in the UK has fallen dramatically over the past 30 years. This means people are moving far less frequently.
This has potentially serious economic consequences, not least in terms of reduced labour mobility and the healthy function of the housing market. Furthermore, if this reduced mobility is not down to changing preferences among households, but their inability to move, there are also potentially serious social consequences. Increasing number of home-owners may have to stay in homes that no longer suit their needs, unable to move to more appropriate housing.
The bulk of the decline in turnover in privately-owned homes followed two deep recessions. While there will be multifarious factors at play, this very much suggests that economic factors are playing the lead roles. And, our research supports this view.
When we examined the fall in housing transactions to find how different groups were affected by the recent recession, we found significant differences. There were more cash buyers than before the recession. The number of first-time buyers, having plunged, had bounced back strongly. However, mortgaged movers were at half their peak level and there was little sign of the numbers recovering.
The collapse in mortgaged movers accounted for 80% of the overall fall in residential transactions from the pre-recession peak to current levels. We described these 320,000 fewer movers than might be expected annually as Missing Movers and worthy of more detailed examination.
We found much of the 320,000 gap was down to falling numbers of mortgaged home-owners, demographic changes and switches from mortgaged movers to cash buyers. But this left a further group of 140,000 other Missing Movers, which we argue are the result of a reduction in the mortgage-mover rate. Put another way, these represent the fall in the propensity of mortgaged home-owners to move. It is significant, equivalent to almost 40% of the current mortgaged-movers.
That different groups were impacted differently added weight to the argument that economic forces rather than preferences were dominant.
To gain greater insight into the mechanisms at work, we examined the potency of three key market factors that determine the ability of home-owners to move.
• Equity: the housing equity accrued;
• Lending: what could be borrowed;
• Affordability and availability: whether the housing equity plus what can be borrowed supports a “worthwhile” move.
Conclusions
65Council of Mortgage LendersMissing Movers
We found that all three play a part, but it was the amount of housing equity accrued that appeared to dominate the ability to move.
This in many ways helps understand the disparity between the fortunes and prospects of younger and older people in the housing market. Two distinct periods over the past 50 years have in many ways defined the housing market we see today.
Those who bought in the 1960s through to late 1980s saw high inflation and high interest rates. This made buying a home expensive – some argue painful – in terms of mortgage payments. But incomes rose fast easing the burden of mortgage payment, while high inflation eroded the debt in real terms. With house prices rising fast in nominal if not real terms, equity was rapidly accrued.
Those who were home-owners in the period from the 1990s until the crash saw very different economic conditions, characterised by falling inflation and interest rates, along with relatively lax lending criteria. Income growth was lower, but home-owners could borrow and service more debt to buy or move up the housing ladder. Within the context of constrained supply and strongly expanding demand, house prices rose in real terms, quite dramatically and equity was rapidly accrued by those in home-ownership.
However these unique, oddly complementary, twin set of economic conditions have passed.
In some markets, particularly in London and more prosperous parts of southern England, there has been substantial house-price growth and equity building among home-owners. But many people across the country who bought just before or after the recession will have seen little house-price growth and little wage growth. The equity in their homes will have risen slowly by comparison with past years. Some may still own homes worth less than they paid.
Lending conditions have tightened which means there will be more constraint on borrowing than in the years before the recession. And with fewer being sold or built the selection of homes available to prospective buyers has declined.
This all points at little hope for a rise in mortgaged-movers. Our forecasting supports this daunting view. It suggests the flow of mortgaged movers will hold broadly at current levels over the next ten years.
More unsettling still, the options available for boosting movement among those with mortgages are extremely limited. Further, any policy focussed, in isolation, on boosting equity, boosting lending, or boosting affordability and availability risks having negative effects on one or both of the other factors. However, some policies may be more suitable than other. There may be more room for policies targeting the affordability and availability of housing, which have had much less attention than those focussed on equity and lending.
We suggest various avenues for exploration, such as more effort to increase the housing stock and policies to break house-buyers chains. These may take decades to have significant impacts.

66 Council of Mortgage LendersMissing Movers
We also argue that it would be worthwhile looking afresh and more seriously at reforming taxation. The thrust of this would be to cease taxing transactions and introduce a land value tax. This would need considerable thought, particularly with regard to its introduction and any transitional arrangements. While it has been seen as controversial, there is growing support for its introduction and we would add the support of this report.
Using our econometric model to explore an optimum set of conditions that ought to boost the mortgaged-mover rate over the longer term does throw up some prospects. These “optimum” conditions seem to be where house prices rise but at a slower rate than incomes. A further fall in mortgage rates should also provide a boost to mortgaged movers.
However, these conditions seem unlikely with earnings growth constrained and limited scope for further falls in mortgage rates. Perhaps a more realistic set of conditions suggested by the model would be positive nominal house-price growth with house prices static relative to incomes with a stable mortgage rate.
Certainly we are unlikely to see a return to the extraordinary economic conditions that occurred from the 1960s to the early 2000s which saw home-owners building substantial housing equity that in turn facilitated swift ascent of the housing ladder. As things stand, with low growth, low interest rates and high house prices, the typical home-owner is likely to see their equity grow far slower in the future. All other things equal, this will restrain movement among mortgaged movers.
We naturally look to past decades for a normal against which we can benchmark our expectations of the future. It would seem however that the past 50 years in the housing market were in fact “not normal”. Normality may start to take on a very different shape in the future. It is hard to gauge how the dawning of this new normality might shift our perception of the housing ladder and the associated aspirations and expectations and how households will adapt.
As always, more work needs to be done to investigate the implications of lower mobility among mortgaged households on the housing market as a whole. But it would seem likely from our findings that those charged with forming housing policy face some very tough questions, with few if any immediately obvious or easy answers.
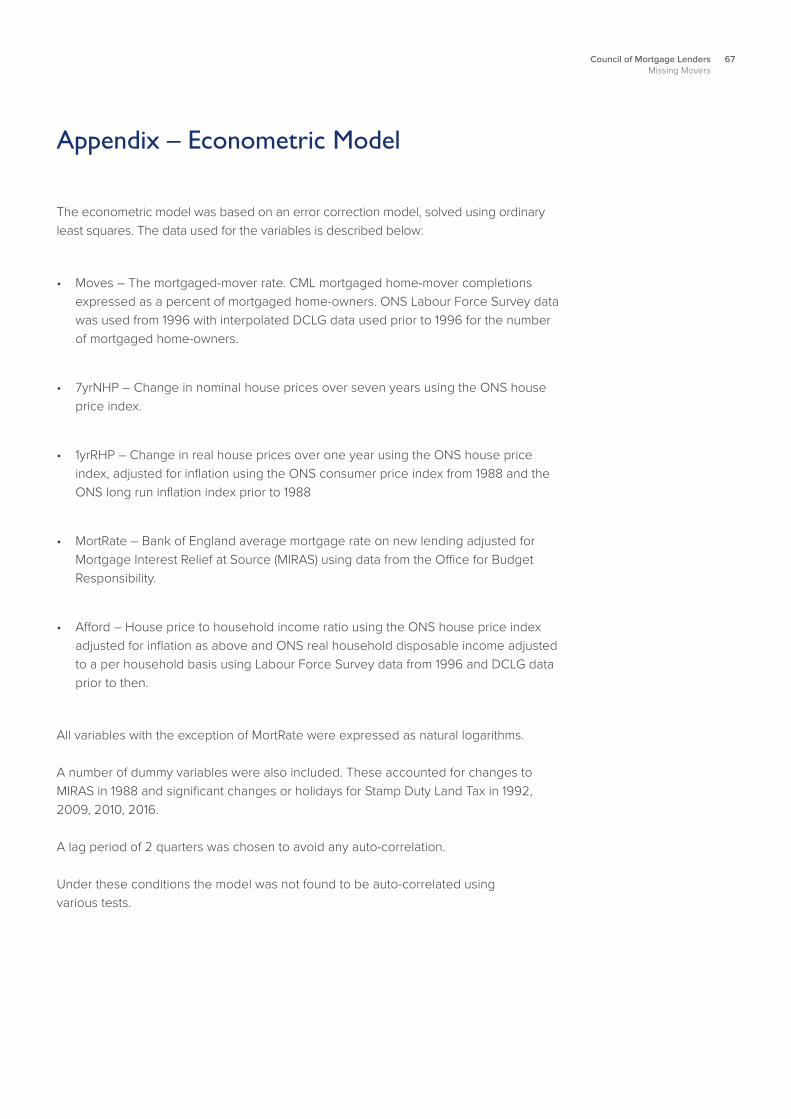
67Council of Mortgage LendersMissing Movers
Appendix – Econometric Model
The econometric model was based on an error correction model, solved using ordinary least squares. The data used for the variables is described below:
• Moves – The mortgaged-mover rate. CML mortgaged home-mover completions expressed as a percent of mortgaged home-owners. ONS Labour Force Survey data was used from 1996 with interpolated DCLG data used prior to 1996 for the number of mortgaged home-owners.
• 7yrNHP – Change in nominal house prices over seven years using the ONS house price index.
• 1yrRHP – Change in real house prices over one year using the ONS house price index, adjusted for inflation using the ONS consumer price index from 1988 and the ONS long run inflation index prior to 1988
• MortRate – Bank of England average mortgage rate on new lending adjusted for Mortgage Interest Relief at Source (MIRAS) using data from the Office for Budget Responsibility.
• Afford – House price to household income ratio using the ONS house price index adjusted for inflation as above and ONS real household disposable income adjusted to a per household basis using Labour Force Survey data from 1996 and DCLG data prior to then.
All variables with the exception of MortRate were expressed as natural logarithms.
A number of dummy variables were also included. These accounted for changes to MIRAS in 1988 and significant changes or holidays for Stamp Duty Land Tax in 1992, 2009, 2010, 2016.
A lag period of 2 quarters was chosen to avoid any auto-correlation.
Under these conditions the model was not found to be auto-correlated using various tests.

68 Council of Mortgage LendersMissing Movers
Coefficient t-ratio p-value
Lag-Moves −0.20 −4.74 <0.0001
Lag-7yrNHP 0.15 3.66 0.0004
Lag-1yrRHP 0.70 5.11 <0.0001
Lag-MortRate −1.77 −3.53 0.0006
Lag-Afford −0.19 −5.09 <0.0001
Diff-MortRate −8.5 −6.41 <0.0001
Diff-MortRate1 −3.5 −2.50 0.0138
Diff-MortRate2 4.8 3.23 0.0016
Diff-1yrRHP 1.5 6.44 <0.0001
Diff-1yrRHP1 0.53 2.14 0.0346
Diff-1yrRHP2 −1.16 −5.20 <0.0001
Lag-Moves2 0.19 2.83 0.0054
Constant −0.62 −3.39 0.0009
Adjusted R-squared 0.682
Standard Error of regression 0.059
69Council of Mortgage LendersMissing Movers
Endnotes
i FSA (2005) DTZ Consulting & Research, Housing, Economic Development and Productivity: Literature Review, January 2006
ii https://www.oecd.org/economy/growth/46941804.pdf
iii Home improvers of Great Britain 2017, Barbour ABI, April 2017
iv http://pdf.savills.com/documents/2015_04_22_Housing_Delivery.pdf
v http://pdf.savills.com/documents/2015_02_27_First_Time_Buyer_Affordability.pdf
vi http://resi-analysts.com/2017/01/16/housing-tenure-cohorts/
vii https://www.ons.gov.uk/peoplepopulationandcommunity/populationandmigration/populationestimates/articles/overviewoftheukpopulation/mar2017
viii Genesove & Mayer: Loss Aversion and Seller Behavior: Evidence from the Housing Market, National Bureau of Economic Research, March 2001
ix https://bankunderground.co.uk/2017/01/20/history-dependence-in-the-housing-market/
x Travel to Work Areas, December 2015, Mike Coombes, Newcastle University and Office for National Statistics
xi https://www.ons.gov.uk/employmentandlabourmarket/peopleinwork/employmentandemployeetypes/articles/commutingtoworkchangestotraveltoworkareas/2001to2011
xii https://www.gov.uk/government/collections/workplace-employment-relations-study-wers
xiii http://webarchive.nationalarchives.gov.uk/20160105160709/http://www.ons.gov.uk/ons/guide-method/method-quality/specific/population-and-migration/population-projections/national-population-projections-accuracy-report.pdf
xiv https://www.gov.uk/government/uploads/system/uploads/attachment_data/file/609054/Forecasts_UK_Economy_April_2017.pdf
xvi http://www.bankofengland.co.uk/archive/Documents/historicpubs/speeches/2009/speech372.pdf
xvi Tax by Design, the final report from the Mirrlees Review, 2011 https://www.ifs.org.uk/publications/5353

Council of Mortgage LendersNorth West WingBush HouseAldwychLondon WC2B 4PJ
Tel: 0845 373 6771
The Council of Mortgage Lenders
The Council of Mortgage Lenders (CML) is the trade association representing the mortgage industry. Its members comprise banks, building societies, insurance companies and other specialist residential mortgage lenders, which together represent around 98% of the UK mortgage assets.
© Copyright 2017 Council of Mortgage Lenders.
www.cml.org.uk
ISBN 978-1-905257-19-5