MINUTES Meeting of the Investment Committee State … · 2019-10-22 · MINUTES . Meeting of the...
235
MINUTES Meeting of the Investment Committee of the Board of Trustees of the State Universities Retirement System September 12-13, 2019, 12:30 p.m. State Universities Retirement System Main Conference Room 1901 Fox Dr., Champaign, Illinois 61820 The following trustees were present: Mr. Aaron Ammons, Mr. John Atkinson, Mr. Richard Figueroa, Ms. Jamie-Clare Flaherty, Dr. Fred Giertz, Mr. John Lyons, Dr. Steven Rock, Mr. Collin Van Meter, Mr. Antonio Vasquez and Mr. Mitch Vogel. Others present: Mr. Martin Noven, Executive Director; Mr. Doug Wesley, Chief Investment Officer (CIO); Ms. Ellen Hung, Deputy CIO; Ms. Kimberly Pollitt, Mr. Joe Duncan and Mr. Shane Willoughby, Senior Investment Officers; Mr. Alex Ramos and Mr. Brian DeLoriea, Investment Officers; Ms. Kelly Valle and Mr. Akshay Patel, Investment Analysts; Ms. Bianca Green, General Counsel; Ms. Kristen Houch, Head of Legislative Affairs; Ms. Kelly Carson and Ms. Annette Ackerman, Executive Assistants; Mr. Neil Rue, Mr. Colin Bebee and Mr. Brandon Ross of Meketa; Mr. Anton Briton of Northern Trust; and Ms. Anna Willis and Ms. Courteney Keatinge of Glass Lewis. Investment Committee roll call attendance was taken. Trustee Vasquez, Chair, present; Trustee Ammons, present; Trustee Figueroa, present; Trustee Giertz, present; Trustee Rock, absent and Trustee Van Meter, present. Trustee Rock physically joined the meeting at 12:36 p.m. APPROVAL OF MINUTES Trustee Vasquez presented the minutes from the Investment Committee meeting of June 6, 2019. Trustee Ammons made the following motion: • That the minutes from the June 6, 2019 Investment Committee meeting be approved as presented. Trustee Van Meter seconded and the motion carried with all trustees present voting in favor. Trustee Giertz made the following motion: • That the closed session minutes from the June 6, 2019 Investment Committee meeting be approved as presented and remain closed. Trustee Rock seconded and the motion carried with all trustees present voting in favor.
Transcript of MINUTES Meeting of the Investment Committee State … · 2019-10-22 · MINUTES . Meeting of the...

MINUTES
Meeting of the Investment Committee of the Board of Trustees of the
State Universities Retirement System September 12-13, 2019, 12:30 p.m.
State Universities Retirement System Main Conference Room
1901 Fox Dr., Champaign, Illinois 61820 The following trustees were present: Mr. Aaron Ammons, Mr. John Atkinson, Mr. Richard Figueroa, Ms. Jamie-Clare Flaherty, Dr. Fred Giertz, Mr. John Lyons, Dr. Steven Rock, Mr. Collin Van Meter, Mr. Antonio Vasquez and Mr. Mitch Vogel. Others present: Mr. Martin Noven, Executive Director; Mr. Doug Wesley, Chief Investment Officer (CIO); Ms. Ellen Hung, Deputy CIO; Ms. Kimberly Pollitt, Mr. Joe Duncan and Mr. Shane Willoughby, Senior Investment Officers; Mr. Alex Ramos and Mr. Brian DeLoriea, Investment Officers; Ms. Kelly Valle and Mr. Akshay Patel, Investment Analysts; Ms. Bianca Green, General Counsel; Ms. Kristen Houch, Head of Legislative Affairs; Ms. Kelly Carson and Ms. Annette Ackerman, Executive Assistants; Mr. Neil Rue, Mr. Colin Bebee and Mr. Brandon Ross of Meketa; Mr. Anton Briton of Northern Trust; and Ms. Anna Willis and Ms. Courteney Keatinge of Glass Lewis. Investment Committee roll call attendance was taken. Trustee Vasquez, Chair, present; Trustee Ammons, present; Trustee Figueroa, present; Trustee Giertz, present; Trustee Rock, absent and Trustee Van Meter, present. Trustee Rock physically joined the meeting at 12:36 p.m.
APPROVAL OF MINUTES
Trustee Vasquez presented the minutes from the Investment Committee meeting of June 6, 2019. Trustee Ammons made the following motion:
• That the minutes from the June 6, 2019 Investment Committee meeting be approved as presented.
Trustee Van Meter seconded and the motion carried with all trustees present voting in favor. Trustee Giertz made the following motion:
• That the closed session minutes from the June 6, 2019 Investment Committee meeting be approved as presented and remain closed.
Trustee Rock seconded and the motion carried with all trustees present voting in favor.

Copies of staff’s memorandums titled “Investment Contracts Approved” and “Report from the June 2019 Investment Committee Meeting” are incorporated as part of these minutes as Exhibit 1 and Exhibit 2.
CHAIRPERSON’S REPORT Trustee Vasquez stated that he will attend the CII event in Minneapolis and an ESG event in Chicago the week of September 15, 2019. He also reminded trustees of a few upcoming investment events, if interested.
CHIEF INVESTMENT OFFICER REPORT Mr. Wesley provided an update on the fixed income restructuring that was approved during the June 2019 board meeting. Staff and the consultant completed the majority of contract negotiations. Staff retained a transition manager to coordinate the restructuring that was completed in early September. Mr. Wesley provided an update on the transition management contract with Loop Capital Markets (Loop). SURS’ external counsel provided a formal legal opinion that Loop cannot serve as a transition manager for SURS because they are not registered under the Federal Investment Advisers Act of 1940. Staff will discuss this opinion with Loop and terminate the contract. Finally, Mr. Wesley commented on the SURS inaugural Diverse Manager Week. SURS investment staff conducted one-hour meetings with 29 firms across different asset classes during the week of August 5, 2019. Representatives from Meketa, Callan, Progress and TorreyCove also attended relative to their specific asset classes.
CORPORATE GOVERNANCE OVERVIEW
Ms. Valle presented a historical review of Corporate Governance initiatives and discussed SURS’ current proxy voting standards and guidelines. Ms. Valle then introduced Ms. Anna Willis and Ms. Courteney Keatinge of Glass Lewis who provided a policy overview. Ms. Keatinge discussed the current proxy voting process, the management and shareholder proposals and SURS’ voting policy. She also addressed questions posed from the board. A copy of SURS memorandum titled “Corporate Governance Update” and the 2019 CII Conference Agenda are incorporated as part of these minutes as Exhibit 3 and Exhibit 4. The Glass Lewis Presentation titled “2019 Proxy Season Review” is incorporated as part of these minutes as Exhibit 5.
CLOSED SESSION
Trustee Van Meter moved that the Investment Committee go into closed session pursuant to §2(c)(7) of the Open Meetings Act to consider the sale or purchase of securities or investments or to consider an investment contract. Trustee Figueroa seconded and the motion carried in a roll call vote:
Trustee Ammons - aye Trustee Figueroa - aye Trustee Giertz - aye Trustee Rock - aye Trustee Van Meter - aye Trustee Vasquez - aye

RETURN TO OPEN SESSION
Upon a motion by Trustee Van Meter, seconded by Trustee Rock, the motion carried and the Investment Committee resumed its meeting in open session. Trustee Rock made the following motion:
• That based on the recommendation of SURS staff and Meketa, the Investment Committee approve retaining Aspect Capital, Campbell and Company, and LongTail Alpha, subject to successful contract negotiations.
Trustee Flaherty seconded and the motion carried with all trustees present voting in favor.
CONSIDERATION OF TRADITIONAL GROWTH INVESTMENT POLICY UPDATES
Meketa consultant, Mr. Rue, summarized the recently approved changes to the long-term investment strategy while also recognizing the policy decisions approved by the board. Mr. Rue explained that in order to continue the implementation process that incorporates the board’s prior directions to formalize and structure the Traditional Growth components of SURS’ newly created Broad Growth class; it is recommended that the Investment Committee approve the proposed changes to the Investment Policy. Trustee Van Meter made the following motion:
• That based on the recommendation of SURS staff and Meketa, the Investment Committee approve the revised defined benefit plan Investment Policy, as presented.
Trustee Ammons seconded and the motion carried with all trustees present voting in favor. The Meketa memorandum titled “09-2019 IPS Update Memo” is incorporated as part of these minutes as Exhibit 6.
CLOSED SESSION
Trustee Ammons moved that the Investment Committee go into closed session pursuant to §2(c)(7) of the Open Meetings Act to consider the sale or purchase of securities or investments or to consider an investment contract. Trustee Van Meter seconded and the motion carried in a roll call vote:
Trustee Ammons - aye Trustee Figueroa - aye Trustee Giertz - aye Trustee Rock - aye Trustee Van Meter - aye Trustee Vasquez - aye
RETURN TO OPEN SESSION
Upon a motion by Trustee Giertz, seconded by Trustee Van Meter, the motion carried and the Investment Committee resumed its meeting in open session.

Trustee Ammons made the following motion:
• That based on the recommendation of SURS staff and Meketa, the Investment Committee grant authority to staff to restructure the Traditional Growth portfolio to implement the Streamlined Structure (option 2) as presented, subject to successful completion of contract negotiations.
Trustee Rock seconded and the motion carried with all trustees present voting in favor.
PRESENTATION OF FY 2020 INVESTMENT PLAN
Due to time constraints, the board was directed to the 2020 investment plan information contained in the written materials and trustees were encouraged to reach out with any questions. A copy of the Compiled FY 2020 Investment Plan is incorporated as part of these minutes as Exhibit 7.
MEKETA PERFORMANCE REPORT AND MANAGER PERFORMANCE
DASHBOARDS
Due to time constraints, the board was directed to the manager performance dashboards contained in the written materials and trustees were encouraged to reach out with any questions. A copy of Meketa’s presentations titled “Q2 2019 Board Report” and “SURS Manager Status Review” are incorporated as part of these minutes as Exhibit 8 and Exhibit 9.
INFORMATIONAL ITEMS NOT REQUIRING COMMITTEE ACTION The following items were provided for reference and are incorporated as a part of these minutes:
1. Exhibit 10 – SURS Projected Funding Status 2. Exhibit 11 – Alternative Risk Premia Search Update Memo 3. Exhibit 12 – Capital Market Outlook and Risk Metrics – August 2019 4. Exhibit 13 – SURS Risk Memo 5. Exhibit 14 - SURS Risk Report
PUBLIC COMMENT
There were no public comments presented to the Investment Committee.
RECESS At 6:00 p.m. on September 12, 2019, the Investment Committee recessed the meeting.
RECONVENE
At 11:00 a.m. on September 13, 2019, the Investment Committee reconvened the meeting.

The following trustees were present: Mr. Aaron Ammons, Mr. Richard Figueroa, Ms. Jamie-Clare Flaherty, Dr. Fred Giertz, Mr. John Lyons, Dr. Steven Rock, Mr. Collin Van Meter, Mr. Antonio Vasquez and Mr. Mitch Vogel. Others present: Mr. Martin Noven, Executive Director; Mr. Doug Wesley, Chief Investment Officer; Ms. Ellen Hung, Deputy CIO; Ms. Kimberly Pollitt, Mr. Joe Duncan and Mr. Shane Willoughby, Senior Investment Officers; Mr. Alex Ramos and Mr. Brian DeLoriea, Investment Officers; Ms. Kelly Valle and Mr. Akshay Patel, Investment Analysts; Ms. Bianca Green, General Counsel; Ms. Suzanne Mayer, Chief Benefits Officer; Ms. Tara Myers, Chief Financial Officer; Ms. Brenda Dunn, Chief Human Resource Officer; Ms. Kristen Houch, Head of Legislative Affairs; Ms. Kelly Carson and Ms. Annette Ackerman, Executive Assistants; Mr. Michael Sanders and Ms. Emily Wrightson of Cammack Retirement Group. Investment Committee roll call attendance was taken. Trustee Vasquez, Chair, present; Trustee Ammons, present; Trustee Figueroa, present; Trustee Giertz, present; Trustee Rock, present and Trustee Van Meter, present.
DEFINED CONTRIBUTION SEARCH UPDATE
Mr. Joe Duncan along with Cammack representatives Mr. Mike Saunders and Ms. Emily Wrightson provided an update on the Self-Managed Plan and supplemental plan provider search. Ms. Suzanne Mayer discussed the feedback she and Mr. Noven received from SURS employers and members regarding the proposed plan changes.
CLOSED SESSION
Trustee Van Meter moved that the Investment Committee go into closed session pursuant to §2(c)(7) of the Open Meetings Act to consider the sale or purchase of securities or investments or to consider an investment contract. Trustee Rock seconded and the motion carried in a roll call vote:
Trustee Ammons - aye Trustee Figueroa - aye Trustee Giertz - aye Trustee Rock - aye Trustee Van Meter - aye Trustee Vasquez - aye
RETURN TO OPEN SESSION
Upon a motion by Trustee Rock, seconded by Trustee Van Meter, the motion carried and the Investment Committee resumed its meeting in open session. Trustee Giertz made the following motion:
• That based on the recommendation from SURS staff and Cammack, the Investment Committee approve the retention of Voya Financial as the sole recordkeeper for the existing Self-Managed Plan and the new supplemental plan, subject to successful contract negotiations.
Trustee Ammons seconded and the motion carried with all trustees present voting in favor.

Trustee Giertz made the following motion:
• That based on the recommendation from SURS staff and Cammack, the Investment Committee approve the retention of AllianceBernstein as the income solution provider for the existing Self-Managed Plan and the new supplemental plan, subject to successful contract negotiations.
Trustee Van Meter seconded and the motion carried with all trustees present voting in favor.
RECOMMENDATION FOR LONG-DURATION MANDATE
Ms. Hung provided background information regarding the asset allocation approved in September 2018 for the CRO class, which will include long duration investments. Ms. Hung discussed the current RFI and provided staff’s recommendation and guidelines for the Quiet Period Policy. Trustee Giertz made the following motion:
• That based on the recommendation of SURS staff and Meketa, the Investment Committee approve RhumbLine to be retained to manage a U.S. Long Government passive strategy with an initial allocation of 1.75 percent of the SURS total portfolio, subject to successful completion of contract negotiations.
Trustee Ammons seconded and the motion carried with all trustees present voting in favor. A copy of SURS memorandum titled “Long Duration Recommendation Memo” and the “Long Duration RFO Response Matrix” are incorporated as part of these minutes as Exhibit 15 and Exhibit 16. The “Rhumbline Diversity Disclosure Form” is also incorporated as part of these minutes as Exhibit 17.
PROCUREMENT POLICY UPDATE
Mr. Wesley provided a summary of proposed revisions to the Investment Procurement Policy. Trustee Giertz made the following motion:
• That based on the recommendation of SURS staff, the Investment Committee approve the Investment Procurement Policy as presented.
No one seconded the motion; the motion failed. Discussion ensued regarding the proposed amendment to section 6d of the policy. It was then determined that the group would approve the proposed policy amendment without including the section six change that would allow SURS staff to authorize specialty consultants to invest in commitments of $50 million or less. Trustee Van Meter made the following motion:

• That based on the recommendation of SURS staff, the Investment Committee approve the Investment Procurement Policy as amended.
Trustee Lyons seconded and the motion carried with all trustees present voting in favor. A copy of SURS memorandum titled “Procurement Policy Revision Summary” and a copy of the proposed Investment Procurement Policy are incorporated as part of these minutes as Exhibit 18 and Exhibit 19. There was no further business brought before the committee and Trustee Van Meter moved that the meeting be adjourned. The motion was seconded by Trustee Figueroa and carried with all trustees present voting in favor.
Respectfully submitted,
Mr. Martin Noven
Secretary, Board of Trustees MMN/kc
To: Martin Noven From: Douglas C. Wesley, CFA Date: August 29, 2019 Subject: Investment Contracts Approved Following are investment contract agreements approved by the Executive Director following the June 6, 2019 Investment Committee meeting. May 2019 Blackstone Europe VI Fund documents and side letter were fully executed on May 2, 2019. July 2019 Dune IV Upsize document and addendum to subscription book were fully executed on July 2, 2019 August 2019 Neuberger Berman Amendment for Credit Mandate (fees and investment guidelines) was fully executed on August 1, 2019 Garcia Hamilton Amendment for Principal Protection Mandate (fees and investment guidelines) was fully executed on August 21, 2019 Pugh Capital Amendment for Principal Protection Mandate (fees and investment guidelines) was fully executed on August 21, 2019 LM Capital Amendment for Principal Protection Mandate (fees and investment guidelines) was fully executed on August 21, 2019 PIMCO Amendment for Credit Mandate (fees and investment guidelines) was fully executed on August 21, 2019 Ramirez Contract for Principal Protection Mandate was fully executed on August 27, 2019 Please advise if you have questions regarding these items.
Exhibit 1

To: Investment Committee From: Douglas C. Wesley, CFA Date: August 29, 2019 Subject: Report from the June 6, 2019 Investment Committee Meeting Enclosed are the Minutes of the June 6, 2019 Board Meeting. The purpose of this memorandum is to provide a status report on the action items for Investments. Six motions were approved during the Investment Committee Meeting. These included the approval of the minutes from the March 7, 2019 Investment Committee Meeting and a motion that the closed session minutes from the March 7, 2019 Investment Committee Meeting be approved and be opened. The remaining motions were approved by the SURS Board of Trustees and required further action by SURS staff. Open motions requiring further action by SURS Staff are listed below. 1. That based on the recommendation of SURS staff and Meketa, the Investment
Committee approve TorreyCove as the discretionary private equity advisor for a five-year term, subject to successful completion of contract negotiations.
Staff is in process of finalizing contract and side letter with TorreyCove.
2. That based on the recommendation of SURS staff and Meketa, the Investment
Committee approve the proposed amendments to the Investment Policy, as presented.
The Investment Policy for the defined benefit plan has been revised and posted on the SURS website.
3. That based on the recommendation of SURS staff and Meketa, the Investment
Committee grant authority to staff to restructure the fixed income portfolio to implement the agreed upon goals for the principal protection and credit portfolios, subject to successful completion of contract negotiations.
The fixed income restructure is in progress with Northern Trust acting as the transition manager.
4. That based on the recommendation of SURS staff and Callan, the Investment Committee
approve an add-on commitment of $30 million to Dune Real Estate Fund IV, subject to successful completion of contract negotiations.
Upsize commitment and subscription documents with Dune Real Estate Fund IV were fully executed.
Exhibit 2

Open item from April 18, 2018 5. That based on the recommendation of SURS staff and Callan, the Board of Trustees
approve a commitments of the lesser of $40 million or 10% of total fund commitments to Long Warf Real Estate Partners Fund VI, contingent on successful contract negotiations.
Staff is in process of completing the negotiations for the commitment.
6. That based on the recommendation of SURS staff, Progress Investment Management,
and Meketa, the Board of Trustees approve the graduation of Ramirez Asset Management from the Progress Portfolio to a direct SURS relationship.
Contract with Ramirez was fully executed on August 27, 2019.
Open item from March 7, 2018 7. That based on the recommendation of staff and SURS real assets consultant, that a
commitment $75 million Euros to Blackstone Fund 6 be approved, contingent on successful contract negotiations.
Subscription documents and side letter with Blackstone Fund 6 were fully executed.
8. That based on the recommendation of staff and PCA, that a commitment of no more than
1.75 percent of SURS total portfolio (35 percent of the initial 5 percent target to CRO) to long duration strategy be authorized, contingent on successful bidding among the approved slate of passively managed liquid fixed income providers.
The RFI for long duration strategy was issued on May 6, 2019 and responses were due on May 31, 2019. Staff and Meketa will be making a recommendation to the Board at the September 2019 meeting.
9. That based on the recommendation of staff and PCA, that a search be conducted to
identify qualified firms to manage a trend following strategy.
The trend following strategy RFP was issued on April 1, 2019. Thirty responses were received on May 2, 2019. Staff and Meketa reviewed the RFP responses and gave an update at the June Board meeting. Semi-finalist meetings were held on July 31 and August 1, 2019. Staff and Meketa will be making a recommendation to the Board at the September 2019 meeting.
10. That based on the recommendation of staff and PCA, that a search be conducted to
identify qualified firms to manage an alternative risk premia strategy.
The alternative risk premia strategy RFP was issued on April 1, 2019. Thirty-seven responses were received on May 2, 2019. Staff and Meketa reviewed the RFP responses and will be having semi-finalist meetings on September 4-5, 2019. Recommendations to the Board will be made at the October 2019 meeting.
Exhibit 2

Open item from December 6, 2018 11. That based on the recommendation from staff and PCA, the Investment Committee
approve that proceeds from the hedge fund of funds redemption be allocated to AQR (25 percent), Gladius (25 percent) and Neuberger Berman (50 percent), and used to fund benefit payments if needed.
As stated in item 16 below, SURS has received a total of $476.5 million from the hedge fund of funds. A portion of the redemption was reallocated to options strategies ($225 million) with the remaining used for benefit payments. Prior to the additional allocation, Staff negotiated a lower fee schedule with Neuberger Berman and AQR. The reduced fee schedule with Neuberger Berman resulted in annual savings of $90,000 on the additional $150 million allocation. The annual savings with AQR was $82,500 on $75 million of additional allocation.
Open item from October 18, 2018 12. That based on the recommendation from staff and PCA, the Investment Committee
approve the selection of transition managers for the transition manager bench and/or interim management services: BlackRock, Citigroup, Loop Capital, Northern Trust, Penserra and Russell.
Staff has been negotiating contracts with the six managers approved to be on SURS transition bench. Staff continues to work with BlackRock on contract negotiations.
Open item from September 13, 2018 13. That based on the recommendation from SURS staff and SURS investment consultant,
that SURS coordinate full redemption from the KKR Prisma Codlin Fund and from the Newport Monarch Fund. At either the October or December 2018 Investment Committee meeting, staff will recommend where proceeds will be invested.
The notifications for full redemption were submitted to KKR Prisma Codlin Fund and Newport Monarch Fund on September 19, 2018. A total of $332.5 million has been received from Prisma and $144.0 million from PAAMCO. As stated in item 11 above, Staff has reallocated $225 million to options strategies managers as approved by the Board at the December 2018 meeting.
Open item from December 7, 2017
14. The Investment Committee recommends that based on the recommendation of staff and
SURS investment consultant, that staff be able to coordinate a full redemption from the UBS Trumbull Property Fund and use proceeds to invest $300 million in core-plus, open-end real estate fund(s).
The notification was submitted on December 21, 2017. SURS has received a total distribution of $275 million. As the exit queue has significantly increased, it may take a few years before the remaining proceeds, approximately $103 million, are returned.
Please advise if you have any questions prior to the September 12, 2019 Investment Committee meeting.
Exhibit 2
To: Investment Committee From: Investment Staff Date: September 12, 2019 Re: Corporate Governance Update Below please find a status update of governance activity. Restricted Securities Effective January 1, 2016, Illinois Public Act 099-0128 amended the previously adopted investment restrictions and prohibited retirement systems from investing in companies that boycott Israel, Iran-restricted companies, and Sudan-restricted companies. PA 099-0128 also established the creation of the Illinois Investment Policy Board (IIPB) which, by April, 2016, provided a list of restricted companies that was distributed to the retirement systems in accordance with the legislation. In addition to the restrictions stipulated by PA 099-0128 in 2016, effective January 1, 2018, PA 100-0551 prohibited state-funded retirement systems from investing in expatriated companies. The IIPB assists in providing a list of restricted securities in line with the legislation. As of December 31, 2018, SURS direct investments in restricted securities was considerably below the 0.50% threshold specified by Public Act 099-0128(f). Therefore, no investments were sold, redeemed, divested or withdrawn during the 2018 reporting period as a result of the legislation. Proxy Voting Provider Following an RFP process approved by the Board of Trustees on February 4, 2016, Glass, Lewis & Co. (Glass Lewis) was retained as a proxy voting provider. Glass Lewis offers a series of services, including an online voting platform, access to research and proxy voting materials via a client portal, and domestic and international proxy voting. SURS contract with Glass Lewis became effective on October 1, 2016 and will expire on October 1, 2019, with the option to extend for two additional one-year periods. On February 6, 2019, SURS exercised its right to extend services for one additional one-year period. Currently, SURS proxy voting guidelines are made up by an overlay of three different sets: U.S. Proxy Guidelines, Public Pension Guidelines, and International Guidelines, all provided by Glass Lewis. Glass Lewis recommends these guidelines are reviewed annually in January or February, right before proxy season. Although the current guidelines are standard and updated annually by the proxy voting provider, Glass Lewis can assist via conference calls in making any changes that would better reflect SURS stance on various matters and provide further education at Board
Exhibit 3

meetings annually. SURS current proxy guidelines can be found in the supplemental materials folder. • 2019 U.S. Proxy Guidelines • 2019 Public Pension Guidelines • 2019 International Guidelines Investor Stewardship Group and Principles for Responsible Investment On October 19, 2017, SURS became a signatory to the Investor Stewardship Group (ISG), joining more than 60 U.S. and international investors with combined assets in excess of $31 trillion. The ISG establishes a framework comprised of a set of stewardship principles for institutional investors and corporate governance principles for U.S. listed companies. Prior to ISG, SURS was a signatory to the Principles for Responsible Investment (PRI) from 2009 to late 2017. At time of signing, ISG had a larger U.S. base and no membership fees, the latter remains true for ISG, giving ISG an advantage over PRI. In recent years, PRI U.S.-based membership has increased and currently, 48 asset owners, 64 service providers, and 372 investment managers have joined. Although ISG has no membership fees, its focus is particularly strong on Governance at the investor and public company level. In contrast, PRI is an all-encompassing framework that incorporates the various aspects of ESG into the investment practice. Whether ISG or PRI frameworks are utilized will directly depend on the level and scope of involvement SURS would like to achieve. Legislation On August 23, 2019, House Bill 2460 – Illinois Sustainable Investing Act, was signed into law as Public Act 101-0473. This Public Act will require SURS to “adopt a written investment policy that must include material, relevant, and decision-useful sustainability factors to be considered by the board, within the bounds of financial and fiduciary prudence, in evaluating investment decisions. Such factors must include, but are not limited to: (1) corporate governance and leadership factors; (2) environmental factors; (3) social capital factors; (4) human capital factors; and (5) business model and innovation factors, as provided under the Illinois Sustainable Investing Act.” General and specialty consultants, as well as, Glass Lewis, and staff have begun preliminary work to implement this legislation. Council of Institutional Investors (CII) 2019 Conference The 2019 Council of Institutional Investors (CII) will take place September 16-18, in Minneapolis, MN. The conference agenda is attached to this memo. Ms. Kelly Valle and a few members of the Board of Trustees will attend the 2019 CII meeting. Ms. Valle will provide an update to the Board of Trustees at the December meeting. Additionally, a General Member’s business meeting will take place on September 17. During the business meeting, members will have the opportunity to vote on two items: approval of CII 2020 budget and approval of a revised CII policy on executive compensation. SURS staff has recommended to vote FOR on both items. Analysis of the recommendations is presented on Appendix A.
Exhibit 3
Current Events • Regulation of Proxy Voting Providers In June 2019, the Milken Institute published the paper “Proxy Advisory Firms, Governance, Market Failure, and Regulation” by Chester S. Spatt. The paper criticizes the “natural monopoly” structure of the proxy voting industry as Institutional Shareholder Services (ISS) and Glass, Lewis & Co. (Glass Lewis) have positioned themselves as the two largest proxy advisory firms in the world. Spatt explains that this concentration of power is directly reflected in the substantial amount of influence these advisors have over their recommendations to clients and the outcome of proxy contests. Other issues explored by the author include: • Recommendations by proxy advisors tend to be less supportive of management than the asset managers would suggest • Recommendations may not serve the best interest of all shareholders but rather reflect advisory firms disputes with the individual companies • Public companies and the U.S. Chamber of Commerce have raised concerns about the mistakes in information that advisors provide to asset managers, the lack of opportunity for public companies to provide input and proxy advisors not offering justifications for recommendations to public companies • ISS and Glass Lewis’ recommendations are highly correlated • Proxy advisors develop a generic framework and recommendations for a wide variety of broad issues, a “one-size fits all” model In further comparing ISS and Glass Lewis, the author explains that while ISS provides governance advice and shareholder voting recommendations to same public companies that pay a fee, causing a clear conflict of interest, Glass Lewis does not. Thus, Glass Lewis’ quality of recommendations seems to be of higher quality compared to ISS. Additionally, Spatt explains that Glass Lewis could be biased to favor the union agenda as is partially owned by a Canadian labor union pension fund. Finally, in regard to external regulation, Spatt mentions that, although registration with the SEC is not mandatory for proxy voting providers, ISS has voluntarily registered and submits to added scrutiny, Glass Lewis has not. In similar fashion, an article published by FUNDfire in July 2019, affirms that the SEC is closely examining the rules governing shareholder engagement, specifically the number of shares necessary to make a proposal. An increase in numbers of shares would scale back the role of proxy advisory firms like Glass Lewis or ISS. In contrast, the same article points out two important reasons why further regulation of proxy advisors is not welcomed by the investor community: time commitment, and the already difficult process investor-activists go through to obtain support for a shareholder proposal. First, investors argue that it would be “impossible to individually look into each of these issues [up for vote],” a sentiment that could be easily understood considering the amount of research and votes needed to complete the proxy process for each ballot. Additionally, in regard to shareholder proposals, an eligible shareholder bringing a resolution must obtain investor support throughout multiple years to bring an issue up for voting. In fact, even resolutions that have been brought up under current policy are often blocked by the SEC, a problematic reality for ESG managers that already struggle gaining traction for proposals. In regard to factual errors made by proxy advisors, according to an article published by The Wall Street Journal, the SEC is taking steps to approve a policy that would require proxy advisors to
Exhibit 3

disclose how recommendations are crafted. The policy would also include guidance for investors on how to approach a situation in which the proxy advisors had made factual errors in their recommendations. Opponents to this regulation argue that added disclosures would add financial burden to advisors and as a result barriers to entry to the industry would be much higher, deepening the influence of already existing firms. Furthermore, higher cost for voting guidance could stop smaller managers from voting, causing control to be concentrated on the hands of the bigger investors. Glass Lewis Response In response to concerns raised by Spatt and echoed by other news outlets, Glass Lewis shared its Proxy Advisor Regulation Overview with SURS staff. Glass Lewis’ Proxy Advisor Regulation Overview argues that “proxy advisors do not have undue influence on voting” because investors retain control of decisions at all times. As part of the voting process, investors have access to research and the opportunity to manually vote via the online platform. Glass Lewis also mentions that large investors have custom policies that may differ from advisor’s recommendations or buy research from other advisors. Furthermore, the Overview argues that “investors universally oppose additional regulation,” based to investor opposition to two House Bills introduced in 2016 and 2017, respectively. According to Glass Lewis, opponents included CII, Investment Company Institute, International Corporate Governance Network, CalSTRS, Florida State Board of Administration, and the Ohio PERS. Overall, Glass Lewis believes that further regulation is not necessary and affirms that appropriate safeguards to avoid conflicts of interest have been put in place, including not consulting for issuers, shareholder proposals or proxy contest initiatives, and antifraud provisions of federal securities laws. • Companies Have Obligations to Society CEOs of some of America’s biggest companies voted to change the purpose statement of a corporation to reflect that decisions should not only be based on whether they yield higher profits for shareholders but also to take into account “all stakeholders,” writes David Benoit in an article published by The Wall Street Journal. The proposed stance by members of the Business Roundtable states that “companies should work to deliver value to customers, invest in employees, deal fairly with suppliers and support communities, as well as generate long-term shareholder value,” according to Benoit. Although many supported the proposal, seven CEOs, including Larry Culp of General Electric, declined to endorse the statement fearing the effects it could have on the company’s investors. The statement as presented was an effort to formalize individual stances taken by a number of executives in recent years, possibly as to challenge the narrow focus of the decades-old theory by Milton Friedman that states that “companies only obligation is to maximize value for shareholders,” affirms Benoit. In response to this initiative, CII believes that “the statement gives CEOs cover to dodge shareholder oversight.” In fact, changing the current purpose of a corporation to an all-encompassing, blanket statement to include “all stakeholders,” could be used to signal that the company is complying with their obligations as part of day-to-day business practices and that further oversight is not necessary.
Exhibit 3

Voting at CII APPENDIX A On September 17, CII will conduct the General Member’s business meeting. During the meeting, members will vote on various matters related to CII. SURS staff has made the following voting recommendations: 1. Approve CII 2020 budget: FOR From CII’s proposal: • The budget includes revenue of $4,142,000 (4% higher than projected 2019 revenue) and expenses of $4,119,000 (3% higher than projected 2019 expenses). The operating gain in the budget is $23,000. • General Member dues are unchanged, except the caps for larger funds will have an inflation adjustment of 1.3%. • Associate Member dues will be unbundled from conference attendance fees, which will be charged separately. Associate Member dues levels will be lower, but the budget anticipates that total revenue from Associate Members will be marginally greater.
Analysis: SURS staff recommends to vote FOR CII’s 2020 budget. The proposed budget will allow CII to cover expenses caused by increases in retirement contributions, and expanded staff and pay. Approval will also serve in supporting CII to continue operations as they project new member revenue to drop to 2016 and 2017 levels, support marketing efforts that have been previously under-budgeted, and an increase in legal fees related to analysis of new legislation. 2. Approve revised CII policy on executive compensation: FOR From CII’s proposal: • The proposed new policy lifts up two important objectives for the next decade: simplifying executive pay design, so that both investors and executives can reasonably understand how it works; and lengthening periods of performance measurement with respect to variable pay. • The CII board adopted the language under consideration on August 1. The Policies Committee adopted the draft on May 28 following an 18-month inquiry, which included two roundtables and two comment periods, all of which contributed to the committee’s careful consideration, and in several cases, substantive revisions. • A legacy section of the policy addressing executive stock sales will be replaced by a separate statement currently under development.
Analysis: SURS staff recommends to vote FOR CII’s revised policy on executive compensation. According to CII, policy on executive compensation had not been revised in nearly a decade. The proposed text is a step forward in providing guidance and clarity to a topic that has gained traction in the past few years. The reviewed policy requires boards to disclose forms or compensation, metrics and goals, a comprehensive compensation structure, and guidelines for cost-effective and equitable pay. Additionally, the proposed document provides a revised view of governance of compensation, transparency, peers, and elements of compensation, stock ownership guidelines, compensation recovery, and poor pay practices.
Exhibit 3

2019 CII Conference Agenda
Registration Open 9/16/2019 10:00 AM CT
Master Class: Evaluating Pay for Performance (Additional Fees Apply) Education Courses (additional fees apply)
9/16/2019 11:00 AM CT
Engagement Exchange (Invite Only, Prior Registration Required) 9/16/2019 1:00 PM CT
The New Focus on Stakeholder Interests: Considerations for Public Pension Funds (Invite Only)
9/16/2019 1:00 PM CT
Member-Hosted Panel: Transformation to a Low-Carbon Economy - Board Accountability & Investor Roles
Member-Hosted Meetings 9/16/2019 3:15 PM CT
Member-Hosted Panel: Contested M&A Activity and Trends Member-Hosted Meetings 9/16/2019 3:15 PM CT
Member-Hosted Panel: Artificial Intelligence and Its Role and Impact on Investor Relations
Member-Hosted Meetings 9/16/2019 3:15 PM CT
Welcome & CII Updates Plenary Sessions 9/16/2019 4:30 PM CT
Dual Class Stock and the Future of Corporate Governance Plenary Sessions 9/16/2019 4:45 PM CT
Evolving the Board Plenary Sessions 9/16/2019 5:30 PM CT
Cocktail Reception Networking Event 9/16/2019 6:15 PM CT
Trustee Roundtable & Dinner (Invite Only) 9/16/2019 7:30 PM CT
Registration Open 9/17/2019 7:00 AM CT
Member Lounge Open 9/17/2019 7:00 AM CT
Breakfast Food/Meals 9/17/2019 7:30 AM CT
Welcome from Minnesota Governor Tim Walz Plenary Sessions 9/17/2019 8:05 AM CT
Fiduciary Duty and ESG in Investment: CIO Perspectives Plenary Sessions 9/17/2019 8:15 AM CT
Public Company Accounting Oversight: Key Issues and Developments Plenary Sessions 9/17/2019 9:00 AM CT
Gender Pay Equity Plenary Sessions 9/17/2019 9:30 AM CT
Lessons from the Front Lines: Challenges in Renewable Energy Deployment & Transitions
Plenary Sessions 9/17/2019 10:00 AM CT
Networking Break Networking Event 9/17/2019 10:45 AM CT
Member-Hosted Panel: RiskyRX - Investor Views on Opioid Risks & Anticompetitive Practices in Pharma
Member-Hosted Meetings 9/17/2019 11:15 AM CT
Member-Hosted Panel: Forced Arbitration Clauses & the Repercussions for Institutional Investors
Member-Hosted Meetings 9/17/2019 11:15 AM CT
Member-Hosted Panel: The Growing Risk of Private Prisons for Long-term Investors
Member-Hosted Meetings 9/17/2019 11:15 AM CT
Luncheon Keynote: Dan Ariely, Author of The Secret and Benefits of Understanding Motivation at Work
Food/Meals 9/17/2019 12:30 PM CT
Breakout: Auditing Issues and Proxy Voting Breakout Sessions 9/17/2019 2:15 PM CT
Breakout: Sustainability Reporting Standards Breakout Sessions 9/17/2019 2:15 PM CT
Exhibit 4
Breakout: Bankruptcy Process and Corporate Governance Breakout Sessions 9/17/2019 2:15 PM CT
Corporate Members Constituency Meeting Constituency Meetings 9/17/2019 3:30 PM CT
Public Pension Fund Members Constituency Meeting Constituency Meetings 9/17/2019 3:30 PM CT
Labor Union Members Constituency Meeting Constituency Meetings 9/17/2019 3:30 PM CT
Associate Members Constituency Meeting Constituency Meetings 9/17/2019 3:30 PM CT
General Members Business Meeting Business Meeting 9/17/2019 4:30 PM CT
Cocktail Reception Networking Event 9/17/2019 5:30 PM CT
Registration Open 9/18/2019 8:00 AM CT
Member Lounge Open 9/18/2019 8:00 AM CT
Continental Breakfast Food/Meals 9/18/2019 8:15 AM CT
International Governance Developments hosted by the International Governance Committee
Plenary Sessions 9/18/2019 9:00 AM CT
Policy Outlook: Proxy Advisory Firm Regulation Plenary Sessions 9/18/2019 9:45 AM CT
Networking Break 9/18/2019 10:45 AM CT
ESG Priorities and Director Accountability Followed by Roundup of CII Members’ Initiatives
Plenary Sessions 9/18/2019 11:00 AM CT
Networking Buffet Lunch Food/Meals 9/18/2019 12:15 PM CT
Exhibit 4

PRESENTATION TO ILLINOIS STATE UNIVERSITIES RETIREMENT SYSTEM
2019 PROXY SEASON REVIEW
POLICY OVERVIEW
SEPTEMBER 12th, 2019
Exhibit 5

AGENDA
• Introduction to Glass Lewis
• Introduction to Corporate Governance
• Institutional Investors: Proxy Voting Process
• 2019 Proxy Season Review
• SURS Proxy Voting Policy
2
Exhibit 5

INTRODUCTION TO GLASS LEWIS
3
Exhibit 5

GLASS LEWIS & CO.
Founded in 2003, Glass Lewis is the leading independent provider of global governance services. Glass Lewis helps institutional investors understand and connect with the companies in which they invest.
4
1,300+Institutional Clients
20,000+Research Reports Annually
360+Employees
We produce Proxy Papers to provide analysis and voting recommendations to our clients (Institutional Investors) on how to vote at a public company’s (Issuer) annual and special meetings.
Exhibit 5

PROXY RESEARCH PROCESS
Team Approach
Analysis varies based upon market, issue, complexity and company size
All reports reviewed by two or more people; varies by report profile
Accuracy and lead times are monitored to ensure client satisfaction
Executive Compensation
Analyze executive compensation quantitatively and qualitatively
Incorporate multiple performance factors into Pay-for-Performance analysis
Mergers & Acquisitions / Proxy Contests
Specialized team and experience
Proposed offers are evaluated versus the returns to shareholders
Approach to proxy contests aligns well with most institutional investors
ESG / Shareholder Proposals
Viewpoint’s proprietary rules engine interprets complex policies
Unmatched nuance and cascading rules minimize noise and focus your attention on the most important issues
5
Exhibit 5

PROXY PAPER
Guaranteed global coverage; complete report for all companies
More than 20,000 meetings across 100 markets
Independent and contextual analysis with a focus on economic impact
Direct access to research team
Board presentations, white papers, Proxy Talks, data feeds
Issuer Engagement Policy:
Designed to empower clients and investors
6
Exhibit 5

VIEWPOINT
Flexible, configurable user interface
Responsive search; workflow updates dynamically
In-application user collaboration; also streamlines communication between non-users
Nuanced custom policy implementation
Transparent and compliant; audits, reconciliation and activity logs
Extensive permissioning controls
Myriad reporting options
Secure and reliable:99.9%+ uptime; round the clock support
7
Exhibit 5

INTRODUCTION TO CORPORATE GOVERNANCE
8
Exhibit 5

• Corporate governance is the system of rules, practices and processes by which a company is directed and controlled
– A framework that promotes accountability and transparency
– Involves balancing the interests of the company’s many stakeholders: management, board of directors, shareholders, customers, the environment and everyone effected.
– More attention on corporate governance following the collapse of Enron and similar scandals (Glass Lewis was founded in 2003)
• Recent examples: Wells Fargo; Uber; Equifax; Volkswagen; Boeing; Tesla
WHAT IS CORPORATE GOVERNANCE?
9
Exhibit 5

• Management Proposals: Governance– Election of Directors (“EOD”)– Ratification of Auditors (“ROA”)– Misc. proposals
• Amendments to articles/bylaws• Board size, company name change, transaction of other business• Reverse stock splits & changes to authorized capital• Issuances of securities
• Management Proposals: Compensation– Advisory Vote on Executive Compensation (“Say-on-Pay”)
• Mandated by Dodd Frank Act, July 2010.– Equity Plans and other Pay-Related Proposals
• Stock Option Plans; Bonus 162(m) Plans; ESPP’s; Director Comp. Plans;
• Shareholder Proposals– Governance topics; Environmental Reporting; Gender Pay Equity;
Corporate Political Spending; Corporate Practices, etc.• Mutual Fund Advisory/Sub-advisory Agreements, Fund Reorganizations• Approval of Mergers & Acquisitions (“M&A”)
TYPES OF PROPOSALS
10
Exhibit 5

INSTITUTIONAL INVESTORS: PROXY VOTING PROCESS
11
Exhibit 5

PROXY VOTING PROCESS
12
1. Annual or special meeting is called by a company whose shares they own
2. Institutional Investor is required to vote on the proposals– Outsource to proxy advisors (such as Glass Lewis)– In-house resources expanding in recent years
3. Institutional Investor votes their shares4. Vote results help drive change and ongoing dialogue
between investors and companies
• Clients use GL/proxy advisors in different ways– Implement custom policies based on data collection – Use analysis as input to their in-house policies and decisions
• “Research only” clients– Implement proxy advisor’s standard policy
Exhibit 5

2019 PROXY SEASON REVIEW
13
Exhibit 5

2019 PROXY SEASON REVIEW- MANAGEMENT PROPOSALS
• Increased opposition to directors– Sixty-eight directors failed to receive majority support from shareholders in the 2019 proxy
season, up from fifty-one in 2018 and sixty in 2017
– Issues such as ongoing compensation concerns, failure to attend enough board meetings, overboarding and responsiveness to majority supported shareholder proposals appear to be some of the top reasons for shareholder discontent
• Board composition is still a key issue, and is driving change in the boardroom– Board diversity a significant concerns for investors
– 27% of companies in the S&P 500 disclosed a board skills matrix
– 43% of companies in the S&P 500 have explicit board oversight of environmental and social issues
• There is increased opposition to executive compensation– Average support for say on pay proposals dropped from 90% to 89% in 2019
– Failed proposals decreased by 10% from 2018 while the number of companies receiving significant opposition increased by 5.5%.
– The proportion of failed Golden Parachute proposals more than doubled year over year.
14
Exhibit 5

2019 SHAREHOLDER PROPOSALS BY CATEGORY
15
Exhibit 5

2019 PROXY SEASON REVIEW- SHAREHOLDER PROPOSALS
• Although ESG issues continue to become more mainstream, the number of proposals going to a vote has been on a continuous decline: Glass Lewis reviewed 426 shareholder proposals in 2019, down from 585 in 2015.
– Average support for shareholder proposals was 32.5% in both 2018 and 2019. However, we saw a notable increase in the average support for environmental and social initiatives (24.8% to 27% in 2019).
• There has been an increased focus on human capital management, with new proposals on issues related to sexual harassment, mandatory arbitration and inequitable employment practices, all going to a vote during the 2019 proxy season.
– Despite many of these proposals being submitted to tech companies with dual class shares (and therefore depressed shareholder support), these proposals received average support of 26%. Further, a number of these proposals, on issues ranging from executive diversity to reporting on workforce composition, received majority shareholder support.
• Technology companies were arguably the focus of investors during the 2019 proxy season. Alphabet had the highest number of shareholder proposals (13) followed by Amazon (12) and Facebook (8).
– This highlights the increasing importance of technology companies in society. Shareholder proposals on technology-related issues, such as facial recognition technology and content governance, received 21% average support.
16
Exhibit 5
SURS VOTING POLICY
17
Exhibit 5

SURS PROXY VOTING GUIDELINES
• SURS follows Glass Lewis’ Public Pension Guidelines
• The Public Pension Guidelines overlay on top of Glass Lewis’ standard guidelines, where we evaluate each company on a case-by-case basis
– Will take the Glass Lewis approach for a number of issues, including M&A and contested meetings and other unique situations
• The Public Pension guidelines are designed to ensure compliance with the special fiduciary responsibilities of public pension plan sponsors in voting proxies on behalf of public employees. These guidelines are designed for investors with extremely long-term investment horizons.
18
Exhibit 5

SURS PROXY VOTING GUIDELINES
• Board diversity, tenure and refreshment– Vote against members of the nominating committee in the event that the board has an
average tenure of over ten years and the board has not appointed a new nominee to the board in at least five years;
– Vote against the male members of the nominating committee in instances where the board is comprised of fewer than 30% female directors for large-cap companies, or against the nominating committee when there is not at least one woman on the board at mid- and small-cap companies.
• Overboarding– Vote against directors who sit on more than five corporate boards (or for directors who are
also executives, two total boards)
– Vote against the nominating and governance committee when companies have adopted a virtual-only shareholder meeting format and have not provided disclosure of shareholder protections
• Tax Havens– Vote against company proposals to redomicile in known tax havens.
• Auditor Ratification– Vote against auditor ratification proposals i n instances where it is clear that a company’s
auditor has not been changed for 20 or more years.
19
Exhibit 5

SURS PROXY VOTING GUIDELINES
• Compensation
– Largely follows the Glass Lewis recommendations
– In instances where a company has received a Pay-for-Performance grade of “D” or “F” and Glass Lewis’ standard policy has recommended in favor of the plan, vote against say-on-pay proposals where sustainability is not an explicit consideration for companies when awarding executive compensation.
• Shareholder Proposals
– Vote for most governance shareholder proposals
– Vote for all environmental and social proposals aimed at increasing a company’s disclosure of environmental or social issues
– Vote against resolutions requesting that companies take specific actions or adopt specific policies, unless Glass Lewis has recommended in favor of the resolution
20
Exhibit 5

M E M O R A N D U M
M E K E T A I N V E S T M E N T G R O U P 411 PARK AVENUE SUITE 401 PORTLAND, OR 97209
503 226 1050 fax 503 226 3304 www.meketagroup.com
To: State Universities Retirement System (SURS) Board of Trustees
From: Neil Rue, CFA; Colin Bebee, CFA; David Sancewich Meketa Investment Group (MIG)
Cc: Doug Wesley, CFA – CIO Ellen Hung, CFA – Deputy CIO
Date: September 12, 2019
Re: Recommendations to Rename SURS’ Public Equity class “Traditional Growth,” Modify the Traditional Growth Policy, and Make Additional Updating Edits to SURS’ Investment Policy Statement
SUMMARY & RECOMMENDATION
Over the last several months, extending back into mid-2018, the SURS Board has approved several material changes to its long-term investment strategy. The first major decision, in September 2018, was the Board approving a new long-term strategic allocation policy.
As a result of the allocation policy decision, the Board has approved (i) a strategic plan and revised policy language for the SURS Real Assets classes (December 2018), (ii) a structural blueprint and policy language for the new Crisis Risk Offset class (March 2019), (iii) revised policy language and structural changes for the Principal Protection class and the Credit component of Stabilized Growth (June 2019), and (iv) selected a new Private Equity advisor who will provide key guidance in developing an expanded Non-Traditional Growth portfolio (June 2019). All these decisions provide important direction and guidance to Staff and its consultants to implement the Board’s earlier major policy decision.
This memo continues the implementation process by recommending policy language changes that incorporate the Board’s prior direction on formalizing and structuring the Traditional Growth component of SURS’ newly-created Broad Growth class. Both Staff and MIG recommend that the Investment Committee/Board approve the requested changes to the SURS IPS.
DISCUSSION
The attached changes to the IPS incorporate and memorialize all of the above prior Board approvals while also directly highlighting requested changes to the Traditional Growth component that reflects Board direction in June 2019 (See Attachment 1 – Clean Copy and Attachment 2 – Red Line Copy). In summary, the latest redline requests to the IPS are:
Exhibit 6

Memorandum Page 2 of 3 September 12, 2019
Renaming the Public Equity Structure section to “Traditional Growth” and revising policy language pertaining to this class. The key change are to (i) provide Staff with flexibility to allocate assets across U.S., Non-U.S., and Global regional mandates and (ii) to adopt a broad Global Equity benchmark, as presented in Appendix 5. These changes reflect Board deliberation and direction during the June 2019 Investment Committee meeting.
Re-organizing Section VI of the IPS to completely reflect the new strategic allocation structure. Prior versions of Section VI of the IPS were evolutions toward the new allocation structure, which the Board approved and adopted in September 2018. Section VI’s format now fully reflects that structural decision. Such a change is largely shifting/re-organizing of content and not necessarily making substantive changes to the content itself. Importantly, Appendix 4 now fully reflects implementation of the new strategic structure, which is to begin at the outset of 4Q 2019 (i.e., 10/1/2019).
Updating Appendices 6-8 of the IPS to reflect updated diversity goals. Based on recent deliberations, diversity goals have been updated to (i) address desired level of fees paid to diverse managers and (ii) adjusting goals for minority broker activity, primarily to account for new strategic structure.
Housecleaning items. Minor changes and edits that help make policy language more consistent across all sections. Also updating Appendix 5 to include previously approved benchmarks for the relevant classes, components, sub-components, and classes.
These updates to the IPS represent a key phase in incorporating the Board’s prior strategic decisions into the current SURS investment portfolio. In particular, the Traditional Growth component is SURS portfolio’s largest segment. Approving the changes related to the Traditional Growth component will likely have a material impact on future investment results.
PLANS FOR THE TRADITIONAL GROWTH COMPONENT
The most impactful recommended IPS language changes relates to the Traditional Growth component. Here are a few key points related to Traditional Growth implementation (most were discussed and reviewed in June):
Based on the strategic allocation, Traditional Growth (as a percent of assets) is slated to decline materially over time. In keeping with this implementation trend, Staff is expecting to withdraw roughly $1B from Traditional Growth over the next few months.
A key to a successful Traditional Growth class is allocating appropriately to a spectrum of passive and active management. The new manager structure for Traditional Growth will likely incorporate a broader spectrum of approaches than in the past.
Exhibit 6

Memorandum Page 3 of 3 September 12, 2019
The new policy language provides heightened implementation flexibility to Staff. Allocation weights to U.S., Non-U.S., and Global mandates were previously hard-coded. Staff will now be allowed to determine the appropriate weights as long as they remain in-line with the global equity benchmark. This should allow Staff to migrate to global mandates over time, where the ability to add value appears to be strongest.
A BRIEF COMMENT ON IMPLEMENTATION
As discussed earlier, Appendix 4 in the IPS has now been updated to fully reflect the new strategic allocation structure. The Appendix in prior versions of the IPS showed an allocation structure that was an evolving hybrid of both the historical and new policy structures. With the new structure now in place, the overarching objective is to achieve the long-term class weighting targets highlighted in Appendix 4 in a deliberate, yet timely manner. Shown below is a preliminary allocation plan for achieving the long-term target by Fiscal 2023:
Interim Strategic Allocation Targets
SURS Actual 6/30/2019
(%)* 10/1/2019
(%)** 7/1/2020
(%) 7/1/2021
(%) 7/1/2022
(%)
Long-Term Target
(%)
Broad Growth 86 81 76 66 66 66
Non-Traditional Growth 10 10 11 12 13 15
Traditional Growth 54 47 41 28 27 25
Stabilized Growth 22 24 24 26 26 26
Inflation Sensitive 6 6 6 6 6 6
Principal Protection 7 8 8 8 8 8
CRO 0 5 10 20 20 20
Total 100 100 100 100 100 100
*May not sum to 100% due to rounding **Preliminary
As the table highlights, as of 6/30/2019, Staff has made some incremental progress toward the new strategic allocation since the end of 2018. However, significant implementation remains. October 2019 is indicated as “Preliminary” as it is a challenge to precisely determine starting percentages with various tasks currently in process. That being the case, Staff and MIG are working closely together to execute various implementation tasks in a deliberate yet timely manner in order to maintain the spirit of the implementation schedule highlighted above. To date, Principal Protection and Credit transitions should be completed by October 1st. In addition, Crisis Risk Offset class implementation is proceeding on schedule, with manager searches expected to be completed in or near October 2019. NAR/CB/DPS/hls Attachments
Exhibit 6

Investment Policy April 2019
Page 11
VI. Portfolio Construction and Performance Benchmarks The Board has adopted Target Allocation Percentages in accordance with its Strategic Allocation and Rebalancing strategy described in Section V. Within each Strategic Class, the Board will determine the amount of such class that will be (i) managed internally vs. externally; (ii) managed actively vs. passively; (iii) allocated to a particular sub-class, sector or style, if any, and (iv) allocated to each approved Manager. Strategic Class allocations will be reviewed annually in connection with the Target Allocation Percentage review. The choice of internal vs. external management shall be based on a periodic comparison of (i) the cost and availability of qualified Staff and systems support and (ii) the cost and availability of Managers. Currently, the Board makes exclusive use of external Managers. Active Management shall be considered for Strategic Classes, sub-classes and styles of Marketable Securities (actively traded public Equity, public Fixed-income and Alternative markets), where empirical evidence shows that (i) a significant percentage (e.g. 25%) of Managers in such category (adjusted for survivorship) have consistently outperformed applicable Benchmarks for such category (net of fees) over a three (3), five (5) and ten (10) year period and (ii) that outperformance has been significant (e.g. greater than 50 basis points). For categories not meeting this threshold, and subject to SURS’ MFDB Manager Utilization Goals and Manager Diversity Program, Passive Management will be followed. For all non-actively traded public Equity, public Fixed-income and Alternative markets, Active Management will be used. Amounts allocated to a particular sector or style shall also be based on empirical evidence showing that (i) a significant percentage (e.g. 25%) of Managers in such sub-sector or style (adjusted for survivorship) have consistently outperformed applicable Benchmarks for such sub-sector or style (net of fees) over a three (3), five (5) and ten (10) year period and (ii) that outperformance has been significant (e.g. greater than 50 basis points). If such threshold is not met, no allocation to such sub-sector or style will be made. Amounts allocated to each Manager, within a Strategic Class, sub-class, sector or style shall be based on: (i) the total dollar amount to be allocated to such category; (ii) the relative ongoing performance of applicable Managers; (iii) the unique attributes of such Manager’s investment style and potential benefits from diversification; and (iv) the overhead cost of managing the number of Managers within such category. Subject to SURS’ MFDB Manager Utilization Goals and Manager Diversity Program, the Board has a bias toward fewer Managers and more meaningful allocations. Managers selected by the Board will be given specific roles within each Strategic Class, sub-class, sub-sectors, and styles, as applicable. These roles are specifically set forth for each firm as Manager Guidelines, established at the beginning of the relationship with SURS as part of the contract negotiation process. These guidelines cover such items as Benchmarks, permissible investments, use of leverage, obligor concentrations, currency denomination, etc. Staff and Consultant will be responsible for implementation of these guidelines, supervision of the Managers, performance monitoring and reporting. Updates will be provided to the Board or Investment Committee as requested, or as deemed necessary by Staff and Consultant.
ATTACHMENT 1 - CleanExhibit 6
Investment Policy April 2019
Page 12
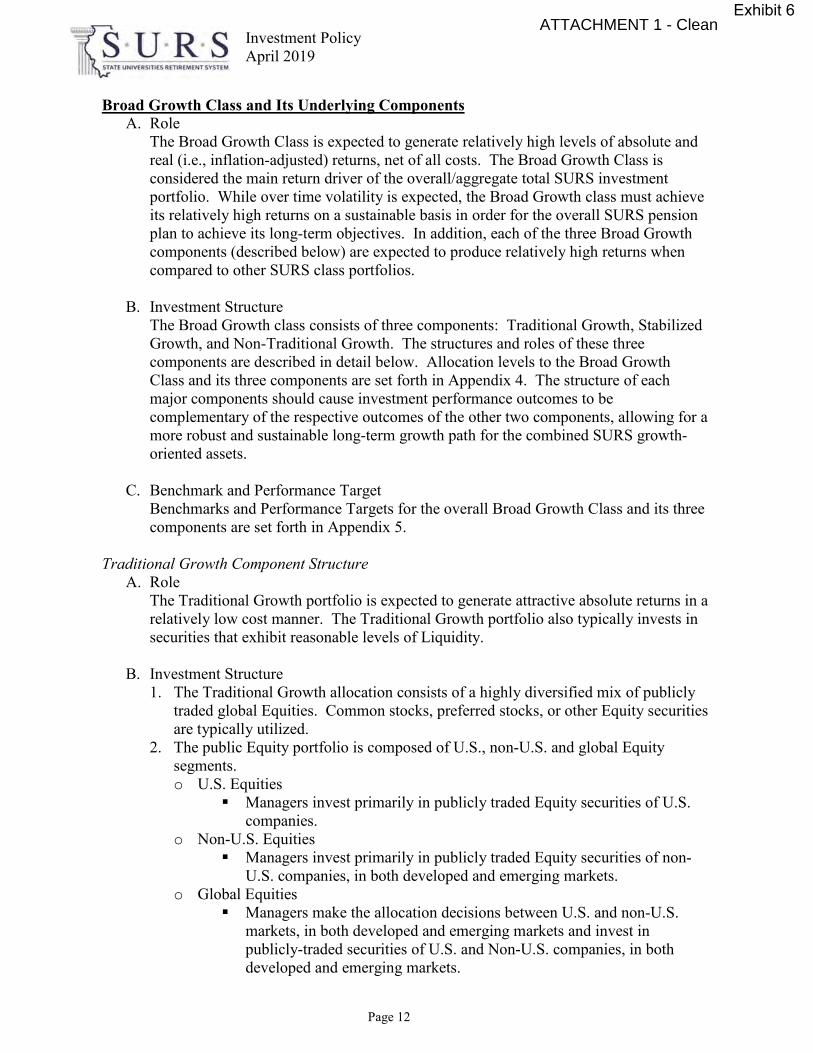
Broad Growth Class and Its Underlying Components A. Role
The Broad Growth Class is expected to generate relatively high levels of absolute and real (i.e., inflation-adjusted) returns, net of all costs. The Broad Growth Class is considered the main return driver of the overall/aggregate total SURS investment portfolio. While over time volatility is expected, the Broad Growth class must achieve its relatively high returns on a sustainable basis in order for the overall SURS pension plan to achieve its long-term objectives. In addition, each of the three Broad Growth components (described below) are expected to produce relatively high returns when compared to other SURS class portfolios.
B. Investment Structure The Broad Growth class consists of three components: Traditional Growth, Stabilized Growth, and Non-Traditional Growth. The structures and roles of these three components are described in detail below. Allocation levels to the Broad Growth Class and its three components are set forth in Appendix 4. The structure of each major components should cause investment performance outcomes to be complementary of the respective outcomes of the other two components, allowing for a more robust and sustainable long-term growth path for the combined SURS growth-oriented assets.
C. Benchmark and Performance Target Benchmarks and Performance Targets for the overall Broad Growth Class and its three components are set forth in Appendix 5.
Traditional Growth Component Structure
A. Role The Traditional Growth portfolio is expected to generate attractive absolute returns in a relatively low cost manner. The Traditional Growth portfolio also typically invests in securities that exhibit reasonable levels of Liquidity.
B. Investment Structure
1. The Traditional Growth allocation consists of a highly diversified mix of publicly traded global Equities. Common stocks, preferred stocks, or other Equity securities are typically utilized.
2. The public Equity portfolio is composed of U.S., non-U.S. and global Equity segments. o U.S. Equities
Managers invest primarily in publicly traded Equity securities of U.S. companies.
o Non-U.S. Equities Managers invest primarily in publicly traded Equity securities of non-
U.S. companies, in both developed and emerging markets. o Global Equities
Managers make the allocation decisions between U.S. and non-U.S. markets, in both developed and emerging markets and invest in publicly-traded securities of U.S. and Non-U.S. companies, in both developed and emerging markets.
ATTACHMENT 1 - Clean
ATTACHMENT 1 - CleanATTACHMENT 1 - CleanATTACHMENT 1 - Clean
Exhibit 6

Investment Policy April 2019
Page 13
3. Allocation The allocations to the above subcomponents of the Traditional Growth portfolio are overseen and managed by Staff. To ensure consistency with investment policy, overall regional allocations (e.g., the allocation proportion to the U.S. versus non-U.S. regions and/or developed vs. emerging markets, etc.) of the Traditional Growth portfolio will be assessed versus the commensurate proportional allocation levels exhibited within the MSCI ACWI IMI Index, the benchmark for the overall Traditional Growth portfolio. Taking these considerations into account, Staff has discretion to manage the allocation levels among the above three portfolio segments.
4. Assets may be held in Commingled Funds or privately managed Separate Accounts.
5. Use of leverage will be controlled as appropriate in the Manager’s Guidelines. 6. Implementation of the Traditional Growth portfolio is via a combination of Active
Management and Passive Management. Allocation to active and passive mandates takes market efficiency into account across and/or within the above three major Traditional Growth segments.
C. Benchmarks and Performance Targets
Benchmarks and Performance Targets for the Traditional Growth portfolio and its three subcomponents are set forth in Appendix 5. Benchmarks and Performance Targets for specific subcomponent, sector, style, and/or manager portfolios will be established to ensure consistency with both the overall Traditional Growth benchmark as well as the specific subcomponent benchmark under which the portfolio resides.
Stabilized Growth Component and Its Underlying Sub-Components
D. Role The Stabilized Growth Component is expected earn Risk-Adjusted returns in excess of the Traditional Growth Component, primarily as a result of (i) achieving absolute return levels that are near-or-equivalent to those achieved by the Traditional Growth component while also (ii) achieving lower volatility (risk) over a full investment cycle, particularly during Traditional Growth bear markets.
E. Investment Structure The Stabilized Growth component consists of three sub-components: Options Strategies, Credit, and Real Assets. The structures of these three sub-components are described below. Allocation levels to the Stabilized Growth component and its three sub-components are set forth in Appendix 4.
F. Benchmark and Performance Target Benchmarks and Performance Targets for the overall Stabilized Growth component and its three sub-components are set forth in Appendix 5.
ATTACHMENT 1 - CleanExhibit 6

Stabilized Growth Sub-Components: I. Options Strategies Structure
A. Role The Options Strategies portfolio is expected to provide similar, but higher Risk-Adjusted Returns than public equity. This expectation should be due to these strategies (i) producing compound returns that are modestly below traditional long-only public equities over a full investment cycle while (ii) also incurring significantly lower volatility than long-only public equity. In addition, Options Strategies produce a return pattern that is significantly different from traditional public equity over time – specifically, periodic outlying returns should be reduced. In summary, Options Strategies are utilized to achieve downside protection and risk mitigation to the overall SURS Portfolio (and, in particular the traditional public equity portfolio).
B. Investment Structure
1. SURS has implemented its initial Options Strategies through direct allocations to multiple managers that exhibit specific expertise in this strategy.
2. The aggregate Options Strategies portfolio consists of managers that apply a limited range of collateral-supported options selling programs (i.e., (i) writing call options associated with a specified long position in an equity index fund or long positions of specified equity securities or (ii) writing index put options associated with a commensurate level of cash or very-near-cash collateral).
3. The Options Strategies portfolio may seek to invest globally across U.S. and non-U.S. markets, replicating the general risk characteristics of industry-standard equity market indices.
4. Within the portfolio, the account structure utilized may be a blend of separate account(s) and fund(s), depending on the assigned strategy/mandate.
5. Leverage is not typically employed in Options Strategies. Any degree of leverage requires SURS Board approval.
6. Implementation of the Options Strategies portfolio is via Active Management.
C. Benchmarks and Performance Targets Benchmarks and Performance Targets for the Hedged Strategies portfolio are set forth in Appendix 5.
II. Credit Structure
A. Role The public credit portfolio is expected to provide income, yield and diversification to the total Portfolio due to a moderate correlation with other Asset Classes. In addition, the public Credit portfolio is expected to provide return, a source of Liquidity, and positive returns relative to an appropriate performance Benchmark.
ATTACHMENT 1 - CleanExhibit 6

B. Investment Structure 1. The Credit allocation consists of a diversified mix of publicly traded Credit
securities, invested across multiple asset types. o Quality standards, such as credit, concentration, duration, liquidity, etc., will be
specifically set forth in each Manager’s Guidelines, as applicable. In the event a security no longer meets the quality standards referenced above, the Manager may continue to hold such security if it believes doing so is in the best interest of SURS. The Manager shall provide written justification of the action to Staff [and Consultant] as soon as practicable.
2. The public credit portfolio is composed of Global Investment Grade, High Yield, Global Bank Loans and Emerging Market Debt (“EMD”) segments. o Global Investment Grade
Managers may invest primarily in global investment grade securities of corporation and governmental agencies.
Global Investment Grade is defined as those with a rating of at least “BBB-” or equivalent by two or more of the credit rating agencies.
o High Yield Managers are permitted to invest in high yield bonds with an
understanding that these bonds provide greater risk, potential for capital loss but with greater potential yield/return.
High Yield bonds are defined as those that are rated lower than “BBB-” by at least one of the credit rating agencies.
o Global Bank Loans Managers may invest in global bank loan debt
o EMD Managers invest in Investment Grade corporate and high yield debt
securities of emerging market countries, in both U.S. dollar and local currency terms, providing additional diversification and opportunities for higher yield.
3. Allocation o The policy targets for the subcomponents of the portfolio are set forth in
Appendix 4. 4. Assets may be held in Commingled Funds or privately managed Separate
Accounts. 5. Use of leverage and short sales will be controlled as appropriate in the Manager’s
Guidelines. 6. Implementation of the Credit portfolio is via Active Management.
C. Benchmarks and Performance Targets
Benchmarks and Performance Targets for subcomponents of the Fixed Income portfolio are set forth in Appendix 5.
III. Real Assets Structure
A. Role The Real Asset portfolio is expected to generate attractive Risk-Adjusted Returns through stable income and the opportunity for capital appreciation, while providing diversification to the overall Portfolio.
ATTACHMENT 1 - Clean
ATTACHMENT 1 - Clean
Exhibit 6

Investment Policy April 2019
Page 16
B. Investment Structure 1. The Real Asset allocation consists of Core Real Estate and Core/Core-Plus
Infrastructure.
o Core Real Estate Core Real Estate Managers typically invest in properties that are well
located and well leased with strong quality tenants. Core investments provide stable income with lower volatility.
o Core Infrastructure Funds typically invest in a variety of assets in the transportation,
power/utilities, midstream energy, ports, communications, and waste management sectors globally. Core investments should exhibit low-to-moderate levels of leverage, both income and appreciation return orientation, emphasis on return/investment stability, etc.
o Core-Plus Infrastructure Funds typically invest in a variety of assets in the transportation,
power/utilities, midstream energy, ports, communications, and waste management sectors, but may exhibit some level of sector-specific expertise or capability. Core-plus investments typically exhibit moderate levels of leverage, both income and appreciation return orientation, emphasis on return/investment stability, etc. Core-plus infrastructure may have modestly higher return expectations than core infrastructure.
2. Allocation o The minimum policy allocation for the Core Real Estate and Infrastructure
subcomponents is 50% of Real Assets component. 3. The account structure for Core Real Estate and Infrastructure is typically either
Open-end Funds or Closed-end Funds. SURS may also participate through Fund-of-Funds structures, which provide further Manager diversification and the opportunity for co-investment and secondary fund opportunities.
4. Leverage is an inherent component of Real Assets investing and levels are generally determined on a fund-level basis. Leverage levels in Real Assets are typically lower than those for Non-Core Real Assets.
5. The Real Assets portfolio is implemented via Active Management. SURS will seek to diversify the portfolio by utilizing various Managers and limiting a Manager’s concentration within the portfolio. Subject to Emerging Investment Manager and MFDB Utilization Goals and Board exception, concentration limits are set forth in Appendix 4. The optimal number of investment vehicles in the portfolio and their vintage year exposure varies with market opportunities and will be evaluated as part of the Real Assets Strategic Plan and Pacing Model developed by Staff and Consultants.
C. Benchmarks and Performance Targets Benchmarks and Performance Targets for subcomponents of the Real Assets portfolio are set forth in Appendix 5.
ATTACHMENT 1 - CleanExhibit 6
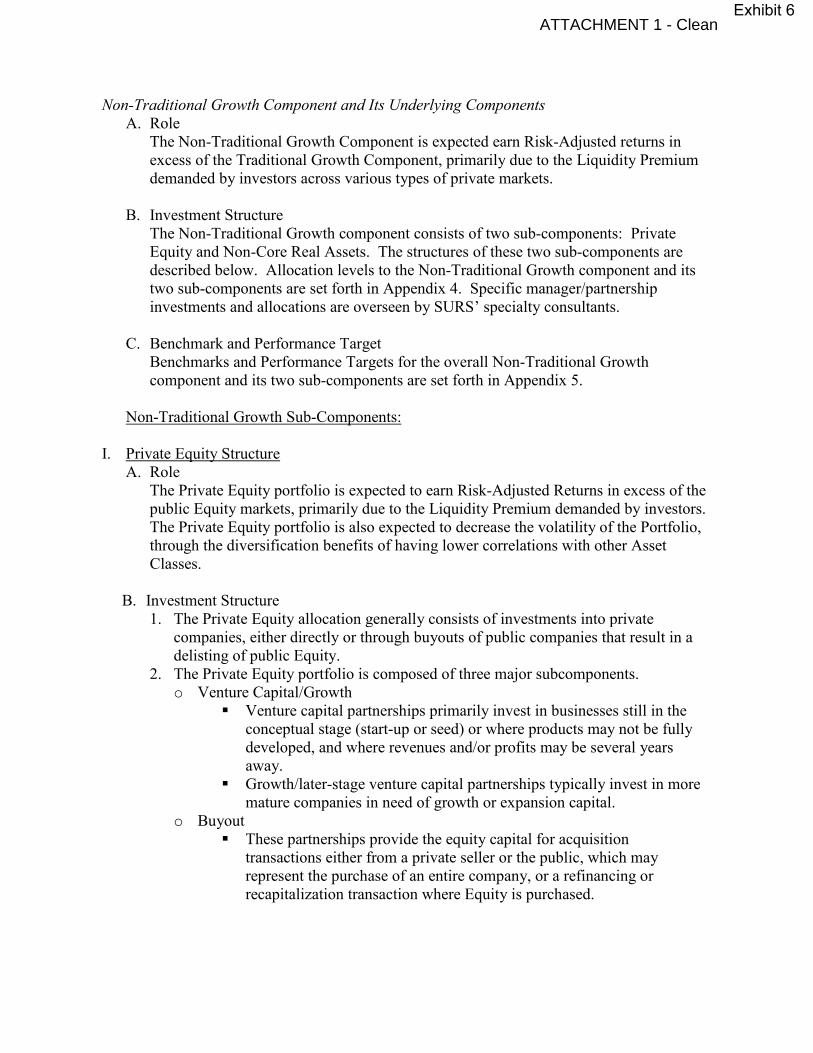
Non-Traditional Growth Component and Its Underlying Components A. Role
The Non-Traditional Growth Component is expected earn Risk-Adjusted returns in excess of the Traditional Growth Component, primarily due to the Liquidity Premium demanded by investors across various types of private markets.
B. Investment Structure The Non-Traditional Growth component consists of two sub-components: Private Equity and Non-Core Real Assets. The structures of these two sub-components are described below. Allocation levels to the Non-Traditional Growth component and its two sub-components are set forth in Appendix 4. Specific manager/partnership investments and allocations are overseen by SURS’ specialty consultants.
C. Benchmark and Performance Target Benchmarks and Performance Targets for the overall Non-Traditional Growth component and its two sub-components are set forth in Appendix 5.
Non-Traditional Growth Sub-Components:
I. Private Equity Structure
A. Role The Private Equity portfolio is expected to earn Risk-Adjusted Returns in excess of the public Equity markets, primarily due to the Liquidity Premium demanded by investors. The Private Equity portfolio is also expected to decrease the volatility of the Portfolio, through the diversification benefits of having lower correlations with other Asset Classes.
B. Investment Structure
1. The Private Equity allocation generally consists of investments into private companies, either directly or through buyouts of public companies that result in a delisting of public Equity.
2. The Private Equity portfolio is composed of three major subcomponents. o Venture Capital/Growth
Venture capital partnerships primarily invest in businesses still in the conceptual stage (start-up or seed) or where products may not be fully developed, and where revenues and/or profits may be several years away.
Growth/later-stage venture capital partnerships typically invest in more mature companies in need of growth or expansion capital.
o Buyout These partnerships provide the equity capital for acquisition
transactions either from a private seller or the public, which may represent the purchase of an entire company, or a refinancing or recapitalization transaction where Equity is purchased.
ATTACHMENT 1 - CleanExhibit 6

o Other Mezzanine/subordinated debt partnerships provide the intermediate
capital between Equity and senior debt in a buyout or refinancing transaction.
Restructuring/distressed debt partnerships typically make new investments in financially or operationally troubled companies, often for a control position, with a view to improving the balance sheet and operations for a subsequent sale.
Special situations partnerships include organizations with a specific industry focus or transaction type not covered by the other subclasses mentioned above, or unique opportunities that fall outside such subclasses.
3. Allocation o The Private Equity portfolio shall be diversified by time, subclass, and
geography. o Such diversification is expected to enhance returns, control risk, and reduce
volatility. 4. The account structure is typically in funds. SURS currently participates through a
Fund-of-Funds structure, which provides Manager diversification and the opportunity for co-investment and secondary fund opportunities.
5. Leverage may be present in Private Equity investments, most commonly in buyout partnerships. Levels are generally determined on a fund-level basis.
6. Implementation of the Private Equity portfolio is via Active Management. C. Benchmarks and Performance Targets
Benchmarks and Performance Targets for the Private Equity portfolio are set forth in Appendix 5.
II. Non-Core Real Asset Structure A. Role
The Non-Core Real Asset portfolio is expected to earn Risk-Adjusted Returns in excess of the public Equity markets, primarily due to re-positioning and development of real asset projects, the use of leverage, and to a Liquidity Premium demanded by investors. At the margin, the Non-Core Real Asset portfolio is also expected to diversify the broader Non-Traditional Growth Portfolio, which also includes Private Equity (see above).
B. Investment Structure
1. Non-Core Real Asset investments provide access to opportunities for higher returns by investing (typically with the use of leverage) in assets in need of re-tenanting, development, re-development, operational improvements, or renovation, or are otherwise in some form of distress, exhibit sub-optimal capital structures, or experiencing market dislocation(s). They may also be located in emerging/non-institutional market segments and/or product/asset types. Such investment may utilize more aggressive financial structures in order to raise the return/risk profile, emphasize capital appreciation, and exhibit relatively high return objectives.
2. The Non-Core Real Asset portfolio may consist of equity or debt investments in real estate, infrastructure, agriculture, energy-related investments, or timberland.
ATTACHMENT 1 - CleanExhibit 6

3. Allocation o The Non-Core Real Asset portfolio shall be diversified by time, subclass, and
geography. o Such diversification is expected to enhance returns, control risk, and reduce
volatility. 4. The account structure is typically in funds. SURS may also consider investments
through a Fund-of-Funds structure, which provides Manager diversification and the opportunity for co-investment and secondary fund opportunities.
5. Leverage is typically present in Non-Core Real Asset investments. Levels are generally determined on a fund-level basis.
6. Implementation of the Non-Core Real Asset portfolio is via Active Management.
C. Benchmarks and Performance Targets Benchmarks and Performance Targets for the Non-Core Real Asset portfolio are set forth in Appendix 5.
Principal Protection Class Structure
A. Role The principal protection portfolio is expected to provide a modest absolute return, be an anchor to the overall portfolioand significant diversification to the total Portfolio due to low correlation with other Asset Classes. In addition, the principal protection portfolio is expected to provide capital preservation, a source of Liquidity, lower volatility and competitive returns relative to an appropriate performance Benchmark.
B. Investment Structure
1. The principal protection allocation consists of a diversified mix of publicly traded Fixed Income securities, invested across multiple asset types. o Quality standards, such as credit, concentration, duration, liquidity, etc., will be
specifically set forth in each Manager’s Guidelines, as applicable. In the event a security no longer meets the quality standards referenced above, the Manager may continue to hold such security if it believes doing so is in the best interest of SURS. The Manager shall provide written justification of the action to Staff [and Consultant] as soon as practicable.
2. The principal protection portfolio is composed largely of Treasuries, Agency backed mortgage securities, and other agency backed bonds., o Mortagage Backed Securities - Agency
Managers invest primarily in Mortgage backed Securities (MBS) issued by the U.S. government agencies (Fannie Mae, Freddie Mac, or Ginnie Mae).
o Treasuries Managers invest in treasury securities of the U.S. government.
o Other Managers may invest in other high quality segments as clarified in
manager specific guidelines, however these must be Investment Grade credit that is rated “BBB” or higher by two or more of the credit rating agencies
ATTACHMENT 1 - CleanExhibit 6

3. Allocation o The policy targets for the subcomponents of the portfolio are set forth in
Appendix 4. 4. Assets may be held in Commingled Funds or privately managed Separate
Accounts. 5. Use of leverage and short sales will be controlled as appropriate in the Manager’s
Guidelines. 6. Implementation of the Principal Protection portfolio is primarily via Active
Management..
C. Benchmarks and Performance Targets Benchmarks and Performance Targets for subcomponents of the Fixed Income portfolio are set forth in Appendix 5.
Inflation Sensitive Class Structure A. Role
The Inflation Sensitive portfolio is expected to provide the portfolio with a hedge against structural and unanticipated inflation. In addition, the inflation sensitive portfolio is expected to provide competitive returns relative to an appropriate performance Benchmark. Quality standards, such as credit, concentration, duration, liquidity, etc., will be
specifically set forth in each Manager’s Guidelines, as applicable. In the event a security no longer meets the quality standards referenced above, the Manager may continue to hold such security if it believes doing so is in the best interest of SURS. The Manager shall provide written justification of the action to Staff [and Consultant] as soon as practicable.
B. Investment Structure
The Inflation Sensitive Class consists of two component portfolios: Treasury Inflation Protected Securities and Commodities: Treasury Inflation Protected Securities – “TIPS” The inflation sensitive allocation consists of Treasury Inflation Protection
Securities (“TIPS”). Implementation of the TIPS portfolio is currently via Passive Management.
Commodities 1. The Commodities portfolio consists primarily of liquid positions in Commodity
Options, Futures, Swaps, and other financial instruments that provide direct or indirect exposure to Commodity markets. As collateral for the Commodity positions, cash, cash equivalents and other Fixed Income instruments may be held as required by exchanges or counterparties.
ATTACHMENT 1 - CleanExhibit 6

2. The Commodities portfolio is composed of Long-Only and Long/Short segments. o Long-Only
Long-only strategies manage Commodities through key value drivers, including term structure weighting, optimal roll yield, and tactical allocation among different sectors and individual commodities. Some long-only Managers pursue strategies that equalize risk among the four primary commodity complexes: precious metals, industrial metals, energy, and agriculture/livestock. Long-only strategies are expected to provide Beta exposure consistent with applicable Benchmarks.
o Long/Short Long/short Managers have an absolute return objective, whereby they can
invest in both long and short commodities positions depending on market conditions. The Beta of long/short strategies tends to be quite low compared to the applicable Benchmark. Long/short Managers may invest in Commodities not typically represented in traditional Commodities’ Benchmarks.
3. Diversification While the Commodities portfolio’s positions are generally expected to be held across Commodity sectors, exposure to a particular Commodity sector (or to a particular Commodity within such sector) may be concentrated.
4. Within the portfolio, commitments have been made via a fund structure. 5. Leverage may be present in Commodities portfolios and is determined on a fund-
level basis. 6. Implementation of the commodities portfolio is currently via Active Management.
C. Benchmarks and Performance Targets
Benchmarks and Performance Targets for the Inflation Sensitive Class and its two component portfolios are set forth in Appendix 5.
Crisis Risk Offset Class Structure A. Role
The Crisis Risk Offset (CRO) portfolio is expected to produce significant positive returns during an extended recessionary-type equity market crisis, while maintaining purchasing power during more normal market environments. In this respect, the CRO portfolio is expected to enhance the long-term risk-adjusted performance of the Total Portfolio, by substantially mitigating significant drawdowns that the Total Portfolio might experience.
B. Investment Structure
1. The CRO allocation generally consists of investments in highly-liquid portfolios that are meant to capture key risk premia that should prove largely beneficial during an equity-related market crisis. Along these lines, the underlying investments and strategies may utilize both long positions and short-selling positions to capture the desired return patterns/behavior.
ATTACHMENT 1 - CleanExhibit 6

2. The CRO portfolio is composed of three major subcomponents. a. Long U.S. Treasury Duration
i. U.S.Treasuries represent the leading “flight-to-quality” investment since they are backed by the U.S. Government. The U.S. Dollar (the base denomination of U.S. Treasuries) is also considered the world’s highest-quality reserve currency.
ii. Exposure to U.S. Treasury Duration can take place via cash markets (i.e., actual bonds) or the futures markets (virtual bond proxies).
b. Systematic Trend Following i. Long-short portfolios utilizing derivatives-based instruments to capture
both periodic appreciation and periodic depreciation trends that evolve and dissipate across a very wide array of liquid global markets. Risk/volatility is calibrated to a pre-determined level derivatives-based leverage.
ii. Assets will be invested in highly liquid underlying securities (cash, futures, forwards, etc.), allowing for relatively rapid access for rebalancing and liquidity purposes.
iii. In order to appropriately calibrate the expected volatility of this component and the overall CRO class, significant levels of derivatives-based leverage may be applied. Effects of leverage are adjusted daily through market-based exchanges/facilities, ensuring appropriate and timely mark-to-market valuations.
c. Alternative Risk Premia i. Long-short portfolios utilizing both cash and derivatives-based
instruments to capture well-researched/documented non-market risk premiums (e.g., momentum, carry, value, low-volatility, etc.) on a continuous basis, utilizing an array of liquid global markets. Risk/volatility is calibrated to a pre-determined level utilizing cash and derivatives-based leverage.
ii. Assets will be invested in highly liquid underlying securities (cash, stocks, futures, forwards, etc.), allowing for relatively rapid access for rebalancing and liquidity purposes.
iii. Strategies should be designed to exhibit “market-neutral” outcomes, exhibiting lack of relationship with the major market-based risk premia (e.g., equity risk premia, duration risk premia).
3. Allocation to Subcomponents a. Capital allocation ranges to the various subcomponents will be as follows:
i. 30%-40% - Long Duration ii. 30%-40% - Systematic Trend Following (STF)
iii. 25%-35% - Alternative Risk Premia (ARP) b. Assuming the capital weights above are consistently maintained, it is highly
likely that the volatility associated with the Systematic Trend Following component will contribute the most to overall CRO class volatility over time.
4. Fund account structures (versus separate accounts) will be emphasized in the STF and ARP subcomponents. Use of fund account structures will likely reduce the monitoring, accounting, and administrative burdens of these relatively unconstrained and dynamic strategies.
ATTACHMENT 1 - CleanExhibit 6

Investment Policy April 2019
Page 23
5. Derivatives-based leverage will be utilized significantly across these strategies. Leveraged positions are typically adjusted on a daily basis to conform to pre-established guidelines (see below).
6. Implementation of the CRO portfolio will utilize both replication (passive) and active management where deemed appropriate and prudent within each subcomponent.
C. Risk Profile of CRO Class and its Subcomponents a. The aggregate CRO class has a total risk (standard deviation) range/budget set at a
level to effectively counterbalance the volatility experienced in the SURS portfolio’s major growth-oriented components:
i. Lower risk level limit (annualized standard deviation): 8% ii. Upper risk level limit (annualized standard deviation): 15%
If the behavior of the CRO class causes its recent historical volatility to deviate significantly beyond these limits, then a rebalancing process and/or target volatility adjustment should occur among the CRO managers based on recent risk profiles of each manager/component as well as on prospective risk views for each manager/component.
2. The expected volatility ranges for the three components are shown below: Risk Budget Ranges – CRO Components (% of Net Asset Value)
Component
Annualized Volatility Expectation
Long Duration Capture 12% - 20% Systematic Trend Following 10% - 20% Alternative Risk Premia 8% - 15%
While the expected volatility ranges for each subcomponent are high relative to the expected risk budget level of the aggregate CRO class, the diversifiying aspects of each subcomponent (and its underlying manager(s)) will combine to reduce volatility at the aggregate class level.
D. Benchmarks and Performance Targets Benchmarks and Performance Targets for the CRO portfolio are set forth in Appendix 5.
Opportunity Fund Structure A. Role
The Opportunity Fund portfolio is designed to allow flexibility for opportunistic investment. Investments in the Opportunity Fund may be a one-time occurrence, such as investments capitalizing on a market dislocation. Successful investments that evolve into a more permanent opportunity may ultimately be transitioned into another Strategic Class with similar characteristics.
B. Investment Structure The structure of the Opportunity Fund is not fixed and may vary considerably over time.
C. Benchmark Benchmarks and Performance Targets for the Opportunity Fund portfolio will be established and set forth in Appendix 5 prior to implementation.
ATTACHMENT 1 - CleanExhibit 6

Investment Policy April 2019
Page 52
Appendix 4
Asset Allocation Policy Mix
Strategic Policy Target 10/1/2019-
7/1/2020
Long-Term Strategic Policy
Target
Broad Growth 81% Broad Growth 66%
Traditional Growth 47% Traditional Growth 25%
US Equity US Equity
Non-US Equity Non-US Equity
Global Equity Global Equity
Stabilized Growth 26% Stabilized Growth 26%
Real Assets** 6% Real Assets** 6%
Options Strategies 6% Options Strategies 6%
Credit*** 14% Credit*** 14%
Non-Traditional Growth 8% Non-Traditional Growth 15%
Private Equity 6% Private Equity 11%
Non-Core Real Assets 2% Non-Core Real Assets 4%
Inflation Sensitive 6% Inflation Sensitive 6%
TIPS TIPS
Commodities Commodities
Principal Protection 8% Principal Protection 8%
CRO 5% CRO 20%
Opportunity Fund 0% Opportunity Fund 0%
Total 100% Total 100%
**Includes Real Assets and Infrastructure investments.
***Credit will include EMD, HY, Loans, Invest. Grade, and other income-driven strategies. 1. No Open-end Fund may represent more than 30% of Core Real Estate portfolio.
1. No Non-Core Real Estate Fund may represent more than 10% of the Non-Core Fund commitments.
2. No single manager may represent more than 40% of the combined Real Asset and Non-Core Real Asset target allocation
4. Allocation to the Opportunity Fund class may not exceed 5%.
ATTACHMENT 1 - CleanExhibit 6

Investment Policy April 2019
Page 53
Appendix 5
Benchmarks and Active Manager Performance Targets As of 3-31-19
ASSET CLASS POLICY MIX
BENCHMARK PERFORMANCE
TARGET
Total Broad GrowthAggregate Blend of Blends Traditional Growth MSCI ACWI IMI
U.S. Equity Dow Jones U. S. Total Stock Market Index BM+0.50% Non-U.S. Equity MSCI ACWI Ex-US IMI BM+2.0% Global Equity MSCI ACWI IMI BM+2.0%
Stabilized Growth Blend
Options Strategies Blend of two benchmarks: Bench 1: [25% CBOE S&P 500 PutWrite / 25%
CBOE S%P 500 BuyWrite / 25% MSCI ACWI ex US ND / 25% 3-month T-bill]
Bench 2: [CBOE S&P 500 PutWrite]
BM%
Total Credit 25%IG+30%HY+30%EMD+15%BL Blend BM + 0.50%
Investment Grade BB Global Agg Credit Index BM + 0.50%
High Yield BB Global High Yield BM + 0.50%
Emerging Market Debt (EMD) 50 % JPM Gov. Bond Index - EM Global Div. + 25% JPM EM Bond Index - Global Diversified +
25% JPM Corp. EM Bond Index - Broad BM + 0.50%
Bank Loans S&P LSTV Global Leveraged Loan BM + 0.50%
Real Assets Blend Core Real Estate NFI-ODCE Value Weight Net BM%
Infrastructure Weighted Average of the Underlying Investment
Benchmarks BM%
Non-Traditonal Growth Blend
Private Equity Dow Jones U.S. Total Stock Market Index Secondary Benchmarks may include: peer group
comparison, return multiple or public market equivalent comparisons.
BM+3.0%
Non-core Real Assets NFI-ODCE Value Weight Net BM+1.5% Principal Protection Bloomberg Barclays Intermediate Agg. Ex Credit BM% Total Inflation Sensitive Blend TIPS Barclays Capital U.S. TIPS Index BM+0.30% Commodities Bloomberg Commodity Index BM+1.0%
Total Crisis Risk Offset 35%LD+35%STF+30%ARP Blend BM Long Duration BB Long Government Index BM Systematic Trend Following CS Managed Futures (15%Vol) BM Alternative Risk Premia 90 Day Treasury Bills + 2.0% BM
Grand Total Policy Portfolio
ATTACHMENT 1 - CleanExhibit 6

Investment Policy April 2019
Page 54
Appendix 6
*Includes allocations to Principal Protection, Credit, Tips, and Long Duration
SURS Utilization Goals for Active Emerging Investment Managers
Aspirational Goals per 40 ILCS 5/1-109.1 Group Goal
Emerging Investment Managers Not less than 20% of Assets Under Management MFDB Managers Not less than 20% of Managers MFDB Managers Not less than 20% of Fees
Asset Class
Goal for Minorities
Goal for Females
Goal for Persons with a Disability
Overall Active Goal
Equities 20% 10% 0-2% 30% Fixed Income
(includesTIPS)* 12% 8% 0-1% 20%
Alternative Investments
0-20% of new allocations
0-20% of new allocations
0-20% of new allocations
20% of new allocations
Total Fund 16% 8% 1% 25%
ATTACHMENT 1 - CleanExhibit 6

Investment Policy April 2019
Page 55
Appendix 7
System Utilization Goals for Minority-owned Broker/Dealers
Asset Class Goal U.S. Equity 30.0% Non-U.S. Equity 20.0% Fixed Income 20.0%
ATTACHMENT 1 - CleanExhibit 6

Investment Policy April 2019
Page 56
Appendix 8
Manager(1) Utilization Goals for Minority-owned Broker/Dealers
ASSET CLASS
MINIMUM
EXPECTATION
ELIGIBLE TRADE
VOLUME
ELIGIBLE
COMMISSIONS Equity: U.S. Equity 30.0% X (1)(2) Non-U.S. Equity 20.0% X (1)(2)(3) Global Equity 20.0% X (1)(2)(3) Fixed Income*: (including TIPS) 20.0% X (1)(2)(3) Principal Protection, TIPS, and Long Duration 35.0% X(1)(2)(3) Credit 5.0% X(1)(2)(3)
*Includes allocations to Principal Protection, Credit, Tips, and Long Duration
‘(1) Separate account managers. ‘(2) Exception for electronic trading. ‘(3) Exception for emerging markets, as defined by Morgan Stanley Capital International.
ATTACHMENT 1 - CleanExhibit 6

Investment Policy April 2019
Page 11
VI. Portfolio Construction and Performance Benchmarks The Board has adopted Target Allocation Percentages in accordance with its Asset Strategic Allocation and Rebalancing strategy described in Section V. Within each Asset Strategic Class, the Board will determine the amount of such class that will be (i) managed internally vs. externally; (ii) managed actively vs. passively; (iii) allocated to a particular sub-class, sector or style, if any, and (iv) allocated to each approved Manager. Asset Strategic Class allocations will be reviewed annually in connection with the Target Allocation Percentage review. The choice of internal vs. external management shall be based on a periodic comparison of (i) the cost and availability of qualified Staff and systems support and (ii) the cost and availability of Managers. Currently, the Board makes exclusive use of external Managers. Active Management shall be considered for Asset Strategic Classes, sub-classes and styles of Marketable Securities (actively traded public Equity, public Fixed-income and Alternative markets), where empirical evidence shows that (i) a significant percentage (e.g. 25%) of Managers in such category (adjusted for survivorship) have consistently outperformed applicable Benchmarks for such category (net of fees) over a three (3), five (5) and ten (10) year period and (ii) that outperformance has been significant (e.g. greater than 50 basis points). For categories not meeting this threshold, and subject to SURS’ MFDB Manager Utilization Goals and Manager Diversity Program, Passive Management will be followed. For all non-actively traded public Equity, public Fixed-income and Alternative markets, Active Management will be used. Amounts allocated to a particular sector or style shall also be based on empirical evidence showing that (i) a significant percentage (e.g. 25%) of Managers in such sub-sector or style (adjusted for survivorship) have consistently outperformed applicable Benchmarks for such sub-sector or style (net of fees) over a three (3), five (5) and ten (10) year period and (ii) that outperformance has been significant (e.g. greater than 50 basis points). If such threshold is not met, no allocation to such sub-sector or style will be made. Amounts allocated to each Manager, within a AssetStrategic Class, sub-class, sector or style shall be based on: (i) the total dollar amount to be allocated to such category; (ii) the relative ongoing performance of applicable Managers; (iii) the unique attributes of such Manager’s investment style and potential benefits from diversification; and (iv) the overhead cost of managing the number of Managers within such category. Subject to SURS’ MFDB Manager Utilization Goals and Manager Diversity Program, the Board has a bias toward fewer Managers and more meaningful allocations. Managers selected by the Board will be given specific roles within each Asset Strategic Class, sub-class, sub-sectors, and styles, as applicable. These roles are specifically set forth for each firm as Manager Guidelines, established at the beginning of the relationship with SURS as part of the contract negotiation process. These guidelines cover such items as Benchmarks, permissible investments, use of leverage, obligor concentrations, currency denomination, etc. Staff and Consultant will be responsible for implementation of these guidelines, supervision of the Managers, performance monitoring and reporting. Updates will be provided to the Board or Investment Committee as requested, or as deemed necessary by Staff and Consultant.
ATTACHMENT 2 - RedlineExhibit 6

Investment Policy April 2019
Page 12
Broad Growth Class and Its Underlying Components A. Role
The Broad Growth Class is expected to generate relatively high levels of absolute and real (i.e., inflation-adjusted) returns, net of all costs. The Broad Growth Class is considered the main return driver of the overall/aggregate total SURS investment portfolio. While over time volatility is expected, the Broad Growth class must achieve its relatively high returns on a sustainable basis in order for the overall SURS pension plan to achieve its long-term objectives. In addition, each of the three Broad Growth components (described below) are expected to produce relatively high returns when compared to other SURS class portfolios.
B. Investment Structure The Broad Growth class consists of three components: Traditional Growth, Stabilized Growth, and Non-Traditional Growth. The structures and roles of these three components are described in detail below. Allocation levels to the Non-TraditionalBroad Growth Class and its twothree components are set forth in Appendix 4. The structure of each major components should cause investment performance outcomes to be complementary of the respective outcomes of the other two components, allowing for a more robust and sustainable long-term growth path for the combined SURS growth-oriented assets.
A.C. Benchmark and Performance Target Benchmarks and Performance Targets for the overall Broad Growth Class and its three components are set forth in Appendix 5.
Public EquityTraditional Growth Component Structure
A. Role The public EquityTraditional Growth portfolio is expected to generate attractive absolute returns in a relatively low cost manner. The public EquityTraditional Growth portfolio may also serve as a source oftypically invests in securities that exhibit reasonable levels of Liquidity.
B. Investment Structure
1. The public EquityTraditional Growth allocation consists of a highly diversified mix of publicly traded global Equities. Common stocks, preferred stocks, or other Equity securities are typically utilized.
2. The public Equity portfolio is composed of U.S., non-U.S. and global Equity segments. o U.S. Equities
Managers invest primarily in publicly traded Equity securities of U.S. companies.Certain Managers may utilize an exchange-traded, U.S. equity index options-based strategy.
o Non-U.S. Equities Managers invest primarily in publicly traded Equity securities of non-
U.S. companies, in both developed and emerging markets. o Global Equities
Managers make the allocation decisions between U.S. and non-U.S. companiesmarkets, in both developed and emerging markets and invest
ATTACHMENT 2 - RedlineExhibit 6

Investment Policy April 2019
Page 13
in publicly-traded securities of U.S. and Non-U.S. companies, in both developed and emerging markets.
3. Allocation The current policy targets forallocations to the above subcomponents of the public EquityTraditional Growth portfolio are set forth in Appendix 4 overseen and managed by Staff. To ensure consistency with investment policy, overall regional allocations (e.g., the allocation proportion to the U.S. versus non-U.S. regions and/or developed vs. emerging markets, etc.) of the Traditional Growth portfolio will be assessed versus the commensurate proportional allocation levels exhibited within the MSCI ACWI IMI Index, the benchmark for the overall Traditional Growth portfolio. Taking these considerations into account, Staff has discretion to manage the allocation levels among the above three portfolio segments.
4. Assets may be held in Commingled Funds or privately managed Separate Accounts.
5. Use of leverage will be controlled as appropriate in the Manager’s Guidelines. 6. Implementation of the public EquityTraditional Growth portfolio is via a
combination of Active Management and Passive Management. Passive Management is currently most prevalent in U.S. public Equities, which is a highly efficient market, but is also employed significantly in the non-U.S. Equity portfolio. The global Equity portfolio is currently implemented entirely via Active Management.Allocation to active and passive mandates takes market efficiency into account across and/or within the above three major Traditional Growth segments.
C. Benchmarks and Performance Targets
Benchmarks and Performance Targets for the Traditional Growth portfolio and its three subcomponents of the Equity portfolio are set forth in Appendix 5. Benchmarks and Performance Targets for specific subcomponent, sector, style, and/or manager portfolios will be established to ensure consistency with both the overall Traditional Growth benchmark as well as the specific subcomponent benchmark under which the portfolio resides.
Stabilized Growth Component and Its Underlying Sub-Components
D. Role The Stabilized Growth Component is expected earn Risk-Adjusted returns in excess of the Traditional Growth Component, primarily as a result of (i) achieving absolute return levels that are near-or-equivalent to those achieved by the Traditional Growth component while also (ii) achieving lower volatility (risk) over a full investment cycle, particularly during Traditional Growth bear markets.
E. Investment Structure The Stabilized Growth component consists of three sub-components: Options Strategies, Credit, and Real Assets. The structures of these three sub-components are described below. Allocation levels to the Non-TraditionalStabilized Growth component and its twothree sub-components are set forth in Appendix 4.
B.F. Benchmark and Performance Target
ATTACHMENT 2 - RedlineExhibit 6

Investment Policy April 2019
Page 14
Benchmarks and Performance Targets for the overall Stabilized Growth component and its three sub-components are set forth in Appendix 5.
Stabilized Growth Sub-Components:
I. Options Strategies Structure A. Role
The Options Strategies portfolio is expected to provide similar, but higher Risk-Adjusted Returns than public equity. This expectation should be due to these strategies (i) producing compound returns that are modestly below traditional long-only public equities over a full investment cycle while (ii) also incurring significantly lower volatility than long-only public equity. In addition, Options Strategies produce a return pattern that is significantly different from traditional public equity over time – specifically, periodic outlying returns should be reduced. In summary, Options Strategies are utilized to achieve downside protection and risk mitigation to the overall SURS Portfolio (and, in particular the traditional public equity portfolio).
B. Investment Structure 1. SURS has implemented its initial Options Strategies through direct allocations
to multiple managers that exhibit specific expertise in this strategy. 2. The aggregate Options Strategies portfolio consists of managers that apply a
limited range of collateral-supported options selling programs (i.e., (i) writing call options associated with a specified long position in an equity index fund or long positions of specified equity securities or (ii) writing index put options associated with a commensurate level of cash or very-near-cash collateral).
3. The Options Strategies portfolio may seek to invest globally across U.S. and non-U.S. markets, replicating the general risk characteristics of industry-standard equity market indices.
4. Within the portfolio, the account structure utilized may be a blend of separate account(s) and fund(s), depending on the assigned strategy/mandate.
5. Leverage is not typically employed in Options Strategies. Any degree of leverage requires SURS Board approval.
6. Implementation of the Options Strategies portfolio is via Active Management.
C. Benchmarks and Performance Targets Benchmarks and Performance Targets for the Hedged Strategies portfolio are set forth in Appendix 5. II. Credit Structure
A. Role The public credit portfolio is expected to provide income, yield and diversification to the total Portfolio due to a moderate correlation with other Asset Classes. In addition, the public Credit portfolio is expected to provide return, a source of Liquidity, and positive returns relative to an appropriate performance Benchmark.
B. Investment Structure
1. The Credit allocation consists of a diversified mix of publicly traded Credit securities, invested across multiple asset types.
ATTACHMENT 2 - RedlineExhibit 6
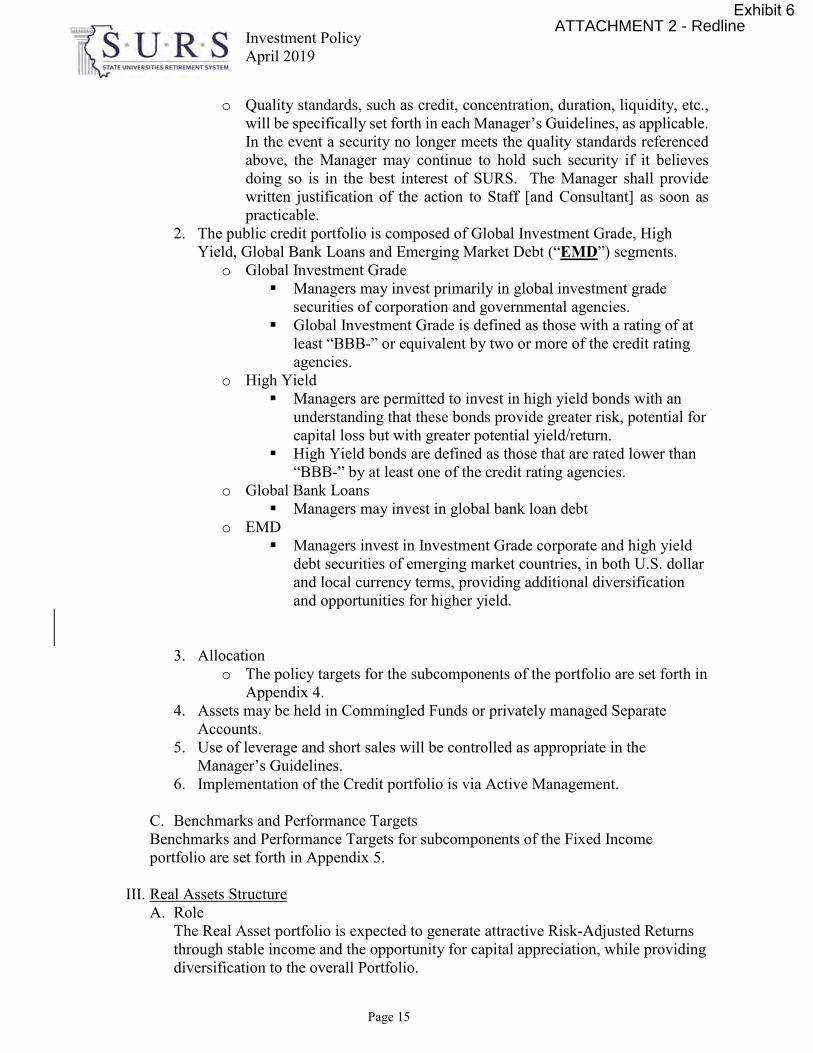
Investment Policy April 2019
Page 15
o Quality standards, such as credit, concentration, duration, liquidity, etc., will be specifically set forth in each Manager’s Guidelines, as applicable. In the event a security no longer meets the quality standards referenced above, the Manager may continue to hold such security if it believes doing so is in the best interest of SURS. The Manager shall provide written justification of the action to Staff [and Consultant] as soon as practicable.
2. The public credit portfolio is composed of Global Investment Grade, High Yield, Global Bank Loans and Emerging Market Debt (“EMD”) segments.
o Global Investment Grade Managers may invest primarily in global investment grade
securities of corporation and governmental agencies. Global Investment Grade is defined as those with a rating of at
least “BBB-” or equivalent by two or more of the credit rating agencies.
o High Yield Managers are permitted to invest in high yield bonds with an
understanding that these bonds provide greater risk, potential for capital loss but with greater potential yield/return.
High Yield bonds are defined as those that are rated lower than “BBB-” by at least one of the credit rating agencies.
o Global Bank Loans Managers may invest in global bank loan debt
o EMD Managers invest in Investment Grade corporate and high yield
debt securities of emerging market countries, in both U.S. dollar and local currency terms, providing additional diversification and opportunities for higher yield.
3. Allocation o The policy targets for the subcomponents of the portfolio are set forth in
Appendix 4. 4. Assets may be held in Commingled Funds or privately managed Separate
Accounts. 5. Use of leverage and short sales will be controlled as appropriate in the
Manager’s Guidelines. 6. Implementation of the Credit portfolio is via Active Management.
C. Benchmarks and Performance Targets Benchmarks and Performance Targets for subcomponents of the Fixed Income portfolio are set forth in Appendix 5.
III. Real Assets Structure
A. Role The Real Asset portfolio is expected to generate attractive Risk-Adjusted Returns through stable income and the opportunity for capital appreciation, while providing diversification to the overall Portfolio.
ATTACHMENT 2 - RedlineExhibit 6

Investment Policy April 2019
Page 16
B. Investment Structure
1. The Real Asset allocation consists of Core Real Estate and Core/Core-Plus Infrastructure.
o Core Real Estate Core Real Estate Managers typically invest in properties that are
well located and well leased with strong quality tenants. Core investments provide stable income with lower volatility.
o Core Infrastructure Funds typically invest in a variety of assets in the transportation,
power/utilities, midstream energy, ports, communications, and waste management sectors globally. Core investments should exhibit low-to-moderate levels of leverage, both income and appreciation return orientation, emphasis on return/investment stability, etc.
o Core-Plus Infrastructure Funds typically invest in a variety of assets in the transportation,
power/utilities, midstream energy, ports, communications, and waste management sectors, but may exhibit some level of sector-specific expertise or capability. Core-plus investments typically exhibit moderate levels of leverage, both income and appreciation return orientation, emphasis on return/investment stability, etc. Core-plus infrastructure may have modestly higher return expectations than core infrastructure.
2. Allocation o The minimum policy allocation for the Core Real Estate and
Infrastructure subcomponents is 50% of Real Assets component. 3. The account structure for Core Real Estate and Infrastructure is typically either
Open-end Funds or Closed-end Funds. SURS may also participate through Fund-of-Funds structures, which provide further Manager diversification and the opportunity for co-investment and secondary fund opportunities.
4. Leverage is an inherent component of Real Assets investing and levels are generally determined on a fund-level basis. Leverage levels in Real Assets are typically lower than those for Non-Core Real Assets.
5. The Real Assets portfolio is implemented via Active Management. SURS will seek to diversify the portfolio by utilizing various Managers and limiting a Manager’s concentration within the portfolio. Subject to Emerging Investment Manager and MFDB Utilization Goals and Board exception, concentration limits are set forth in Appendix 4. The optimal number of investment vehicles in the portfolio and their vintage year exposure varies with market opportunities and will be evaluated as part of the Real Assets Strategic Plan and Pacing Model developed by Staff and Consultants.
C. Benchmarks and Performance Targets
Benchmarks and Performance Targets for subcomponents of the Real Assets portfolio are set forth in Appendix 5.
ATTACHMENT 2 - RedlineExhibit 6

Investment Policy April 2019
Page 17
Non-Traditional Growth Component and Its Underlying Components A. Role
The Non-Traditional Growth Component is expected earn Risk-Adjusted returns in excess of the Traditional Growth Component, primarily due to the Liquidity Premium demanded by investors across various types of private markets.
B. Investment Structure The Non-Traditional Growth component consists of two sub-components: Private Equity and Non-Core Real AssetsEstate. The structures of these two sub-components are described below. Allocation levels to the Non-Traditional Growth component and its two sub-components are set forth in Appendix 4. Specific manager/partnership investments and allocations are overseen by SURS’ specialty consultants.
B.C. Benchmark and Performance Target Benchmarks and Performance Targets for the overall Non-Traditional Growth component and its two sub-components are set forth in Appendix 5.
Non-Traditional Growth Sub-Components:
I. Private Equity Structure
A. Role The Private Equity portfolio is expected to earn Risk-Adjusted Returns in excess of the public Equity markets, primarily due to the Liquidity Premium demanded by investors. The Private Equity portfolio is also expected to decrease the volatility of the Portfolio, through the diversification benefits of having lower correlations with other Asset Classes.
B. Investment Structure
1. The Private Equity allocation generally consists of investments into private companies, either directly or through buyouts of public companies that result in a delisting of public Equity.
2. The Private Equity portfolio is composed of three major subcomponents. o Venture Capital/Growth
Venture capital partnerships primarily invest in businesses still in the conceptual stage (start-up or seed) or where products may not be fully developed, and where revenues and/or profits may be several years away.
Growth/later-stage venture capital partnerships typically invest in more mature companies in need of growth or expansion capital.
o Buyout These partnerships provide the equity capital for acquisition
transactions either from a private seller or the public, which may represent the purchase of an entire company, or a refinancing or recapitalization transaction where Equity is purchased.
o Other
ATTACHMENT 2 - RedlineExhibit 6

Investment Policy April 2019
Page 18
Mezzanine/subordinated debt partnerships provide the intermediate capital between Equity and senior debt in a buyout or refinancing transaction.
Restructuring/distressed debt partnerships typically make new investments in financially or operationally troubled companies, often for a control position, with a view to improving the balance sheet and operations for a subsequent sale.
Special situations partnerships include organizations with a specific industry focus or transaction type not covered by the other subclasses mentioned above, or unique opportunities that fall outside such subclasses.
3. Allocation o The Private Equity portfolio shall be diversified by time, subclass, and
geography. o Such diversification is expected to enhance returns, control risk, and
reduce volatility. 4. The account structure is typically in funds. SURS currently participates
through a Fund-of-Funds structure, which provides Manager diversification and the opportunity for co-investment and secondary fund opportunities.
5. Leverage may be present in Private Equity investments, most commonly in buyout partnerships. Levels are generally determined on a fund-level basis.
6. Implementation of the Private Equity portfolio is via Active Management.
C. Benchmarks and Performance Targets Benchmarks and Performance Targets for the Private Equity portfolio are set forth in Appendix 5.
II. Non-Core Real Asset Structure
A. Role The Non-Core Real Asset portfolio is expected to earn Risk-Adjusted Returns in excess of the public Equity markets, primarily due to re-positioning and development of real asset projects, the use of leverage, and to a Liquidity Premium demanded by investors. At the margin, the Non-Core Real Asset portfolio is also expected to diversify the broader Non-Traditional Growth Portfolio, which also includes Private Equity (see above).
B. Investment Structure 1. Non-Core Real Asset investments provide access to opportunities for higher
returns by investing (typically with the use of leverage) in assets in need of re-tenanting, development, re-development, operational improvements, or renovation, or are otherwise in some form of distress, exhibit sub-optimal capital structures, or experiencing market dislocation(s). They may also be located in emerging/non-institutional market segments and/or product/asset types. Such investment may utilize more aggressive financial structures in order to raise the return/risk profile, emphasize capital appreciation, and exhibit relatively high return objectives.
ATTACHMENT 2 - RedlineExhibit 6

Investment Policy April 2019
Page 19
2. The Non-Core Real Asset portfolio may consist of equity or debt investments in real estate, infrastructure, agriculture, energy-related investments, or timberland.
3. Allocation o The Non-Core Real Asset portfolio shall be diversified by time, subclass,
and geography. o Such diversification is expected to enhance returns, control risk, and reduce
volatility. 4. The account structure is typically in funds. SURS may also consider
investments through a Fund-of-Funds structure, which provides Manager diversification and the opportunity for co-investment and secondary fund opportunities.
5. Leverage is typically present in Non-Core Real Asset investments. Levels are generally determined on a fund-level basis.
6. Implementation of the Non-Core Real Asset portfolio is via Active Management.
C. Benchmarks and Performance Targets Benchmarks and Performance Targets for the Non-Core Real Asset portfolio are set forth in Appendix 5.
Principal Protection Class Structure
A. Role The principal protection portfolio is expected to provide a modest absolute return, be an anchor to the overall portfolioand significant diversification to the total Portfolio due to low correlation with other Asset Classes. In addition, the principal protection portfolio is expected to provide capital preservation, a source of Liquidity, lower volatility and competitive returns relative to an appropriate performance Benchmark.
B. Investment Structure
1. The principal protection allocation consists of a diversified mix of publicly traded Fixed Income securities, invested across multiple asset types.
o Quality standards, such as credit, concentration, duration, liquidity, etc., will be specifically set forth in each Manager’s Guidelines, as applicable. In the event a security no longer meets the quality standards referenced above, the Manager may continue to hold such security if it believes doing so is in the best interest of SURS. The Manager shall provide written justification of the action to Staff [and Consultant] as soon as practicable.
2. The principal protection portfolio is composed largely of Treasuries, Agency backed mortgage securities, and other agency backed bonds.,
o Mortagage Backed Securities - Agency Managers invest primarily in Mortgage backed Securities (MBS)
issued by the U.S. government agencies (Fannie Mae, Freddie Mac, or Ginnie Mae).
o Treasuries Managers invest in treasury securities of the U.S. government.
o Other
ATTACHMENT 2 - RedlineExhibit 6

Investment Policy April 2019
Page 20
Managers may invest in other high quality segments as clarified in manager specific guidelines, however these must be Investment Grade credit that is rated “BBB” or higher by two or more of the credit rating agencies
3. Allocation o The policy targets for the subcomponents of the portfolio are set forth in
Appendix 4. 4. Assets may be held in Commingled Funds or privately managed Separate
Accounts. 5. Use of leverage and short sales will be controlled as appropriate in the Manager’s
Guidelines. 6. Implementation of the Principal Protection portfolio is primarily via Active
Management..
C. Benchmarks and Performance Targets Benchmarks and Performance Targets for subcomponents of the Fixed Income portfolio are set forth in Appendix 5.
Inflation Sensitive Class Structure A. Role
The Inflation Sensitive portfolio is expected to provide the portfolio with a hedge against structural and unanticipated inflation. In addition, the inflation sensitive portfolio is expected to provide competitive returns relative to an appropriate performance Benchmark.
o Quality standards, such as credit, concentration, duration, liquidity, etc., will be specifically set forth in each Manager’s Guidelines, as applicable. In the event a security no longer meets the quality standards referenced above, the Manager may continue to hold such security if it believes doing so is in the best interest of SURS. The Manager shall provide written justification of the action to Staff [and Consultant] as soon as practicable.
B. Investment Structure
The Inflation Sensitive Class consists of two component portfolios: Treasury Inflation Protected Securities and Commodities: Treasury Inflation Protected Securities – “TIPS” The inflation sensitive allocation consists of Treasury Inflation Protection
Securities (“TIPS”). Implementation of the TIPS portfolio is currently via Passive Management.
Commodities 1. The Commodities portfolio consists primarily of liquid positions in Commodity
Options, Futures, Swaps, and other financial instruments that provide direct or indirect exposure to Commodity markets. As collateral for the Commodity positions, cash, cash equivalents and other Fixed Income instruments may be held as required by exchanges or counterparties.
2. The Commodities portfolio is composed of Long-Only and Long/Short segments. o Long-Only
ATTACHMENT 2 - RedlineExhibit 6

Investment Policy April 2019
Page 21
Long-only strategies manage Commodities through key value drivers, including term structure weighting, optimal roll yield, and tactical allocation among different sectors and individual commodities. Some long-only Managers pursue strategies that equalize risk among the four primary commodity complexes: precious metals, industrial metals, energy, and agriculture/livestock. Long-only strategies are expected to provide Beta exposure consistent with applicable Benchmarks.
o Long/Short Long/short Managers have an absolute return objective, whereby they
can invest in both long and short commodities positions depending on market conditions. The Beta of long/short strategies tends to be quite low compared to the applicable Benchmark. Long/short Managers may invest in Commodities not typically represented in traditional Commodities’ Benchmarks.
3. Diversification While the Commodities portfolio’s positions are generally expected to be held across Commodity sectors, exposure to a particular Commodity sector (or to a particular Commodity within such sector) may be concentrated.
4. Within the portfolio, commitments have been made via a fund structure. 5. Leverage may be present in Commodities portfolios and is determined on a fund-
level basis. 6. Implementation of the commodities portfolio is currently via Active Management.
C. Benchmarks and Performance Targets
Benchmarks and Performance Targets for the Inflation Sensitive Class and its two component Commodities portfolios are set forth in Appendix 5.
Crisis Risk Offset Class Structure A. Role
The Crisis Risk Offset (CRO) portfolio is expected to produce significant positive returns during an extended recessionary-type equity market crisis, while maintaining purchasing power during more normal market environments. In this respect, the CRO portfolio is expected to enhance the long-term risk-adjusted performance of the Total Portfolio, by substantially mitigating significant drawdowns that the Total Portfolio might experience.
B. Investment Structure
1. The CRO allocation generally consists of investments in highly-liquid portfolios that are meant to capture key risk premia that should prove largely beneficial during an equity-related market crisis. Along these lines, the underlying investments and strategies may utilize both long positions and short-selling positions to capture the desired return patterns/behavior.
2. The CRO portfolio is composed of three major subcomponents. a. Long U.S. Treasury Duration
i. U.S.Treasuries represent the leading “flight-to-quality” investment since they are backed by the U.S. Government. The U.S. Dollar (the base denomination of U.S. Treasuries) is also considered the world’s highest-quality reserve currency.
ATTACHMENT 2 - RedlineExhibit 6

Investment Policy April 2019
Page 22
ii. Exposure to U.S. Treasury Duration can take place via cash markets (i.e., actual bonds) or the futures markets (virtual bond proxies).
b. Systematic Trend Following i. Long-short portfolios utilizing derivatives-based instruments to capture
both periodic appreciation and periodic depreciation trends that evolve and dissipate across a very wide array of liquid global markets. Risk/volatility is calibrated to a pre-determined level derivatives-based leverage.
ii. Assets will be invested in highly liquid underlying securities (cash, futures, forwards, etc.), allowing for relatively rapid access for rebalancing and liquidity purposes.
iii. In order to appropriately calibrate the expected volatility of this component and the overall CRO class, significant levels of derivatives-based leverage may be applied. Effects of leverage are adjusted daily through market-based exchanges/facilities, ensuring appropriate and timely mark-to-market valuations.
c. Alternative Risk Premia i. Long-short portfolios utilizing both cash and derivatives-based
instruments to capture well-researched/documented non-market risk premiums (e.g., momentum, carry, value, low-volatility, etc.) on a continuous basis, utilizing an array of liquid global markets. Risk/volatility is calibrated to a pre-determined level utilizing cash and derivatives-based leverage.
ii. Assets will be invested in highly liquid underlying securities (cash, stocks, futures, forwards, etc.), allowing for relatively rapid access for rebalancing and liquidity purposes.
iii. Strategies should be designed to exhibit “market-neutral” outcomes, exhibiting lack of relationship with the major market-based risk premia (e.g., equity risk premia, duration risk premia).
3. Allocation to Subcomponents a. Capital allocation ranges to the various subcomponents will be as follows:
i. 30%-40% - Long Duration ii. 30%-40% - Systematic Trend Following (STF)
iii. 25%-35% - Alternative Risk Premia (ARP) b. Assuming the capital weights above are consistently maintained, it is highly
likely that the volatility associated with the Systematic Trend Following component will contribute the most to overall CRO class volatility over time.
4. Fund account structures (versus separate accounts) will be emphasized in the STF and ARP subcomponents. Use of fund account structures will likely reduce the monitoring, accounting, and administrative burdens of these relatively unconstrained and dynamic strategies.
5. Derivatives-based leverage will be utilized significantly across these strategies. Leveraged positions are typically adjusted on a daily basis to conform to pre-established guidelines (see below).
6. Implementation of the CRO portfolio will utilize both replication (passive) and active management where deemed appropriate and prudent within each subcomponent.
ATTACHMENT 2 - RedlineExhibit 6

Investment Policy April 2019
Page 23
C. Risk Profile of CRO Class and its Subcomponents a. The aggregate CRO class has a total risk (standard deviation) range/budget set at a
level to effectively counterbalance the volatility experienced in the SURS portfolio’s major growth-oriented components:
i. Lower risk level limit (annualized standard deviation): 8% ii. Upper risk level limit (annualized standard deviation): 15%
If the behavior of the CRO class causes its recent historical volatility to deviate significantly beyond these limits, then a rebalancing process and/or target volatility adjustment should occur among the CRO managers based on recent risk profiles of each manager/component as well as on prospective risk views for each manager/component.
2. The expected volatility ranges for the three components are shown below:
Risk Budget Ranges – CRO Components (% of Net Asset Value) Component
Annualized Volatility Expectation
Long Duration Capture 12% - 20% Systematic Trend Following 10% - 20% Alternative Risk Premia 8% - 15%
While the expected volatility ranges for each subcomponent are high relative to the expected risk budget level of the aggregate CRO class, the diversifiying aspects of each subcomponent (and its underlying manager(s)) will combine to reduce volatility at the aggregate class level.
D. Benchmarks and Performance Targets Benchmarks and Performance Targets for the CRO portfolio are set forth in Appendix 5.
Opportunity Fund Structure A. Role
The Opportunity Fund portfolio is designed to allow flexibility for opportunistic investment. Investments in the Opportunity Fund may be a one-time occurrence, such as investments capitalizing on a market dislocation. Successful investments that evolve into a more permanent opportunity may ultimately be transitioned into another AssetStrategic Class with similar characteristics.
B. Investment Structure The structure of the Opportunity Fund is not fixed and may vary considerably over time.
C. Benchmark Benchmarks and Performance Targets for the Opportunity Fund portfolio will be established and are set forth in Appendix 5 prior to implementation.
ATTACHMENT 2 - RedlineExhibit 6

Investment Policy April 2019
Page 53
Appendix 4
Asset Allocation Policy Mix
Strategic Policy Target 10/1/2019-
7/1/2020
Long-Term Strategic Policy
Target
Broad Growth 81% Broad Growth 66%
Traditional Growth 47% Traditional Growth 25%
US Equity US Equity
Non-US Equity Non-US Equity
Global Equity Global Equity
Stabilized Growth 26% Stabilized Growth 26%
Real Assets** 6% Real Assets** 6%
Options Strategies 6% Options Strategies 6%
Credit*** 14% Credit*** 14%
Non-Traditional Growth 8% Non-Traditional Growth 15%
Private Equity 6% Private Equity 11%
Non-Core Real Assets 2% Non-Core Real Assets 4%
Inflation Sensitive 6% Inflation Sensitive 6%
TIPS TIPS
Commodities Commodities
Principal Protection 8% Principal Protection 8%
CRO 5% CRO 20%
Opportunity Fund 0% Opportunity Fund 0%
Total 100% Total 100%
**Includes Real Assets and Infrastructure investments.
***Credit will include EMD, HY, Loans, Invest. Grade, and other income-driven strategies. 1. No Open-end Fund may represent more than 30% of Core Real Estate portfolio.
1. No Non-Core Real Estate Fund may represent more than 10% of the Non-Core Fund commitments.
2. No single manager may represent more than 40% of the combined Real Asset and Non-Core Real Asset target allocation
4. Allocation to the Opportunity Fund class may not exceed 5%.
ATTACHMENT 2 - RedlineExhibit 6

Investment Policy April 2019
Page 53
Appendix 5
Benchmarks and Active Manager Performance Targets As of 3-31-19
ASSET CLASS POLICY MIX
BENCHMARK PERFORMANCE
TARGET
Total Broad GrowthAggregate Blend of Blends Traditional Growth BlendMSCI ACWI IMI
U.S. Equity Dow Jones U. S. Total Stock Market Index BM+0.50% Non-U.S. Equity MSCI ACWI Ex-US IMI BM+2.0% Global Equity MSCI All Country WorldACWI IMI BM+2.0%
Stabilized Growth Blend
Options Strategies Blend of two benchmarks: Bench 1: [25% CBOE S&P 500 PutWrite / 25%
CBOE S%P 500 BuyWrite / 25% MSCI ACWI ex US ND / 25% 3-month T-bill]
Bench 2: [CBOE S&P 500 PutWrite]
BM%
Total Credit 25%IG+30%HY+30%EMD+15%BL Blend BM + 0.50%
Investment Grade BB Global Agg Credit Index BM + 0.50%
High Yield BB Global High Yield BM + 0.50%
Emerging Market Debt (EMD) 50 % JPM Gov. Bond Index - EM Global Div. + 25% JPM EM Bond Index - Global Diversified +
25% JPM Corp. EM Bond Index - Broad BM + 0.50%
Bank Loans S&P LSTV Global Leveraged Loan BM + 0.50%
Real Assets Blend Core Real Estate NFI-ODCE Value Weight Net BM%
Infrastructure Weighted Average of the Underlying Investment
Benchmarks BM%
Non-Traditonal Growth Blend
Private Equity Dow Jones U.S. Total Stock Market Index Secondary Benchmarks may include: peer group
comparison, return multiple or public market equivalent comparisons.
BM+3.0%
Non-core Real Assets NFI-ODCE Value Weight Net BM+1.5% Principal Protection Bloomberg Barclays Intermediate Agg. Ex Credit BM% Total Inflation Sensitive Blend TIPS Barclays Capital U.S. TIPS Index BM+0.30% Commodities Bloomberg Commodity Index BM+1.0%
Total Crisis Risk Offset 35%LD+35%STF+30%ARP Blend BM Long Duration BB Long Government Index BM Systematic Trend Following CS Managed Futures (15%Vol) BM Alternative Risk Premia 90 Day Treasury Bills + 2.0% BM
Grand Total Policy Portfolio
ATTACHMENT 2 - RedlineExhibit 6

Investment Policy April 2019
Page 55
Appendix 6
*Includes allocations to Principal Protection, Credit, Tips, and Long Duration
SURS Utilization Goals for Active Emerging Investment Managers
Aspirational Goals per 40 ILCS 5/1-109.1 Group Goal
Emerging Investment Managers Not less than 20% of Assets Under Management MFDB Managers Not less than 20% of Managers MFDB Managers Not less than 20% of Fees
Asset Class
Goal for Minorities
Goal for Females
Goal for Persons with a Disability
Overall Active Goal
Equities 20% 10% 0-2% 30% Fixed Income
(includesTIPS)* 12% 8% 0-1% 20%
Alternative Investments
0-20% of new allocations
0-20% of new allocations
0-20% of new allocations
20% of new allocations
Total Fund 16% 8% 1% 25%
ATTACHMENT 2 - RedlineExhibit 6

Investment Policy April 2019
Page 56
Appendix 7
System Utilization Goals for Minority-owned Broker/Dealers
Asset Class Goal U.S. Equity 30.0% Non-U.S. Equity 1520.0% Fixed Income 20.0%
ATTACHMENT 2 - RedlineExhibit 6

Investment Policy April 2019
Page 57
Appendix 8
Manager(1) Utilization Goals for Minority-owned Broker/Dealers
ASSET CLASS
MINIMUM
EXPECTATION
ELIGIBLE TRADE
VOLUME
ELIGIBLE
COMMISSIONS Equity: Active U.S. Equity 30.0% X (1)(2) Passive U.S. Equity 35.0% X (1)(2) Structured Active U.S. Equity 20.0% X (1)(2) Non-U.S. Equity 1520.0% X (1)(2)(3) Global Equity 20.0% X (1)(2)(3) REITS 15.0% X (1)(2)(3) Fixed Income*: (including TIPS) 20.0% X (1)(2)(3) Principal Protection, TIPS, and Long Duration 35.0% X(1)(2)(3) Credit 5.0% X(1)(2)(3)
*Includes allocations to Principal Protection, Credit, Tips, and Long Duration
‘(1) Separate account managers. ‘(2) Exception for electronic trading. ‘(3) Exception for emerging markets, as defined by Morgan Stanley Capital International.
ATTACHMENT 2 - RedlineExhibit 6

September 2019
Fiscal Year 2020 Investment Plan
Exhibit 7

(This page intentionally left blank)
Exhibit 7

August 30, 2019 Board of Trustees State Universities Retirement System 1901 Fox Drive Champaign, IL 61820 RE: Fiscal Year 2020 Investment Plan Dear Board of Trustees: The Investment Staff is pleased to provide the SURS Investment Plan for Fiscal Year 2020. This document was developed in order to formalize the strategic plans for the investment portfolio for the coming year and provide transparency of the planning process. The Investment Plan for Fiscal Year 2020 marks the ninth year of the formal plan for the SURS investment program. The Investment Plan reviews the results of Fiscal Year 2019 and defines the strategy for Fiscal Year 2020 in accordance with the Board-approved asset-liability study and Investment Policy. Since financial markets are dynamic, revisions to the plan may be required and will be communicated to the Board in a timely manner. The SURS portfolio returned 6.01% during Fiscal Year 2019, net of fees, trailing the policy portfolio return of 6.85%. The Total Fund’s underperformance relative to the policy portfolio for Fiscal 2019 was due to a number of factors, including:
• An underweight to the fixed income asset class (one of the better performing asset classes); • A structural overweight to small-to-midcap U.S. equity securities; and • Underperformance by SURS’ active managers in the aggregate hedged strategies, U.S.
equity, and non-U.S. equity portfolios, and to a lesser extent, the direct real estate portfolio (on a time-weighted basis).
` From a long-term perspective, the SURS portfolio has performed well, earning an 8.1% annualized rate of return over the past 30 years, exceeding the 7.8% policy portfolio return. This return also exceeds the 8.0% average assumed rate of return in effect over the last 30 years and the current 6.75% assumed rate of return. When compared to a universe of other large public funds, the SURS return ranks in the second quartile (top half) for the one-year period and the third quartile for the three- and five year periods. SURS has a higher exposure to non-U.S. equity than many of its peers, which detracted from performance on a relative basis. The ten-year return ranks much more favorably, placing in or
Exhibit 7

near the top quartile for the period ending June 30, 2019. As of June 30, 2019, the defined benefit plan is valued at approximately $19.5 billion while the Self-Managed Plan (SMP) is valued at approximately $2.7 billion (including forfeiture and disability reserve assets). A key accomplishment during FY 2019 was the adoption of Investment Beliefs and the completion of an asset-liability (AL) study, with the assistance of SURS’ general investment consultant, Meketa Investment Group. The purpose of the asset allocation policy is to establish an Investment Policy framework for SURS with a high likelihood, in the Board’s judgment, of realizing SURS’ investment objective. Following approval of the AL study, staff and Meketa conducted an annual planning session, and initial implementation of the new structure commenced. Other key accomplishments during Fiscal Year 2019 include:
• Completion of real assets consultant search, resulting in the selection of Callan; • Completion of transition manager search; • Completion of private equity advisor search, resulting in the selection of TorreyCove
Capital Partners; • Initiation of search for recordkeeping and custom investment solution providers for the
SMP and the new supplemental defined contribution plan created in Public Act 100-0769; • Revision to procurement policy to fine-tune the specialty consultant section; • Consideration of non-core real estate strategies, resulting in commitments of €75 million
to a European real estate fund and up to total of $115 million to two other non-core real estate strategies;
• Implementation of additional commitments to the private equity portfolio in accordance with the pacing model approved in June 2017;
• Education on a number of topics relevant to the investment portfolio, including, but not limited to, the Crisis Risk Offset (CRO) class and defined contribution income solutions.
Numerous projects are planned for Fiscal Year 2020, including, but not limited to, the following:
• Continued implementation of the AL study approved by the Board in September 2018; • Review and revision of the Investment Policy Statement and Investment Procurement
Policy; • Continued implementation of non-traditional growth allocations; • Continued review of opportunities to include firms owned by minorities, females and
persons with a disability in the investment program; • Completion of DC Recordkeeper and Investment solution provider search; and • Implementation of new supplemental defined contribution plan.
The Manager Diversity Program (MDP), which focuses on investment management firms owned by minorities, females, and persons with a disability (MFDB), continues to be a high priority. As of June 30, 2019, the MDP is valued at approximately $3.6 billion. In total, assets under management with MFDB firms are approximately $6.0 billion or 30.3% of the Total Fund. SURS recently hosted a Diverse Manager Week. Investment managers in strategies across the portfolio were invited to present to staff and the corresponding consultant (either general or specialty). In total, 29 diverse owned firms participated in meetings during that week. The Investment Plan for Fiscal Year 2020 contains additional details on Fiscal Year 2019 accomplishments and strategic initiatives for Fiscal Year 2020. The investment team is focused on successfully completing the projects planned and prudently positioning the portfolio for the
Exhibit 7
Exhibit 7

(This page intentionally left blank)
Exhibit 7

FY 2020 Investment Plan Table of Contents
Page
I. Purpose………………………………………………………………………...1 II. Overview………………………………………….……………...…….………1
• Background • Fiscal Year 2019 Performance Review • Fiscal Year 2019 Accomplishments • Environmental, Social & Governance (ESG) Issues • Investment Management Fees
III. Fiscal Year 2020 Strategic Initiatives……….…………………...………..…8 IV. Manager Diversity Program…………………………………………….…...11 V. Self-Managed Plan….………………………………………………………...13 Update of 2019 Structuring Work Plan (Meketa).……….….………..APPENDIX A
Exhibit 7

1
I. Purpose
The Investment Plan reviews the results of Fiscal Year 2019 and defines the strategy for Fiscal Year 2020 in accordance with the Board-approved asset-liability study and Investment Policy1. This Plan is intended to be a living document. Since financial markets are dynamic, revisions to the plan may be required during the year. In the event of changing circumstances or opportunities during the year, items will be discussed with the Board as necessary.
II. Overview
Background The State Universities Retirement System (SURS) is the administrator of a cost-sharing, multiple employer public employee retirement system. SURS membership includes employees of the public universities and other affiliated organizations. Currently, SURS membership totals more than 230,000 active, inactive and retired participants. SURS maintains both a defined benefit and a defined contribution plan, known as the Self-Managed Plan (SMP). As of June 30, 2019, the defined benefit plan is valued at approximately $19.5 billion while the SMP is valued at approximately $2.7 billion (including forfeiture and disability reserve assets). The investment portfolio is broadly diversified across equities, fixed income, real estate, private equity, commodities and other opportunistic investments. Approximately 41% of the portfolio is currently managed in passive or structured active strategies while the remaining 59% is managed in active strategies.
Fiscal Year 2019 Performance Review Favorable economic conditions continued during most of Fiscal Year 2019, although trade and other global political uncertainties manifested in significant equity market volatility at times during the year. The SURS investment portfolio returned 6.01%, net of fees, during Fiscal Year 2019, trailing the policy portfolio return of 6.85% by 84 basis points. The table below illustrates the performance of the overall SURS investment portfolio relative to the policy portfolio, as of June 30, 2019.
Investment Performance* As of June 30, 2019
1 Year 3 Years 5 Years 10 Years 20 Years 25 Years 30 Years SURS 6.0% 8.8% 5.8% 9.7% 6.2% 8.3% 8.1% Policy Portfolio 6.8% 8.8% 6.0% 9.9% 6.0% 8.1% 7.8%
*Net of investment management fees
1 The SURS Investment Policies can be found at http://surs.org/investment-policies.
Exhibit 7

2
The Total Fund’s underperformance relative to the policy portfolio for Fiscal 2019 was due to a number of factors, including:
• Underweight to the fixed income asset class (one of the better performing asset classes); • Structural overweight to small-to-midcap U.S. equity securities; and • Underperformance by SURS’ active managers in the aggregate hedged strategies, U.S.
equity, and non-U.S. equity portfolios, and to a lesser extent, the direct real estate portfolio (on a time-weighted basis).
o Hedged strategy underperformance was particularly impactful on the total fund, and is the result of poor relative performance of the hedge fund-of-fund portfolios, of which SURS has been in the process of exiting since the third quarter of 2018.
o Much of the underperformance, on a time-weighted basis, in the direct real estate portfolio was a result of weak performance by UBS Trumbull Property Fund (TPF), one of SURS’ core real estate managers. A decision was made to exit the TPF investment in December 2017. While a meaningful portion of the exposure has been redeemed, the total redemption process has proven to take much longer than expected.
In contrast, SURS’ active managers in the global equity, emerging market debt, and commodities portfolios performed exceptionally well relative to the benchmark. Five of the nine public market asset classes either matched or exceeded the benchmark over the past year. SURS emerging market debt portfolio delivered the strongest public market absolute return for the fiscal year, +10.8%, and also exceeded its benchmark by 0.4%. SURS commodities portfolio was the only public market asset class that experienced negative absolute returns (-4.1%). However, the commodities portfolio was the best relative performing asset class, outpacing the benchmark by 2.7%. Global equity also delivered strong relative returns, exceeding the benchmark by 1.8%. Of the private, illiquid asset classes, the private equity portfolio provided the strongest absolute return, +13.6%. The private equity asset class also provided the strongest relative return, exceeding the benchmark for the one-year period by 1.9%.
Exhibit 7

3
Performance of each of the broad asset classes during FY 2019 is shown in the table that follows.
SURS FY 2019 Asset Class Returns
Asset Class
FY 2019
Return Asset Class
FY 2019
Return SURS U.S. Equity 7.3% SURS Emerging Market Debt 10.8% Dow Jones U.S. Total Stock Market 8.9% Performance Benchmark (Custom) 10.4% Excess Return -1.6% Excess Return 0.4% SURS Non-U.S. Equities 0.6% SURS Direct Real Estate* 7.1% MSCI ACWI Ex-US 1.3% NCREIF ODCE Index 6.6% Excess Return -0.7% Excess Return 0.5% SURS Global Equities 7.5% SURS REITS 8.9% MSCI ACWI 5.7% FTSE EPRA/NAREIT Developed Index 7.7% Excess Return 1.8% Excess Return 1.2% SURS Private Equity* 13.6% SURS Commodities -4.1% DJ U.S. Total Stock Market + 3% 11.7% Bloomberg Commodity Index -6.8% Excess Return 1.9 % Excess Return 2.7% SURS Fixed Income 7.1% SURS Opportunity Fund 5.7% Bloomberg Barclays U.S. Aggregate 7.9% CPI + 5% 7.1% Excess Return -0.8% Excess Return -1.4% SURS TIPS 4.9% SURS Hedged Strategies 1.7% Bloomberg Barclays U.S. TIPS 4.8% Performance Benchmark 5.5% Excess Return 0.1% Excess Return -3.8% Secondary Benchmark (HFRI FOF Index) 1.4% Excess Return 0.3%
*Private equity and direct real estate returns shown are internal rates of returns (IRR). From a long-term perspective, the SURS portfolio has performed well, earning an 8.1% annualized rate of return over the past 30 years, exceeding the 7.8% policy portfolio return. This return also exceeds the 8.0% average assumed rate of return in effect over the last 30 years and the current 6.75% assumed rate of return2. In inflation-adjusted terms, the Total Fund returned 5.7% over this time period, exceeding the actuarial real assumed rate target of 4.5% (6.75% less the 2.25% assumed rate of price inflation). When compared to a universe of other large public funds, the SURS return ranks in the second quartile (top half) for the one-year period and the third quartile for the three- and five year periods. SURS has a higher exposure to non-U.S. equity than many of its peers, which detracted from 2 On March 9, 2018, the SURS Board of Trustees approved lowering the System’s assumed rate of investment return to 6.75% from 7.25%. The rate was effective as of July 1, 2018.
Exhibit 7

4
performance on a relative basis. The ten year return ranks much more favorably, placing in or near the top quartile for the period ending June 30, 2019, as illustrated in the chart that follows. Asset allocation is the primary determinant of a fund’s ranking in a peer universe.
SURS Total Fund vs. Public Funds > $1 Billion Periods Ending 6/30/19 (1 = Best, 100 = Worst)
Fiscal Year 2019 Accomplishments The following projects were completed during Fiscal Year 2019.
• Real Assets Consultant Search – A real assets consultant search, initiated at the March 2018 meeting, concluded in September 2018 with the selection of Callan. Callan will assist SURS with strategic planning, pacing, and fund selection in the real assets space.
• Adoption of Investment Beliefs & Completion of Asset-Liability Study – In September
2018, the Board adopted a set of investment beliefs, which will be used as a guide in the Board’s decision-making process. In addition, the Board approved an asset-liability (AL) study, with the assistance of Meketa Investment Group (formerly PCA), SURS’ general investment consultant. The objective of the AL study is to determine an appropriate long-term investment allocation policy for SURS assets. Additional information on the new AL study is included later in the Plan.
• Initiation of Asset-Liability Implementation – Following approval of the AL study in September 2018, staff and Meketa began the gradual process of reallocating assets in accordance with the AL study. In late June 2019, staff and Meketa conducted an annual planning session to ensure that implementation continues along its scheduled path. Additional information on implementation progress and activities slated for FY 2020 can be found in Section III (Fiscal Year 2020 Strategic Initiatives) of this document.
0
20
40
60
80
1001 Year 3 Years 5 Years 10 Years
47th58th 54th
21stU
nive
rse
Rank
ing
Callan Universe > $1B (GOF) Investment Metrics Universe
28th
59th
41st
60th
Exhibit 7

5
• Transition Manager Search – SURS completed a search for firms providing transition management services, resulting in Board approval of a group of six highly qualified firms in October 2018. Transition managers assist in the process of reallocating assets from one investment manager or asset class to another in an efficient, risk-controlled manner.
• Private Equity Advisor Search – In December 2018, in light of private equity’s increased
target weighting in the portfolio (moving from 6% to 11%), the Board authorized a search for a private equity advisor to assist SURS in efficiently implementing the allocation. In June 2019, after a thorough search process, the Board selected TorreyCove Capital Partners as discretionary private equity advisor.
• Self-Managed Plan (SMP) & Optional Supplemental DC Plan Provider Search – Public Act 100-0769 became law in August 2018, creating an optional supplemental defined contribution plan that will be available to all employees who participate in SURS (including Tier 1, Tier 2, and the SMP). Implementation of the new supplemental plan is required to occur as soon as practicable. In December 2018, the Board approved the issuance of a Request for Proposal (RFP) to competitively bid the SMP and the new Optional Supplemental DC Plan to ensure that the two plans complement each other, and allow for operational efficiencies, by combining vendors and administrative functions among the plans. Cammack Retirement Group, SURS’ Defined Contribution consultant, will assist in the process. Finalist interviews are tentatively planned for the September 2019 Investment Committee meeting.
• Procurement – Additional edits were approved to fine tune the specialty consultant section of the Investment Procurement Policy adopted by the Board in March 2018. The procurement policy allows specialty consultants to operate more efficiently when introducing new strategies while maintaining or improving the rigor of evaluation.
• Consideration of Non-Core Real Estate Strategies - In December 2018, Callan presented a real assets strategic plan, including an updated pacing plan. During FY 2019, the Board approved the following commitments to non-core real estate funds in accordance with the pacing study recently completed by Callan, SURS’ specialty real assets consultant.
o Blackstone Real Estate Partners Europe Fund VI (€75 million) o Westbrook Real Estate Fund XI ($75 million) o Long Wharf Real Estate Partners VI (lesser of $40 million or 10% of total
commitments)
• Implementation of Commitments in the Private Equity Portfolio – Consistent with the Private Equity pacing plan approved in June 2017, an additional commitment of $180 million was made to the Pantheon Access 2018 platform. Also, commitments to Mesirow Financial Private Equity continued during the fiscal year.
• Trustee Education – Education was provided to Trustees on a number of relevant topics, during FY 2019, including:
o Crisis Risk Offset (CRO) Class: Trend Following Strategies
Exhibit 7

6
Alternative Risk Premia Strategies o Transition Management Process o Defined Contribution Income Solution o Fixed Income Strategic Classes (Principal Protection & Credit) o Active & Passive Management Strategies
• Commitment to Diversity – SURS continues to be strongly committed to diversity
throughout the investment program. In total, 19 firms owned by minorities, females, or persons with a disability (MFDB) directly manage a total of $6.0 billion, or 30.3% of the Total Fund, as of June 30, 2019. SURS employs a multi-strategy approach designed to maximize opportunities for qualified firms.
The Manager Diversity Program (MDP) is a SURS-sponsored initiative designed to identify and provide opportunities to highly successful MFDB investment management firms. Managers in the MDP contract directly with SURS. As of June 30, the MDP totals $3.6 billion and includes 17 minority- or female-owned investment managers across 20 strategies. Increase in MDP assets of approximately $183 million during Fiscal
Year 2019. Second, SURS has retained Progress Investment Management (Progress), a
minority-owned firm, to serve as a manager of emerging managers. This collaboration with Progress allows SURS to extend its reach into the minority manager universe. As of June 30, the Progress program includes 11 minority- or female-owned investment managers (with 12 mandates) and has total assets of $526 million. The program includes investments in the non-U.S. equity, core fixed income, and emerging market debt asset classes. Increase in assets with Progress of approximately $31 million during
Fiscal Year 2019. Ramirez Asset Management graduated from the Progress fixed income
portfolio into a direct relationship with SURS in FY 2019, with implementation to take place in FY 2020.
It is important to note that SURS’ commitment to diversity extends beyond the
bounds of the MDP and the Manager of Emerging Managers Program. In addition to the firms previously mentioned, SURS contracts with one other MFDB firm, bringing the total number of MFDB firms in direct partnership with SURS to 19. As mentioned previously, assets managed for SURS by these 19 firms are approximately $6.0 billion, or 30.3% of the Total Fund, as of June 30, 2019. Increase in total assets with diverse firms of approximately $192
million during Fiscal Year 2019. Environmental, Social & Governance (ESG) Issues SURS continues to place a high priority on ESG issues. Proxy voting is one important component of the System’s corporate governance responsibilities. Additional actions pertaining to corporate governance include membership in the Council for Institutional Investors (CII), a nonprofit organization of more than 135 pension funds, foundations, and endowments with combined assets
Exhibit 7

7
of approximately $4 trillion. CII’s mission is “to educate its members, policymakers and the public about corporate governance, shareowner rights and related investment issues, and to advocate on members’ behalf.” On October 19, 2017, SURS became a signatory to the Investor Stewardship Group (ISG), joining more than 60 U.S. and international investors with combined assets in excess of $31 trillion. The ISG establishes a framework comprised of a set of stewardship principles for institutional investors and corporate governance principles for U.S. listed companies. Illinois Public Act 101-0473 was recently signed into law. Effective, January 1, 2020, the law requires that SURS Investment Policy include material, relevant, and decision-useful sustainability factors to be considered by the Board, within the bounds of financial and fiduciary prudence, in evaluating investment decisions. Such factors must include, but are not limited to: (1) corporate governance and leadership factors; (2) environmental factors; (3) social capital factors; (4) human capital factors; and (5) business model and innovation factors, as provided under the Illinois Sustainable Investing Act. Revisions to the Investment Policy will be recommended in the coming months to comply with this new statute. Investment Management Fees SURS pays close attention to the level of investment management fees paid to its external investment managers. Fees are negotiated with investment managers prior to the commencement of the relationship with SURS and may be subsequently renegotiated, if appropriate, especially in instances where an investment manager receives an additional allocation(s). Fees vary significantly among investment managers, with the services of private markets managers, such as those in real estate, private equity, infrastructure, etc., being generally higher than those of public markets managers. During Fiscal Year 2019, staff negotiated more favorable fee arrangements with five new and existing investment service providers. In aggregate, these fee negotiations are expected to result in approximately $1.0 million in fee savings. It should also be noted that significant fee savings are expected in FY 2020 and beyond from the pending transition in the private equity portfolio. SURS is moving away from the higher cost, fund-of-funds approach towards a more direct approach, which is expected to save millions over the coming years. More information will be included in future Investment Plans as the transition is fully implemented. In total, SURS paid approximately $63.8 million or approximately 34 basis points in investment management fees and administrative expenses for Fiscal Year 2019. Total investment management fees for Fiscal Year 2020 are projected to decrease from the current year’s budgeted fees. Projected investment management expenses are lower by $2.3 million for asset-based fees and lower by $0.9 million for performance-based fees.
Exhibit 7

8
III. Fiscal Year 2020 Strategic Initiatives
Each year Staff and the General Investment Consultant (currently Meketa Investment Group) undertake initiatives to assist the Board with the goal of achieving more effective and cost-efficient implementation of investment strategies and positively contribute to the health of the System. The initiatives outlined below are often related and long term in nature. Asset-Liability (AL) Study Implementation Much of the work planned during the coming fiscal year will be aimed at implementing the AL study approved by the Board in September 2018. The purpose of the asset allocation policy is to establish an Investment Policy framework for SURS with a high likelihood, in the Board’s judgment, of realizing SURS’ investment objective. This is a critical step as the continued sustained growth of SURS assets is a necessary component to achieving long-term sustainability. The AL study organizes SURS’ assets within a functional framework rather than the descriptive-oriented asset-based framework. In this approach, assets are grouped by similar risk profiles, rather than asset class name. At the highest level, assets are classified as either growth-oriented or diversifying strategies, as shown in the following table.
Growth-oriented strategies include risk-taking assets or strategies that produce high total returns relative to other asset classes. Success in this category is often linked to economic success or failure. The three strategic components within this group are shown and described below.
Role Group Description
Gro
wth
Non-Traditional Growth
Provide growth in excess of Traditional Growth through exposure to investments driven by exposure to the equity risk and illiquidity risk premiums (i.e. Private Equity and Non-Core Real Assets)
Traditional Growth
Provide growth in line with traditional public equity markets (i.e. US Equity, Non-US Equity and Global Equity)
Stabilized Growth
Provide growth through strategies that are exposed to market beta, exhibiting expected returns similar to Traditional Growth but with lower volatility (i.e. Credit fixed income, options strategies, and Core Real Assets)
Functional Asset Class Allocation as of 6/30/19
Long-Term Goal Allocation
Non-Traditional Growth 10% 15%
Traditional Growth 54% 25%
Stabilized Growth 22% 26%
Inflation Sensitive 6% 6%
Principal Protection 7% 8%
Crisis Risk Offset 0% 20%
Gro
wth
-or
ient
edD
iver
sify
ing
Exhibit 7

9
Diversifying strategies provide two forms of diversification via anchor strategies and offset strategies. Anchor strategies are characterized by low volatility and high liquidity. Offset strategies, in contrast, tend to be higher volatility strategies that have zero-to-negative correlation to public equity markets. These strategies, described in the table below, are designed to perform well in the event of a prolonged equity market downturn.
Role Group Description
Div
ersi
fyin
g
Inflation Sensitive
Serves a mixed role as part anchor (i.e. TIPS) and part offset (i.e. Commodities) depending on the market environment. Designed to help protect the portfolio during periods of high inflation.
Principal Protection
Provide an anchor to the portfolio by exhibiting low volatility with minimal exposure to equity risk. Designed to provide consistent, stable returns during most market environments and preserve principal during periods where growth investments are experiencing significant drawdowns (i.e. Core Fixed Income).
Crisis Risk Offset
Provide an offset to growth risk through liquid exposures to risk premiums expected to exhibit offsetting behavior to growth investments during periods of significant drawdown (i.e. Long Duration Treasury, Systematic Trend Following, Alternative Risk Premia)
Implementation Progress Since approval of the AL study in September 2018, SURS staff and Meketa have begun work to implement the new functional-based framework. The new portfolio structure is designed to produce improvement in long-term expected returns with significantly improved volatility and downside risk measures, with a much tighter range of projected return paths. Appendix A contains a memorandum from Meketa, updating the 2019 Structuring Work Plan and describing the implementation process. Investment Policy Review As mentioned previously, staff will work with Meketa to recommend modifications to the Investment Policy to reflect changes resulting from the implementation of the AL study. It is also likely that fiduciary counsel will provide a periodic review the IPS during the coming year. Procurement Policy Revision Additional fine-tuning will be recommended in September to the Investment Procurement Policy, the document which provides procedural guidance for the search and selection for SURS investment managers and/or fund investments. Continued Implementation of Non-Traditional Growth Allocations Staff will continue work with Callan , specialty consultant for the real asset portfolio, to implement the strategic plan and pacing model for the coming year. The pacing plan ensures SURS annually deploys capital at a level which allows attainment of the strategic plan over time. As mentioned previously, the Board selected TorreyCove Capital Partners in June 2019 as discretionary private equity advisor to SURS. This selection marked a shift in the model used by SURS to access the private equity asset class, moving away from a fund-of-funds approach to a less costly, more efficient method of directly accessing fund investments. This direct approach also allows SURS greater control over portfolio strategy. Once the onboarding process is complete,
Exhibit 7

10
TorreyCove will assist SURS in developing a strategic plan and pacing model for the private equity portfolio and will begin selecting and executing fund investments on SURS’ behalf. Diversity Initiatives SURS will continue to review opportunities in the investment program to consider the utilization of minorities, females and persons with a disability. Investment managers of diversity are always encouraged to participate in the search process if an applicable strategy/mandate is identified. SURS recently hosted a Diverse Manager Week. Investment managers in strategies across the portfolio were invited to present to staff and the corresponding consultant (either general or specialty). In total, 29 diverse owned firms participated in meetings during that week. Investment Manager Oversight, Due Diligence, and Risk Management A critical duty of the investment team and Meketa is to monitor the numerous investment managers under contract with SURS. Each manager plays a role in the success of the overall program and extensive resources are utilized to ensure the strategies are functioning as desired. Risk management monitoring of the program continues to expand and evolve. Fees and Compliance Oversight SURS continuously strives to obtain the most favorable fee terms from investment providers. Negotiations and asset reallocations during FY 2019 resulted in savings of approximately $1.0 million. Compliance monitoring efforts include continuous interaction with Meketa as well as the custodian, Northern Trust.
Exhibit 7

11
IV. Manager Diversity Program Overview The Manager Diversity Program (MDP) is a SURS-sponsored initiative designed to identify and provide opportunities to highly successful investment management firms owned by minorities, females, and persons with a disability. Key items of note:
• Developed in 2004 to identify and retain MFDB firms • Managers contract directly with SURS • Market Value of $3.607 billion, as of June 30, 2019 • 6 components:
Asset Class
Number of MFDB
Strategies
Market Value*
as of June 30, 2018
Commitment Amount (Private Equity & Real
Estate Only) U.S. Equity 6 $1,564 million N/A Core Fixed Income 4 $797 million N/A Non-U.S. Equity 3 $936 million N/A Private Equity 3 $128 million $200 million Real Estate 3 $89 million $195 million Options Overlay 1 $94 million Total 20** $3,607 million
*Totals may not add due to rounding **17 firms and 20 strategies due to two strategies with one private equity investment manager, two strategies with one real estate manager, and two strategies (one U.S. equity and one options overlay) with one manager. Performance Objectives The performance objective of the MDP is to seek annualized investment returns, net of investment management fees, in excess of the market goal for 1, 3, 5, and 10 year periods. While individual investment managers may underperform in any given year, the diversification within the program should limit the underperformance at the program level. Fiscal Year 2019 Performance Review The MDP underperformed its benchmark during Fiscal Year 2019 primarily due to manager underperformance relative to the benchmark in the U.S. equity and Non-U.S. equity portfolios. Most of the managers utilize a Value factor in their process during a period when this factor was out of favor. Fixed Income as a group underperformed due to the highest weighted manager, Garcia Hamilton, being underweight duration during a lower interest rate trend. The Private Equity managers outperformed although it has a small but growing allocation. The best relative performers included EARNEST, Ativo, and Fairview. In terms of best absolute performance, Fairview Lincoln Fund I Private Equity returned 18.1% (on a net IRR basis), and EARNEST returned 10.5%. As a result, the MDP was behind the benchmark for the one-year by a larger than usual margin. The longer term numbers which had been ahead of the benchmark were negatively impacted by last year’s performance.
Exhibit 7

12
Investment Performance* As of June 30, 2019
1 Year
3 Years
5 Years Since
Inception SURS MDP 3.6% 8.1% 5.3% 6.1% Benchmark 5.9% 8.8% 5.5% 6.2%
*Net of investment management fees Fiscal Year 2018 MDP Accomplishments As of June 30, 2019, the MDP is valued at approximately $3.6 billion. A summary of MDP activities follows.
• SURS made a commitment of $30 million to the Basis Real Estate Fund I. • SURS made an additional allocation of $95 million to Gladius for a Volatility Risk Premia
Options strategy. SURS’ commitment to diversity extends beyond the bounds of the MDP. In addition to the 17 firms utilized in the MDP, SURS contracts with two additional MFDB firms, bringing the total number of MFDB firms in partnership with SURS to 19. In the most recent Investment Policy, SURS has implemented guidelines for a graduation program for firms in the manager of manager funds to receive direct allocations from SURS. Assets managed for SURS by these 19 firms are approaching $5.95 billion, or 30.3% of the Total Fund, as of June 30, 2019. Fiscal Year 2020 MDP Initiatives Plans for the MDP in FY 2020 include the following:
• Expand industry outreach efforts • Continue diligent monitoring of the overall program, manager structure, and risk
parameters within the program • Provide a thorough review of the MDP to the Board at the March 2020 Board meeting • Identify potential opportunities to increase funding for existing qualified investment
managers • Continued interaction with system consultant, Meketa, via more frequent discussions
regarding MFDB investment managers
Exhibit 7

13
V. Defined Contribution Plan Overview The Self-Managed Plan (SMP) is a defined contribution option available to SURS members. The SMP has grown steadily since the plan’s inception in April 1998. Highlights of the plan include:
• Approximately $2.6 billion in assets as of June 30, 2019 • SMP forfeiture assets were $20.5 million as of June 30, 2019 • Disability reserve assets were $108.7 million as of June 30, 2019 • One Lead Administrator
o Fidelity Investments • Two Service Providers
– Fidelity Investments ($1.6 billion in assets) – TIAA ($993 million in assets)
• 29 investment options as of June 30, 2019 – Includes series of lifecycle funds in both TIAA and Fidelity lineups
• Over 21,000 Participants currently invested – 13,669 active participants – 8,092 inactive participants
Fiscal Year 2019 Defined Contribution Accomplishments
• Issued RFP for recordkeeping and custom investment solution providers for the SMP and also the new supplemental defined contribution plan created in Public Act 100-0769.
• SURS continued to utilize and monitor investment options with the lowest cost share classes available as a means to reduce participant cost and enhance investment returns.
• Enhanced quarterly reporting. Fiscal Year 2020 Defined Contribution Initiatives Plans for the Defined Contribution Plan in FY 2020 include the following:
• Continue diligent monitoring of the overall program, providers and investment options. • Conclude RFP process and make recommendations to the Board. • Implement approved recordkeeping and investment lineup changes to the SMP. • Launch new supplemental defined contribution plan.
Exhibit 7

Appendix A
Exhibit 7

(This page intentionally left blank)
Exhibit 7

M E M O R A N D U M
M E K E T A I N V E S T M E N T G R O U P411 NW PARK AVENUE SUITE 401 PORTLAND OR 97209
503 226 1050 fax 503 226 7702 www.meketagroup.com
To: State Universities Retirement System (SURS)
From: Neil Rue CFA, Colin Beebee CFA, David Sancewich Meketa Investment Group (Meketa)
Date: September 12, 2019
Re: Update of 2019 Structuring Work Plan
This memo updates the 2018-2019 Structuring Work Plan presented earlier in 2019 (see attached schedule). The paragraphs below recap this matter since December 2018 when we last presented the schedule to the Investment Committee.
Since late 2018, SURS has been in the process of integrating and implementing its new long-term strategic allocation into the System’s investment portfolio. In late June 2019, Staff and Meketa conducted an annual planning session to ensure that implementation continues along its scheduled path.
As discussed earlier with the SURS Board, to fully execute the implementation plan (which is now in its middle stages), a significant number of milestones must be achieved within a relatively short period of time in order to formally establish the initial phase of the new allocation structure by 12/31/2019. While it is reasonable and acceptable to allow certain milestones to be delayed by a meeting or two, the objective has been to move forward at a relatively steady pace to implement important changes to the SURS asset portfolio in a deliberate and thoughtful manner.
The process for implementation is expected to follow three basic steps:
(i) Educate and recommend selected structural changes (usually one strategic class at a time);
(ii) Once structural recommendations are approved and/or modified, draft and approve policy/guideline language reflecting those recommendations; and
(iii) Following these needed policy adjustments, search for and retain the appropriate advisors/managers to implement the new policy structure. This step requires several sub-steps, including issuing requests for proposals, conducting due diligence, and drafting/finalizing contracts. Given the timeline, Meketa and/or Staff may begin step (iii) prior to (or in conjunction with) finalizing step (ii).
Appendix A
Exhibit 7

Memorandum Page 2 of 4 September 12, 2019
To provide an updated recap, SURS has completed Step (i) for four key components/classes: CRO, Principal Protection, Credit, and Traditional Growth. Policy language updates in Step (ii) have been approved for three classes/components: CRO, Principal Protection, and Credit. Traditional Growth policy language updates are scheduled for September 2019. Under Step (iii) manager structuring and searches are currently being finalized across three classes/components: CRO, Principal Protection, and Credit. Manager search and structuring for Traditional Growth is expected to begin in late 3Q 2019 and extend/finalize into 4Q 2019. The table below summarizes these activities to provide the reader with a snapshot of progress to-date:
IMPLEMENTATION PROCESS UPDATE FOR MAJOR CLASSES/COMPONENTS
Class/Component
Step i
(Education)
Step ii
(Policy Revisions)
Step iii
(Implementation)
Crisis Risk Offset Completed Completed In-progress
Principal Protection Completed Completed Completed
Credit Completed Completed Completed
Traditional Growth Completed Sept. 2019 TBD/end of year
Inflation Sensitive Oct. 2019 Dec. 2019 TBD
Real Assets Dec 2019 TBD TBD
Options Overlay Dec 2019 TBD TBD
Stabilized Growth Jan 2020 TBD TBD
Based on the attached work plan, additional implementation activities will continue to take place through fiscal 2020. Over time, however, the planned activities are expected to become less impactful to the portfolio, reflecting steady progress toward full implementation.
Staff and/or Meketa are available to answer questions on the Preliminary Work Plan.
NAR/ CB/DPS/hls
Appendix A
Exhibit 7

Memorandum Page 3 of 4 September 12, 2019
UPDATED SURS PORTFOLIO STRUCTURING WORK PLAN, BY MEETING DATE
Meeting Date Item
September 12 IC Meeting
Approve new Traditional Growth segment investment policy language
Provide update on CRO class manager searches
Finalize Private Growth consultant agreement
October 17 IC Meeting
Inflation Sensitive class structure review
Private Growth segment structure review
Complete necessary CRO manager searches
Provide Staff with Prototype Risk Reporting Suggestions
Private Credit Introduction/Education
December 10 IC Meeting Approve Private Growth segment investment policy language
Approve new Inflation Sensitive segment investment policy language
Real Assets segment structure review
Options overlay segment structure review
January 30 IC Meeting
High-level review of Stabilized Growth structure
Recap of asset allocation structuring
Review expected pacing into private market segments
Complete Traditional Growth manager searches (if needed)
Approve Real Assets investment policy language changes (if needed)
Approve Options Overlay policy language changes (if needed)
January 31 IC Meeting
Education Topics: TBD
March 5 IC Meeting
Receive newly-designed SURS performance reports to account for new structure
Alter Stabilized Growth policy language, if needed
April 16 IC Meeting
Follow-on review of Principal Protection class
June 4 IC Meeting
Review of CRO results and recommendation to increase to 10%
Appendix A
Exhibit 7

Memorandum Page 4 of 4 September 12, 2019
DISCLOSURES: This document is provided for informational purposes only. It does not constitute an offer of securities of any of the issuers that may be described herein. Information contained herein may have been provided by third parties, including investment firms providing information on returns and assets under management, and may not have been independently verified. The past performance information contained in this report is not necessarily indicative of future results and there is no assurance that the investment in question will achieve comparable results or that the Firm will be able to implement its investment strategy or achieve its investment objectives. The actual realized value of currently unrealized investments (if any) will depend on a variety of factors, including future operating results, the value of the assets and market conditions at the time of disposition, any related transaction costs and the timing and manner of sale, all of which may differ from the assumptions and circumstances on which any current unrealized valuations are based. Neither Meketa nor Meketa’s officers, employees or agents, make any representation or warranty, express or implied, in relation to the accuracy or completeness of the information contained in this document or any oral information provided in connection herewith, or any data subsequently generated herefrom, and accept no responsibility, obligation or liability (whether direct or indirect, in contract, tort or otherwise) in relation to any of such information. Meketa and Meketa’s officers, employees and agents expressly disclaim any and all liability that may be based on this document and any errors therein or omissions therefrom. Neither Meketa nor any of Meketa’s officers, employees or agents, make any representation of warranty, express or implied, that any transaction has been or may be effected on the terms or in the manner stated in this document, or as to the achievement or reasonableness of future projections, management targets, estimates, prospects or returns, if any. Any views or terms contained herein are preliminary only, and are based on financial, economic,
market and other conditions prevailing as of the date of this document and are therefore subject to change. The information contained in this report may include forward-looking statements. Forward-looking statements include a number of risks, uncertainties and other factors beyond the control of the Firm, which may result in material differences in actual results, performance or other expectations. The opinions, estimates and analyses reflect Meketa’s current judgment, which may change in the future. Any tables, graphs or charts relating to past performance included in this report are intended only to illustrate investment performance for the historical periods shown. Such tables, graphs and charts are not intended to predict future performance and should not be used as the basis for an investment decision. All trademarks or product names mentioned herein are the property of their respective owners. Indices are unmanaged and one cannot invest directly in an index. The index data provided is on an “as is” basis. In no event shall the index providers or its affiliates have any liability of any kind in connection with the index data or the portfolio described herein. Copying or redistributing the index data is strictly prohibited. The Russell indices are either registered trademarks or tradenames of Frank Russell Company in the U.S. and/or other countries. The MSCI indices are trademarks and service marks of MSCI or its subsidiaries. Standard and Poor’s (S&P) is a division of The McGraw-Hill Companies, Inc. S&P indices, including the S&P 500, are a registered trademark of The McGraw-Hill Companies, Inc. CBOE, not S&P, calculates and disseminates the BXM Index. The CBOE has a business relationship with Standard & Poor's on the BXM. CBOE and Chicago Board Options Exchange are registered trademarks of the CBOE, and SPX, and CBOE S&P 500 BuyWrite Index BXM are servicemarks of the CBOE. The methodology of the CBOE S&P 500 BuyWrite Index is owned by CBOE and may be covered by one or more patents or pending patent applications. The Barclays Capital indices (formerly known as the Lehman indices) are trademarks of Barclays Capital, Inc. The Citigroup indices are trademarks of Citicorp or its affiliates. The Merrill Lynch indices are trademarks of Merrill Lynch & Co. or its affiliates. FTSE is a trademark of the London Stock Exchange Group companies and is used by FTSE under license. All rights in the FTSE indices and/or FTSE ratings vest in FTSE and/or its licensors. No further distribution of FTSE data is permitted with FTSE’s express written consent.
Appendix A
Exhibit 7

This report is solely for the use of client personnel. No part of it may be circulated, quoted, or reproduced for distribution outside the client organization without prior written approval fromMeketa Investment Group.
Nothing herein is intended to serve as investment advice, a recommendation of any particular investment or type of investment, a suggestion of purchasing or selling securities, or an invi-
tation or inducement to engage in investment activity.
Q2 2019 Board Report
Illinois (SURS)
State Universities Retirement System of
Exhibit 8

AttributionRiskPerformance Results
PORTFOLIO DETAIL
THE WORLD MARKETS
INTRODUCTION/PORTFOLIO REVIEW
TABLE OF CONTENTS
Exhibit 8

INTRODUCTION / PORTFOLIO REVIEW
Exhibit 8

3-YR Statistics (Rank)
5-YR Statistics (Rank)
(1) Investment Metrics (IM) Median [Gross of Fees] - Public Fund >$1 Bilion Universe includes BNY Mellon Total Public Fund Greater than $1Billion Universe and IM client data.(2) Parametric Overlay program Inception Date: September 2014
3 Mo (Rank) 1 YR (Rank) 3 YR (Rank) 5 YR (Rank) 7 YR (Rank) 10 YR (Rank)
Total Fund w/ Overlay 3.0 (66) 6.0 (50) 8.8 (68) 5.8 (68) 8.4 (47) 9.7 (34)
Policy Benchmark 3.8 (9) 6.8 (31) 8.8 (68) 6.0 (62) 8.5 (43) 9.9 (27)
Excess Return vs. Policy Index -0.8 -0.8 0.0 -0.2 -0.1 -0.2
Public Fund Median (1) 3.2 5.9 9.2 6.2 8.4 9.3
Total Fund ex Overlay 2.9 5.8 8.6 5.8 8.4 9.7
ReturnStandardDeviation
SharpeRatio
InformationRatio
8.8 (68) 6.6 (60) 1.1 (70) 0.0 (67)
8.8 (68) 6.2 (55) 1.2 (61) -
9.2 6.0 1.2 0.2
Portfolio Valuation ($000's)
1Quarter
Total Fund w/ Overlay
Beginning Market Value 19,223,356
Net Cash Flow -156,022
Fees/Expenses -10,682
Income 70,685
Gain/Loss 515,180
Ending Market Value 19,642,517ReturnStandardDeviation
SharpeRatio
InformationRatio
5.8 (68) 7.0 (67) 0.7 (76) -0.2 (73)
6.0 (62) 6.8 (62) 0.8 (71) -
6.2 6.4 0.9 0.1
SURS Portfolio Review - Net-of-Fees
As of June 30, 2019
State Universities Retirement System of Illinois (SURS) 4
Public Fund Median (1)
Policy Benchmark
Total Fund w/ Overlay
Public Fund Median (1)
SURS Policy Benchmark
Total Fund w/ Overlay
underperformed the Median Public Fund over 3 of the 6 measured time periods, net of fees.· The SURS Total Portfolio underperformed the Policy Benchmark over 5 of the 6 measured periods, net of fees. The Total Portfolio
Exhibit 8

5
SECOND QUARTER OF 2019 THE WORLD MARKETS
Exhibit 8

The World Markets Second Quarter of 2019
Prepared by Meketa Investment Group
The World Markets1 Second Quarter of 2019
1 Source: InvestorForce.
-1.2%
0.6%
0.7%
1.6%
2.1%
2.5%
2.9%
3.1%
3.7%
4.1%
4.3%
5.6%JPM GBI-EM Global Diversified
S&P 500
Russell 3000
MSCI EAFE
Bloomberg Barclays Aggregate
Bloomberg Barclays U.S. TIPS
Bloomberg Barclays High Yield
Russell 2000
HFRI Fund of Funds
NAREIT Equity
MSCI Emerging Markets
Bloomberg Commodity Index
6
Exhibit 8

The World Markets Second Quarter of 2019
Prepared by Meketa Investment Group
Index Returns1
2Q19 (%)
1 YR (%)
3 YR (%)
5 YR (%)
10 YR (%)
Domestic Equity
S&P 500 4.3 10.4 14.2 10.7 14.7
Russell 3000 4.1 9.0 14.0 10.2 14.7
Russell 1000 4.2 10.0 14.1 10.5 14.8
Russell 1000 Growth 4.6 11.6 18.1 13.4 16.3
Russell 1000 Value 3.8 8.5 10.2 7.5 13.2
Russell MidCap 4.1 7.8 12.2 8.6 15.2
Russell MidCap Growth 5.4 13.9 16.5 11.1 16.0
Russell MidCap Value 3.2 3.7 8.9 6.7 14.6
Russell 2000 2.1 -3.3 12.3 7.1 13.4
Russell 2000 Growth 2.7 -0.5 14.7 8.6 14.4
Russell 2000 Value 1.4 -6.2 9.8 5.4 12.4
Foreign Equity
MSCI ACWI (ex. U.S.) 3.0 1.3 9.4 2.2 6.5
MSCI EAFE 3.7 1.1 9.1 2.2 6.9
MSCI EAFE (Local Currency) 2.8 2.2 9.8 5.9 8.3
MSCI EAFE Small Cap 1.7 -6.3 9.1 4.4 9.7
MSCI Emerging Markets 0.6 1.2 10.7 2.5 5.8
MSCI Emerging Markets (Local Currency) 7.4 9.4 13.8 7.6 8.6
Fixed Income
Bloomberg Barclays Universal 3.1 8.1 2.8 3.2 4.4
Bloomberg Barclays Aggregate 3.1 7.9 2.3 2.9 3.9
Bloomberg Barclays U.S. TIPS 2.9 4.8 2.1 1.8 3.6
Bloomberg Barclays High Yield 2.5 7.5 7.5 4.7 9.2
JPM GBI-EM Global Diversified 5.6 9.0 4.2 -0.5 3.4
Other
NAREIT Equity 0.7 10.1 3.8 7.7 15.3
Bloomberg Commodity Index -1.2 -6.8 -2.2 -9.1 -3.7
HFRI Fund of Funds 1.6 1.3 4.3 2.2 3.2
1 Source: InvestorForce.
7
Exhibit 8

The World Markets Second Quarter of 2019
Prepared by Meketa Investment Group
S&P Sector Returns1
1 Source: InvestorForce. Represents S&P 1500 (All Cap) data.
4.3%5.0%
3.5%
-3.8%
7.8%
1.4%
4.1%
6.0%5.1%
3.4%4.2%
13.6%
8.2%
15.4%
-15.7%
5.5%
12.0%
9.7%
14.0%
1.1%
18.6%
9.3%
-20%
-15%
-10%
-5%
0%
5%
10%
15%
20%
25%
Communication
Services
Consumer
Discretionary
Consumer
Staples
Energy Financials Health Care Industrials Information
Technology
Materials Utilities S&P 1500
Ret
urn
Second Quarter One Year
8
Exhibit 8

The World Markets Second Quarter of 2019
Prepared by Meketa Investment Group
U.S. and Developed Market Foreign Equity Rolling Three-Year Returns1
1 Source: InvestorForce.
-30%
-20%
-10%
0%
10%
20%
30%
40%
1989 1992 1994 1996 1998 2001 2003 2005 2007 2010 2012 2014 2016 2019
Russell 3000 3-Year Return MSCI EAFE 3-Year Return
14.0%
9.1%
9
Exhibit 8

The World Markets Second Quarter of 2019
Prepared by Meketa Investment Group
U.S. and Emerging Market Equity Rolling Three-Year Returns1
1 Source: InvestorForce.
-30%
-20%
-10%
0%
10%
20%
30%
40%
50%
1989 1992 1994 1996 1998 2001 2003 2005 2007 2010 2012 2014 2016 2019
Russell 3000 MSCI Emerging Markets
14.0% (U.S.)
10.7% (EM)
10
Exhibit 8
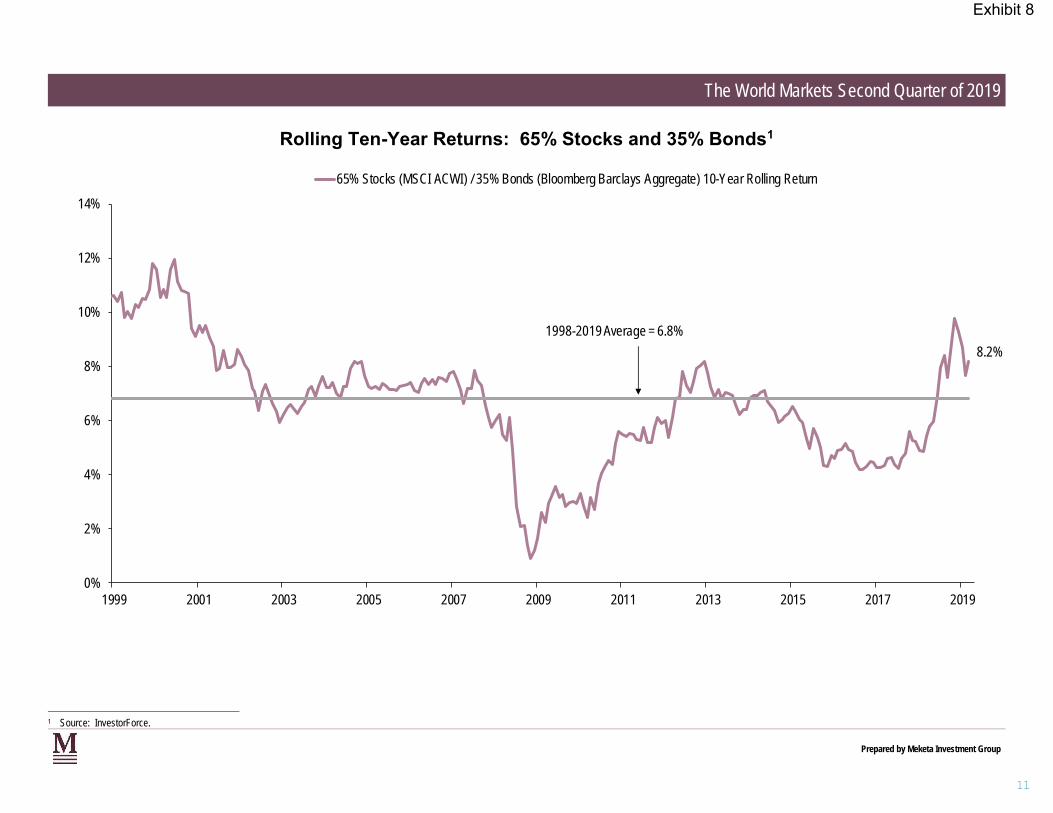
The World Markets Second Quarter of 2019
Prepared by Meketa Investment Group
Rolling Ten-Year Returns: 65% Stocks and 35% Bonds1
1 Source: InvestorForce.
0%
2%
4%
6%
8%
10%
12%
14%
1999 2001 2003 2005 2007 2009 2011 2013 2015 2017 2019
65% Stocks (MSCI ACWI) / 35% Bonds (Bloomberg Barclays Aggregate) 10-Year Rolling Return
1998-2019 Average = 6.8%
8.2%
11
Exhibit 8

The World Markets Second Quarter of 2019
Prepared by Meketa Investment Group
Credit Spreads vs. U.S. Treasury Bonds1, 2
1 Source: Barclays Live. 2 The median high yield spread was 4.8% from 1997-2019.
0%
2%
4%
6%
8%
10%
12%
14%
16%
18%
20%
1998 2001 2004 2007 2010 2013 2016 2019
U.S. High Yield U.S. Investment Grade Corporates U.S. Mortgage-Backed
18.3%
3.8%
High Yield Spread Average = 5.3%
1.2%
0.5%
12
Exhibit 8
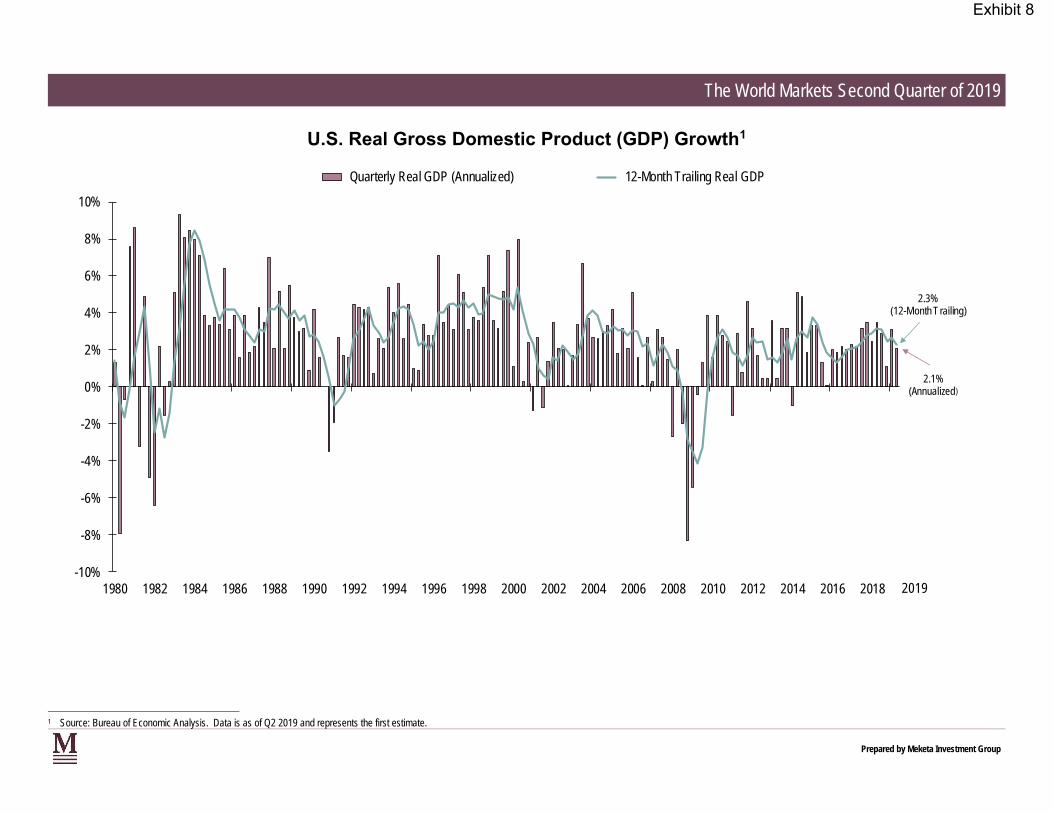
The World Markets Second Quarter of 2019
Prepared by Meketa Investment Group
U.S. Real Gross Domestic Product (GDP) Growth1
1 Source: Bureau of Economic Analysis. Data is as of Q2 2019 and represents the first estimate.
-10%
-8%
-6%
-4%
-2%
0%
2%
4%
6%
8%
10%
1980 1982 1984 1986 1988 1990 1992 1994 1996 1998 2000 2002 2004 2006 2008 2010 2012 2014 2016 2018
Quarterly Real GDP (Annualized) 12-Month Trailing Real GDP
2.1%(Annualized)
2.3% (12-Month Trailing)
2019
13
Exhibit 8

The World Markets Second Quarter of 2019
Prepared by Meketa Investment Group
U.S. Inflation (CPI) Trailing Twelve Months1
1 Source: Bureau of Labor Statistics. Data is non-seasonally adjusted CPI, which may be volatile in the short-term. Data is as of June 30, 2019.
-3%
-2%
-1%
0%
1%
2%
3%
4%
5%
6%
7%
1989 1992 1994 1996 1998 2001 2003 2005 2007 2010 2012 2014 2016 2019
1.6%
1990-2019 Average = 2.5%
14
Exhibit 8

The World Markets Second Quarter of 2019
Prepared by Meketa Investment Group
U.S. Unemployment1
1 Source: Bureau of Labor Statistics. Data is as of June 30, 2019.
2%
3%
4%
5%
6%
7%
8%
9%
10%
11%
1980 1983 1986 1989 1992 1995 1998 2001 2004 2007 2010 2013 2016 2019
10.8%
3.7%
1980-2019 Average = 6.2%
4.4%
10.0%
15
Exhibit 8

PORTFOLIO DETAIL Performance Results RiskAttributionPrivate Markets
Exhibit 8

PERFORMANCE RESULTS
Exhibit 8

Total Fund w/ Overlay Policy Benchmark Actuarial Rate
($5.0)
$0.0
$5.0
$10.0
$15.0
$20.0
$25.0
$30.0
12/82 12/84 12/86 12/88 12/90 12/92 12/94 12/96 12/98 12/00 12/02 12/04 12/06 12/08 12/10 12/12 12/14 12/16 6/19
$16.0
$23.1
$24.6
Total Fund Growth of $1 Since Inception
As of June 30, 2019
State Universities Retirement System of Illinois (SURS) 18
Exhibit 8

Actual vs. Target Allocations As of 6/30/2019
Policy Current Overlay Current Value
Cash & Transit ion 0.0% 1.2% 0.1% $230,026,677
Commodit ies 2.0% 1.8% 1.9% $352,460,283
Hedge Funds 5.0% 4.0% 4.0% $781,314,527
Opportunity Fund 1.0% 0.6% 0.6% $119,422,414
Private Equity 6.0% 7.1% 7.1% $1,392,683,101
Real Estate 6.0% 6.5% 6.5% $1,284,159,255
REITs 4.0% 2.2% 2.2% $424,581,135
TIPs 4.0% 3.7% 3.7% $728,416,673
Emerging Market Debt 3.0% 3.2% 3.2% $625,878,060
Fixed Income 19.0% 17.5% 19.9% $3,438,466,269
Global Equity 8.0% 9.4% 8.2% $1,844,275,638
Non US Equity 19.0% 19.3% 19.3% $3,788,155,234
Domestic Equity 23.0% 22.9% 22.7% $4,506,616,619
Overlay 0.0% 0.6% 0.0% $126,060,760
Total 100% 100% 100% $19,642,516,645
Asset Allocation vs. Target
19
Exhibit 8

MarketValue
($)
AssetAllocation
(%)
LowerRange
(%)
Target(%)
UpperRange
(%)
Total Fund w/ Overlay 19,642,517 100.0 - 100.0 -
Domestic Equity Composite w/ Overlay 4,506,617 22.9 20.0 23.0 26.0
International Equity Composite w/ Overlay 3,788,155 19.3 16.0 19.0 22.0
Global Equity Composite w/ Overlay 1,844,276 9.4 5.0 8.0 11.0
Fixed Income Composite w/ Overlay 3,438,466 17.5 16.0 19.0 22.0
Emerging Market Debt 625,878 3.2 0.0 3.0 6.0
TIPS 728,417 3.7 1.0 4.0 7.0
REITs 424,581 2.2 1.0 4.0 7.0
Real Estate 1,284,159 6.5 3.0 6.0 9.0
Private Equity 1,392,683 7.1 3.0 6.0 9.0
Opportunity Fund 119,422 0.6 0.0 1.0 4.0
Hedge Funds 781,315 4.0 2.0 5.0 8.0
Commodities Composite w/ Overlay 352,460 1.8 0.0 2.0 5.0
Cash 230,027 1.2 0.0 0.0 3.0
Total Overlay 126,061 0.6 0.0 0.0 3.0
Target% Actual%
0.0% 10.0% 20.0% 28.0%
Asset Allocation vs. Target Allocation with Overlay
As of June 30, 2019
State Universities Retirement System of Illinois (SURS) 20
Exhibit 8

Cash Commodities Domestic Equity
Emerging Market Debt Fixed Income Global Equity
Hedge Funds International Equity Opportunistic
Overlay Private Equity Real Estate
REITs TIPS
0
15
30
45
60
75
90
All
oc
ati
on
(%)
Nov
2013
Aug
2014
May
2015
Feb
2016
Nov
2016
Aug
2017
May
2018
Jun
2019
Historical Asset Allocation
5 Years Ending June 30, 2019
State Universities Retirement System of Illinois (SURS) 21
Exhibit 8

Trailing Period Perfomance (annualized)
12-Month Period As of June 30, 2019
(1) Investment Metrics (IM) Median [Gross of Fees] - Public Fund Greater than $1 Billion Universe includes BNY Mellon Public Funds >$1 Billion Universe and IM client data.
Total Fund w/ Overlay - Gross Total Fund w/ Overlay - Net Policy Benchmark Public Fund Median (1)
0.0
3.0
6.0
9.0
12.0
Re
turn
1
Quarter
FYTD 1
Year
3
Years
5
Years
Since Inception
.23
.95 .95
.29
.26
.83
.86 .86
88.
.06
.03
.06 .06
.88
.85
.19
.03
.36 .36
.09
.16
.29
0.0
4.0
8.0
12.0
16.0
Re
turn
.43
0.5
.721
.78
.95
.92
0.8
.711
.97.86
.92
0.2
.212
.28
.06
.13
0.5
.512
.58
36.
SURS Portfolio Relative Performance Results
As of June 30, 2019
State Universities Retirement System of Illinois (SURS) 22
Total Fund w/ Overlay - Gross
2014-2015
Total Fund w/ Overlay - Net
2015-2016
Policy Benchmark
2016-2017
Public Fund Median (1)
2017-2018 2018-2019
Exhibit 8

(1) The Fixed Income composite returns consist of returns provided by NEPC through September 2017 and are calculated by Meketa beginning in October 2017.
MarketValue($000)
1Quarter
1Year
3Years
5Years
7Years
10Years
15Years
Total Fund w/ Overlay 19,642,517 3.0 6.0 8.8 5.8 8.4 9.7 7.2
Policy Benchmark 3.8 6.8 8.8 6.0 8.5 9.9 7.2
Domestic Equity 4,506,617 3.8 7.3 13.6 9.7 13.4 14.7 8.7
Dow Jones U.S. Total Stock Market Index 4.1 8.9 14.0 10.1 13.7 14.7 9.0
Total Non US Equity 3,788,155 2.9 0.6 9.3 2.6 6.9 6.9 5.8
International Equity Custom Benchmark 3.0 1.3 9.4 2.2 6.4 6.5 5.9
Global Equity 1,844,276 3.2 7.5 14.1 8.3 11.4 11.4 7.4
Global Equity Benchmark 3.6 5.7 11.6 6.2 9.9 10.1 6.9
Fixed Income(1) 3,438,466 2.7 7.6 3.1 3.1 2.9 4.6 4.9
Fixed Income Custom Benchmark 3.1 7.9 2.3 2.9 2.6 3.9 4.3
Emerging Market Debt 625,878 5.3 10.8 5.5 - - - -
50% JPM GBI-EM GD / 25% JPM EMBI GD / 25% JPM Corp Broad 4.7 10.4 5.0 - - - -
TIPS 728,417 2.9 4.9 2.3 1.6 1.2 3.9 4.3
Bloomberg Barclays U.S. TIPS Index 2.9 4.8 2.1 1.8 1.2 3.6 4.1
REITs 424,581 0.1 8.9 5.1 6.4 8.0 13.3 8.2
Total REITs Custom Benchmark -0.1 7.7 4.5 6.0 7.6 13.2 7.6
Real Estate 1,284,159 0.9 5.0 7.0 9.0 10.2 8.4 7.1
SURS Real Estate Index 1.2 6.5 7.0 9.2 9.7 7.7 7.2
Private Equity 1,392,683 3.9 12.3 13.6 9.8 10.8 12.1 11.3
Dow Jones US Total Stock Market +3% Lag 14.9 11.9 16.8 13.6 15.9 19.4 12.0
Opportunity Fund 119,422 1.7 5.7 3.1 4.7 8.1 12.1 8.9
Opportunity Fund Custom Benchmark 2.4 6.9 7.4 6.6 6.6 - -
Hedge Funds 781,315 1.5 1.7 3.9 - - - -
Hedge Funds Custom Benchmark 2.3 5.5 6.0 - - - -
Commodities 352,460 -2.0 -4.1 1.3 - - - -
Bloomberg Commodity Index Total Return -1.2 -6.8 -2.2 - - - -
Cash 229,561 1.4 5.0 2.7 1.7 1.2 0.9 1.9
FTSE 3 Month T-Bill 0.6 2.3 1.4 0.8 0.6 0.5 1.3
Asset Class Performance (Net-of-Fees)
As of June 30, 2019
State Universities Retirement System of Illinois (SURS)23
Exhibit 8

Private Markets Performance^ As of 3/31/2019
^ Information provided by Northern Trust.
Composite Level IRRs
1-Year 3-Year 5-Year 10-Year Since Inception
Real Estate 7.1% 7.6% 9.5% 9.1% 7.1%
Infrastructure 5.4% 3.2% 4.5% -- 6.1%
Private Equity 13.6% 14.2% 10.0% 12.9% 20.3%
Capital Commitment ($) Draw Down ($) Distributed ($) Market Value ($) TVPI Multiple
Real Estate 1,610,825,445 1,313,709,245 823,684,136 1,048,550,057 1.4
Infrastructure 180,000,000 139,365,765 64,608,607 113,531,215 1.3
Private Equity 3,912,977,348 2,915,937,960 3,602,172,903 1,240,076,458 1.7
24
Exhibit 8

-1.0
2.0
5.0
8.0
11.0
14.0
Re
turn
3 Mo (Rank) 1 YR (Rank) 3 YR (Rank) 5 YR (Rank) 7 YR (Rank) 10 YR (Rank)
Total Fund w/ Overlay 3.0 (60) 6.3 (45) 9.0 (57) 6.1 (53) 8.7 (33) 10.0 (23)¢
Policy Benchmark 3.8 (9) 6.8 (31) 8.8 (68) 6.0 (62) 8.5 (43) 9.9 (27)�
5th Percentile 4.1 8.5 10.6 7.2 9.8 10.5
1st Quartile 3.5 7.1 9.6 6.6 9.2 9.9
Median 3.2 5.9 9.2 6.2 8.4 9.3
3rd Quartile 2.8 5.3 8.6 5.6 7.6 8.9
95th Percentile 2.3 4.1 6.3 4.4 6.4 7.6
Population 100 97 96 95 93 90
Plan Sponsor Peer Group AnalysisTotal Fund w/ Overlay vs. Investment Metrics Public Plans > $1B Gross
Calculation based on monthly periodicity.Median is the Investment Metrics(IM) Gross of Fees Total Public Fund Greater than $1 Billion Universe which includes BNY Mellon Public Fund >$1Bil Universe and IMclient data. 25
Exhibit 8

-20.0
-10.0
0.0
10.0
20.0
30.0
40.0
Re
turn
2009(Rank) 2010 2011 2012 2013 2014 2015 2016 2017 2018
Total Fund w/ Overlay 23.4 (14) 14.0 (34) 0.3 (73) 14.2 (29) 17.3 (27) 6.8 (42) 0.4 (51) 6.9 (77) 16.5 (35) -4.0 (71)¢
SURS Policy Benchmark 23.1 (16) 13.5 (48) 0.2 (76) 14.7 (9) 16.4 (35) 7.2 (30) -0.6 (76) 7.8 (54) 15.5 (58) -3.4 (57)�
5th Percentile 25.9 16.1 8.0 14.8 20.0 8.8 2.4 9.6 18.2 0.9
1st Quartile 21.7 14.3 2.4 14.2 17.4 7.5 1.1 8.5 16.8 -1.6
Median 19.3 13.3 1.0 13.3 15.2 6.6 0.5 7.9 16.0 -3.0
3rd Quartile 15.4 12.3 0.3 12.1 11.8 5.4 -0.5 7.0 14.5 -4.3
95th Percentile 7.7 8.8 -0.9 8.8 5.4 4.9 -1.8 1.6 9.6 -6.5
Population 53 57 60 64 81 86 108 122 111 135
Calendar Year Returns
Plan Sponsor Peer Group Analysis
Total Fund w/ Overlay vs. Investment Metrics Public Plans > $1B Gross
Parenthesis contain percentile rankings.Calculation based on quarterly periodicity.Median is the Investment Metrics(IM) Gross of Fees Public Fund Greater than $1 Billion Universe which includes BNY Mellon Public Fund > $1Bil Universe and IM client data. 26
Exhibit 8

-20.0
0.0
20.0
40.0
60.0
80.0
All
oc
ati
on
(%)
US Equity Intl. EquityUS FixedIncome
Intl. FixedIncome
Alternative Inv. Real Estate Cash
Total Fund w/ Overlay 25.0 (52) 28.9 (9) 21.9 (46) 2.5 (48) 8.8 (80) 8.7 (35) 1.8 (52)¢
5th Percentile 47.7 31.4 60.1 11.9 42.6 12.7 8.9
1st Quartile 34.3 23.2 26.8 6.0 23.7 9.1 3.4
Median 25.3 18.7 21.0 2.4 17.9 6.1 1.9
3rd Quartile 19.7 14.3 17.6 0.5 12.0 4.2 0.9
95th Percentile 11.2 7.0 8.5 0.0 4.8 1.2 0.3
Population 87 85 85 49 71 63 62
Total Plan Allocation vs. Investment Metrics Public Plans > $1 Billion
As of June 30, 2019
Parentheses contain percentile rankings.Calculation based on monthly periodicity.Median is the Investment Metrics(IM) Gross of Fees Total Public Greater than $1 Billion Fund Universe which includes BNY Mellon Public Fund >$1Bil Universe and IM client data.Alternative Inv. class includes all funds not allocated to the other listed classes.
27
Exhibit 8

RISK
Exhibit 8

0.0
3.0
6.0
9.0
12.0
15.0
Re
turn
(%)
0.0 2.0 4.0 6.0 8.0 10.0 12.0 14.0 16.0 18.0 20.0
Risk (Standard Deviation %)
Return(Rank)Standard
Deviation(Rank)Sharpe
Ratio(Rank)InformationRatio(Rank)
9.7 (34) 8.4 (80) 1.1 (81) -0.2 (44)
9.3 7.5 1.2 -0.3
9.9 8.3 1.1 -
Total Fund Risk/Return - 10 YearsAs of June 30, 2019
State Universities Retirement System of Illinois (SURS)
(1) Investment Metrics (IM) Median [Gross of Fees] - Total Public Fund Greater than $1 Billion Universe includes BNY Mellon Total Public Fund >$1Bil Universe and IM client data.
29
Policy Benchmark
Public Fund Median (1)
Total Fund w/ Overlay
Exhibit 8

0.0
3.0
6.0
9.0
12.0
15.0
Re
turn
(%)
0.0 0.7 1.4 2.1 2.8 3.5 4.2 4.9 5.6 6.3 7.0 7.7 8.0
Risk (Standard Deviation %)
Return (Rank)Standard
Deviation (Rank)Sharpe
Ratio (Rank)InformationRatio (Rank)
Total Fund w/ Overlay 5.8 (68) 7.0 (67) 0.7 (76) -0.2 (74)
Policy Index 6.0 (62) 6.9 (64) 0.8 (73) -
All Public Plans > $1B-Total Fund Median 6.2 6.4 0.9 0.1
Total Fund Risk/Return - 5 YearsAs of June 30, 2019
State Universities Retirement System of Illinois (SURS)
(1) Investment Metrics (IM) Median [Gross of Fees] - Total Public Fund Greater than $1 Billion Universe includes BNY Mellon Public Fund >$1Bil Universe and IM client data.
30
Exhibit 8

ReturnStandardDeviation
SharpeRatio
InformationRatio
SortinoRatio
TrackingError
Total Fund w/ Overlay 5.82 7.03 0.72 -0.16 1.13 0.80
Policy Index 5.97 6.91 0.75 - 1.22 0.00
Domestic Equity 9.72 12.50 0.74 -0.51 1.12 0.68
Dow Jones U.S. Total Stock Market Index 10.13 12.24 0.78 - 1.21 0.00
Total Non US Equity 2.59 12.27 0.20 0.37 0.29 1.05
International Equity Custom Benchmark 2.16 12.44 0.17 - 0.24 0.00
Global Equity 8.28 12.22 0.65 1.09 1.00 1.88
Global Equity Benchmark 6.16 11.69 0.50 - 0.75 0.00
Fixed Income 3.06 2.46 0.91 0.12 1.55 0.81
Fixed Income Custom Benchmark 2.95 2.91 0.73 - 1.21 0.00
TIPS 1.61 3.54 0.23 -0.38 0.34 0.38
Bloomberg Barclays U.S. TIPS Index 1.76 3.48 0.28 - 0.42 0.00
REITs 6.37 12.23 0.50 0.93 0.82 1.61
FTSE EPRA/NAREIT Developed Index (Net) 4.85 11.78 0.39 - 0.62 0.00
Real Estate 9.03 2.06 3.65 -0.06 39.94 1.95
SURS Real Estate Index 9.18 0.81 7.88 - - 0.00
Private Equity 9.79 4.31 2.02 -0.32 11.27 12.39
Dow Jones US Total Stock Market +3% Lag 13.58 11.42 1.10 - 1.79 0.00
Opportunity Fund 4.68 4.76 0.81 0.67 1.73 4.83
CPI - All Urban Consumers (Unadjusted) Lag 1.47 1.00 0.63 - 0.96 0.00
Cash 1.69 0.57 2.35 2.35 6.85 0.35
FTSE 3 Month T-Bill 0.84 0.25 -0.18 - -0.05 0.00
Total Fund Risk Statistics (Net-of-Fees)5 Years
As of June 30, 2019
State Universities Retirement System of Illinois (SURS) 31
Exhibit 8

ReturnStandardDeviation
SharpeRatio
InformationRatio
SortinoRatio
TrackingError
Total Fund w/ Overlay 8.78 6.57 1.11 0.00 1.70 0.86
Policy Index 8.79 6.39 1.14 - 1.82 0.00
Domestic Equity 13.61 12.73 0.96 -0.39 1.40 0.75
Dow Jones U.S. Total Stock Market Index 13.99 12.37 1.02 - 1.49 0.00
Total Non US Equity 9.29 11.37 0.72 -0.08 1.09 0.91
International Equity Custom Benchmark 9.39 11.24 0.73 - 1.10 0.00
Global Equity 14.08 12.01 1.05 1.11 1.61 2.06
Global Equity Benchmark 11.62 11.16 0.92 - 1.36 0.00
Fixed Income 3.08 2.54 0.70 1.00 1.05 0.73
Fixed Income Custom Benchmark 2.31 2.99 0.34 - 0.48 0.00
Emerging Market Debt 5.47 7.70 0.56 0.40 0.77 1.28
50% JPM GBI-EM GD / 25% JPM EMBI GD / 25% JPM Corp Broad 5.02 6.62 0.57 - 0.80 0.00
TIPS 2.25 2.91 0.32 1.01 0.45 0.17
Bloomberg Barclays U.S. TIPS Index 2.08 2.90 0.26 - 0.36 0.00
REITs 5.09 11.01 0.38 1.60 0.59 0.38
FTSE EPRA/NAREIT Developed Index (Net) 4.46 10.97 0.33 - 0.50 0.00
Real Estate 7.03 1.48 3.56 0.02 18.86 1.43
SURS Real Estate Index 7.00 0.25 13.43 - - 0.00
Private Equity 13.57 4.52 2.55 -0.28 28.94 11.90
Dow Jones US Total Stock Market +3% Lag 16.82 10.96 1.35 - 2.05 0.00
Opportunity Fund 3.14 4.42 0.42 0.23 0.78 4.36
CPI - All Urban Consumers (Unadjusted) Lag 2.20 0.83 0.95 - 1.74 0.00
Cash 2.68 0.58 3.21 3.20 12.92 0.41
FTSE 3 Month T-Bill 1.36 0.22 -0.31 - -0.08 0.00
Total Fund Risk Statistics (Net-of-Fees)3 Years
As of June 30, 2019
State Universities Retirement System of Illinois (SURS) 32
Exhibit 8

ATTRIBUTION
Exhibit 8
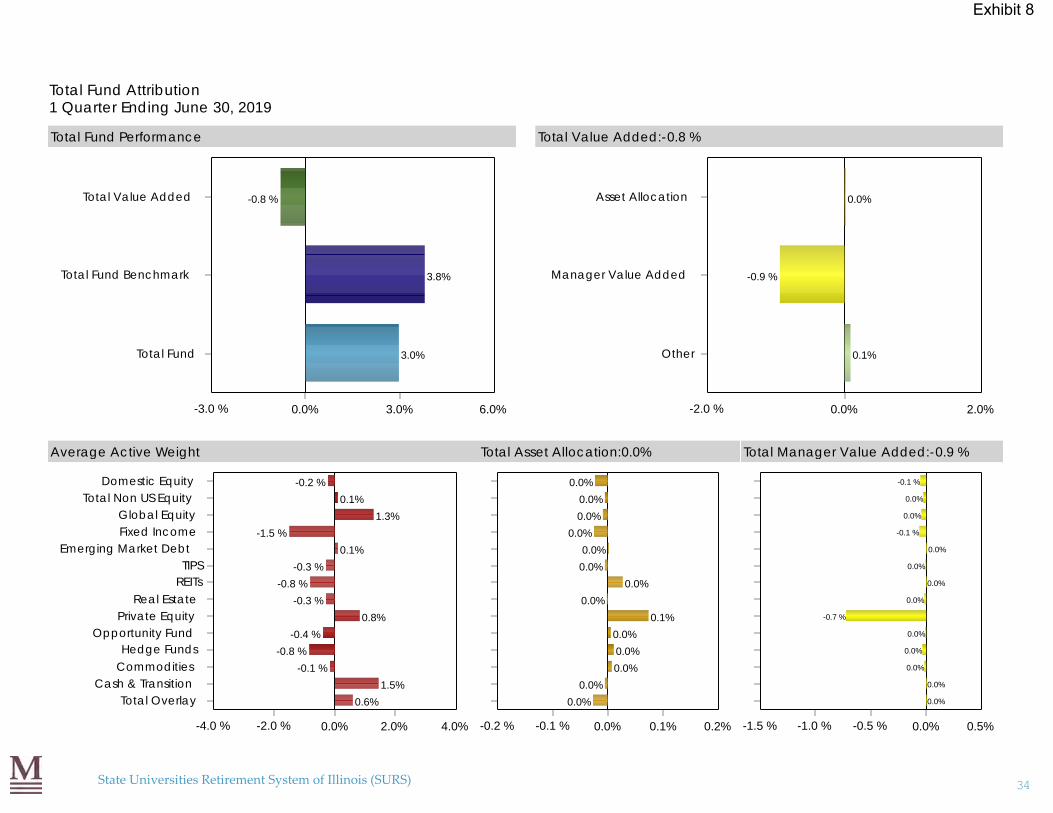
Total Fund Performance
0.0% 3.0% 6.0%-3.0 %
Total Fund
Total Fund Benchmark
Total Value Added
3.0%
3.8%
-0.8 %
Total Value Added:-0.8 %
0.0% 2.0%-2.0 %
Other
Manager Value Added
Asset Allocation
0.1%
-0.9 %
0.0%
Average Active Weight
0.0% 2.0% 4.0%-2.0 %-4.0 %
Total Overlay
Cash & Transition
Commodities
Hedge Funds
Opportunity Fund
Private Equity
Real Estate
REITs
TIPS
Emerging Market Debt
Fixed Income
Global Equity
Total Non US Equity
Domestic Equity
0.6%
1.5%
-0.1 %
-0.8 %
-0.4 %
0.8%
-0.3 %
-0.8 %
-0.3 %
0.1%
-1.5 %
1.3%
0.1%
-0.2 %
Total Asset Allocation:0.0%
0.0% 0.1% 0.2%-0.1 %-0.2 %
0.0%
0.0%
0.0%
0.0%
0.0%
0.1%
0.0%
0.0%
0.0%
0.0%
0.0%
0.0%
0.0%
0.0%
Total Manager Value Added:-0.9 %
0.0% 0.5%-0.5 %-1.0 %-1.5 %
0.0%
0.0%
0.0%
0.0%
0.0%
-0.7 %
0.0%
0.0%
0.0%
0.0%
-0.1 %
0.0%
0.0%
-0.1 %
Total Fund Attribution1 Quarter Ending June 30, 2019
State Universities Retirement System of Illinois (SURS) 34
Exhibit 8

PortfolioWeight
PolicyWeight
ExcessWeight
PortfolioReturn
PolicyReturn
Allocation Selection Interaction Total
Domestic Equity 22.8 23.0 -0.2 3.8 4.1 0.0 -0.1 0.0 -0.1
Total Non US Equity 19.1 19.0 0.1 2.9 3.0 0.0 0.0 0.0 0.0
Global Equity 9.3 8.0 1.3 3.2 3.6 0.0 0.0 0.0 0.0
Fixed Income 17.5 19.0 -1.5 2.7 3.1 0.0 -0.1 0.0 -0.1
Emerging Market Debt 3.1 3.0 0.1 5.3 4.7 0.0 0.0 0.0 0.0
TIPS 3.7 4.0 -0.3 2.9 2.9 0.0 0.0 0.0 0.0
REITs 3.2 4.0 -0.8 0.1 -0.1 0.0 0.0 0.0 0.0
Real Estate 5.7 6.0 -0.3 0.9 1.2 0.0 0.0 0.0 0.0
Private Equity 6.8 6.0 0.8 3.9 14.9 0.1 -0.7 -0.1 -0.6
Opportunity Fund 0.6 1.0 -0.4 1.7 1.8 0.0 0.0 0.0 0.0
Hedge Funds 4.2 5.0 -0.8 1.5 2.3 0.0 0.0 0.0 0.0
Commodities 1.9 2.0 -0.1 -2.0 -1.2 0.0 0.0 0.0 0.0
Cash & Transition 1.5 0.0 1.5 0.4 0.6 0.0 0.0 0.0 0.0
Total Overlay 0.6 0.0 0.6 0.1 0.6 0.0 0.0 0.0 0.0
Total Fund w/ Overlay 100.0 100.0 0.0 3.0 3.8 0.0 -0.9 -0.1 -0.8
Total Fund Attribution1 Quarter Ending June 30, 2019
State Universities Retirement System of Illinois (SURS) 35
Exhibit 8

Total Fund Performance
0.0% 4.0% 8.0% 12.0%-4.0 %
Total Fund
Total Fund Benchmark
Total Value Added
6.0%
6.8%
-0.8 %
Total Value Added:-0.8 %
0.0% 2.0%-2.0 %
Other
Manager Value Added
Asset Allocation
0.2%
-0.6 %
-0.5 %
Average Active Weight
0.0% 2.0%-2.0 %-4.0 %
Total Overlay
Cash & Transition
Commodities
Hedge Funds
Opportunity Fund
Private Equity
Real Estate
REITs
TIPS
Emerging Market Debt
Fixed Income
Global Equity
Total Non US Equity
Domestic Equity
0.5%
1.1%
-0.1 %
-0.3 %
-0.4 %
0.5%
-0.5 %
-0.5 %
-0.3 %
0.0%
-1.7 %
1.2%
-0.1 %
0.7%
Total Asset Allocation:-0.5 %
0.0% 0.1%-0.1 %-0.2 %-0.3 %
-0.1 %
0.0%
0.0%
0.0%
0.0%
-0.1 %
0.0%
0.0%
0.0%
0.0%
-0.1 %
0.0%
0.0%
0.0%
Total Manager Value Added:-0.6 %
0.0% 0.3% 0.6%-0.3 %-0.6 %
0.0%
0.0%
0.1%
-0.2 %
0.0%
0.0%
-0.1 %
0.0%
0.0%
0.0%
0.0%
0.2%
-0.1 %
-0.4 %
Total Fund Attribution1 Year Ending June 30, 2019
State Universities Retirement System of Illinois (SURS) 36
Exhibit 8

PortfolioWeight
PolicyWeight
ExcessWeight
PortfolioReturn
PolicyReturn
Allocation Selection Interaction Total
Domestic Equity 23.7 23.0 0.7 7.3 8.9 0.0 -0.4 0.0 -0.4
Total Non US Equity 18.9 19.0 -0.1 0.6 1.3 0.0 -0.1 0.0 -0.2
Global Equity 9.2 8.0 1.2 7.5 5.7 0.0 0.2 0.0 0.1
Fixed Income 17.3 19.0 -1.7 7.6 7.9 -0.1 0.0 0.0 -0.2
Emerging Market Debt 3.0 3.0 0.0 10.8 10.4 0.0 0.0 0.0 0.0
TIPS 3.7 4.0 -0.3 4.9 4.8 0.0 0.0 0.0 0.0
REITs 3.5 4.0 -0.5 8.9 7.7 0.0 0.0 0.0 0.0
Real Estate 5.5 6.0 -0.5 5.0 6.5 0.0 -0.1 0.0 -0.1
Private Equity 6.5 6.0 0.5 12.3 11.9 -0.1 0.0 0.1 -0.1
Opportunity Fund 0.6 1.0 -0.4 5.7 6.9 0.0 0.0 0.0 0.0
Hedge Funds 4.7 5.0 -0.3 1.7 5.5 0.0 -0.2 0.0 -0.2
Commodities 1.9 2.0 -0.1 -4.1 -6.8 0.0 0.1 0.0 0.1
Cash & Transition 1.1 0.0 1.1 0.4 2.3 0.0 0.0 0.0 0.0
Total Overlay 0.5 0.0 0.5 0.3 2.3 -0.1 0.0 0.0 -0.1
Total Fund w/ Overlay 100.0 100.0 0.0 6.0 6.8 -0.5 -0.6 0.1 -0.8
Total Fund Attribution1 Year Ending June 30, 2019
State Universities Retirement System of Illinois (SURS) 37
Exhibit 8

Portfolio Characteristics
Portfolio Benchmark
Wtd. Avg. Mkt. Cap ($M) 188,100 202,131
Median Mkt. Cap ($M) 1,422 1,670
Price/Earnings ratio 19.7 20.3
Price/Book ratio 3.3 3.4
5 Yr. EPS Growth Rate (%) 15.6 15.4
Current Yield (%) 1.9 1.9
Beta (5 Years, Monthly) 1.0 1.0
Number of Stocks 3,571 2,954
Debt to Equity 1.7 1.8
Top Ten Equity Holdings
PortfolioWeight
(%)
BenchmarkWeight
(%)
ActiveWeight
(%)
QuarterlyReturn
(%)
Microsoft Corp 3.5 3.5 0.0 14.0
Apple Inc 2.7 3.2 -0.5 4.6
Amazon.com Inc 2.5 2.7 -0.2 6.3
Facebook Inc 1.6 1.6 0.0 15.8
Johnson & Johnson 1.2 1.3 -0.1 0.3
Alphabet Inc 1.2 1.1 0.1 -7.9
Visa Inc 1.1 1.0 0.1 11.3
Berkshire Hathaway Inc 1.1 1.4 -0.3 6.1
Procter & Gamble Co (The) 1.0 0.9 0.1 6.1
Exxon Mobil Corp 1.0 1.1 -0.1 -4.1
% of Portfolio 16.9 17.8 -0.9
Sector Weights (%)
Domestic Equity Russell 3000 Index
0.0 5.0 10.0 15.0 20.0 25.0 30.0
Other
Utilities
Real Estate
Materials
Information Technology
Industrials
Health Care
Financials
Energy
Consumer Staples
Consumer Discretionary
Communication Services
0.0
3.2
4.0
3.2
21.5
10.7
13.5
13.7
4.7
6.1
10.7
8.9
0.0
3.2
3.9
3.0
21.4
10.2
14.0
13.6
4.7
6.5
10.4
9.1
Distribution of Market Capitalization (%)
Domestic Equity Russell 3000 Index
0.0
15.0
30.0
45.0
60.0
>100 Bil 75 Bil - 100 Bil
25 Bil - 75 Bil
15 Bil - 25 Bil
2 Bil - 15 Bil
0 - 2 Bil
45.8
3.9
22.3
8.2
16.6
3.2
41.8
3.6
22.1
9.1
19.5
3.9
Domestic Equity Portfolio Characteristics
As of June 30, 2019
State Universities Retirement System of Illinois (SURS) 38
Exhibit 8

Region
Domestic Equity Russell 3000 Index
0.0 25.0 50.0 75.0 100.0 125.0
Other
United Kingdom
Pacific ex Japan
North America
Middle East
Europe ex UK
EM Latin America
EM Asia
0.0
0.8
0.0
96.9
0.0
2.3
0.0
0.0
0.0
1.0
0.0
96.5
0.0
2.4
0.0
0.1
Top Ten Contributors
PortfolioWeight
(%)
BenchmarkWeight
(%)
ActiveWeight
(%)
QuarterlyReturn
(%)
Microsoft Corp 3.2 3.2 0.0 14.0
Facebook Inc 1.4 1.4 0.0 15.8
Amazon.com Inc 2.4 2.6 -0.2 6.3
Walt Disney Co (The) 0.5 0.7 -0.2 25.8
Apple Inc 2.7 3.2 -0.5 4.6
Visa Inc 1.0 1.0 0.0 11.3
JPMorgan Chase & Co 0.9 1.2 -0.3 11.3
Mastercard Inc 0.7 0.8 -0.1 12.5
AT&T Inc 0.9 0.8 0.1 8.6
Berkshire Hathaway Inc 1.2 1.4 -0.2 6.1
% of Portfolio 14.9 16.3 -1.4
Top Ten Detractors
PortfolioWeight
(%)
BenchmarkWeight
(%)
ActiveWeight
(%)
QuarterlyReturn
(%)
Alphabet Inc 1.4 1.3 0.1 -7.9
Intel Corp 0.9 0.9 0.0 -10.3
Altria Group Inc 0.5 0.4 0.1 -16.3
Alphabet Inc 1.0 1.2 -0.2 -8.0
DuPont De Nemours Inc 0.3 0.4 -0.1 -20.6
Philip Morris International Inc 0.6 0.5 0.1 -9.8
Eli Lilly and Co 0.4 0.4 0.0 -14.1
Exxon Mobil Corp 1.2 1.2 0.0 -4.1
3M Co 0.3 0.4 -0.1 -15.9
Regeneron Pharma 0.2 0.1 0.1 -23.8
% of Portfolio 6.8 6.8 0.0
Sector Allocation
SectorNumber of
AssetsMarket Value
($000)
PortfolioWeight
(%)
BenchmarkWeight
(%)
ActiveWeight
(%)
Communication Services 143 373,052 8.9 9.1 -0.3
Consumer Discretionary 382 449,646 10.7 10.4 0.3
Consumer Staples 117 255,047 6.1 6.5 -0.4
Energy 197 197,210 4.7 4.7 0.0
Financials 612 574,363 13.7 13.6 0.0
Health Care 584 566,369 13.5 14.0 -0.5
Industrials 425 449,909 10.7 10.2 0.5
Information Technology 415 902,217 21.5 21.4 0.1
Materials 137 135,999 3.2 3.0 0.2
Real Estate 201 167,036 4.0 3.9 0.0
Utilities 76 134,808 3.2 3.2 0.0
Total 3,289 4,205,656 100.0 100.0 0.0
Domestic Equity Portfolio Characteristics
As of June 30, 2019
State Universities Retirement System of Illinois (SURS) 39
Exhibit 8

Portfolio Characteristics
Portfolio Benchmark
Wtd. Avg. Mkt. Cap ($M) 60,244 67,766
Median Mkt. Cap ($M) 6,982 7,982
Price/Earnings ratio 13.3 14.0
Price/Book ratio 2.2 2.2
5 Yr. EPS Growth Rate (%) 11.3 9.7
Current Yield (%) 3.4 3.4
Beta (5 Years, Monthly) 1.0 1.0
Number of Stocks 2,505 2,206
Debt to Equity 1.3 1.1
Top Ten Equity Holdings
PortfolioWeight
(%)
BenchmarkWeight
(%)
ActiveWeight
(%)
QuarterlyReturn
(%)
Nestle SA 1.5 1.5 0.0 11.5
Roche Holding AG 1.4 0.9 0.5 2.1
Samsung Electronics Co Ltd 1.0 0.9 0.1 4.2
Tencent Holdings LTD 1.0 1.2 -0.2 -1.6
Novartis AG 1.0 0.9 0.1 7.3
Alibaba Group Holding Ltd 0.9 1.2 -0.3 -7.1
Allianz SE 0.7 0.5 0.2 13.3
Taiwan Semiconductor 0.7 0.9 -0.2 0.1
Total SA Oil & Gas 0.7 0.6 0.1 2.2
SAP AG 0.7 0.6 0.1 20.4
% of Portfolio 9.6 9.2 0.4
Sector Weights (%)
Total Non US Equity
MSCI AC World ex USA
0.0 5.0 10.0 15.0 20.0 25.0 30.0
Utilities
Real Estate
Materials
Information Technology
Industrials
Health Care
Financials
Energy
Consumer Staples
Consumer Discretionary
Communication Services
3.2
4.4
7.7
8.5
13.3
9.3
20.1
6.3
8.7
10.9
7.5
3.3
3.3
7.6
8.5
11.9
8.3
21.9
7.1
9.8
11.3
6.9
Distribution of Market Capitalization (%)
Total Non US Equity MSCI AC World ex USA
0.0
10.0
20.0
30.0
40.0
>100 Bil 75 Bil - 100 Bil
25 Bil - 75 Bil
15 Bil - 25 Bil
2 Bil - 15 Bil
0 - 2 Bil
21.1
5.9
32.6
12.9
27.0
0.5
18.4
4.2
31.0
13.4
30.8
2.3
Non-U.S. Equity Portfolio Characteristics
As of June 30, 2019
State Universities Retirement System of Illinois (SURS) 40
Exhibit 8

Region
Total Non US Equity
MSCI AC World ex USA
0.0 8.0 16.0 24.0 32.0 40.0 48.0
Other
United Kingdom
Pacific ex Japan
North America
Middle East
Japan
Europe ex UK
EM Mid East+Africa
EM Latin America
EM Europe
EM Asia
0.3
8.1
12.0
5.7
0.7
16.6
35.5
2.2
3.1
1.6
14.2
0.3
9.5
11.7
7.0
0.4
15.8
32.5
2.4
3.2
1.7
15.6
Top Ten Contributors
PortfolioWeight
(%)
BenchmarkWeight
(%)
ActiveWeight
(%)
QuarterlyReturn
(%)
Nestle SA 1.3 1.4 -0.1 11.5
SAP AG 0.6 0.6 0.0 20.4
Adidas AG 0.3 0.2 0.1 28.8
Louis Vuitton Moet Hennessy 0.5 0.5 0.0 17.1
Allianz SE 0.6 0.5 0.1 13.3
Novartis AG 0.9 1.0 -0.1 7.3
Ferrari NV 0.3 0.1 0.2 22.2
Hoya Corp 0.3 0.1 0.2 16.1
Schneider Electric SA 0.3 0.2 0.1 19.2
Gazprom PJSC 0.1 0.1 0.0 61.8
% of Portfolio 5.2 4.7 0.5
Top Ten Detractors
PortfolioWeight
(%)
BenchmarkWeight
(%)
ActiveWeight
(%)
QuarterlyReturn
(%)
Imperial Brands PLC 0.3 0.2 0.1 -30.3
Koninklijke Ahold Delhaize NV 0.7 0.2 0.5 -12.8
Alibaba Group Holding Ltd 0.9 1.2 -0.3 -7.1
Baidu Inc 0.2 0.2 0.0 -28.8
Taisei Corp 0.2 0.0 0.2 -21.7
Teva Pharmaceutical 0.1 0.1 0.0 -41.1
British American Tobacco 0.3 0.5 -0.2 -14.5
Central Japan Railway Corp 0.3 0.2 0.1 -13.7
Kirin Holdings Co Ltd 0.4 0.1 0.3 -8.4
Lloyds Banking Group PLC 0.4 0.3 0.1 -8.1
% of Portfolio 3.8 3.0 0.8
Sector Allocation
SectorNumber of
AssetsMarket Value
($000)
PortfolioWeight
(%)
BenchmarkWeight
(%)
ActiveWeight
(%)
Communication Services 155 256,715 7.5 6.9 0.6
Consumer Discretionary 283 370,935 10.9 11.3 -0.4
Consumer Staples 202 298,485 8.7 9.8 -1.1
Energy 115 214,865 6.3 7.1 -0.9
Financials 445 688,516 20.1 21.9 -1.8
Health Care 164 318,994 9.3 8.3 1.1
Industrials 379 456,314 13.3 11.9 1.4
Information Technology 184 291,774 8.5 8.5 0.0
Materials 252 261,938 7.7 7.6 0.0
Real Estate 147 149,329 4.4 3.3 1.1
Utilities 121 110,408 3.2 3.3 -0.1
Total 2,447 3,418,273 100.0 100.0 0.0
Non-U.S. Equity Portfolio Characteristics
As of June 30, 2019
State Universities Retirement System of Illinois (SURS) 41
Exhibit 8

Portfolio Characteristics
Portfolio Benchmark
Wtd. Avg. Mkt. Cap ($M) 147,917 154,940
Median Mkt. Cap ($M) 20,469 9,952
Price/Earnings ratio 19.8 17.1
Price/Book ratio 3.2 2.9
5 Yr. EPS Growth Rate (%) 13.6 13.1
Current Yield (%) 2.0 2.6
Beta (5 Years, Monthly) 1.0 1.0
Number of Stocks 392 2,849
Debt to Equity 1.8 1.5
Top Ten Equity Holdings
PortfolioWeight
(%)
BenchmarkWeight
(%)
ActiveWeight
(%)
QuarterlyReturn
(%)
Visa Inc 2.1 0.6 1.5 11.3
Amazon.com Inc 2.1 1.7 0.4 6.3
Facebook Inc 1.8 1.0 0.8 15.8
Microsoft Corp 1.6 2.1 -0.5 14.0
Allergan PLC 1.6 0.1 1.5 15.0
Apple Inc 1.5 2.0 -0.5 4.6
Johnson & Johnson 1.2 0.8 0.4 0.3
Alphabet Inc 1.2 0.7 0.5 -8.0
Tencent Holdings LTD 1.2 0.6 0.6 -1.6
Samsung Electronics Co Ltd 1.1 0.4 0.7 4.2
% of Portfolio 15.4 10.0 5.4
Sector Weights (%)
Global Equity
MSCI AC World Index (Net)
0.0 5.0 10.0 15.0 20.0 25.0
Other
Utilities
Real Estate
Materials
Information Technology
Industrials
Health Care
Financials
Energy
Consumer Staples
Consumer Discretionary
Communication Services
0.7
4.3
2.5
2.9
20.8
10.1
15.3
13.9
3.5
7.6
10.7
7.9
0.0
3.3
3.2
4.9
16.0
10.5
11.4
16.9
5.9
8.3
10.8
8.7
Distribution of Market Capitalization (%)
Global Equity MSCI AC World Index (Net)
0.0
15.0
30.0
45.0
60.0
>100 Bil 75 Bil - 100 Bil
25 Bil - 75 Bil
15 Bil - 25 Bil
2 Bil - 15 Bil
0 - 2 Bil
37.9
5.1
28.7
10.9
17.2
0.2
36.2
3.3
26.6
12.8
20.1
1.1
Global Equity Portfolio Characteristics
As of June 30, 2019
State Universities Retirement System of Illinois (SURS) 42
Exhibit 8

Region
Global Equity
MSCI AC World Index (Net)
0.0 15.0 30.0 45.0 60.0 75.0
Other
United Kingdom
Pacific ex Japan
North America
Middle East
Japan
Europe ex UK
EM Mid East+Africa
EM Latin America
EM Europe
EM Asia
0.2
7.4
5.1
53.0
0.8
9.6
16.9
0.4
0.7
0.1
5.7
0.1
4.9
5.2
56.3
0.2
7.1
15.9
1.1
1.5
0.7
7.0
Top Ten Contributors
PortfolioWeight
(%)
BenchmarkWeight
(%)
ActiveWeight
(%)
QuarterlyReturn
(%)
Facebook Inc 1.7 0.9 0.8 15.8
Microsoft Corp 1.7 1.9 -0.2 14.0
Visa Inc 1.8 0.6 1.2 11.3
Allergan PLC 1.3 0.1 1.2 15.0
EXACT Sciences Corp 0.5 0.0 0.5 36.3
Hitachi High-Technologies Corp 0.6 0.0 0.6 25.6
Ferrari NV 0.6 0.0 0.6 21.6
CME Group Inc 0.6 0.1 0.5 18.4
Essity Aktiebolag 1.3 0.0 1.3 8.7
Amazon.com Inc 1.8 1.6 0.2 6.3
% of Portfolio 11.9 5.2 6.7
Top Ten Detractors
PortfolioWeight
(%)
BenchmarkWeight
(%)
ActiveWeight
(%)
QuarterlyReturn
(%)
Alphabet Inc 1.9 0.8 1.1 -8.0
New York Community Bancorp Inc. 1.0 0.0 1.0 -12.4
Stericycle Inc 1.0 0.0 1.0 -12.3
Largan Precision Co Ltd 0.6 0.0 0.6 -16.6
Otsuka Holdings Co Ltd 0.6 0.0 0.6 -15.7
Ctrip.com International Ltd 0.6 0.0 0.6 -15.5
Alibaba Group Holding Ltd 1.2 0.5 0.7 -7.1
Check Point Software 0.8 0.0 0.8 -8.6
Canada Goose Holdings Inc 0.4 0.0 0.4 -19.3
StoneCo Ltd 0.2 0.0 0.2 -28.0
% of Portfolio 8.3 1.3 7.0
Sector Allocation
SectorNumber of
AssetsMarket Value
($000)
PortfolioWeight
(%)
BenchmarkWeight
(%)
ActiveWeight
(%)
Communication Services 19 138,507 7.9 8.7 -0.8
Consumer Discretionary 35 187,472 10.7 10.8 -0.1
Consumer Staples 15 132,521 7.6 8.3 -0.7
Energy 26 60,879 3.5 5.9 -2.5
Financials 64 243,329 13.9 16.9 -3.0
Health Care 58 267,358 15.3 11.4 3.8
Industrials 54 176,532 10.1 10.5 -0.4
Information Technology 59 364,460 20.8 16.0 4.8
Materials 37 51,435 2.9 4.9 -2.0
Real Estate 11 43,709 2.5 3.2 -0.7
Utilities 10 74,887 4.3 3.3 1.0
Total 388 1,741,089 99.3 100.0 -0.7
Global Equity Portfolio Characteristics
As of June 30, 2019
State Universities Retirement System of Illinois (SURS) 43
Exhibit 8

Credit Quality Distribution (%)
Fixed Income
Blmbg. Barc. U.S. Aggregate Index
0.0
25.0
50.0
75.0
100.0
AAA/A
aa
AA/A
a A
BBB/
Baa
BB/Ba B
Not
Ra
ted
Sector Distribution (%)
Fixed Income
Blmbg. Barc. U.S. Aggregate Index
0.0
20.0
40.0
60.0
-20.0
Trea
s
Gov
Re
Agy M
BS ABS
CM
BS
Corp
Non-$
Oth
er
Portfolio Characteristics
Portfolio Benchmark
Avg. Maturity 7.8 7.9
Effective Duration 4.7 5.7
Yield To Maturity (%) 3.0 2.5
Fixed Income Portfolio Characteristics
As of June 30, 2019
State Universities Retirement System of Illinois (SURS) 44
Exhibit 8

SURS Manager Status Review Summary
Status Manager(s) Strategy CommentsReassessment Fidelity Non-U.S. Equity Performance
# of ManagersEnhanced Review 15
Good Standing 12
Good Standing: A Manager's three (3) year and five (5) year rolling Annualized Alpha (net of fees)
each exceed their Active Manager Premiums (AMPs) for such periods. Managers with less than a
five (5) year performance history will be consdier in Good Standing.
Enhanced Review: A Manager's three (3) year or five (5) year rolling Annualized Alphas (net of
fees) are above their respective Benchmarks but below their AMPs.
Reassessment: A Manager’s (i) three (3) year and five (5) year rolling Annualized Alphas (net of
fees) are below their respective Benchmarks for the preceding two consecutive quarters, and (ii)
three (3) year and five (5) year Information Ratios are negative for the preceding two
consecutive quarters; or other performance metrics reflect a significant negative trend.
Exhibit 9

SURS Manager Status Review
Manager Strategy Status
CastleArk U.S. Small Cap Growth Enhanced Review
T. Rowe PriceLarge Cap Structured Active U.S.
EquityEnhanced Review
Matarin U.S. Small Cap Core Good Standing
Channing U.S. Small-Mid Cap Value Good Standing
Earnest U.S. Mid Cap Core Good Standing
Denali U.S. Large Cap Value Good Standing
PiedmontLarge Cap Structured Active U.S.
EquityEnhanced Review
Gladius U.S. Equity Good Standing
Manager Strategy Status
Ativo All Cap Non-U.S. Equity Enhanced Review
Strategic Global Advisors Large Cap Non-U.S. Developed Enhanced Review
BlackRock Structured Active Non-U.S. Equity Enhanced Review
Fidelity Structured Active Non-U.S. Equity Reassessment
GlobeFlex All Cap Non-U.S. Equity Enhanced Review
Progress Large Cap Non-U.S. Developed Good Standing
U.S. Equity Managers
Non-U.S. Equity Managers
2
Exhibit 9

SURS Manager Status Review
Manager Strategy Status
Mondrian Global Equity Enhanced Review
Wellington Global Equity Enhanced Review
T. Rowe Price Global Equity Good Standing
Manager Strategy Status
Pugh Core Fixed Income Enhanced Review
Smith Graham Core Fixed Income Enhanced Review
LM Core Plus Fixed Income Enhanced Review
PIMCO Total Return Core Plus Fixed Income Enhanced Review
TCW Core Plus Fixed Income Enhanced Review
Garcia Hamilton Core Fixed Income Enhanced Review
Progress Core Fixed Income Good Standing
Neuberger Berman Core Plus Fixed Income Good Standing
Manager Strategy Status
Colchester EM Debt Good Standing
Progress EM Debt Good Standing
Prudential EM Debt Good Standing
Global Equity Managers
Core Fixed Income Managers
Emerging Market Debt Managers
3
Exhibit 9

Performance Analysis (Net of Fees)Description 1-Year 3-Year 5-Year 7-Year 10-Year Since Inc. Inception Date
Fidelity - Gross 0.93 8.62 2.44 6.76 --- 6.68 12/31/2011
Fidelity - Net 0.74 8.36 2.10 6.41 --- 6.35
Annualized Fee 0.19 0.27 0.34 0.35 --- 0.34
MSCI ACWI ex U.S. - Net 1.29 9.39 2.16 6.36 --- 6.08
Excess Return -0.55 -1.03 -0.06 0.05 --- 0.27
Annualized Alpha -0.48 -1.07 -0.04 0.17 --- 0.36
Active Manager Premium 1.50 1.50 1.50 1.50 --- 1.50
Excess Risk Adjusted Returns -1.98 -2.57 -1.54 -1.33 --- -1.14
Risk and RegressionDescription 1-Year 3-Year 5-Year 7-Year 10-Year Since Inc.
Standard Deviation 16.28 11.67 12.31 11.72 --- 12.60
Standard Deviaiton - Benchmark 15.87 11.40 12.55 11.90 --- 12.78
Beta 1.02 1.02 0.97 0.98 --- 0.98
R-Squared 1.00 0.99 0.99 0.99 --- 0.99
Efficiency MeasuresDescription 1-Year 3-Year 5-Year 7-Year 10-Year Since Inc.
Sharpe Ratio -0.10 0.60 0.10 0.49 --- 0.46
Treynor Ratio -1.53 6.85 1.26 5.90 --- 5.87
Sortino Ratio -0.03 0.94 0.23 0.82 --- 0.76
Tracking Error 0.95 1.17 1.51 1.44 --- 1.47
Information Ratio -0.58 -0.88 -0.04 0.04 --- 0.18
Upside Market Capture 101.21 97.69 96.34 98.24 --- 98.71
Downside Market Capture 103.38 104.09 96.85 97.48 --- 96.87
Status Evaluation:
3yr Alpha 5yr Alpha AMP3yr Alpha vs.
AMP5yr Alpha vs.
AMP StatusCurrent Quarter -1.07 -0.04 1.50 -2.57 -1.54
Prior Quarter -0.99 -0.03 1.50 -2.49 -1.53
Fidelity Select Institutional Plus / Non-U.S. EquityJune 30, 2019
Reassessment
-4.00%
-2.00%
0.00%
2.00%
4.00%
Rolling 3-year Excess Return vs Benchmark
Fidelity - Excess Fidelity - Alpha 1.50%
-0.40%
0.00%
0.40%
0.80%
1.20%
1.60%
De
c-1
6
Jan
-17
Feb
-17
Ma
r-1
7
Ap
r-17
Ma
y-1
7
Jun
-17
Jul-17
Au
g-1
7
Sep
-17
Oc
t-17
No
v-1
7
De
c-1
7
Jan
-18
Feb
-18
Ma
r-1
8
Ap
r-18
Ma
y-1
8
Jun
-18
Jul-18
Au
g-1
8
Sep
-18
Oc
t-18
No
v-1
8
De
c-1
8
Jan
-19
Feb
-19
Ma
r-1
9
Ap
r-19
Ma
y-1
9
Jun
-19
Rolling 5-year Excess Return vs Benchmark
Fidelity - Excess Fidelity - Alpha 1.50%
4
Exhibit 9

Performance Analysis (Net of Fees)Description 1-Year 3-Year 5-Year 7-Year 10-Year Since Inc. Inception Date
CastleArk - Gross 11.58 20.03 10.46 --- --- 15.77 8/31/2012
CastleArk - Net 10.85 19.22 9.74 --- --- 15.02
Annualized Fee 0.73 0.80 0.73 --- --- 0.74
Russell 2000 Growth -0.49 14.69 8.63 --- --- 12.91
Excess Return 11.34 4.53 1.11 --- --- 2.11
Annualized Alpha 10.88 4.46 1.48 --- --- 2.48
Active Manager Premium 2.00 2.00 2.00 --- --- 2.00
Excess Risk Adjusted Returns 8.88 2.46 -0.52 --- --- 0.48
Risk and Regression
Description 1-Year 3-Year 5-Year 7-Year 10-Year Since Inc.Standard Deviation 26.82 17.28 16.95 --- --- 16.02
Standard Deviaiton - Benchmark 26.55 17.44 17.38 --- --- 16.23
Beta 0.99 0.96 0.94 --- --- 0.95
R-Squared 0.96 0.94 0.93 --- --- 0.93
Efficiency MeasuresDescription 1-Year 3-Year 5-Year 7-Year 10-Year Since Inc.
Sharpe Ratio 0.32 1.03 0.52 --- --- 0.90
Treynor Ratio 8.64 18.60 9.43 --- --- 15.12
Sortino Ratio 0.64 1.61 0.86 --- --- 1.44
Tracking Error 5.49 4.39 4.65 --- --- 4.44
Information Ratio 2.07 1.03 0.24 --- --- 0.48
Upside Market Capture 119.35 105.99 98.51 --- --- 99.61
Downside Market Capture 87.56 83.14 91.16 --- --- 89.07
Status Evaluation:
3yr Alpha 5yr Alpha AMP3yr Alpha vs.
AMP5yr Alpha vs.
AMP StatusCurrent Quarter 4.46 1.48 2.00 2.46 -0.52
Prior Quarter 3.72 0.82 2.00 1.72 -1.18
CastleArk / Small Cap Growth U.S. EquityJune 30, 2019
Enhanced
Review
-6.00%
-4.00%
-2.00%
0.00%
2.00%
4.00%
6.00%
Ma
r-16
Ap
r-16
Ma
y-1
6
Jun
-16
Jul-16
Au
g-1
6
Sep
-16
Oc
t-16
No
v-1
6
De
c-1
6
Jan
-17
Feb
-17
Ma
r-17
Ap
r-17
Ma
y-1
7
Jun
-17
Jul-17
Au
g-1
7
Sep
-17
Oc
t-17
No
v-1
7
De
c-1
7
Jan
-18
Feb
-18
Ma
r-18
Ap
r-18
Ma
y-1
8
Jun
-18
Jul-18
Au
g-1
8
Sep
-18
Oc
t-18
No
v-1
8
De
c-1
8
Jan
-19
Feb
-19
Ma
r-19
Ap
r-19
Ma
y-1
9
Jun
-19
Rolling 3-year Excess Return vs Benchmark
CastleArk - Excess CastleArk - Alpha 2.00%
-1.50%
-1.00%
-0.50%
0.00%
0.50%
1.00%
1.50%
2.00%
2.50%
Rolling 5-year Excess Return vs Benchmark
CastleArk - Excess CastleArk - Alpha 2.00%
5
Exhibit 9

Performance Analysis (Net of Fees)Description 1-Year 3-Year 5-Year 7-Year 10-Year Since Inc. Inception Date
T. Rowe Price - Gross 10.93 15.55 11.69 14.82 15.21 10.53 3/31/2008
T. Rowe Price - Net 10.66 15.27 11.39 14.51 14.89 10.22
Annualized Fee 0.27 0.28 0.30 0.31 0.32 0.31
S&P 500 10.42 14.19 10.71 13.98 14.70 9.68
Excess Return 0.25 1.08 0.68 0.53 0.19 0.53
Annualized Alpha 0.14 0.91 0.52 0.38 0.05 0.47
Active Manager Premium 0.75 0.75 0.75 0.75 0.75 0.75
Excess Risk Adjusted Returns -0.61 0.16 -0.23 -0.37 -0.70 -0.28
Risk and Regression
Description 1-Year 3-Year 5-Year 7-Year 10-Year Since Inc.Standard Deviation 19.28 12.29 12.22 11.20 12.90 15.28
Standard Deviaiton - Benchmark 18.99 12.19 12.03 11.07 12.73 15.20
Beta 1.01 1.00 1.01 1.01 1.01 1.00
R-Squared 1.00 0.99 0.99 0.99 0.99 0.99
Efficiency MeasuresDescription 1-Year 3-Year 5-Year 7-Year 10-Year Since Inc.
Sharpe Ratio 0.43 1.13 0.86 1.24 1.12 0.63
Treynor Ratio 8.23 13.83 10.40 13.76 14.24 9.64
Sortino Ratio 0.72 1.69 1.40 2.03 1.87 1.03
Tracking Error 0.96 1.10 1.05 0.99 0.96 1.08
Information Ratio 0.26 0.98 0.65 0.53 0.19 0.49
Upside Market Capture 99.79 102.83 102.43 101.57 101.05 101.76
Downside Market Capture 100.24 97.90 99.39 99.03 100.87 99.43
Status Evaluation:
3yr Alpha 5yr Alpha AMP3yr Alpha vs.
AMP5yr Alpha vs.
AMP StatusCurrent Quarter 0.91 0.52 0.75 0.16 -0.23
Prior Quarter 0.80 0.46 0.75 0.05 -0.29
T.Rowe Price Structured Research Equity / Structured Active U.S. EquityJune 30, 2019
Enhanced
Review
-2.00%
0.00%
2.00%
Feb
-11
Ma
y-1
1
Au
g-1
1
No
v-1
1
Feb
-12
Ma
y-1
2
Au
g-1
2
No
v-1
2
Feb
-13
Ma
y-1
3
Au
g-1
3
No
v-1
3
Feb
-14
Ma
y-1
4
Au
g-1
4
No
v-1
4
Feb
-15
Ma
y-1
5
Au
g-1
5
No
v-1
5
Feb
-16
Ma
y-1
6
Au
g-1
6
No
v-1
6
Feb
-17
Ma
y-1
7
Au
g-1
7
No
v-1
7
Feb
-18
Ma
y-1
8
Au
g-1
8
No
v-1
8
Feb
-19
Ma
y-1
9
Rolling 3-year Excess Return vs Benchmark
T. Rowe Price - Excess T. Rowe Price - Alpha 0.75%
-2.00%
0.00%
2.00%
Feb
-13
Ap
r-13
Jun
-13
Au
g-1
3
Oc
t-13
De
c-1
3
Feb
-14
Ap
r-14
Jun
-14
Au
g-1
4
Oc
t-14
De
c-1
4
Feb
-15
Ap
r-15
Jun
-15
Au
g-1
5
Oc
t-15
De
c-1
5
Feb
-16
Ap
r-16
Jun
-16
Au
g-1
6
Oc
t-16
De
c-1
6
Feb
-17
Ap
r-17
Jun
-17
Au
g-1
7
Oc
t-17
De
c-1
7
Feb
-18
Ap
r-18
Jun
-18
Au
g-1
8
Oc
t-18
De
c-1
8
Feb
-19
Ap
r-19
Jun
-19
Rolling 5-year Excess Return vs Benchmark
T. Rowe Price - Excess T. Rowe Price - Alpha 0.75%
6
Exhibit 9

Performance Analysis (Net of Fees)Description 1-Year 3-Year 5-Year 7-Year 10-Year Since Inc. Inception Date
Earnest - Gross 10.93 16.46 11.45 14.99 --- 12.87 6/30/2011
Earnest - Net 10.50 15.77 10.87 14.49 --- 12.43
Annualized Fee 0.44 0.68 0.58 0.50 --- 0.45
Russell Midcap 7.83 12.16 8.63 13.37 --- 11.37
Excess Return 2.67 3.62 2.24 1.13 --- 1.06
Annualized Alpha 2.25 2.99 1.83 0.64 --- 0.37
Active Manager Premium 1.00 1.00 1.00 1.00 --- 1.00
Excess Risk Adjusted Returns 1.25 1.99 0.83 -0.36 --- -0.63
Risk and Regression
Description 1-Year 3-Year 5-Year 7-Year 10-Year Since Inc.Standard Deviation 23.03 14.06 13.79 12.74 --- 14.71
Standard Deviaiton - Benchmark 21.32 13.43 13.01 12.03 --- 13.52
Beta 1.08 1.03 1.04 1.04 --- 1.07
R-Squared 0.99 0.96 0.96 0.96 --- 0.96
Efficiency MeasuresDescription 1-Year 3-Year 5-Year 7-Year 10-Year Since Inc.
Sharpe Ratio 0.36 1.02 0.73 1.09 --- 0.81
Treynor Ratio 7.60 14.00 9.62 13.38 --- 11.11
Sortino Ratio 0.66 1.56 1.18 1.78 --- 1.39
Tracking Error 2.50 2.70 2.76 2.73 --- 3.03
Information Ratio 1.07 1.34 0.81 0.41 --- 0.35
Upside Market Capture 110.68 106.61 105.65 102.61 --- 104.08
Downside Market Capture 101.86 85.10 92.93 95.77 --- 97.38
Status Evaluation:
3yr Alpha 5yr Alpha AMP3yr Alpha vs.
AMP5yr Alpha vs.
AMP StatusCurrent Quarter 2.99 1.83 1.00 1.99 0.83
Prior Quarter 2.66 1.26 1.00 1.66 0.26
EARNEST Partners / Midcap Core U.S. EquityJune 30, 2019
Good Standing
-6.00%
-4.00%
-2.00%
0.00%
2.00%
4.00%
6.00%
Ma
y-1
4
Jul-14
Sep
-14
No
v-1
4
Jan
-15
Ma
r-1
5
Ma
y-1
5
Jul-15
Sep
-15
No
v-1
5
Jan
-16
Ma
r-1
6
Ma
y-1
6
Jul-16
Sep
-16
No
v-1
6
Jan
-17
Ma
r-1
7
Ma
y-1
7
Jul-17
Sep
-17
No
v-1
7
Jan
-18
Ma
r-1
8
Ma
y-1
8
Jul-18
Sep
-18
No
v-1
8
Jan
-19
Ma
r-1
9
Ma
y-1
9
Rolling 3-year Excess Return vs Benchmark
Earnest - Excess Earnest - Alpha 1.00%
-2.00%-1.50%-1.00%-0.50%0.00%0.50%1.00%1.50%2.00%2.50%
Ma
y-1
6
Jun
-16
Jul-16
Au
g-1
6
Sep
-16
Oc
t-16
No
v-1
6
De
c-1
6
Jan
-17
Feb
-17
Ma
r-1
7
Ap
r-17
Ma
y-1
7
Jun
-17
Jul-17
Au
g-1
7
Sep
-17
Oc
t-17
No
v-1
7
De
c-1
7
Jan
-18
Feb
-18
Ma
r-1
8
Ap
r-18
Ma
y-1
8
Jun
-18
Jul-18
Au
g-1
8
Sep
-18
Oc
t-18
No
v-1
8
De
c-1
8
Jan
-19
Feb
-19
Ma
r-1
9
Ap
r-19
Ma
y-1
9
Jun
-19
Rolling 5-year Excess Return vs Benchmark
Earnest - Excess Earnest - Alpha 1.00%
7
Exhibit 9

Performance Analysis (Net of Fees)Description 1-Year 3-Year 5-Year 7-Year 10-Year Since Inc. Inception Date
Piedmont - Gross 8.03 14.66 11.27 14.67 15.04 8.66 12/31/2007
Piedmont - Net 7.86 14.48 11.10 14.49 14.84 8.45
Annualized Fee 0.17 0.18 0.17 0.18 0.19 0.20
S&P 500 10.42 14.19 10.71 13.98 14.70 8.52
Excess Return -2.55 0.29 0.39 0.51 0.14 -0.07
Annualized Alpha -2.53 -0.05 0.31 0.40 0.10 -0.01
Active Manager Premium 0.75 0.75 0.75 0.75 0.75 0.75
Excess Risk Adjusted Returns -3.28 -0.80 -0.44 -0.35 -0.65 -0.76
Risk and Regression
Description 1-Year 3-Year 5-Year 7-Year 10-Year Since Inc.Standard Deviation 19.58 12.70 12.24 11.26 12.89 15.21
Standard Deviaiton - Benchmark 18.99 12.19 12.03 11.07 12.73 15.22
Beta 1.03 1.03 1.01 1.01 1.01 0.99
R-Squared 1.00 0.98 0.98 0.98 0.99 0.99
Efficiency MeasuresDescription 1-Year 3-Year 5-Year 7-Year 10-Year Since Inc.
Sharpe Ratio 0.28 1.03 0.84 1.23 1.11 0.52
Treynor Ratio 5.39 12.72 10.16 13.77 14.27 7.89
Sortino Ratio 0.51 1.54 1.36 2.02 1.86 0.83
Tracking Error 1.18 2.00 1.81 1.68 1.52 1.66
Information Ratio -2.16 0.15 0.21 0.30 0.09 -0.04
Upside Market Capture 94.87 101.75 99.72 100.27 99.88 99.37
Downside Market Capture 104.66 102.08 97.22 96.52 99.04 99.42
Status Evaluation:
3yr Alpha 5yr Alpha AMP3yr Alpha vs.
AMP5yr Alpha vs.
AMP StatusCurrent Quarter -0.05 0.31 0.75 -0.80 -0.44
Prior Quarter 0.32 0.48 0.75 -0.43 -0.27
Piedmont Investment Advisors / Large Cap Active U.S. EquityJune 30, 2019
Enhanced
Review
-2.00%
0.00%
2.00%
4.00%
No
v-1
0
Feb
-11
Ma
y-1
1
Au
g-1
1
No
v-1
1
Feb
-12
Ma
y-1
2
Au
g-1
2
No
v-1
2
Feb
-13
Ma
y-1
3
Au
g-1
3
No
v-1
3
Feb
-14
Ma
y-1
4
Au
g-1
4
No
v-1
4
Feb
-15
Ma
y-1
5
Au
g-1
5
No
v-1
5
Feb
-16
Ma
y-1
6
Au
g-1
6
No
v-1
6
Feb
-17
Ma
y-1
7
Au
g-1
7
No
v-1
7
Feb
-18
Ma
y-1
8
Au
g-1
8
No
v-1
8
Feb
-19
Ma
y-1
9
Rolling 3-year Excess Return vs Benchmark
Piedmont - Excess Piedmont - Alpha 0.75%
-2.00%
0.00%
2.00%
No
v-1
2
Jan
-13
Ma
r-1
3
Ma
y-1
3
Jul-13
Sep
-13
No
v-1
3
Jan
-14
Ma
r-1
4
Ma
y-1
4
Jul-14
Sep
-14
No
v-1
4
Jan
-15
Ma
r-1
5
Ma
y-1
5
Jul-15
Sep
-15
No
v-1
5
Jan
-16
Ma
r-1
6
Ma
y-1
6
Jul-16
Sep
-16
No
v-1
6
Jan
-17
Ma
r-1
7
Ma
y-1
7
Jul-17
Sep
-17
No
v-1
7
Jan
-18
Ma
r-1
8
Ma
y-1
8
Jul-18
Sep
-18
No
v-1
8
Jan
-19
Ma
r-1
9
Ma
y-1
9
Rolling 5-year Excess Return vs Benchmark
Piedmont - Excess Piedmont - Alpha 0.75%
8
Exhibit 9

Performance Analysis (Net of Fees)Description 1-Year 3-Year 5-Year 7-Year 10-Year Since Inc. Inception Date
Ativo - Gross 3.51 7.81 3.31 7.98 8.80 4.47 7/31/2008
Ativo - Net 3.22 7.54 3.03 7.65 8.39 4.05
Annualized Fee 0.29 0.28 0.28 0.33 0.41 0.42
MSCI ACWI ex U.S. - Net 1.29 9.39 2.16 6.36 6.54 2.79
Excess Return 1.93 -1.85 0.87 1.28 1.84 1.26
Annualized Alpha 1.93 -1.41 0.97 1.72 3.17 1.37
Active Manager Premium 2.00 2.00 2.00 2.00 2.00 2.00
Excess Risk Adjusted Returns -0.07 -3.41 -1.03 -0.28 1.17 -0.63
Risk and Regression
Description 1-Year 3-Year 5-Year 7-Year 10-Year Since Inc.Standard Deviation 16.06 11.44 11.72 11.31 14.12 17.70
Standard Deviaiton - Benchmark 15.87 11.40 12.55 11.90 14.88 18.28
Beta 1.00 0.96 0.89 0.91 0.91 0.94
R-Squared 0.97 0.92 0.91 0.91 0.93 0.94
Efficiency MeasuresDescription 1-Year 3-Year 5-Year 7-Year 10-Year Since Inc.
Sharpe Ratio 0.06 0.54 0.18 0.62 0.56 0.20
Treynor Ratio 0.91 6.39 2.42 7.71 8.64 3.76
Sortino Ratio 0.18 0.83 0.35 1.01 0.93 0.38
Tracking Error 2.68 3.21 3.74 3.52 4.02 4.40
Information Ratio 0.72 -0.58 0.23 0.36 0.46 0.29
Upside Market Capture 103.99 92.16 89.60 95.21 94.12 92.41
Downside Market Capture 95.20 101.78 84.96 85.60 83.77 86.89
Status Evaluation:
3yr Alpha 5yr Alpha AMP3yr Alpha vs.
AMP5yr Alpha vs.
AMP StatusCurrent Quarter -1.41 0.97 2.00 -3.41 -1.03
Prior Quarter -2.12 0.46 2.00 -4.12 -1.54
Ativo ACWi ex U.S. June 30, 2019
Enhanced
Review
-4.00%
-2.00%
0.00%
2.00%
4.00%
6.00%
Jun
-11
Sep
-11
De
c-1
1
Ma
r-1
2
Jun
-12
Sep
-12
De
c-1
2
Ma
r-1
3
Jun
-13
Sep
-13
De
c-1
3
Ma
r-1
4
Jun
-14
Sep
-14
De
c-1
4
Ma
r-1
5
Jun
-15
Sep
-15
De
c-1
5
Ma
r-1
6
Jun
-16
Sep
-16
De
c-1
6
Ma
r-1
7
Jun
-17
Sep
-17
De
c-1
7
Ma
r-1
8
Jun
-18
Sep
-18
De
c-1
8
Ma
r-1
9
Jun
-19
Rolling 3-year Excess Return vs Benchmark
Ativo - Excess Ativo - Alpha 0.75%
-2.00%
0.00%
2.00%
4.00%
6.00%
Jun
-13
Au
g-1
3
Oc
t-13
De
c-1
3
Feb
-14
Ap
r-14
Jun
-14
Au
g-1
4
Oc
t-14
De
c-1
4
Feb
-15
Ap
r-15
Jun
-15
Au
g-1
5
Oc
t-15
De
c-1
5
Feb
-16
Ap
r-16
Jun
-16
Au
g-1
6
Oc
t-16
De
c-1
6
Feb
-17
Ap
r-17
Jun
-17
Au
g-1
7
Oc
t-17
De
c-1
7
Feb
-18
Ap
r-18
Jun
-18
Au
g-1
8
Oc
t-18
De
c-1
8
Feb
-19
Ap
r-19
Jun
-19
Rolling 5-year Excess Return vs Benchmark
Ativo - Excess Ativo - Alpha 0.75%
9
Exhibit 9

Performance Analysis (Net of Fees)Description 1-Year 3-Year 5-Year 7-Year 10-Year Since Inc. Inception Date
SGA - Gross -0.85 8.13 3.58 9.59 10.17 6.49 8/31/2008
SGA - Net -1.19 7.77 3.24 9.17 9.69 6.02
Annualized Fee 0.33 0.36 0.34 0.42 0.48 0.47
MSCI EAFE - Net 1.08 9.11 2.25 7.31 6.90 3.01
Excess Return -2.27 -1.34 0.99 1.87 2.79 3.01
Annualized Alpha -2.11 -1.45 1.02 1.96 4.14 2.98
Active Manager Premium 2.00 2.00 2.00 2.00 2.00 2.00
Excess Risk Adjusted Returns -4.11 -3.45 -0.98 -0.04 2.14 0.98
Risk and Regression
Description 1-Year 3-Year 5-Year 7-Year 10-Year Since Inc.Standard Deviation 16.34 11.64 12.00 11.70 14.26 17.63
Standard Deviaiton - Benchmark 15.26 11.08 12.28 11.85 14.86 17.88
Beta 1.06 1.03 0.96 0.97 0.95 0.97
R-Squared 0.98 0.97 0.96 0.96 0.97 0.97
Efficiency MeasuresDescription 1-Year 3-Year 5-Year 7-Year 10-Year Since Inc.
Sharpe Ratio -0.21 0.55 0.20 0.73 0.65 0.31
Treynor Ratio -3.30 6.18 2.47 8.83 9.73 5.68
Sortino Ratio -0.19 0.88 0.37 1.24 1.10 0.55
Tracking Error 2.52 2.15 2.41 2.44 2.55 3.23
Information Ratio -0.90 -0.62 0.41 0.77 1.09 0.93
Upside Market Capture 95.27 96.22 95.81 101.03 99.85 99.56
Downside Market Capture 107.25 105.19 90.62 89.36 85.95 86.76
Status Evaluation:
3yr Alpha 5yr Alpha AMP3yr Alpha vs.
AMP5yr Alpha vs.
AMP StatusCurrent Quarter -1.45 1.02 2.00 -3.45 -0.98
Prior Quarter -0.84 1.79 2.00 -2.84 -0.21
Strategic Global Advisors / Non-U.S. EquityJune 30, 2019
Enhanced
Review
-1.00%
1.00%
3.00%
5.00%
7.00%
Jul-11
Oc
t-11
Jan
-12
Ap
r-12
Jul-12
Oc
t-12
Jan
-13
Ap
r-13
Jul-13
Oc
t-13
Jan
-14
Ap
r-14
Jul-14
Oc
t-14
Jan
-15
Ap
r-15
Jul-15
Oc
t-15
Jan
-16
Ap
r-16
Jul-16
Oc
t-16
Jan
-17
Ap
r-17
Jul-17
Oc
t-17
Jan
-18
Ap
r-18
Jul-18
Oc
t-18
Jan
-19
Ap
r-19
Rolling 3-year Excess Return vs Benchmark
SGA 3-Year Excess SGA 3-Year Alpha 2.00%
-2.00%
0.00%
2.00%
4.00%
6.00%
8.00%
Jul-13
Sep
-13
No
v-1
3
Jan
-14
Ma
r-1
4
Ma
y-1
4
Jul-14
Sep
-14
No
v-1
4
Jan
-15
Ma
r-1
5
Ma
y-1
5
Jul-15
Sep
-15
No
v-1
5
Jan
-16
Ma
r-1
6
Ma
y-1
6
Jul-16
Sep
-16
No
v-1
6
Jan
-17
Ma
r-1
7
Ma
y-1
7
Jul-17
Sep
-17
No
v-1
7
Jan
-18
Ma
r-1
8
Ma
y-1
8
Jul-18
Sep
-18
No
v-1
8
Jan
-19
Ma
r-1
9
Ma
y-1
9
Rolling 5-year Excess Return vs Benchmark
SGA 5-Year Excess SGA 5-Year Alpha 2.00%
10
Exhibit 9

Performance Analysis (Net of Fees)Description 1-Year 3-Year 5-Year 7-Year 10-Year Since Inc. Inception Date
BlackRock - Gross 0.80 10.88 4.09 9.76 8.82 7.37 10/31/2003
BlackRock - Net 0.63 10.47 3.54 9.24 8.40 7.02
Annualized Fee 0.17 0.41 0.55 0.52 0.42 0.35
MSCI EAFE - Net 1.08 9.11 2.25 7.31 6.90 6.07
Excess Return -0.45 1.36 1.30 1.94 1.50 0.95
Annualized Alpha -0.43 1.24 1.29 1.87 2.03 0.91
Active Manager Premium 1.50 1.50 1.50 1.50 1.50 1.50
Excess Risk Adjusted Returns -1.93 -0.26 -0.21 0.37 0.53 -0.59
Risk and RegressionDescription 1-Year 3-Year 5-Year 7-Year 10-Year Since Inc.
Standard Deviation 15.42 11.34 12.31 11.92 14.97 16.36
Standard Deviaiton - Benchmark 15.26 11.08 12.28 11.85 14.86 16.26
Beta 1.00 1.00 0.99 0.99 1.00 1.00
R-Squared 0.97 0.96 0.97 0.97 0.98 0.99
Efficiency MeasuresDescription 1-Year 3-Year 5-Year 7-Year 10-Year Since Inc.
Sharpe Ratio -0.11 0.80 0.22 0.72 0.53 0.35
Treynor Ratio -1.69 9.05 2.70 8.67 7.92 5.66
Sortino Ratio -0.05 1.33 0.41 1.25 0.91 0.58
Tracking Error 2.54 2.20 2.04 2.05 1.94 1.77
Information Ratio -0.18 0.62 0.63 0.95 0.77 0.53
Upside Market Capture 99.16 102.96 101.72 103.90 102.88 42.09
Downside Market Capture 102.51 95.00 94.67 92.67 95.91 45.64
Status Evaluation:
3yr Alpha 5yr Alpha AMP3yr Alpha vs.
AMP5yr Alpha vs.
AMP StatusCurrent Quarter 1.24 1.29 1.50 -0.26 -0.21
Prior Quarter 0.65 1.14 1.50 -0.85 -0.36
BlackRock Intl Alpha Tilts / Non-U.S. Structured ActiveJune 30, 2019
Enhanced
Review
-2.00%
0.00%
2.00%
4.00%
Sep
-06
Jan
-07
Ma
y-0
7
Sep
-07
Jan
-08
Ma
y-0
8
Sep
-08
Jan
-09
Ma
y-0
9
Sep
-09
Jan
-10
Ma
y-1
0
Sep
-10
Jan
-11
Ma
y-1
1
Sep
-11
Jan
-12
Ma
y-1
2
Sep
-12
Jan
-13
Ma
y-1
3
Sep
-13
Jan
-14
Ma
y-1
4
Sep
-14
Jan
-15
Ma
y-1
5
Sep
-15
Jan
-16
Ma
y-1
6
Sep
-16
Jan
-17
Ma
y-1
7
Sep
-17
Jan
-18
Ma
y-1
8
Sep
-18
Jan
-19
Ma
y-1
9
Rolling 3-year Excess Return vs Benchmark
Blackrock - Excess BlackRock - Alpha 1.50%
0.00%
2.00%
4.00%
Ma
y-1
3
Jul-13
Sep
-13
No
v-1
3
Jan
-14
Ma
r-1
4
Ma
y-1
4
Jul-14
Sep
-14
No
v-1
4
Jan
-15
Ma
r-1
5
Ma
y-1
5
Jul-15
Sep
-15
No
v-1
5
Jan
-16
Ma
r-1
6
Ma
y-1
6
Jul-16
Sep
-16
No
v-1
6
Jan
-17
Ma
r-1
7
Ma
y-1
7
Jul-17
Sep
-17
No
v-1
7
Jan
-18
Ma
r-1
8
Ma
y-1
8
Jul-18
Sep
-18
No
v-1
8
Jan
-19
Ma
r-1
9
Ma
y-1
9
Rolling 5-year Excess Return vs Benchmark
Blackrock - Excess BlackRock - Alpha 1.50%
11
Exhibit 9

Performance Analysis (Net of Fees)Description 1-Year 3-Year 5-Year 7-Year 10-Year Since Inc. Inception Date
GlobeFlex - Gross -4.80 9.56 3.26 8.69 --- 8.55 12/31/2011
GlobeFlex - Net -5.25 8.91 2.52 7.85 --- 7.75
Annualized Fee 0.45 0.65 0.74 0.84 --- 0.80
MSCI ACWI ex U.S. - Net 1.29 9.39 2.16 6.36 --- 6.08
Excess Return -6.54 -0.48 0.35 1.49 --- 1.67
Annualized Alpha -6.38 -1.12 0.38 1.38 --- 1.63
Active Manager Premium 2.00 2.00 2.00 2.00 --- 2.00
Excess Risk Adjusted Returns -8.38 -3.12 -1.62 -0.62 --- -0.37
Risk and RegressionDescription 1-Year 3-Year 5-Year 7-Year 10-Year Since Inc.
Standard Deviation 17.81 12.99 13.22 12.40 --- 13.06
Standard Deviaiton - Benchmark 15.87 11.40 12.55 11.90 --- 12.78
Beta 1.10 1.11 1.02 1.01 --- 0.99
R-Squared 0.96 0.94 0.94 0.94 --- 0.95
Efficiency MeasuresDescription 1-Year 3-Year 5-Year 7-Year 10-Year Since Inc.
Sharpe Ratio -0.42 0.58 0.12 0.58 --- 0.55
Treynor Ratio -6.89 6.81 1.61 7.12 --- 7.19
Sortino Ratio -0.48 0.95 0.29 1.01 --- 0.94
Tracking Error 4.00 3.38 3.26 2.99 --- 2.99
Information Ratio -1.63 -0.14 0.11 0.50 --- 0.56
Upside Market Capture 79.44 104.28 98.88 103.27 --- 102.57
Downside Market Capture 110.80 109.82 96.95 94.37 --- 93.07
Status Evaluation:
3yr Alpha 5yr Alpha AMP3yr Alpha vs.
AMP5yr Alpha vs.
AMP StatusCurrent Quarter -1.12 0.38 2.00 -3.12 -1.62
Prior Quarter -1.76 0.88 2.00 -3.76 -1.12
GlobeFlex Capital / Non-U.S. EquityJune 30, 2019
Enhanced
Review
-4.00%
-2.00%
0.00%
2.00%
4.00%
6.00%
Rolling 3-year Excess Return vs Benchmark
Globeflex - Excess Globeflex - Alpha 2.00%
0.00%
2.00%
4.00%
De
c-1
6
Jan
-17
Feb
-17
Ma
r-1
7
Ap
r-17
Ma
y-1
7
Jun
-17
Jul-17
Au
g-1
7
Sep
-17
Oc
t-17
No
v-1
7
De
c-1
7
Jan
-18
Feb
-18
Ma
r-1
8
Ap
r-18
Ma
y-1
8
Jun
-18
Jul-18
Au
g-1
8
Sep
-18
Oc
t-18
No
v-1
8
De
c-1
8
Jan
-19
Feb
-19
Ma
r-1
9
Ap
r-19
Ma
y-1
9
Jun
-19
Rolling 5-year Excess Return vs Benchmark
Globeflex - Excess Globeflex - Alpha 2.00%
12
Exhibit 9

Performance Analysis (Net of Fees)Description 1-Year 3-Year 5-Year 7-Year 10-Year Since Inc. Inception Date
Progress - Gross 2.48 10.71 3.33 8.22 8.03 3.77 5/31/2008
Progress - Net 1.97 10.17 2.84 7.71 7.54 3.26
Annualized Fee 0.50 0.54 0.50 0.51 0.49 0.51
MSCI EAFE - Net 1.08 9.11 2.25 7.31 6.90 1.95
Excess Return 0.89 1.06 0.59 0.41 0.64 1.31
Annualized Alpha 0.85 1.21 0.61 0.58 1.12 1.33
Active Manager Premium 0.00 0.00 0.00 0.00 0.00 0.00
Excess Risk Adjusted Returns 0.85 1.21 0.61 0.58 1.12 1.33
Risk and RegressionDescription 1-Year 3-Year 5-Year 7-Year 10-Year Since Inc.
Standard Deviation 15.07 10.88 12.28 11.66 14.69 18.18
Standard Deviaiton - Benchmark 15.26 11.08 12.28 11.85 14.86 17.90
Beta 0.98 0.97 0.99 0.97 0.97 1.00
R-Squared 0.98 0.97 0.97 0.97 0.96 0.97
Efficiency MeasuresDescription 1-Year 3-Year 5-Year 7-Year 10-Year Since Inc.
Sharpe Ratio -0.02 0.81 0.16 0.61 0.48 0.15
Treynor Ratio -0.35 9.07 2.00 7.30 7.26 2.72
Sortino Ratio 0.07 1.278 0.323 1.027 0.832 0.339
Tracking Error 2.31 1.84 2.08 2.12 2.83 3.05
Information Ratio 0.39 0.58 0.28 0.19 0.23 0.43
Upside Market Capture 94.87 98.98 98.20 97.29 96.98 100.42
Downside Market Capture 92.76 91.16 95.24 94.07 93.46 95.37
Status Evaluation:
3yr Alpha 5yr Alpha AMP3yr Alpha vs.
AMP5yr Alpha vs.
AMP StatusCurrent Quarter 1.21 0.61 0.00 1.21 0.61
Prior Quarter 1.06 0.55 0.00 1.06 0.55
Progress Investments / Non-U.S. EquityJune 30, 2019
Good Standing
-2.00%
-1.00%
0.00%
1.00%
2.00%
3.00%
4.00%
5.00%
Ma
y-1
1
Au
g-1
1
No
v-1
1
Feb
-12
Ma
y-1
2
Au
g-1
2
No
v-1
2
Feb
-13
Ma
y-1
3
Au
g-1
3
No
v-1
3
Feb
-14
Ma
y-1
4
Au
g-1
4
No
v-1
4
Feb
-15
Ma
y-1
5
Au
g-1
5
No
v-1
5
Feb
-16
Ma
y-1
6
Au
g-1
6
No
v-1
6
Feb
-17
Ma
y-1
7
Au
g-1
7
No
v-1
7
Feb
-18
Ma
y-1
8
Au
g-1
8
No
v-1
8
Feb
-19
Ma
y-1
9
Rolling 3-year Excess Return vs Benchmark
Progress - Excess Progress - Alpha
-0.50%
0.00%
0.50%
1.00%
1.50%
2.00%
2.50%
3.00%
Ma
y-1
3
Jul-13
Sep
-13
No
v-1
3
Jan
-14
Ma
r-1
4
Ma
y-1
4
Jul-14
Sep
-14
No
v-1
4
Jan
-15
Ma
r-1
5
Ma
y-1
5
Jul-15
Sep
-15
No
v-1
5
Jan
-16
Ma
r-1
6
Ma
y-1
6
Jul-16
Sep
-16
No
v-1
6
Jan
-17
Ma
r-1
7
Ma
y-1
7
Jul-17
Sep
-17
No
v-1
7
Jan
-18
Ma
r-1
8
Ma
y-1
8
Jul-18
Sep
-18
No
v-1
8
Jan
-19
Ma
r-1
9
Ma
y-1
9
Rolling 5-year Excess Return vs Benchmark
Progress - Excess Progress - Alpha
13
Exhibit 9

Performance Analysis (Net of Fees)Description 1-Year 3-Year 5-Year 7-Year 10-Year Since Inc. Inception Date
Mondrian - Gross 8.29 10.77 5.64 9.16 --- 9.07 11/30/2011
Mondrian - Net 8.03 10.51 5.41 8.93 --- 8.84
Annualized Fee 0.25 0.25 0.23 0.23 --- 0.23
MSCI ACWI 5.74 11.62 6.16 9.87 --- 9.84
Excess Return 2.29 -1.11 -0.75 -0.94 --- -1.00
Annualized Alpha 2.23 -0.92 -0.45 -0.41 --- -0.43
Active Manager Premium 2.00 2.00 2.00 2.00 --- 2.00
Excess Risk Adjusted Returns 0.23 -2.92 -2.45 -2.41 --- -2.43
Risk and RegressionDescription 1-Year 3-Year 5-Year 7-Year 10-Year Since Inc.
Standard Deviation 17.67 11.57 11.58 10.81 --- 11.26
Standard Deviaiton - Benchmark 17.30 11.32 11.79 10.97 --- 11.50
Beta 1.00 0.99 0.95 0.95 --- 0.95
R-Squared 0.95 0.95 0.94 0.93 --- 0.93
Efficiency MeasuresDescription 1-Year 3-Year 5-Year 7-Year 10-Year Since Inc.
Sharpe Ratio 0.32 0.79 0.39 0.77 --- 0.73
Treynor Ratio 5.73 9.18 4.78 8.72 --- 8.72
Sortino Ratio 0.57 1.21 0.67 1.25 --- 1.11
Tracking Error 3.78 2.70 2.96 2.93 --- 3.01
Information Ratio 0.61 -0.41 -0.25 -0.32 --- -0.33
Upside Market Capture 106.38 94.78 93.44 93.94 --- 93.89
Downside Market Capture 98.61 101.04 97.40 98.23 --- 95.21
Status Evaluation:
3yr Alpha 5yr Alpha AMP3yr Alpha vs.
AMP5yr Alpha vs.
AMP StatusCurrent Quarter -0.92 -0.45 2.00 -2.92 -2.45
Prior Quarter 0.30 -0.02 2.00 -1.70 -2.02
Mondrian / Global EquityJune 30, 2019
Enhanced
Review
-4.00%
-2.00%
0.00%
2.00%
4.00%
Rolling 3-year Excess Return vs Benchmark
Mondrian - Excess Mondrian - Alpha 2.00%
-2.00%
0.00%
2.00%
4.00%
Oc
t-16
No
v-1
6
De
c-1
6
Jan
-17
Feb
-17
Ma
r-1
7
Ap
r-17
Ma
y-1
7
Jun
-17
Jul-17
Au
g-1
7
Sep
-17
Oc
t-17
No
v-1
7
De
c-1
7
Jan
-18
Feb
-18
Ma
r-1
8
Ap
r-18
Ma
y-1
8
Jun
-18
Jul-18
Au
g-1
8
Sep
-18
Oc
t-18
No
v-1
8
De
c-1
8
Jan
-19
Feb
-19
Ma
r-1
9
Ap
r-19
Ma
y-1
9
Jun
-19
Rolling 5-year Excess Return vs Benchmark
Mondrian - Excess Mondrian - Alpha 2.00%
14
Exhibit 9

Performance Analysis (Net of Fees)Description 1-Year 3-Year 5-Year 7-Year 10-Year Since Inc. Inception Date
Wellington - Gross 7.36 13.59 8.28 12.44 12.52 8.26 4/30/2002
Wellington - Net 6.91 13.04 7.63 11.80 11.96 7.76
Annualized Fee 0.45 0.56 0.64 0.64 0.56 0.50
Wellington BM 5.74 11.62 6.16 9.87 10.15 6.79
Excess Return 1.17 1.41 1.47 1.93 1.81 0.97
Annualized Alpha 0.96 0.74 1.15 1.32 1.86 0.71
Active Manager Premium 2.00 2.00 2.00 2.00 2.00 2.00
Excess Risk Adjusted Returns -1.04 -1.26 -0.85 -0.68 -0.14 -1.29
Risk and RegressionDescription 1-Year 3-Year 5-Year 7-Year 10-Year Since Inc.
Standard Deviation 18.84 12.10 12.61 11.75 14.23 16.11
Standard Deviaiton - Benchmark 17.30 11.32 11.79 10.97 13.49 15.05
Beta 1.09 1.06 1.06 1.06 1.04 1.06
R-Squared 0.99 0.98 0.98 0.97 0.98 0.98
Efficiency MeasuresDescription 1-Year 3-Year 5-Year 7-Year 10-Year Since Inc.
Sharpe Ratio 0.24 0.96 0.54 0.95 0.81 0.40
Treynor Ratio 4.23 10.99 6.39 10.56 10.98 6.04
Sortino Ratio 0.46 1.44 0.87 1.54 1.35 0.66
Tracking Error 2.08 1.65 1.99 2.09 2.10 2.54
Information Ratio 0.56 0.85 0.74 0.92 0.86 0.38
Upside Market Capture 111.58 107.71 110.82 109.63 108.92 107.24
Downside Market Capture 108.11 102.87 103.78 100.23 101.58 103.31
Status Evaluation:
3yr Alpha 5yr Alpha AMP3yr Alpha vs.
AMP5yr Alpha vs.
AMP StatusCurrent Quarter 0.74 1.15 2.00 -1.26 -0.85
Prior Quarter 0.51 1.03 2.00 -1.49 -0.97
Wellington Global Research Equity / Global EquityJune 30, 2019
Enhanced
Review
-4.00%
-2.00%
0.00%
2.00%
4.00%
6.00%
Ma
r-0
5
Jul-05
No
v-0
5
Ma
r-0
6
Jul-06
No
v-0
6
Ma
r-0
7
Jul-07
No
v-0
7
Ma
r-0
8
Jul-08
No
v-0
8
Ma
r-0
9
Jul-09
No
v-0
9
Ma
r-1
0
Jul-10
No
v-1
0
Ma
r-1
1
Jul-11
No
v-1
1
Ma
r-1
2
Jul-12
No
v-1
2
Ma
r-1
3
Jul-13
No
v-1
3
Ma
r-1
4
Jul-14
No
v-1
4
Ma
r-1
5
Jul-15
No
v-1
5
Ma
r-1
6
Jul-16
No
v-1
6
Ma
r-1
7
Jul-17
No
v-1
7
Ma
r-1
8
Jul-18
No
v-1
8
Ma
r-1
9
Rolling 3-year Excess Return vs Benchmark
Wellington - Excess Wellington - Alpha 2.00%
-2.00%
0.00%
2.00%
4.00%
Ma
r-0
7
Jul-07
No
v-0
7
Ma
r-0
8
Jul-08
No
v-0
8
Ma
r-0
9
Jul-09
No
v-0
9
Ma
r-1
0
Jul-10
No
v-1
0
Ma
r-1
1
Jul-11
No
v-1
1
Ma
r-1
2
Jul-12
No
v-1
2
Ma
r-1
3
Jul-13
No
v-1
3
Ma
r-1
4
Jul-14
No
v-1
4
Ma
r-1
5
Jul-15
No
v-1
5
Ma
r-1
6
Jul-16
No
v-1
6
Ma
r-1
7
Jul-17
No
v-1
7
Ma
r-1
8
Jul-18
No
v-1
8
Ma
r-1
9
Rolling 5-year Excess Return vs Benchmark
Wellington - Excess Wellington - Alpha 2.00%
15
Exhibit 9
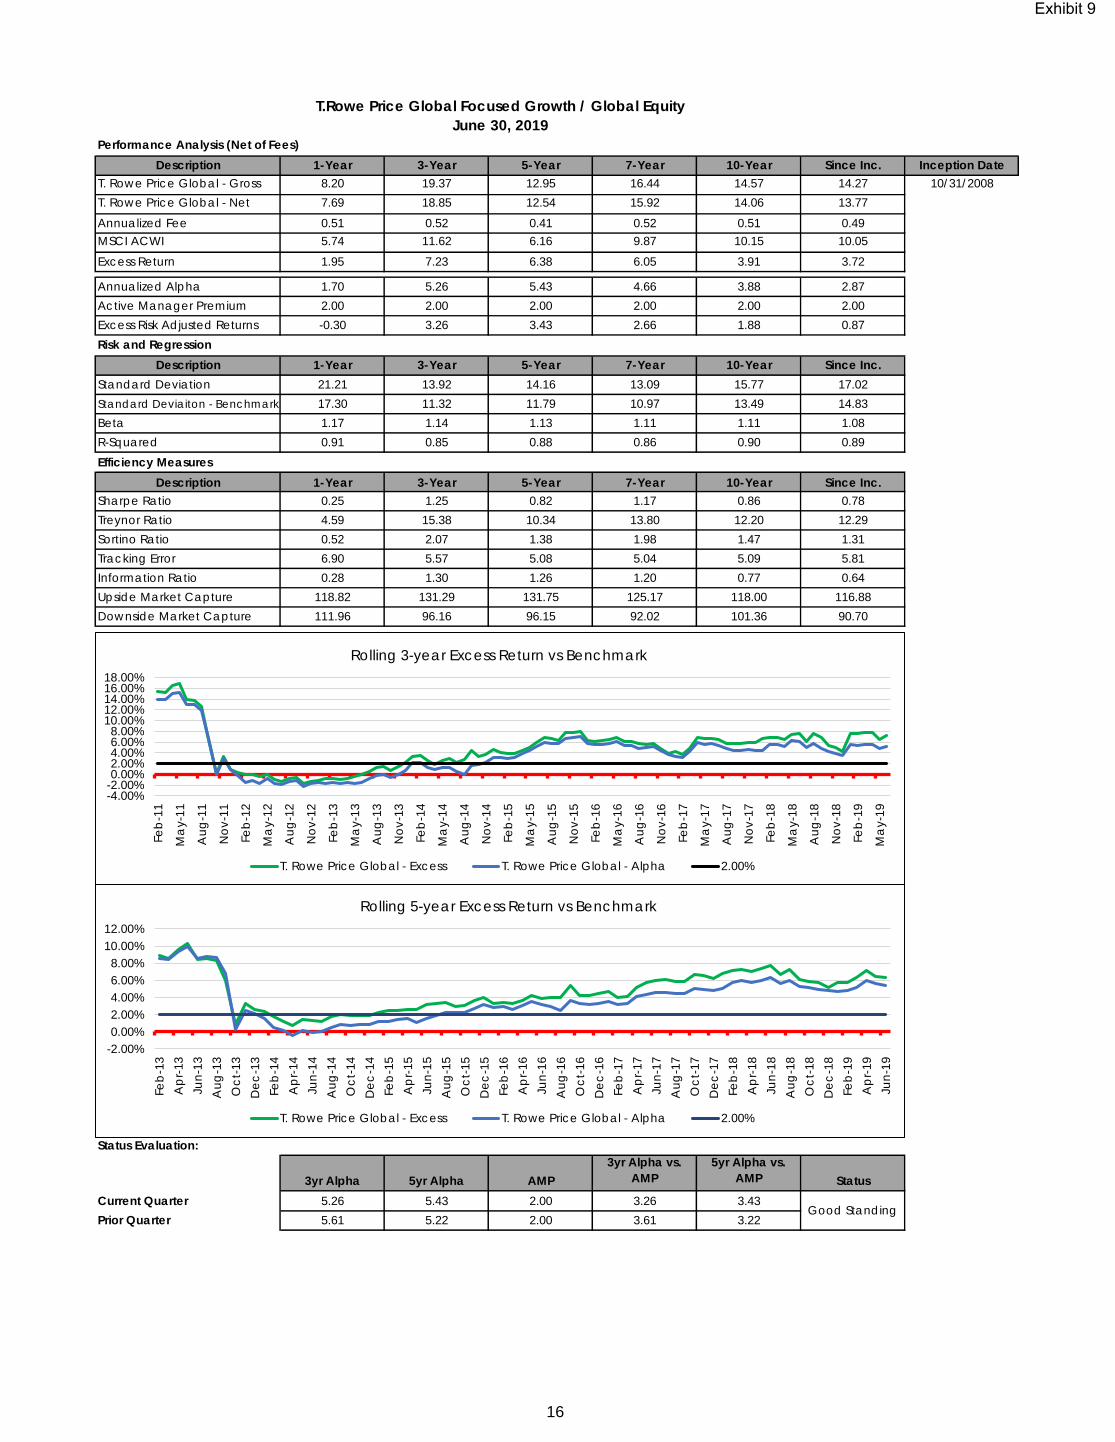
Performance Analysis (Net of Fees)Description 1-Year 3-Year 5-Year 7-Year 10-Year Since Inc. Inception Date
T. Rowe Price Global - Gross 8.20 19.37 12.95 16.44 14.57 14.27 10/31/2008
T. Rowe Price Global - Net 7.69 18.85 12.54 15.92 14.06 13.77
Annualized Fee 0.51 0.52 0.41 0.52 0.51 0.49
MSCI ACWI 5.74 11.62 6.16 9.87 10.15 10.05
Excess Return 1.95 7.23 6.38 6.05 3.91 3.72
Annualized Alpha 1.70 5.26 5.43 4.66 3.88 2.87
Active Manager Premium 2.00 2.00 2.00 2.00 2.00 2.00
Excess Risk Adjusted Returns -0.30 3.26 3.43 2.66 1.88 0.87
Risk and RegressionDescription 1-Year 3-Year 5-Year 7-Year 10-Year Since Inc.
Standard Deviation 21.21 13.92 14.16 13.09 15.77 17.02
Standard Deviaiton - Benchmark 17.30 11.32 11.79 10.97 13.49 14.83
Beta 1.17 1.14 1.13 1.11 1.11 1.08
R-Squared 0.91 0.85 0.88 0.86 0.90 0.89
Efficiency MeasuresDescription 1-Year 3-Year 5-Year 7-Year 10-Year Since Inc.
Sharpe Ratio 0.25 1.25 0.82 1.17 0.86 0.78
Treynor Ratio 4.59 15.38 10.34 13.80 12.20 12.29
Sortino Ratio 0.52 2.07 1.38 1.98 1.47 1.31
Tracking Error 6.90 5.57 5.08 5.04 5.09 5.81
Information Ratio 0.28 1.30 1.26 1.20 0.77 0.64
Upside Market Capture 118.82 131.29 131.75 125.17 118.00 116.88
Downside Market Capture 111.96 96.16 96.15 92.02 101.36 90.70
Status Evaluation:
3yr Alpha 5yr Alpha AMP3yr Alpha vs.
AMP5yr Alpha vs.
AMP StatusCurrent Quarter 5.26 5.43 2.00 3.26 3.43
Prior Quarter 5.61 5.22 2.00 3.61 3.22
T.Rowe Price Global Focused Growth / Global EquityJune 30, 2019
Good Standing
-4.00%-2.00%0.00%2.00%4.00%6.00%8.00%
10.00%12.00%14.00%16.00%18.00%
Feb
-11
Ma
y-1
1
Au
g-1
1
No
v-1
1
Feb
-12
Ma
y-1
2
Au
g-1
2
No
v-1
2
Feb
-13
Ma
y-1
3
Au
g-1
3
No
v-1
3
Feb
-14
Ma
y-1
4
Au
g-1
4
No
v-1
4
Feb
-15
Ma
y-1
5
Au
g-1
5
No
v-1
5
Feb
-16
Ma
y-1
6
Au
g-1
6
No
v-1
6
Feb
-17
Ma
y-1
7
Au
g-1
7
No
v-1
7
Feb
-18
Ma
y-1
8
Au
g-1
8
No
v-1
8
Feb
-19
Ma
y-1
9
Rolling 3-year Excess Return vs Benchmark
T. Rowe Price Global - Excess T. Rowe Price Global - Alpha 2.00%
-2.00%
0.00%
2.00%
4.00%
6.00%
8.00%
10.00%
12.00%
Feb
-13
Ap
r-13
Jun
-13
Au
g-1
3
Oc
t-13
De
c-1
3
Feb
-14
Ap
r-14
Jun
-14
Au
g-1
4
Oc
t-14
De
c-1
4
Feb
-15
Ap
r-15
Jun
-15
Au
g-1
5
Oc
t-15
De
c-1
5
Feb
-16
Ap
r-16
Jun
-16
Au
g-1
6
Oc
t-16
De
c-1
6
Feb
-17
Ap
r-17
Jun
-17
Au
g-1
7
Oc
t-17
De
c-1
7
Feb
-18
Ap
r-18
Jun
-18
Au
g-1
8
Oc
t-18
De
c-1
8
Feb
-19
Ap
r-19
Jun
-19
Rolling 5-year Excess Return vs Benchmark
T. Rowe Price Global - Excess T. Rowe Price Global - Alpha 2.00%
16
Exhibit 9

Performance Analysis (Net of Fees)Description 1-Year 3-Year 5-Year 7-Year 10-Year Since Inc. Inception Date
Pugh - Gross 8.01 2.50 3.11 2.91 4.44 4.98 3/31/2006
Pugh - Net 7.85 2.34 2.95 2.75 4.27 4.80
Annualized Fee 0.16 0.16 0.16 0.16 0.17 0.18
Bloomberg Barclays Aggregate 7.87 2.31 2.95 2.62 3.90 4.38
Excess Return -0.02 0.03 0.00 0.13 0.37 0.41
Annualized Alpha 0.02 0.02 -0.03 0.08 0.35 0.37
Active Manager Premium 0.40 0.40 0.40 0.40 0.40 0.40
Excess Risk Adjusted Returns -0.38 -0.38 -0.43 -0.32 -0.05 -0.03
Risk and RegressionDescription 1-Year 3-Year 5-Year 7-Year 10-Year Since Inc.
Standard Deviation 3.31 3.08 3.01 2.99 3.02 3.26
Standard Deviaiton - Benchmark 3.28 3.03 2.94 2.90 2.89 3.17
Beta 0.99 1.01 1.02 1.02 1.03 1.01
R-Squared 0.97 0.98 0.99 0.99 0.98 0.96
Efficiency MeasuresDescription 1-Year 3-Year 5-Year 7-Year 10-Year Since Inc.
Sharpe Ratio 1.67 0.31 0.69 0.70 1.25 1.11
Treynor Ratio 5.58 0.95 2.05 2.05 3.66 3.58
Sortino Ratio 4.00 0.48 1.16 1.13 2.23 2.00
Tracking Error 0.58 0.40 0.35 0.37 0.44 0.61
Information Ratio -0.04 0.07 0.01 0.35 0.85 0.68
Upside Market Capture 99.74 102.18 102.64 104.66 106.43 106.43
Downside Market Capture 99.80 102.87 105.21 104.19 101.07 97.61
Status Evaluation:
3yr Alpha 5yr Alpha AMP3yr Alpha vs.
AMP5yr Alpha vs.
AMP StatusCurrent Quarter 0.02 -0.03 0.40 -0.38 -0.43
Prior Quarter 0.03 0.00 0.40 -0.37 -0.40
Pugh Capital Management / Core Fixed IncomeJune 30, 2019
Enhanced
Review
-0.50%
0.00%
0.50%
1.00%
1.50%
2.00%
Feb
-09
Ma
y-0
9
Au
g-0
9
No
v-0
9
Feb
-10
Ma
y-1
0
Au
g-1
0
No
v-1
0
Feb
-11
Ma
y-1
1
Au
g-1
1
No
v-1
1
Feb
-12
Ma
y-1
2
Au
g-1
2
No
v-1
2
Feb
-13
Ma
y-1
3
Au
g-1
3
No
v-1
3
Feb
-14
Ma
y-1
4
Au
g-1
4
No
v-1
4
Feb
-15
Ma
y-1
5
Au
g-1
5
No
v-1
5
Feb
-16
Ma
y-1
6
Au
g-1
6
No
v-1
6
Feb
-17
Ma
y-1
7
Au
g-1
7
No
v-1
7
Feb
-18
Ma
y-1
8
Au
g-1
8
No
v-1
8
Feb
-19
Ma
y-1
9
Rolling 3-year Excess Return vs Benchmark
Pugh - Excess Pugh - Alpha 0.40%
-0.20%0.00%0.20%0.40%0.60%0.80%1.00%1.20%1.40%
Feb
-11
Ma
y-1
1
Au
g-1
1
No
v-1
1
Feb
-12
Ma
y-1
2
Au
g-1
2
No
v-1
2
Feb
-13
Ma
y-1
3
Au
g-1
3
No
v-1
3
Feb
-14
Ma
y-1
4
Au
g-1
4
No
v-1
4
Feb
-15
Ma
y-1
5
Au
g-1
5
No
v-1
5
Feb
-16
Ma
y-1
6
Au
g-1
6
No
v-1
6
Feb
-17
Ma
y-1
7
Au
g-1
7
No
v-1
7
Feb
-18
Ma
y-1
8
Au
g-1
8
No
v-1
8
Feb
-19
Ma
y-1
9
Rolling 5-year Excess Return vs Benchmark
Pugh - Excess Pugh - Alpha 0.40%
17
Exhibit 9

Performance Analysis (Net of Fees)Description 1-Year 3-Year 5-Year 7-Year 10-Year Since Inc. Inception Date
Smith Graham - Gross 8.35 2.53 3.09 2.94 4.40 4.64 3/31/2006
Smith Graham - Net 8.17 2.38 2.93 2.78 4.23 4.46
Annualized Fee 0.18 0.15 0.16 0.16 0.18 0.18
Bloomberg Barclays Aggregate 7.87 2.31 2.95 2.62 3.90 4.38
Excess Return 0.30 0.06 -0.02 0.16 0.33 0.07
Annualized Alpha 0.80 0.13 0.06 0.19 0.64 0.12
Active Manager Premium 0.40 0.40 0.40 0.40 0.40 0.40
Excess Risk Adjusted Returns 0.40 -0.27 -0.34 -0.21 0.24 -0.28
Risk and RegressionDescription 1-Year 3-Year 5-Year 7-Year 10-Year Since Inc.
Standard Deviation 3.06 2.87 2.89 2.90 2.89 3.27
Standard Deviaiton - Benchmark 3.28 3.03 2.94 2.90 2.89 3.17
Beta 0.90 0.92 0.96 0.98 0.96 0.99
R-Squared 0.93 0.96 0.96 0.96 0.93 0.91
Efficiency MeasuresDescription 1-Year 3-Year 5-Year 7-Year 10-Year Since Inc.
Sharpe Ratio 1.91 0.35 0.71 0.74 1.29 1.00
Treynor Ratio 6.50 1.07 2.14 2.18 3.89 3.32
Sortino Ratio 4.27 0.53 1.21 1.22 2.36 1.59
Tracking Error 0.87 0.65 0.61 0.57 0.78 0.97
Information Ratio 0.34 0.09 -0.03 0.27 0.42 0.07
Upside Market Capture 101.23 98.24 100.26 102.40 103.69 101.69
Downside Market Capture 88.72 94.88 101.15 98.87 95.83 98.58
Status Evaluation:
3yr Alpha 5yr Alpha AMP3yr Alpha vs.
AMP5yr Alpha vs.
AMP StatusCurrent Quarter 0.13 0.06 0.40 -0.27 -0.34
Prior Quarter -0.02 0.06 0.40 -0.42 -0.34
Smith Graham / Core Fixed IncomeJune 30, 2019
Enhanced
Review
-1.50%-1.00%-0.50%0.00%0.50%1.00%1.50%2.00%2.50%3.00%
Feb
-09
Ma
y-0
9
Au
g-0
9
No
v-0
9
Feb
-10
Ma
y-1
0
Au
g-1
0
No
v-1
0
Feb
-11
Ma
y-1
1
Au
g-1
1
No
v-1
1
Feb
-12
Ma
y-1
2
Au
g-1
2
No
v-1
2
Feb
-13
Ma
y-1
3
Au
g-1
3
No
v-1
3
Feb
-14
Ma
y-1
4
Au
g-1
4
No
v-1
4
Feb
-15
Ma
y-1
5
Au
g-1
5
No
v-1
5
Feb
-16
Ma
y-1
6
Au
g-1
6
No
v-1
6
Feb
-17
Ma
y-1
7
Au
g-1
7
No
v-1
7
Feb
-18
Ma
y-1
8
Au
g-1
8
No
v-1
8
Feb
-19
Ma
y-1
9
Rolling 3-year Excess Return vs Benchmark
Smith Graham - Excess Smith Graham - Alpha 0.40%
-0.60%-0.40%-0.20%0.00%0.20%0.40%0.60%0.80%1.00%1.20%1.40%
Feb
-11
Ma
y-1
1
Au
g-1
1
No
v-1
1
Feb
-12
Ma
y-1
2
Au
g-1
2
No
v-1
2
Feb
-13
Ma
y-1
3
Au
g-1
3
No
v-1
3
Feb
-14
Ma
y-1
4
Au
g-1
4
No
v-1
4
Feb
-15
Ma
y-1
5
Au
g-1
5
No
v-1
5
Feb
-16
Ma
y-1
6
Au
g-1
6
No
v-1
6
Feb
-17
Ma
y-1
7
Au
g-1
7
No
v-1
7
Feb
-18
Ma
y-1
8
Au
g-1
8
No
v-1
8
Feb
-19
Ma
y-1
9
Rolling 5-year Excess Return vs Benchmark
Smith Graham - Excess Smith Graham - Alpha 0.40%
18
Exhibit 9
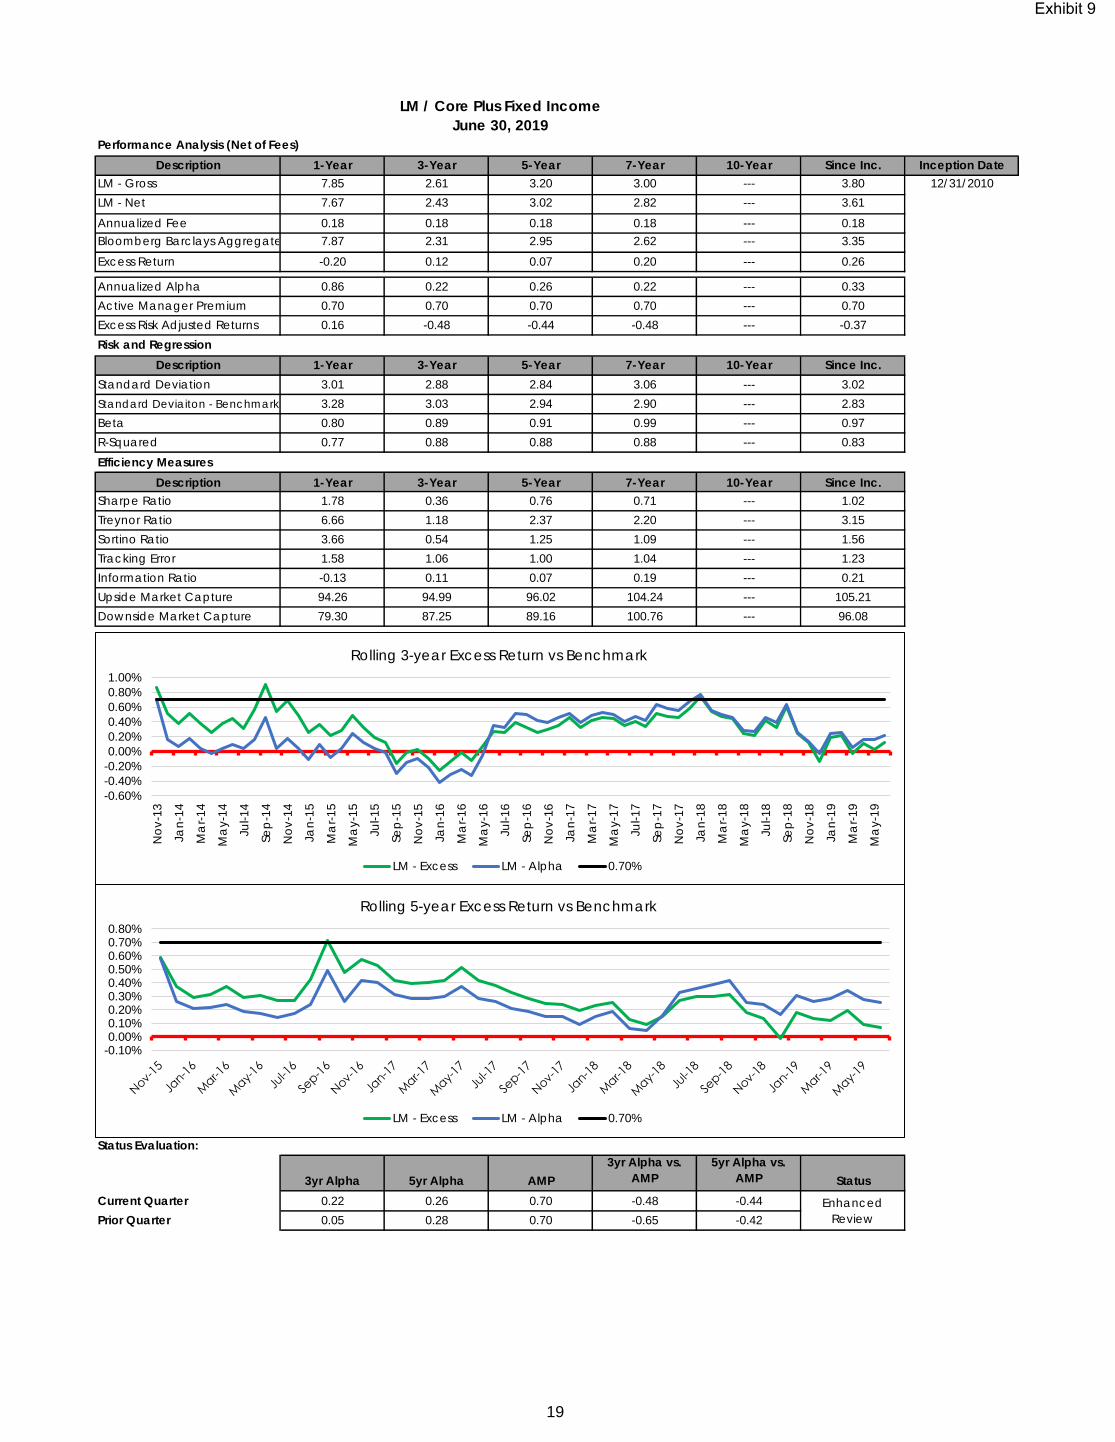
Performance Analysis (Net of Fees)Description 1-Year 3-Year 5-Year 7-Year 10-Year Since Inc. Inception Date
LM - Gross 7.85 2.61 3.20 3.00 --- 3.80 12/31/2010
LM - Net 7.67 2.43 3.02 2.82 --- 3.61
Annualized Fee 0.18 0.18 0.18 0.18 --- 0.18
Bloomberg Barclays Aggregate 7.87 2.31 2.95 2.62 --- 3.35
Excess Return -0.20 0.12 0.07 0.20 --- 0.26
Annualized Alpha 0.86 0.22 0.26 0.22 --- 0.33
Active Manager Premium 0.70 0.70 0.70 0.70 --- 0.70
Excess Risk Adjusted Returns 0.16 -0.48 -0.44 -0.48 --- -0.37
Risk and RegressionDescription 1-Year 3-Year 5-Year 7-Year 10-Year Since Inc.
Standard Deviation 3.01 2.88 2.84 3.06 --- 3.02
Standard Deviaiton - Benchmark 3.28 3.03 2.94 2.90 --- 2.83
Beta 0.80 0.89 0.91 0.99 --- 0.97
R-Squared 0.77 0.88 0.88 0.88 --- 0.83
Efficiency MeasuresDescription 1-Year 3-Year 5-Year 7-Year 10-Year Since Inc.
Sharpe Ratio 1.78 0.36 0.76 0.71 --- 1.02
Treynor Ratio 6.66 1.18 2.37 2.20 --- 3.15
Sortino Ratio 3.66 0.54 1.25 1.09 --- 1.56
Tracking Error 1.58 1.06 1.00 1.04 --- 1.23
Information Ratio -0.13 0.11 0.07 0.19 --- 0.21
Upside Market Capture 94.26 94.99 96.02 104.24 --- 105.21
Downside Market Capture 79.30 87.25 89.16 100.76 --- 96.08
Status Evaluation:
3yr Alpha 5yr Alpha AMP3yr Alpha vs.
AMP5yr Alpha vs.
AMP StatusCurrent Quarter 0.22 0.26 0.70 -0.48 -0.44
Prior Quarter 0.05 0.28 0.70 -0.65 -0.42
LM / Core Plus Fixed IncomeJune 30, 2019
Enhanced
Review
-0.60%-0.40%-0.20%0.00%0.20%0.40%0.60%0.80%1.00%
No
v-1
3
Jan
-14
Ma
r-1
4
Ma
y-1
4
Jul-14
Sep
-14
No
v-1
4
Jan
-15
Ma
r-1
5
Ma
y-1
5
Jul-15
Sep
-15
No
v-1
5
Jan
-16
Ma
r-1
6
Ma
y-1
6
Jul-16
Sep
-16
No
v-1
6
Jan
-17
Ma
r-1
7
Ma
y-1
7
Jul-17
Sep
-17
No
v-1
7
Jan
-18
Ma
r-1
8
Ma
y-1
8
Jul-18
Sep
-18
No
v-1
8
Jan
-19
Ma
r-1
9
Ma
y-1
9
Rolling 3-year Excess Return vs Benchmark
LM - Excess LM - Alpha 0.70%
-0.10%0.00%0.10%0.20%0.30%0.40%0.50%0.60%0.70%0.80%
Rolling 5-year Excess Return vs Benchmark
LM - Excess LM - Alpha 0.70%
19
Exhibit 9

Performance Analysis (Net of Fees)Description 1-Year 3-Year 5-Year 7-Year 10-Year Since Inc. Inception Date
PIMCO - Gross 7.71 3.30 3.27 3.29 5.04 9.26 8/31/1981
PIMCO - Net 7.46 3.06 3.04 3.05 4.80 9.06
Annualized Fee 0.25 0.24 0.23 0.24 0.24 0.20
Bloomberg Barclays Aggregate 7.87 2.31 2.95 2.62 3.90 7.84
Excess Return -0.41 0.75 0.09 0.43 0.91 1.22
Annualized Alpha -0.22 0.77 0.22 0.41 1.55 1.19
Active Manager Premium 0.70 0.70 0.70 0.70 0.70 0.70
Excess Risk Adjusted Returns -0.92 0.07 -0.48 -0.29 0.85 0.49
Risk and RegressionDescription 1-Year 3-Year 5-Year 7-Year 10-Year Since Inc.
Standard Deviation 3.21 3.01 2.99 3.24 3.35 4.98
Standard Deviaiton - Benchmark 3.28 3.03 2.94 2.90 2.89 4.72
Beta 0.97 0.96 0.93 1.01 0.94 0.99
R-Squared 0.98 0.93 0.84 0.82 0.66 0.87
Efficiency MeasuresDescription 1-Year 3-Year 5-Year 7-Year 10-Year Since Inc.
Sharpe Ratio 1.60 0.56 0.72 0.74 1.29 0.95
Treynor Ratio 5.31 1.76 2.32 2.38 4.58 4.81
Sortino Ratio 3.65 0.84 1.21 1.17 2.27 1.70
Tracking Error 0.46 0.82 1.20 1.39 1.96 1.79
Information Ratio -0.90 0.91 0.07 0.31 0.46 0.68
Upside Market Capture 96.05 102.38 95.18 108.56 110.95 109.35
Downside Market Capture 102.72 78.84 86.87 100.76 90.51 93.11
Status Evaluation:
3yr Alpha 5yr Alpha AMP3yr Alpha vs.
AMP5yr Alpha vs.
AMP StatusCurrent Quarter 0.77 0.22 0.70 0.07 -0.48
Prior Quarter 0.79 0.27 0.70 0.09 -0.43
PIMCO Total Return / Core Plus Fixed IncomeJune 30, 2019
Enhanced
Review
-2.00%-1.00%0.00%1.00%2.00%3.00%4.00%5.00%6.00%
Jul-84
Ma
y-8
5
Ma
r-8
6
Jan
-87
No
v-8
7
Sep
-88
Jul-89
Ma
y-9
0
Ma
r-9
1
Jan
-92
No
v-9
2
Sep
-93
Jul-94
Ma
y-9
5
Ma
r-9
6
Jan
-97
No
v-9
7
Sep
-98
Jul-99
Ma
y-0
0
Ma
r-0
1
Jan
-02
No
v-0
2
Sep
-03
Jul-04
Ma
y-0
5
Ma
r-0
6
Jan
-07
No
v-0
7
Sep
-08
Jul-09
Ma
y-1
0
Ma
r-1
1
Jan
-12
No
v-1
2
Sep
-13
Jul-14
Ma
y-1
5
Ma
r-1
6
Jan
-17
No
v-1
7
Sep
-18
Rolling 3-year Excess Return vs Benchmark
PIMCO - Excess PIMCO - Alpha 0.70%
-1.00%-0.50%0.00%0.50%1.00%1.50%2.00%2.50%3.00%3.50%4.00%
Jul-86
Ma
y-8
7
Ma
r-8
8
Jan
-89
No
v-8
9
Sep
-90
Jul-91
Ma
y-9
2
Ma
r-9
3
Jan
-94
No
v-9
4
Sep
-95
Jul-96
Ma
y-9
7
Ma
r-9
8
Jan
-99
No
v-9
9
Sep
-00
Jul-01
Ma
y-0
2
Ma
r-0
3
Jan
-04
No
v-0
4
Sep
-05
Jul-06
Ma
y-0
7
Ma
r-0
8
Jan
-09
No
v-0
9
Sep
-10
Jul-11
Ma
y-1
2
Ma
r-1
3
Jan
-14
No
v-1
4
Sep
-15
Jul-16
Ma
y-1
7
Ma
r-1
8
Jan
-19
Rolling 5-year Excess Return vs Benchmark
PIMCO - Excess PIMCO - Alpha 0.70%
20
Exhibit 9

Performance Analysis (Net of Fees)Description 1-Year 3-Year 5-Year 7-Year 10-Year Since Inc. Inception Date
TCW - Gross 8.31 3.10 3.36 3.75 6.15 5.81 10/31/2001
TCW - Net 8.14 2.93 3.19 3.55 5.92 5.60
Annualized Fee 0.17 0.17 0.17 0.20 0.22 0.21
Bloomberg Barclays Aggregate 7.87 2.31 2.95 2.62 3.90 4.42
Excess Return 0.27 0.62 0.25 0.93 2.03 1.18
Annualized Alpha 0.23 0.65 0.42 1.05 3.08 1.85
Active Manager Premium 0.70 0.70 0.70 0.70 0.70 0.70
Excess Risk Adjusted Returns -0.47 -0.05 -0.28 0.35 2.38 1.15
Risk and RegressionDescription 1-Year 3-Year 5-Year 7-Year 10-Year Since Inc.
Standard Deviation 3.30 2.89 2.71 2.82 3.18 3.52
Standard Deviaiton - Benchmark 3.28 3.03 2.94 2.90 2.89 3.42
Beta 1.00 0.95 0.91 0.92 0.94 0.76
R-Squared 1.00 0.99 0.98 0.90 0.73 0.55
Efficiency MeasuresDescription 1-Year 3-Year 5-Year 7-Year 10-Year Since Inc.
Sharpe Ratio 1.77 0.54 0.86 1.03 1.71 1.20
Treynor Ratio 5.80 1.64 2.55 3.15 5.80 5.52
Sortino Ratio 4.39 0.88 1.54 1.78 3.87 2.11
Tracking Error 0.17 0.30 0.47 0.90 1.68 2.50
Information Ratio 1.61 2.05 0.52 1.03 1.21 0.47
Upside Market Capture 101.40 101.81 94.79 106.28 118.60 100.22
Downside Market Capture 91.55 82.21 80.13 78.46 64.12 59.73
Status Evaluation:
3yr Alpha 5yr Alpha AMP3yr Alpha vs.
AMP5yr Alpha vs.
AMP StatusCurrent Quarter 0.65 0.42 0.70 -0.05 -0.28
Prior Quarter 0.55 0.41 0.70 -0.15 -0.29
TCW / Core Plus Fixed IncomeJune 30, 2019
Enhanced
Review
-4.00%
-2.00%
0.00%
2.00%
4.00%
6.00%
8.00%
Sep
-04
Feb
-05
Jul-05
De
c-0
5
Ma
y-0
6
Oc
t-06
Ma
r-0
7
Au
g-0
7
Jan
-08
Jun
-08
No
v-0
8
Ap
r-09
Sep
-09
Feb
-10
Jul-10
De
c-1
0
Ma
y-1
1
Oc
t-11
Ma
r-1
2
Au
g-1
2
Jan
-13
Jun
-13
No
v-1
3
Ap
r-14
Sep
-14
Feb
-15
Jul-15
De
c-1
5
Ma
y-1
6
Oc
t-16
Ma
r-1
7
Au
g-1
7
Jan
-18
Jun
-18
No
v-1
8
Ap
r-19
Rolling 3-year Excess Return vs Benchmark
TCW - Excess TCW - Alpha 0.70%
-2.00%-1.00%0.00%1.00%2.00%3.00%4.00%5.00%6.00%
Sep
-06
Jan
-07
Ma
y-0
7
Sep
-07
Jan
-08
Ma
y-0
8
Sep
-08
Jan
-09
Ma
y-0
9
Sep
-09
Jan
-10
Ma
y-1
0
Sep
-10
Jan
-11
Ma
y-1
1
Sep
-11
Jan
-12
Ma
y-1
2
Sep
-12
Jan
-13
Ma
y-1
3
Sep
-13
Jan
-14
Ma
y-1
4
Sep
-14
Jan
-15
Ma
y-1
5
Sep
-15
Jan
-16
Ma
y-1
6
Sep
-16
Jan
-17
Ma
y-1
7
Sep
-17
Jan
-18
Ma
y-1
8
Sep
-18
Jan
-19
Ma
y-1
9
Rolling 5-year Excess Return vs Benchmark
TCW - Excess TCW - Alpha 0.70%
21
Exhibit 9

Performance Analysis (Net of Fees)Description 1-Year 3-Year 5-Year 7-Year 10-Year Since Inc. Inception Date
Garcia Hamilton - Gross 5.99 2.45 3.42 3.83 5.34 5.57 2/28/2009
Garcia Hamilton - Net 5.84 2.24 3.23 3.64 5.14 5.38
Annualized Fee 0.15 0.21 0.19 0.19 0.20 0.19
Bloomberg Barclays Aggregate 7.87 2.31 2.95 2.62 3.90 4.09
Excess Return -2.03 -0.07 0.28 1.02 1.25 1.30
Annualized Alpha -0.68 0.14 0.45 1.13 2.07 1.53
Active Manager Premium 0.40 0.40 0.40 0.40 0.40 0.40
Excess Risk Adjusted Returns -1.08 -0.26 0.05 0.73 1.67 1.13
Risk and RegressionDescription 1-Year 3-Year 5-Year 7-Year 10-Year Since Inc.
Standard Deviation 2.58 2.39 2.89 2.91 3.19 3.17
Standard Deviaiton - Benchmark 3.28 3.03 2.94 2.90 2.89 2.87
Beta 0.77 0.76 0.92 0.93 0.93 0.92
R-Squared 0.95 0.93 0.87 0.86 0.71 0.70
Efficiency MeasuresDescription 1-Year 3-Year 5-Year 7-Year 10-Year Since Inc.
Sharpe Ratio 1.37 0.36 0.82 1.03 1.46 1.55
Treynor Ratio 4.59 1.13 2.57 3.22 5.02 5.31
Sortino Ratio 3.00 0.55 1.44 1.79 2.86 2.96
Tracking Error 0.95 0.96 1.08 1.13 1.73 1.76
Information Ratio -2.15 -0.07 0.26 0.90 0.72 0.74
Upside Market Capture 73.56 79.95 97.82 109.70 113.23 114.01
Downside Market Capture 72.05 67.32 85.20 81.85 82.38 81.06
Status Evaluation:
3yr Alpha 5yr Alpha AMP3yr Alpha vs.
AMP5yr Alpha vs.
AMP StatusCurrent Quarter 0.14 0.45 0.40 -0.26 0.05
Prior Quarter 0.36 0.60 0.40 -0.04 0.20
Garcia Hamilton / Core Fixed IncomeJune 30, 2019
Enhanced
Review
-0.50%0.00%0.50%1.00%1.50%2.00%2.50%3.00%3.50%4.00%
Rolling 3-year Excess Return vs Benchmark
Garcia Hamilton - Excess Garcia Hamilton - Alpha 0.40%
0.00%
0.50%
1.00%
1.50%
2.00%
2.50%
3.00%
Jan
-14
Ma
r-1
4
Ma
y-1
4
Jul-14
Sep
-14
No
v-1
4
Jan
-15
Ma
r-1
5
Ma
y-1
5
Jul-15
Sep
-15
No
v-1
5
Jan
-16
Ma
r-1
6
Ma
y-1
6
Jul-16
Sep
-16
No
v-1
6
Jan
-17
Ma
r-1
7
Ma
y-1
7
Jul-17
Sep
-17
No
v-1
7
Jan
-18
Ma
r-1
8
Ma
y-1
8
Jul-18
Sep
-18
No
v-1
8
Jan
-19
Ma
r-1
9
Ma
y-1
9
Rolling 5-year Excess Return vs Benchmark
Garcia Hamilton - Excess Garcia Hamilton - Alpha 0.40%
22
Exhibit 9

Performance Analysis (Net of Fees)Description 1-Year 3-Year 5-Year 7-Year 10-Year Since Inc. Inception Date
Progress Core Fixed - Gross 8.15 3.15 3.45 3.38 4.79 4.85 5/31/2008
Progress Core Fixed - Net 7.65 2.66 2.95 2.89 4.29 4.35
Annualized Fee 0.50 0.48 0.49 0.49 0.50 0.50
Bloomberg Barclays Aggregate 7.87 2.31 2.95 2.62 3.90 3.95
Excess Return -0.22 0.35 0.01 0.27 0.40 0.40
Annualized Alpha 0.31 0.41 0.13 0.34 0.69 0.31
Active Manager Premium 0.00 0.00 0.00 0.00 0.00 0.00
Excess Risk Adjusted Returns 0.31 0.41 0.13 0.34 0.69 0.31
Risk and RegressionDescription 1-Year 3-Year 5-Year 7-Year 10-Year Since Inc.
Standard Deviation 3.01 2.82 2.80 2.83 2.88 3.43
Standard Deviaiton - Benchmark 3.28 3.03 2.94 2.90 2.89 3.27
Beta 0.90 0.92 0.94 0.96 0.97 1.02
R-Squared 0.97 0.98 0.97 0.97 0.95 0.95
Efficiency MeasuresDescription 1-Year 3-Year 5-Year 7-Year 10-Year Since Inc.
Sharpe Ratio 1.77 0.45 0.74 0.79 1.32 1.11
Treynor Ratio 5.91 1.39 2.22 2.34 3.92 3.73
Sortino Ratio 3.14 0.47 1.10 1.19 2.31 1.93
Tracking Error 0.62 0.48 0.54 0.53 0.66 0.78
Information Ratio -0.36 0.73 0.01 0.51 0.60 0.51
Upside Market Capture 95.19 99.27 97.20 102.55 104.48 106.40
Downside Market Capture 85.96 86.95 94.07 95.13 95.08 100.70
Status Evaluation:
3yr Alpha 5yr Alpha AMP3yr Alpha vs.
AMP5yr Alpha vs.
AMP StatusCurrent Quarter 0.41 0.13 0.00 0.41 0.13
Prior Quarter 0.40 0.14 0.00 0.40 0.14
Progress / Core Fixed IncomeJune 30, 2019
Good Standing
-0.50%
0.00%
0.50%
1.00%
1.50%
Ap
r-11
Jul-11
Oc
t-11
Jan
-12
Ap
r-12
Jul-12
Oc
t-12
Jan
-13
Ap
r-13
Jul-13
Oc
t-13
Jan
-14
Ap
r-14
Jul-14
Oc
t-14
Jan
-15
Ap
r-15
Jul-15
Oc
t-15
Jan
-16
Ap
r-16
Jul-16
Oc
t-16
Jan
-17
Ap
r-17
Jul-17
Oc
t-17
Jan
-18
Ap
r-18
Jul-18
Oc
t-18
Jan
-19
Ap
r-19
Rolling 3-year Excess Return vs Benchmark
Progress Core Fixed - Excess Progress Core Fixed - Alpha
0.00%
0.20%
0.40%
0.60%
0.80%
1.00%
1.20%
Ap
r-13
Jun
-13
Au
g-1
3
Oc
t-13
De
c-1
3
Feb
-14
Ap
r-14
Jun
-14
Au
g-1
4
Oc
t-14
De
c-1
4
Feb
-15
Ap
r-15
Jun
-15
Au
g-1
5
Oc
t-15
De
c-1
5
Feb
-16
Ap
r-16
Jun
-16
Au
g-1
6
Oc
t-16
De
c-1
6
Feb
-17
Ap
r-17
Jun
-17
Au
g-1
7
Oc
t-17
De
c-1
7
Feb
-18
Ap
r-18
Jun
-18
Au
g-1
8
Oc
t-18
De
c-1
8
Feb
-19
Ap
r-19
Jun
-19
Rolling 5-year Excess Return vs Benchmark
Progress Core Fixed - Excess Progress Core Fixed - Alpha
23
Exhibit 9

Performance Analysis (Net of Fees)Description 1-Year 3-Year 5-Year 7-Year 10-Year Since Inc. Inception Date
Neuberger Berman - Gross 8.91 3.64 3.53 3.62 --- 4.25 12/31/2010
Neuberger Berman - Net 8.66 3.44 3.35 3.43 --- 4.06
Annualized Fee 0.25 0.21 0.19 0.19 --- 0.19
Bloomberg Barclays Aggregate 7.87 2.31 2.95 2.62 --- 3.35
Excess Return 0.79 1.12 0.40 0.81 --- 0.71
Annualized Alpha 1.37 1.21 0.72 1.00 --- 1.08
Active Manager Premium 0.70 0.70 0.70 0.70 --- 0.70
Excess Risk Adjusted Returns 0.67 0.51 0.02 0.30 --- 0.38
Risk and RegressionDescription 1-Year 3-Year 5-Year 7-Year 10-Year Since Inc.
Standard Deviation 3.34 2.93 2.78 2.87 --- 2.93
Standard Deviaiton - Benchmark 3.28 3.03 2.94 2.90 --- 2.83
Beta 0.88 0.88 0.84 0.89 --- 0.86
R-Squared 0.75 0.82 0.78 0.81 --- 0.69
Efficiency MeasuresDescription 1-Year 3-Year 5-Year 7-Year 10-Year Since Inc.
Sharpe Ratio 1.90 0.70 0.89 0.97 --- 1.20
Treynor Ratio 7.20 2.34 2.96 3.12 --- 4.08
Sortino Ratio 4.37 1.14 1.57 1.62 --- 2.10
Tracking Error 1.73 1.29 1.39 1.28 --- 1.68
Information Ratio 0.46 0.87 0.29 0.63 --- 0.42
Upside Market Capture 105.70 105.31 97.20 106.34 --- 105.62
Downside Market Capture 84.18 71.45 79.46 82.91 --- 79.44
Status Evaluation:
3yr Alpha 5yr Alpha AMP3yr Alpha vs.
AMP5yr Alpha vs.
AMP StatusCurrent Quarter 1.21 0.72 0.70 0.51 0.02
Prior Quarter 1.23 0.73 0.70 0.53 0.03
Neuberger Berman / Core Plus Fixed IncomeJune 30, 2019
Good Standing
-1.00%
-0.50%
0.00%
0.50%
1.00%
1.50%
2.00%
2.50%
No
v-1
3
Jan
-14
Ma
r-1
4
Ma
y-1
4
Jul-14
Sep
-14
No
v-1
4
Jan
-15
Ma
r-1
5
Ma
y-1
5
Jul-15
Sep
-15
No
v-1
5
Jan
-16
Ma
r-1
6
Ma
y-1
6
Jul-16
Sep
-16
No
v-1
6
Jan
-17
Ma
r-1
7
Ma
y-1
7
Jul-17
Sep
-17
No
v-1
7
Jan
-18
Ma
r-1
8
Ma
y-1
8
Jul-18
Sep
-18
No
v-1
8
Jan
-19
Ma
r-1
9
Ma
y-1
9
Rolling 3-year Excess Return vs Benchmark
Neuberger Berman - Excess Neuberger Berman - Alpha 0.70%
0.00%0.20%0.40%0.60%0.80%1.00%1.20%1.40%1.60%1.80%
Rolling 5-year Excess Return vs Benchmark
Neuberger Berman - Excess Neuberger Berman - Alpha 0.70%
24
Exhibit 9

Performance Analysis (Gross of Fees)Description 1-Year 3-Year 5-Year 7-Year 10-Year Since Inc. Inception Date
Colchester - Gross 9.36 5.76 0.84 1.90 4.76 5.69 1/31/2009
Colchester - Net --- --- --- --- --- ---
Annualized Fee --- --- --- --- --- ---
JPM GBI-Em Global Div Unhedged 8.99 4.24 -0.45 0.41 3.41 4.11
Excess Return 0.37 1.52 1.30 1.49 1.35 1.58
Annualized Alpha 0.11 1.33 1.57 1.57 1.73 1.32
Active Manager Premium 0.50 0.50 0.50 0.50 0.50 0.50
Excess Risk Adjusted Returns -0.39 0.83 1.07 1.07 1.23 0.82
Risk and RegressionDescription 1-Year 3-Year 5-Year 7-Year 10-Year Since Inc.
Standard Deviation 11.79 10.47 12.77 11.90 12.27 13.11
Standard Deviaiton - Benchmark 11.29 9.84 11.15 10.80 11.46 11.99
Beta 1.04 1.06 1.13 1.08 1.05 1.08
R-Squared 0.99 0.99 0.97 0.96 0.96 0.97
Efficiency MeasuresDescription 1-Year 3-Year 5-Year 7-Year 10-Year Since Inc.
Sharpe Ratio 0.60 0.42 0.00 0.11 0.35 0.40
Treynor Ratio 6.77 4.14 -0.02 1.16 4.06 4.85
Sortino Ratio 0.98 0.64 0.09 0.24 0.59 0.69
Tracking Error 1.06 1.32 2.58 2.46 2.38 2.56
Information Ratio 0.35 1.15 0.50 0.61 0.57 0.62
Upside Market Capture 103.18 110.76 116.91 111.26 107.91 110.09
Downside Market Capture 101.95 100.76 106.16 100.58 99.69 101.17
Status Evaluation:
3yr Alpha 5yr Alpha AMP3yr Alpha vs.
AMP5yr Alpha vs.
AMP StatusCurrent Quarter 1.33 1.57 0.50 0.83 1.07
Prior Quarter 2.03 1.63 0.50 1.53 1.13
Colchester Local Markets Debt Fund -CompositeJune 30, 2019
Good Standing
0.00%0.50%1.00%1.50%2.00%2.50%3.00%3.50%4.00%
De
c-1
1
Ma
r-1
2
Jun
-12
Sep
-12
De
c-1
2
Ma
r-1
3
Jun
-13
Sep
-13
De
c-1
3
Ma
r-1
4
Jun
-14
Sep
-14
De
c-1
4
Ma
r-1
5
Jun
-15
Sep
-15
De
c-1
5
Ma
r-1
6
Jun
-16
Sep
-16
De
c-1
6
Ma
r-1
7
Jun
-17
Sep
-17
De
c-1
7
Ma
r-1
8
Jun
-18
Sep
-18
De
c-1
8
Ma
r-1
9
Jun
-19
Rolling 3-year Excess Return vs Benchmark
Colchester - Excess Colchester - Alpha 0.50%
0.00%
0.50%
1.00%
1.50%
2.00%
2.50%
3.00%
De
c-1
3
Feb
-14
Ap
r-14
Jun
-14
Au
g-1
4
Oc
t-14
De
c-1
4
Feb
-15
Ap
r-15
Jun
-15
Au
g-1
5
Oc
t-15
De
c-1
5
Feb
-16
Ap
r-16
Jun
-16
Au
g-1
6
Oc
t-16
De
c-1
6
Feb
-17
Ap
r-17
Jun
-17
Au
g-1
7
Oc
t-17
De
c-1
7
Feb
-18
Ap
r-18
Jun
-18
Au
g-1
8
Oc
t-18
De
c-1
8
Feb
-19
Ap
r-19
Jun
-19
Rolling 5-year Excess Return vs Benchmark
Colchester - Excess Colchester - Alpha 0.50%
25
Exhibit 9

Performance Analysis (Net of Fees)Description 1-Year 3-Year 5-Year 7-Year 10-Year Since Inc. Inception Date
Progress EMD - Gross 11.09 6.71 --- --- --- 5.69 5/31/2015
Progress EMD - Net 10.57 6.24 --- --- --- 5.25
Annualized Fee 0.51 0.47 --- --- --- 0.44
JPM CEMBI- Broad 10.69 5.82 --- --- --- 5.80
Excess Return -0.12 0.42 --- --- --- -0.55
Annualized Alpha -2.15 -0.52 --- --- --- -1.22
Active Manager Premium 0.00 0.00 --- --- --- 0.00
Excess Risk Adjusted Returns -2.15 -0.52 --- --- --- -1.22
Risk and RegressionDescription 1-Year 3-Year 5-Year 7-Year 10-Year Since Inc.
Standard Deviation 4.45 4.03 --- --- --- 4.92
Standard Deviaiton - Benchmark 3.45 3.22 --- --- --- 4.08
Beta 1.26 1.22 --- --- --- 1.16
R-Squared 0.96 0.94 --- --- --- 0.92
Efficiency MeasuresDescription 1-Year 3-Year 5-Year 7-Year 10-Year Since Inc.
Sharpe Ratio 1.86 1.20 --- --- --- 0.86
Treynor Ratio 6.55 3.99 --- --- --- 3.66
Sortino Ratio 3.97 2.03 --- --- --- 1.48
Tracking Error 1.29 1.19 --- --- --- 1.53
Information Ratio -0.09 0.35 --- --- --- -0.36
Upside Market Capture 104.36 117.09 --- --- --- 108.11
Downside Market Capture 140.11 141.04 --- --- --- 137.91
Status Evaluation:
3yr Alpha 5yr Alpha AMP3yr Alpha vs.
AMP5yr Alpha vs.
AMP StatusCurrent Quarter -0.52 --- 0.00 -0.52 ---
Prior Quarter -0.53 --- 0.00 -0.53 ---
Progress / EM DebtJune 30, 2019
Good Standing
-1.00%-0.80%-0.60%-0.40%-0.20%0.00%0.20%0.40%0.60%0.80%1.00%
Apr-18 May-18 Jun-18 Jul-18 Aug-18 Sep-18 Oct-18 Nov-18 Dec-18 Jan-19 Feb-19 Mar-19 Apr-19 May-19 Jun-19
Rolling 3-year Excess Return vs Benchmark
Progress EMD - Excess Progress EMD - Alpha
0.00%
20.00%
40.00%
60.00%
80.00%
100.00%
120.00%
De
c-1
3
Feb
-14
Ap
r-14
Jun
-14
Au
g-1
4
Oc
t-14
De
c-1
4
Feb
-15
Ap
r-15
Jun
-15
Au
g-1
5
Oc
t-15
De
c-1
5
Feb
-16
Ap
r-16
Jun
-16
Au
g-1
6
Oc
t-16
De
c-1
6
Feb
-17
Ap
r-17
Jun
-17
Au
g-1
7
Oc
t-17
De
c-1
7
Feb
-18
Ap
r-18
Jun
-18
Au
g-1
8
Oc
t-18
De
c-1
8
Feb
-19
Ap
r-19
Jun
-19
Rolling 5-year Excess Return vs Benchmark
Progress EMD - Excess Progress EMD - Alpha
26
Exhibit 9

Performance Analysis (Gross of Fees)Description 1-Year 3-Year 5-Year 7-Year 10-Year Since Inc. Inception Date
Prudential - Gross 12.18 6.27 3.53 4.46 7.35 6.47 12/31/2007
Prudential - Net --- --- --- --- --- ---
Annualized Fee --- --- --- --- --- ---
50% JPM EMBI / 50% JPM GBI-EM 10.77 4.91 2.46 3.02 5.65 5.15
Excess Return 1.41 1.36 1.07 1.44 1.71 1.32
Annualized Alpha 0.01 0.78 0.89 1.13 1.21 0.82
Active Manager Premium 0.50 0.50 0.50 0.50 0.50 0.50
Excess Risk Adjusted Returns -0.49 0.28 0.39 0.63 0.71 0.32
Risk and RegressionDescription 1-Year 3-Year 5-Year 7-Year 10-Year Since Inc.
Standard Deviation 9.94 8.49 8.90 9.15 10.04 11.50
Standard Deviaiton - Benchmark 8.54 7.30 7.95 8.07 8.52 10.18
Beta 1.15 1.16 1.11 1.13 1.17 1.12
R-Squared 0.98 0.99 0.99 0.99 0.98 0.98
Efficiency MeasuresDescription 1-Year 3-Year 5-Year 7-Year 10-Year Since Inc.
Sharpe Ratio 0.98 0.57 0.30 0.42 0.68 0.51
Treynor Ratio 8.45 4.20 2.37 3.37 5.88 5.22
Sortino Ratio 1.73 0.864 0.507 0.672 1.086 0.777
Tracking Error 1.83 1.45 1.32 1.40 2.00 2.10
Information Ratio 0.71 0.91 0.80 1.02 0.85 0.63
Upside Market Capture 111.77 118.04 114.56 117.66 119.95 115.87
Downside Market Capture 109.37 110.51 106.14 106.97 111.32 109.15
Status Evaluation:
3yr Alpha 5yr Alpha AMP3yr Alpha vs.
AMP5yr Alpha vs.
AMP StatusCurrent Quarter 0.78 0.89 0.50 0.28 0.39
Prior Quarter 0.85 0.98 0.50 0.35 0.48
Prudential EM Debt Blend - CompositeJune 30, 2019
Good Standing
-1.00%
0.00%
1.00%
2.00%
3.00%
4.00%
No
v-1
0
Feb
-11
Ma
y-1
1
Au
g-1
1
No
v-1
1
Feb
-12
Ma
y-1
2
Au
g-1
2
No
v-1
2
Feb
-13
Ma
y-1
3
Au
g-1
3
No
v-1
3
Feb
-14
Ma
y-1
4
Au
g-1
4
No
v-1
4
Feb
-15
Ma
y-1
5
Au
g-1
5
No
v-1
5
Feb
-16
Ma
y-1
6
Au
g-1
6
No
v-1
6
Feb
-17
Ma
y-1
7
Au
g-1
7
No
v-1
7
Feb
-18
Ma
y-1
8
Au
g-1
8
No
v-1
8
Feb
-19
Ma
y-1
9
Rolling 3-year Excess Return vs Benchmark
Prudential - Excess Prudential - Alpha 0.50%
0.00%
0.50%
1.00%
1.50%
2.00%
2.50%
3.00%
No
v-1
2
Jan
-13
Ma
r-1
3
Ma
y-1
3
Jul-13
Sep
-13
No
v-1
3
Jan
-14
Ma
r-1
4
Ma
y-1
4
Jul-14
Sep
-14
No
v-1
4
Jan
-15
Ma
r-1
5
Ma
y-1
5
Jul-15
Sep
-15
No
v-1
5
Jan
-16
Ma
r-1
6
Ma
y-1
6
Jul-16
Sep
-16
No
v-1
6
Jan
-17
Ma
r-1
7
Ma
y-1
7
Jul-17
Sep
-17
No
v-1
7
Jan
-18
Ma
r-1
8
Ma
y-1
8
Jul-18
Sep
-18
No
v-1
8
Jan
-19
Ma
r-1
9
Ma
y-1
9
Rolling 5-year Excess Return vs Benchmark
Prudential - Excess Prudential - Alpha 0.50%
27
Exhibit 9

STATE UNIVERSITIES RETIREMENT SYSTEM
MarketValue
Estimated Unfunded FundingAssets Liabilities Liabilities Ratio Month FYTD
Jun-19 19.51$ 43.15$ 23.64$ 45.2%Jul-19 19.57 43.26 23.69 45.2% 0.21% 0.21%
Note: Assets and liabilities are estimated and unaudited through July 31, 2019. The fund had an actuarial value funding ratio of 42.8% at the end of Fiscal Year 2018, utilizing a 6.75% assumed rate of return.
Rate of Return
0%
20%
40%
60%
80%
100%
$0$2$4$6$8
$10$12$14$16$18$20$22$24$26$28$30$32$34$36$38$40$42$44$46
Jun-19 Jul-19
Pe
rcen
t F
un
de
d
$Bill
ion
s
SURS Projected Funding Status2020 Fiscal Year-to-Date Results
Assets Liability Funding Ratio
Exhibit 10

To: Investment Committee From: Investment Staff Date: September 2019 Re: Alternative Risk Premia Investment Manager Search Update Search Update At the September 2018 Investment Committee meeting the Board approved a new asset allocation that includes a 20% target to Crisis Risk Offset (CRO). The CRO class will include long duration, systematic trend following and alternative risk premia strategies. Alternative Risk Premia strategies are ultimately targeted at 30% of the CRO asset class, which will be phased in over 2019, 2020, and 2021. At the March 2019 Investment Committee meeting, the Board approved the recommendation to conduct a search for qualified firms to manage alternative risk premia strategies. The RFP was developed by SURS Staff and Meketa and advertised on the website of Pensions & Investments and in its April 1, 2019 print edition. In addition, the search was advertised in the April edition of Emerging Manager Monthly, noticed as required in the State newspaper, posted to the Meketa website, and posted to the SURS website beginning April 1, 2019.
Timeline The anticipated timeline for the search process is as follows:
Schedule of Events Quiet Period Begins March 8, 2019 RFP Issued April 1, 2019 Deadline for Responder Questions April 16, 2019 Response to Questions April 23, 2019 RFP Responses due 4:30pm CT May 2, 2019 Evaluations May / June 2019 Candidate Interviews September 4-5, 2019 Selection October 17, 2019
Exhibit 11

Update Staff received 37 responses from firms by the May 2, 2019 deadline. Alternative Risk Premia investment management proposals were received from the following firms:
Alternative Risk Premia Proposals Firm Name Location Firm Name Location
Aberdeen Standard Philadelphia, PA Lombard Odier New York, NY Acadian Asset Management Boston, MA Man Investments London, UK Adrian Lee & Partners London, UK Martlet Investments Newport Beach, CA Alliance Bernstein New York, NY Mellon Boston, MA AQR Capital Management Greenwich, CT Neuberger Berman New York, NY ARP Investments New York, NY Parametric Minneapolis, MN
Aspect Capital London, UK Pavlik Capital Oakbrook Terrace, IL
BlackRock New York, NY PE Investments Boston, MA Capital Fund Management Paris, France PIMCO Newport Beach, CA Credit Suisse New York, NY QMA Wadhwani London, UK Fulcrum Asset Management London, UK ROW Asset Management Newport Beach, CA GAM Investments New York, NY Schroder Investment Mgmt. New York, NY Gladius Capital Mgmt. Chicago, IL SpiderRock Advisors Chicago, IL Goldman Sachs Asset Management New York, NY Systematica Investments St Helier, Jersey Graham Capital Rowayton, CT Unigestion Ltd London, UK HSBC New York, NY Wellington Management Boston, MA JP Morgan New York, NY William Blair Investment Chicago, IL Kepos Capital New York, NY Windham Capital Boston, MA Liquid Strategies Atlanta, GA
Next Steps Staff and Meketa are in the process of reviewing the responses, and narrowing the list to a smaller number of firms to be invited for semi-finalist interviews on September 4-5 in Champaign. Upon completion of the interviews, Staff and Meketa will work together to identify finalist firms to be invited to present at the October Investment Committee. Current target for CRO phase in calls for 5% of the total SURS portfolio to be allocated in late 2019. With alternative risk premia representing 30% of the asset class, the initial allocation to alternative risk premia strategies is expected to be 1.50% of SURS total portfolio. Quiet Period Please note that the Quiet Period will remain in effect until a selection has been made by the Board and accepted by the service provider. A copy of the Quiet Period Policy Guidelines follows.
Exhibit 11

Quiet Period Policy Guidelines The Quiet Period Policy is intended to establish guidelines by which Board Members and Staff will communicate with prospective service providers during the search process. The objectives of the policy are to ensure that prospective service providers competing to become employed by SURS have equal access to information regarding the search parameters; communications related to the selection are consistent and accurate; and the process of selecting service providers is efficient, diligent, and fair. The following guidelines will be instituted during a search process for a service provider:
• A quiet period will commence upon Committee action (or Board action if the selection is not initiated through a Committee) to authorize a search for a service provider and end once a selection has been made by the Board and accepted by the service provider;
• Initiation, continuation and conclusion of the quiet period shall be publicly communicated to prevent inadvertent violations;
• All Board members, and Staff not directly involved in the search process, shall refrain from communicating with service provider candidates regarding any product or service related to the search offered by the candidate throughout the quiet period and shall refrain from accepting meals, travel, hotel, or other value from the candidates;
• Throughout the quiet period, if any Board member is contacted by a candidate, the Board member shall refer the candidate to SURS Consultant or Staff directly involved in the search process;
• All authority related to the search process shall be exercised solely by the relevant Committee or Board as a whole, and not by individual Board Members;
• All information related to the search process shall be communicated by the SURS Consultant and Staff to the relevant Committee or Board as a whole, and not to individual Board Members;
• The quiet period does not prevent Board approved due diligence, client conference attendance or communications with an existing service provider that happens to be a candidate in the ordinary course of services provided by such service provider; however, discussions related to the pending selection shall be avoided during those activities;
• The provisions of this policy will apply to service provider candidates throughout the quiet period and shall be communicated to candidates in conjunction with any competitive proposal process; and
• A service provider may be disqualified from a search process for a knowing violation of this policy.
Exhibit 11

M E K E T A I N V E S T M E N T G R O U P 100 LOWDER BROOK DRIVE SUITE 1100 WESTWOOD MA 02090
781 471 3500 fax 781 471 3411 www.meketagroup.com
Capital Markets Outlook & Risk Metrics As of July 31, 2019
Exhibit 12

Capital Markets Outlook & Risk Metrics
Prepared by Meketa Investment Group
Capital Markets Outlook
Takeaways While not as strong as June, July was another profitable month for U.S. Equity markets whereas Non-U.S.
Equity markets experienced marginal declines. YTD returns across Global Equity markets are in the double-digits, with several segments of the U.S. Equity market leading the pack at 20%+. Additionally, interest rates in the middle and long-end of the curve have continued to decline, with U.S. Long Bonds producing YTD returns of over 11%.
In an effort to combat global growth uncertainty and persistently low inflation, the Federal Reserve elected to cut rates for the first time in a decade. The full impact of this decision on economic data and the capital markets is likely to remain uncertain over the near term.
Geopolitical events, especially trade wars between the U.S. and China, are expected to provide variable shocks to the global economy and capital markets for the foreseeable future.
U.S. Equity markets remain expensive whereas Non-U.S. Equity markets remain reasonably valued relative to their history.
Implied equity market volatility1 remained well-below its historical average (~19) throughout July while ticking up to 16 at month-end.
The Market Sentiment Indicator2 returned to neutral at month end. Market uncertainty as measured by Systemic Risk remains low, but there is potential for negative surprises,
as global economies navigate their respective “late-cycle” dynamics and geopolitical events continue to unfold, as evidenced by early market movements in August.
1 As measured by VIX Index. 2 See Appendix for the rationale for selection and calculation methodology used for the risk metrics.
Page 2 of 29
Exhibit 12

Capital Markets Outlook & Risk Metrics
Prepared by Meketa Investment Group
Risk Overview/Dashboard (1) (As of July 31, 2019)1
Dashboard (1) summarizes the current state of the different valuation metrics per asset class relative to their own history.
1 With the exception of Private Equity Valuation that are available annually and data is as of December 31, 2018.
Page 3 of 29
Exhibit 12

Capital Markets Outlook & Risk Metrics
Prepared by Meketa Investment Group
Risk Overview/Dashboard (2) (As of July 31, 2019)
Dashboard (2) shows how the current level of each indicator compares to its respective history.
Page 4 of 29
Exhibit 12

Capital Markets Outlook & Risk Metrics
Prepared by Meketa Investment Group
Market Sentiment Indicator (All History) (As of July 31, 2019)
Page 5 of 29
Exhibit 12

Capital Markets Outlook & Risk Metrics
Prepared by Meketa Investment Group
Market Sentiment Indicator (Last Three Years) (As of July 31, 2019)
Page 6 of 29
Exhibit 12

Capital Markets Outlook & Risk Metrics
Prepared by Meketa Investment Group
U.S. Equity Cyclically Adjusted P/E1 (As of July 31, 2019)
This chart details one valuation metric for U.S. Equities. A higher (lower) figure indicates more expensive (cheaper) valuation relative to history.
1 U.S. Equity Cyclically Adjusted P/E on S&P 500 Index – Source: Robert Shiller and Yale University.
Page 7 of 29
Exhibit 12

Capital Markets Outlook & Risk Metrics
Prepared by Meketa Investment Group
Small Cap P/E vs. Large Cap P/E1 (As of July 31, 2019)
This chart compares the relative attractiveness of Small Cap U.S. Equities vs. Large Cap U.S. Equities on a valuation basis. A higher (lower) figure indicates that Large Cap (Small Cap) is more attractive.
1 Small Cap P/E (Russell 2000 Index) vs. Large Cap P/E (Russell 1000 Index) - Source: Russell Investments. Earnings figures represent 12-month “as reported” earnings.
Page 8 of 29
Exhibit 12

Capital Markets Outlook & Risk Metrics
Prepared by Meketa Investment Group
Growth P/E vs. Value P/E1 (As of July 31, 2019)
This chart compares the relative attractiveness of U.S. Growth Equities vs. U.S. Value Equities on a valuation basis. A higher (lower) figure indicates that Value (Growth) is more attractive.
1 Growth P/E (Russell 3000 Growth Index) vs. Value (Russell 3000 Value Index) P/E - Source: Bloomberg, MSCI, and Meketa Investment Group. Earnings figures represent 12-month “as reported” earnings.
Page 9 of 29
Exhibit 12

Capital Markets Outlook & Risk Metrics
Prepared by Meketa Investment Group
Developed International Equity Cyclically Adjusted P/E1 (As of July 31, 2019)
This chart details one valuation metric for Developed International Equities. A higher (lower) figure indicates more expensive (cheaper) valuation relative to history.
1 Developed International Equity (MSCI EAFE ex Japan Index) Cyclically Adjusted P/E – Source: MSCI and Bloomberg. Earnings figures represent the average of monthly “as reported” earnings over the previous ten years.
Page 10 of 29
Exhibit 12

Capital Markets Outlook & Risk Metrics
Prepared by Meketa Investment Group
Emerging Market Equity Cyclically Adjusted P/E1 (As of July 31, 2019)
This chart details one valuation metric for Emerging Markets Equities. A higher (lower) figure indicates more expensive (cheaper) valuation relative to history.
1 Emerging Market Equity (MSCI Emerging Markets Index) Cyclically Adjusted P/E – Source: MSCI and Bloomberg. Earnings figures represent the average of monthly “as reported” earnings over the previous ten years.
Page 11 of 29
Exhibit 12

Capital Markets Outlook & Risk Metrics
Prepared by Meketa Investment Group
Private Equity Multiples1 (As of December 31, 2018)2
This chart details one valuation metric for the Private Equity market. A higher (lower) figure indicates more expensive (cheaper) valuation relative to history.
1 Private Equity Multiples – Source: S&P LCD Average EBITDA Multiples Paid in All LBOs. 2 Only annual figures available.
Page 12 of 29
Exhibit 12

Capital Markets Outlook & Risk Metrics
Prepared by Meketa Investment Group
Core Real Estate Spread vs. Ten-Year Treasury1 (As of July 31, 2019)
This chart details one valuation metric for the Private Core Real Estate market. A higher (lower) figure indicates cheaper (more expensive) valuation.
1 Core Real Estate Spread vs. Ten-Year Treasury – Source: Real Capital Analytics, U.S. Treasury, Bloomberg, and Meketa Investment Group. Core Real Estate is proxied by weighted sector transaction based indices from Real Capital Analytics and
Meketa Investment Group.
Page 13 of 29
Exhibit 12

Capital Markets Outlook & Risk Metrics
Prepared by Meketa Investment Group
REITs Dividend Yield Spread vs. Ten-Year Treasury1 (As of July 31, 2019)
This chart details one valuation metric for the Public REITs market. A higher (lower) figure indicates cheaper (more expensive) valuation.
1 REITs Dividend Yield Spread vs. Ten-Year Treasury – Source: NAREIT, U.S. Treasury. REITs are proxied by the yield for the NAREIT Equity index.
Page 14 of 29
Exhibit 12
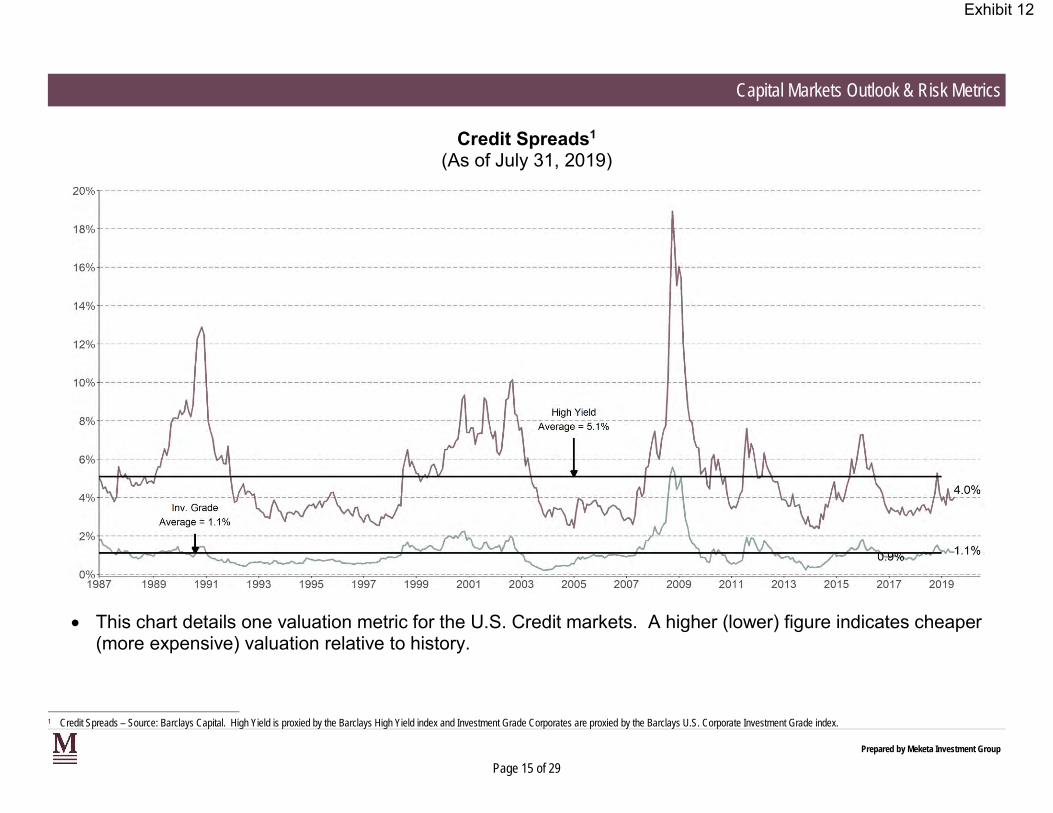
Capital Markets Outlook & Risk Metrics
Prepared by Meketa Investment Group
Credit Spreads1 (As of July 31, 2019)
This chart details one valuation metric for the U.S. Credit markets. A higher (lower) figure indicates cheaper (more expensive) valuation relative to history.
1 Credit Spreads – Source: Barclays Capital. High Yield is proxied by the Barclays High Yield index and Investment Grade Corporates are proxied by the Barclays U.S. Corporate Investment Grade index.
Page 15 of 29
Exhibit 12

Capital Markets Outlook & Risk Metrics
Prepared by Meketa Investment Group
Equity Volatility1 (As of July 31, 2019)
This chart details historical implied equity market volatility. This metric tends to increase during times of stress/fear and while declining during more benign periods.
1 Equity Volatility – Source: Bloomberg, and Meketa Investment Group. Equity Volatility proxied by VIX Index, a Measure of implied option volatility for U.S. equity markets.
Page 16 of 29
Exhibit 12

Capital Markets Outlook & Risk Metrics
Prepared by Meketa Investment Group
Systemic Risk and Volatile Market Days1 (As of August 1, 2019)
Systemic Risk is a measure of ‘System-wide’ risk, which indicates herding type behavior. This chart shows that starting in August this measure is low and that subsequently we can expect the number of turbulent days in August to be low.
1 Source: Meketa Investment Group, as of August 1, 2019. Volatile days are defined as the top 10 percent of realized turbulence, which is a multivariate distance between asset returns.
Page 17 of 29
Exhibit 12

Capital Markets Outlook & Risk Metrics
Prepared by Meketa Investment Group
Yield Curve Slope (Ten Minus Two)1 (As of July 31, 2019)
This chart details the historical difference in yields between ten-year and two-year U.S. Treasury bonds/notes. A higher (lower) figure indicates a steeper (flatter) yield curve slope.
1 Yield Curve Slope (Ten Minus Two) – Source: Bloomberg, and Meketa Investment Group. Yield curve slope is calculated as the difference between the 10-Year U.S. Treasury Yield and 2-Year U.S. Treasury Yield.
Page 18 of 29
Exhibit 12

Capital Markets Outlook & Risk Metrics
Prepared by Meketa Investment Group
Ten-Year Breakeven Inflation1 (As of July 31, 2019)
This chart details the difference between nominal and inflation-adjusted U.S. Treasury bonds. A higher (lower) figure indicates higher (lower) inflation expectations.
1 Ten-Year Breakeven Inflation – Source: U.S. Treasury and Federal Reserve. Data is as of June 30, 2019 for TIPS and Treasuries. Inflation is measured by the Consumer Price Index (CPI-U NSA).
Page 19 of 29
Exhibit 12

Capital Markets Outlook & Risk Metrics
Prepared by Meketa Investment Group
Total Return Given Changes in Interest Rates (bps)1 (As of July 31, 2019)
Total Return for Given Changes in Interest Rates (bps) Statistics
-100 -50 0 50 100 150 200 250 300 Duration YTW
Barclays U.S. Short Treasury (Cash) 2.3% 2.2% 2.0% 1.9% 1.7% 1.6% 1.5% 1.3% 1.2% 0.29 2.03%
Barclays U.S. Treasury 1-3 Yr. 3.8% 2.9% 2.0% 1.0% 0.1% -0.9% -1.9% -2.9% -3.9% 1.85 1.97%
Barclays U.S. Treasury Intermediate 5.7% 3.7% 1.7% -0.2% -2.0% -3.8% -5.6% -7.2% -8.9% 3.86 1.73%
Barclays U.S. Treasury Long 22.3% 11.8% 2.3% -6.1% -13.6% -20.0% -25.3% -29.7% -32.9% 17.95 2.32%
1 Data represents the expected total return from a given change in interest rates (shown in basis points) over a 12-month period assuming a parallel shift in rates. Data is as of July 31, 2019 via Barclays, Bloomberg, and Meketa Investment Group.
-10%
-8%
-6%
-4%
-2%
0%
2%
4%
6%
8%
-100 -50 0 50 100 150 200 250 300
Barclays U.S. Short Treasury (Cash) Barclays U.S. Treasury 1-3 Yr. Barclays U.S. Treasury Intermediate
Page 20 of 29
Exhibit 12

Capital Markets Outlook & Risk Metrics
Prepared by Meketa Investment Group
Long-Term Outlook – 20-Year Annualized Expected Returns1
This chart details Meketa’s long-term forward-looking expectations for total returns across asset classes.
1 Source: Meketa Investment Group’s 2019 Annual Asset Study.
0%
2%
4%
6%
8%
10%
12%
Page 21 of 29
Exhibit 12

Capital Markets Outlook & Risk Metrics
Prepared by Meketa Investment Group
Appendix
Data Sources and Explanations1 U.S. Equity Cyclically Adjusted P/E on S&P 500 Index – Source: Robert Shiller and Yale University. Small Cap P/E (Russell 2000 Index) vs. Large Cap P/E (Russell 1000 Index) - Source: Russell Investments.
Earnings figures represent 12-month “as reported” earnings. Growth P/E (Russell 3000 Growth Index) vs. Value (Russell 3000 Value Index) P/E - Source: Bloomberg,
MSCI, and Meketa Investment Group. Earnings figures represent 12-month “as reported” earnings. Developed International Equity (MSCI EAFE ex Japan Index) Cyclically Adjusted P/E – Source: MSCI and
Bloomberg. Earnings figures represent the average of monthly “as reported” earnings over the previous ten years.
Emerging Market Equity (MSCI Emerging Markets Index) Cyclically Adjusted P/E – Source: MSCI and Bloomberg. Earnings figures represent the average of monthly “as reported” earnings over the previous ten years
Private Equity Multiples – Source: S&P LCD Average EBITDA Multiples Paid in All LBOs Core Real Estate Spread vs. Ten-Year Treasury – Source: Real Capital Analytics, U.S. Treasury, Bloomberg,
and Meketa Investment Group. Core Real Estate is proxied by weighted sector transaction based indices from Real Capital Analytics and Meketa Investment Group.
REITs Dividend Yield Spread vs. Ten-Year Treasury – Source: NAREIT, U.S. Treasury. REITs are proxied by the yield for the NAREIT Equity index.
Credit Spreads – Source: Barclays Capital. High Yield is proxied by the Barclays High Yield index and Investment Grade Corporates are proxied by the Barclays U.S. Corporate Investment Grade index.
1 All Data as of July 31, 2019.
Page 22 of 29
Exhibit 12

Capital Markets Outlook & Risk Metrics
Prepared by Meketa Investment Group
Appendix
Data Sources and Explanations1 Equity Volatility – Source: Bloomberg, and Meketa Investment Group. Equity Volatility proxied by VIX Index,
a Measure of implied option volatility for U.S. equity markets. Systemic Risk and Volatile Market Days – Source: Meketa Investment Group. Volatile days are defined as
the top 10 percent of realized turbulence, which is a multivariate distance between asset returns. Systemic Risk, which measures risk across markets, is important because the more contagion of
risk that exists between assets, the more likely it is that markets will experience volatile periods. Yield Curve Slope (Ten Minus Two) – Source: Bloomberg, and Meketa Investment Group. Yield curve slope
is calculated as the difference between the 10-Year U.S. Treasury Yield and 2-Year U.S. Treasury Yield. Ten-Year Breakeven Inflation – Source: U.S. Treasury and Federal Reserve. Inflation is measured by the
Consumer Price Index (CPI-U NSA).
1 All Data as of July 31, 2019.
Page 23 of 29
Exhibit 12

Meketa Market Sentiment Indicator Explanation, Construction and Q&A
Page 24 of 29
Exhibit 12
Capital Markets Outlook & Risk Metrics
Prepared by Meketa Investment Group
Meketa has created the MIG Market Sentiment Indicator (MIG-MSI) to complement our valuation-focused Risk Metrics. This measure of sentiment is meant to capture significant and persistent shifts in long-lived market trends of economic growth risk, either towards a risk-seeking trend or a risk-aversion trend. This appendix explores:
What is the Meketa Market Sentiment Indicator? How do I read the indicator graph? How is the Meketa Market Sentiment Indicator constructed? What do changes in the indicator mean?
Page 25 of 29
Exhibit 12

Capital Markets Outlook & Risk Metrics
Prepared by Meketa Investment Group
Meketa has created a market sentiment indicator for monthly publication (the MIG-MSI – see below) to complement Meketa’s Risk Metrics.
Meketa’s Risk Metrics, which rely significantly on standard market measures of relative valuation, often provide valid early signals of increasing long-term risk levels in the global investment markets. However, as is the case with numerous valuation measures, the Risk Metrics may convey such risk concerns long before a market corrections take place. The MIG-MSI helps to address this early-warning bias by measuring whether the markets are beginning to acknowledge key Risk Metrics trends, and / or indicating non-valuation based concerns. Once the MIG-MSI indicates that the market sentiment has shifted, it is our belief that investors should consider significant action, particularly if confirmed by the Risk Metrics. Importantly, Meketa believes the Risk Metrics and MIG-MSI should always be used in conjunction with one another and never in isolation. The questions and answers below highlight and discuss the basic underpinnings of the Meketa MIG-MSI:
What is the Meketa Market Sentiment Indicator (MIG-MSI)? The MIG-MSI is a measure meant to gauge the market’s sentiment regarding economic growth risk. Growth
risk cuts across most financial assets, and is the largest risk exposure that most portfolios bear. The MIG-MSI takes into account the momentum (trend over time, positive or negative) of the economic growth risk exposure of publicly traded stocks and bonds, as a signal of the future direction of growth risk returns; either positive (risk seeking market sentiment), or negative (risk averse market sentiment).
Page 26 of 29
Exhibit 12

Capital Markets Outlook & Risk Metrics
Prepared by Meketa Investment Group
How do I read the Meketa Market Sentiment Indicator graph? Simply put, the MIG-MSI is a color-coded indicator that signals the market’s sentiment regarding economic
growth risk. It is read left to right chronologically. A green indicator on the MIG-MSI indicates that the market’s sentiment towards growth risk is positive. A gray indicator indicates that the market’s sentiment towards growth risk is neutral or inconclusive. A red indicator indicates that the market’s sentiment towards growth risk is negative. The black line on the graph is the level of the MIG-MSI. The degree of the signal above or below the neutral reading is an indication the signal’s current strength.
Momentum as we are defining it is the use of the past behavior of a series as a predictor of its future behavior.
Page 27 of 29
Exhibit 12

Capital Markets Outlook & Risk Metrics
Prepared by Meketa Investment Group
How is the Meketa Market Sentiment Indicator (MIG-MSI) Constructed? The MIG-MSI is constructed from two sub-elements representing investor sentiment in stocks and bonds:
Stock return momentum: Return momentum for the S&P 500 Equity Index (trailing 12-months) Bond yield spread momentum: Momentum of bond yield spreads (excess of the measured bond
yield over the identical duration U.S. Treasury bond yield) for corporate bonds (trailing 12-months) for both investment grade bonds (75% weight) and high yield bonds (25% weight).
Both measures are converted to Z-scores and then combined to get an “apples to apples” comparison without the need of re-scaling.
The black line reading on the graph is calculated as the average of the stock return momentum measure and the bonds spread momentum measure.1 The color reading on the graph is determined as follows:
If both stock return momentum and bond spread momentum are positive = GREEN (positive) If one of the momentum indicators is positive, and the other negative = GRAY (inconclusive) If both stock return momentum and bond spread momentum are negative = RED (negative)
1 Momentum as we are defining it is the use of the past behavior of a series as a predictor of its future behavior. “Time Series Momentum” Moskowitz, Ooi, Pedersen, August 2010. http://pages.stern.nyu.edu/~lpederse/papers/TimeSeriesMomentum.pdf
Page 28 of 29
Exhibit 12

Capital Markets Outlook & Risk Metrics
Prepared by Meketa Investment Group
What does the Meketa Market Sentiment Indicator (MIG-MSI) mean? Why might it be useful? There is strong evidence that time series momentum is significant and persistent. In particular, across an
extensive array of asset classes, the sign of the trailing 12-month return (positive or negative) is indicative of future returns (positive or negative) over the next 12-month period. The MIG-MSI is constructed to measure this momentum in stocks and corporate bond spreads. A reading of green or red is agreement of both the equity and bond measures, indicating that it is likely that this trend (positive or negative) will continue over the next 12 months. When the measures disagree, the indicator turns gray. A gray reading does not necessarily mean a new trend is occurring, as the indicator may move back to green, or into the red from there. The level of the reading (black line) and the number of months at the red or green reading, gives the user additional information on which to form an opinion, and potentially take action.
Page 29 of 29
Exhibit 12

To: Investment Committee From: Investment Staff Date: August 26, 2019 Re: Summary Risk Report
Attached is the Summary Risk Report for the quarter ending June 30, 2019. Highlights for the quarter include:
• Liquidity – The portfolio remains highly liquid with 83% of assets estimated to have liquidity of less than two weeks under normal market conditions.
• Value at Risk (1 Year Forward) – Tail risk decreased slightly during the quarter from 13.67% to 13.18%. This parameter indicates that, at a confidence level of 95%, the maximum estimated asset loss over a one-year period would be of 13.18%.
• Standard Deviation (5 Year Historical) – Total portfolio volatility slightly increased from the
prior quarter from 6.76% to 7.08%. Per Northern Trust, the total risk estimate has decreased for the total plan for the 2nd quarter. The risk estimate decreased for Equities and Commodities, while the estimate for Hedge Funds, Real Estate, Fixed Income, and the Opportunity Fund increased. Within equities, the risk estimate decreased for international markets and U.S. markets, with the exception of small cap. Although the risk contribution to the total plan did not change materially, the decrease in risk of the equities ex-Private portfolio had a large impact on the plan.
• Tracking Error: The forecasted 5-year tracking error of 0.80 was lower than the actual 0.82 for
the total fund for the quarter. The portfolio’s tracking error has been decreasing at a steady pace since mid-2015 with a recent slight spike in late 2018. The lower active risk of the total portfolio during the last few years can be partially explained by the increase in fund allocations to passive strategies.
• The Global Financial Stress Index (GFSI) was -0.05, slightly higher than last quarter’s -0.21,
indicating that the market is experiencing more stress than during 1Q 2019. The index remains well below the peak of 3.01 during the Global Financial Crisis.
• U.S. Treasury Yield Curve – The yield curve remained slightly inverted during the quarter. The
yield on the 10-Year Treasury decreased from 2.39% to 2.00% during the quarter.
• Appropriation Summary –FY 2019 state appropriations received were approximately $1.5 billion, or 90.9% of the anticipated $1.7 billion due, as of June 30, 2019. The total FY 2019 appropriation is $1,655,154,000. The actuarial benefit payment projection for FY 2019 is $2,716.848 million.
• Cash Account Summary – Ending cash on hand was approximately $31 million as of June 30, 2019. Net private partnership cash flows during the quarter were negative and approximately $114 million.
Exhibit 13

Summary Risk Report
Quarter Ending June 30, 2019
Exhibit 14

Risk Dashboard
Liquidity VaR StandardDeviation
100%0%
70%
50%
83%
20%
50%0%
18%
13.18 %
12%
10%
0% 30%
7.08%
o Liquidity Green = > 70.00% Highly Liquid, Yellow = 69.90% - 50.00%, Red = < 50.00%.
Liquidity Estimates Under Normal Market Conditions. Stressed Market Conditions Will Impact Both Liquidity & Pricing.
o Value at Risk (VaR) Green = < 18.00%, Yellow = 18.01% to 20.00%, Red = > 20.00%.
1 Year Forward Looking Maximum Data Point = 21.50% (March 2013). 1 Year Forward Looking Minimum Data Point = 11.22% (September 2018).
o Standard Deviation Green = < 10.00%, Yellow = 10.01 – 11.80%, Red = > 11.80%
5 Year Historical Rolling Maximum = 13.89% (June 2012). 5 Year Historical Rolling Minimum = 5.74% (December 1996).
Exhibit 14

Liquidity Profile
0%
10%
20%
30%
40%
50%
60%
Cash Passive < 2 Weeks 1 Month + Illiquid
Estimated Days to Liquidate83%
Liquidity risk is the risk that SURS would not be able to meet short term financial demands due to cash flow and/or the inability toconvert securities or other assets to cash without a loss of capital and/or income in the process. Currently, approximately 82.6% ofthe portfolio is highly liquid under normal market conditions.Data Source: SURS
Exhibit 14

Value at Risk (VaR)
VaR is the estimated maximum loss over a one year period given a certain level of confidence (95%).Data Source: Northern Trust
0 1 2 3-1-2-3
68%
95%
99.7%
Downside Risk (Left Tail)
13.18%
11.00%
13.00%
15.00%
17.00%
19.00%
21.00%
23.00%
Mar
-13
Jun-
13Se
p-13
Dec-
13M
ar-1
4Ju
n-14
Sep-
14De
c-14
Mar
-15
Jun-
15Se
p-15
Dec-
15M
ar-1
6Ju
n-16
Sep-
16De
c-16
Mar
-17
Jun-
17Se
p-17
Dec-
17M
ar-1
8Ju
n-18
Sep-
18De
c-18
Mar
-19
Jun-
19
Total Fund (1 Year Forward Looking)
VaR
21.50%
11.22%
Exhibit 14

Standard Deviation
Standard deviation measures the variability of investment returns. A low standard deviation indicates that the data points tend to be veryclose to the mean, while high standard deviation indicates that the data are spread out over a large range of values. The expected standarddeviation of the SURS portfolio based on the target asset allocation is 12.5%.Data Source: SURS
7.08%
0.00%
2.00%
4.00%
6.00%
8.00%
10.00%
12.00%
14.00%
16.00%
Mar
-13
Jun-
13Se
p-13
Dec-
13M
ar-1
4Ju
n-14
Sep-
14De
c-14
Mar
-15
Jun-
15Se
p-15
Dec-
15M
ar-1
6Ju
n-16
Sep-
16De
c-16
Mar
-17
Jun-
17Se
p-17
Dec-
17M
ar-1
8Ju
n-18
Sep-
18De
c-18
Mar
-19
Jun-
19
Total Fund (5 Years Ending)
Total Fund
• Total Fund Annualized Standard Deviation (5 Years Ending) is 7.08% as of June 30, 2019
• Total Fund (5 Year Rolling) Standard Deviation ranges from 5.74% (Dec. 1996) to 13.89% (June 2012)
• Based on the current asset allocation, portfolio volatility is lower than the expected 12.5%
Key Observations:13.89%
5.74%
Exhibit 14

Tracking Error
0.82
0.80
0.00
0.20
0.40
0.60
0.80
1.00
1.20
1.40
1.60
1.80M
ar-1
3
Jun-
13
Sep-
13
Dec-
13
Mar
-14
Jun-
14
Sep-
14
Dec-
14
Mar
-15
Jun-
15
Sep-
15
Dec-
15
Mar
-16
Jun-
16
Sep-
16
Dec-
16
Mar
-17
Jun-
17
Sep-
17
Dec-
17
Mar
-18
Jun-
18
Sep-
18
Dec-
18
Mar
-19
Jun-
19
Trac
king
Err
or %
5 yr Ex-Post Total Fund Tracking Error 5 yr Ex-Ante Total Fund Tracking Error
Tracking error is the standard deviation od the difference between the returns of an investment and its benchmark. It is also refered to as active risk. The 5yr ex-ante tracking error, is typically used to describe the range of annualized returns a portfolio will have around the benchmark two thirds of the time. Sources: Investopedia and Northern Trust
Exhibit 14

Global Financial Stress Index
Global Financial Stress Index (GFSI) Chart – The GFSI composite index aggregates over twenty measures of stress across fiveasset classes and various geographies, measuring three separate kinds of financial market stress: risk, as indicated by cross-assetmeasures of volatility, solvency, and liquidity; hedging demand, from activity in equity and currency options; and investor appetitefor risk, as measured by trading volumes as well as flows in and out of equities, high-yield bonds, and money markets. GFSI > 0means more stress than normal. GFSI < 0 means less stress than normal.Data source: BofA Merrill Lynch and Bloomberg
3.01
0.50
-0.50
0.00
-0.66
Exhibit 14

Treasury Yield Curve
A yield curve is a line that plots the interest rates, at a set point in time, of bonds having equal credit quality, but differing maturitydates. The U.S. Treasury yield curve is used as a benchmark for other debt in the market, such as mortgage rates or bank lendingrates. The curve is also used to predict changes in economic output and growth. A normal yield curve is one in which longermaturity bonds have a higher yield compared to shorter-term bonds due to the risks associated with time. An inverted yield curve isone in which the shorter-term yields are higher than the longer-term yields, which can be a sign of upcoming recession. A flat (orhumped) yield curve is one in which the shorter- and longer-term yields are very close to each other, which is also a predictor of aneconomic transition. The slope of the yield curve is also seen as important: the greater the slope, the greater the gap between short-and long-term rates.Data Source: U.S. Department of the Treasury and Investopedia
2.39%
2.00%
0.00%
0.50%
1.00%
1.50%
2.00%
2.50%
3.00%
1 Month 3 Month 6 Month 1 Year 2 Year 3 Year 5 Year 7 Year 10 Year 20 Year 30 Year
3/29/2019 6/28/2019
Exhibit 14

Appropriation SummarySURS Fiscal Year 2019 Appropriation
$1,655,154,000
Month Amount Due Amount Received (Under) / Over % Received
July $137,929,500 $758,000 ($137,171,500) 0.5%
August $137,929,500 $69,343,750 ($68,585,750) 50.3%
September $137,929,500 $137,971,500 $42,000 100%
October $137,929,500 $143,122,280 $5,192,780 103.8%
November $137,929,500 $172,868,610 $34,939,110 125.3%
December $137,929,500 $117,861,110 ($20,068,390) 85.5%
January $137,929,500 $164,925,000 $26,995,500 119.6%
February $137,929,500 $114,932,356 ($22,997,144) 83.3%
March $137,929,500 $123,828,500 ($14,101,000) 89.8%
April $137,929,500 $265,135,344 $127,205,844 192.2%May $137,929,500 $110,839,500 ($27,090,000) 80.4%June $137,929,500 $82,933,050 ($54,996,450) 60.1%
FYTD $1,655,154,000 $1,504,519,000 ($150,635,000) 90.9%
Monthly appropriation payments can be volatile, making cash management and liquidity an area of focus. Data Source: SURS
Actuarial benefit payments projection for FY 2019: $2,716,848,000
Exhibit 14

Cash Account SummarySURS Cash Account SummaryApril 1, 2019– June 30, 2019
Beginning Balance $270,214,986
Cash In:
Partnership Distributions 38,079,431
Benefit Payments 230,000,000
Partial Redemptions 81,020,279
Funds from Closed Accounts 8,268,696
Other Income 2,708,701
Total Cash In: $360,077,107
Cash Out:
Partnership Capital Calls (246,041,549)
Net Contributions (Contributions less Benefit Payments)
(153,104,098)
Total Cash Out: (399,104,098)
Ending Balance $231,187,996
Cash flow detail is provided in the Quarterly Board Report Data Source: SURS
Key Observations:
• Net private partnership (Private Equity, Real Estate, Infrastructure and Hedge Funds) cash flows were negative and approximately $114 million for the quarter.
• Benefit payments were approximately $230 million for the quarter.
Exhibit 14

To: Investment Committee From: Investment Staff Date: August 29, 2019 Re: U.S. Long Treasury Background At the September 2018 Investment Committee meeting, the Board approved a new long-term asset allocation that includes a 20% target to Crisis Risk Offset (CRO). The CRO class includes long duration, trend-following and alternative risk premia strategies. From the total CRO target, 35% will be allocated to the long duration U.S. Treasury strategy.
At the October 2018 Investment Committee meeting SURS Staff and PCA (now Meketa) presented an implementation plan for the adopted 2018 strategic allocation targets. The following is the proposed phase-in schedule for the CRO strategic class.
On May 6th, 2019, a Request for Information (RFI) was sent to the SURS approved slate of five passive managers. The slate was approved at the June 9, 2017 Board meeting by the following motion.
The Northern Trust Company, RhumbLine, State Street Bank and Trust Company, BlackRock and Piedmont Investment Advisers shall be approved as a provider of additional passively managed liquid equity and fixed income, in such sub-classes and amounts as may be approved by the board from time to time.
RFI responses were received by the following four managers.
• BlackRock • Northern Trust Company • RhumbLine • State Street Bank and Trust Company
Structure for the U.S. Long Treasury portfolio The following underlying assumptions and guidelines were specified in the RFI to passive managers:
Current Late 2019 7/1/2020 7/1/2021
Long-Term Target
CRO 0% 5% 10% 20% 20%
Exhibit 15

1. The objective of this strategy is to provide exposure to the Barclays Capital Long U.S.
Treasury Index. 2. The annualized tracking error objective will be under 15 bps. 3. Investments in the portfolio may include the following types of securities: cash, agency
bills, notes, bonds. 4. The use of leverage is not allowed. Leverage is defined as economic value at risk which is
greater than the net assets value of the portfolio. 5. Derivatives may not be used.
RFI Review and Manager Selection SURS Staff and Meketa reviewed the RFI responses and concluded that all managers are fully capable of managing to the selected benchmark with low tracking error. All managers have assets under management invested in U.S. Treasuries. RhumbLine had the lowest proposed fee and is expected to have lower trading costs as they use an optimizer for rebalancing. RhumbLine is a minority-owned firm. A matrix containing relevant information from the RFI responses are included in the materials provided. SURS Staff did an on-site due diligence visit to RhumbLine and met with the Investment Management, Investment Operations and Information Technology Groups. The proposal was reviewed in further detail and clarifications provided. SURS Staff was able to negotiate an additional fee reduction with RhumbLine that takes into account the whole SURS relationship. Recommendation That based on the recommendation of SURS Staff and Meketa, the Investment Committee approve RhumbLine to be retained to manage a U.S. Long Government strategy with an initial allocation of 1.75% of the SURS total portfolio, subject to successful completion of contract negotiations. The primary source of funding will be determined as other strategic class changes are implemented. Quiet Period Policy Guidelines The Quiet Period Policy is intended to establish guidelines by which Board Members and Staff will communicate with prospective service providers during the search process. The objectives of the policy are to ensure that prospective service providers competing to become employed by SURS have equal access to information regarding the search parameters; communications related to the selection are consistent and accurate; and the process of selecting service providers is efficient, diligent, and fair. The following guidelines will be instituted during a search process for a service provider:
1. A Quiet Period will commence upon Board authorization to issue an RFP and end once a selection has been made by the Board and the completion of successful contract negotiations with a respondent;
2. Initiation, continuation and conclusion of the Quiet Period shall be publicly communicated to prevent inadvertent violations;
3. All Board members, and Staff other than the Chief Procurement Officer or their designee, shall refrain from communicating with respondents regarding any product or service
Exhibit 15

related to the search in process. All Board members and Staff shall refrain from accepting meals, travel, hotel, or other value from such respondents;
4. Throughout the Quiet Period, if any Board member is contacted by a respondent, the Board member shall refer such party to the Chief Procurement Officer;
5. All authority related to the search process shall be exercised solely by the Investment Committee or Board as a whole, and not by individual Board members;
6. The Quiet Period does not prevent Board approved due diligence, client conference attendance or communications with an existing vendor; provided, however, that discussions related to the procurement and pending selection shall be avoided during those activities;
7. The provisions of this Policy shall apply throughout the Quiet Period and shall be communicated to respondents in conjunction with any search; and
8. A respondent may be disqualified from a search process for a violation of the Quiet Period or any portion of this Policy.
Exhibit 15

Northern Trust BlackRock RhumbLine State Street
Experience in Strategy
No assets indexed to the BC Long U.S. Treasury Index. Have managed to Long Government Bond Index Strategy.
Short track record (2019) with BlackRock's Long Term Government Bond Index Strategy
No assets indexed to the BC Long U.S. Treasury Index. Have managed to other Treasury indices.
Have managed to Long U.S. Treasury indices.
Portfolio Construction Process Stratified sampling Stratified sampling
Optimized replication: portfolio is replicated, then cash flows and rebalancing are optimized to reduce cost.
Stratified sampling
AUMSteady increase from $3 trillion in 2014 to $7.9 trillion in YTD 2019
U.S. Long Treasury Index Fund: $712.67mil in 2019Long Term Gvt Bond Index:
steady increase from $3.2 mil in 2014 to $5.7 mil in 2019
Barclays Capital U.S. Aggregate
Bond Index (Core Bond): steady increase from $294.2mil in 2014 to $677.1mil in 2019 Bloomberg Barclays U.S. TIPS
Index Strategy: considerable increase from $6.4mil in 2014 to $948.3mil in 2019Bloomberg Barclays Capital U.S. 5-
7 Year Treasury Bond Index
Strategy: newer strategy, $19.2mil in 2016 to $27.5mil in 2019
Long U.S. Treasury Index: increased from $3.2 billion in 2014 to $12.6 billion in 2019
Total Clients2 clients in 2014, gained 3 in 2016, total 5 in YTD 2019
U.S. Long Treasury Index Fund: 1 in 2019Long Term Gvt Bond Index:
declined from 51 in 2014 to 36 in 2019
Barclays Capital U.S. Aggregate
Bond Index (Core Bond): doubled from 8 in 2014 to 16 in 2019 Bloomberg Barclays U.S. TIPS
Index Strategy: increased from 1 in 2014 to 6 in 2019Bloomberg Barclays Capital U.S. 5-
7 Year Treasury Bond Index
Strategy: 1 in 2016 to 1 in 2019
Long U.S. Treasury Index: increased from 37 in 2014 to 64 in 2019
Product Inception Date December 1, 1993
U.S. Long Treasury: January 9, 2019Long Term Gvt Index: March 31, 2003
Barclays Capital U.S. Aggregate
Bond Index (Core Bond): 2005Bloomberg Barclays U.S. TIPS
Index Strategy: December 31, 2012Bloomberg Barclays Capital U.S. 5-
7 Year Treasury Bond Index
Strategy: September 31, 3016
Long U.S. Treasury Index: May 1, 2003
Perfomance Product v Benchmark
Non Lending fund:
Low tracking error. Seems to closely track the benchmark with slight underperformance for 3-yr, 5-yr, 7-yr and 10-yrLending fund:
0.48 tracking error in 10-yr. Shows overperformance in 1-yr, 3-yr, 5yr, 7yr, 10yr
Long Term Gvt Bond Index:
Considerably low tracking error, highest is 0.11 in 7-yr. Outperformance during all periods reviewed
Barclays Capital U.S. Aggregate
Bond Index (Core Bond):
Outperformance during all timeframes, greatest is 1-year 0.34 v 0.01Bloomberg Barclays U.S. TIPS
Index Strategy: Overperformance during all timeframes, short track record: max is 5-yrBloomberg Barclays Capital U.S. 5-
7 Year Treasury Bond Index
Strategy: short track record: max is 1-yr, overperformed 1-yrs, underperformed QTR, overperformed SI: -0.41 v -0.59
Long U.S. Treasury Index: extremely low tracking error: 0.0147 in 10-yr, 0.1292 since inception. Performance on par with benchmark, slight overperformance for 1-yr and 3-yr, underperformance for 7-yr, 10-yr and since inception
Proposed Fee Schedule
SMA:
First $200mil: 3bpsNext: $300mil: 2bpsCommingled funds:
Lending: 1bpNon lending: 1.25 bpsBalance: 1bp
U.S. Long Treasury Index:
SMA:
First $100mil: 4.5bpsNext $400mil: 3bpsBalance: 2.25 bpsCommingled funds (Lending)
First $100: 3bpsNext $400: 1.5bpsBalance: 0.75bps
SMA: Based on total SURS relationshipFirst $1 billion: 1bpNext $1 billion: 0.75 bpsBalance: 0.50 bpsMin fee is waived Commingled funds: NA
Based on total SURS relationshipSMA
First $100mil: 3bpsBalance: 1 bps Plus $175,000 min annual fee Commingled funds (Lending or
Non-lending):
First $100mil: 3bpsBalance: 1 bps
Other Fees
Lending:
Admin cap: 1.25 bpsMost recent actual: 0.84 bpsNon lending:
Admin cap: 0.8 bpsMost recent actual: 0.57bps
Lending:
Admin cap: 200 bpsMost recent: 63 bps
NALending and Non-lending:No admin capMost recent actual: 1.08 bps
Team Assigned to Product
David Alongi, CFA: Director, FI Index Management Ian Birtch: PMDan Personette, CFA: Senior PMMichael Chico, CFA: Senior PM
Scott Radel, CFA: Managing Directorjames Mauro: Managing DirectorMark Buell: Director
Alexander Ryer, CFA, FRM, CAIA: CIOJulie Carman Lind: PMJeff Kusmierz, PMAntonio J. Ballestas: Assistant PM
Joanna Madden: Lead PMCynthia Moy: Backup PM
Personnel Turnover 2016-YTD 2019 2019: 1 joined 2018: 1 joined and 1 departed 2019: 1 departed
Firm-wide, not product-specific2017: 1 joined and 1 departed2018: 1 departed
FI team in Boston, not product-specific2016: 11 joined and 17 departed 2017: 7 joined and 4 departed2018: 1 joined and 3 departed2019: 4 joined and 7 departed
Exhibit 16
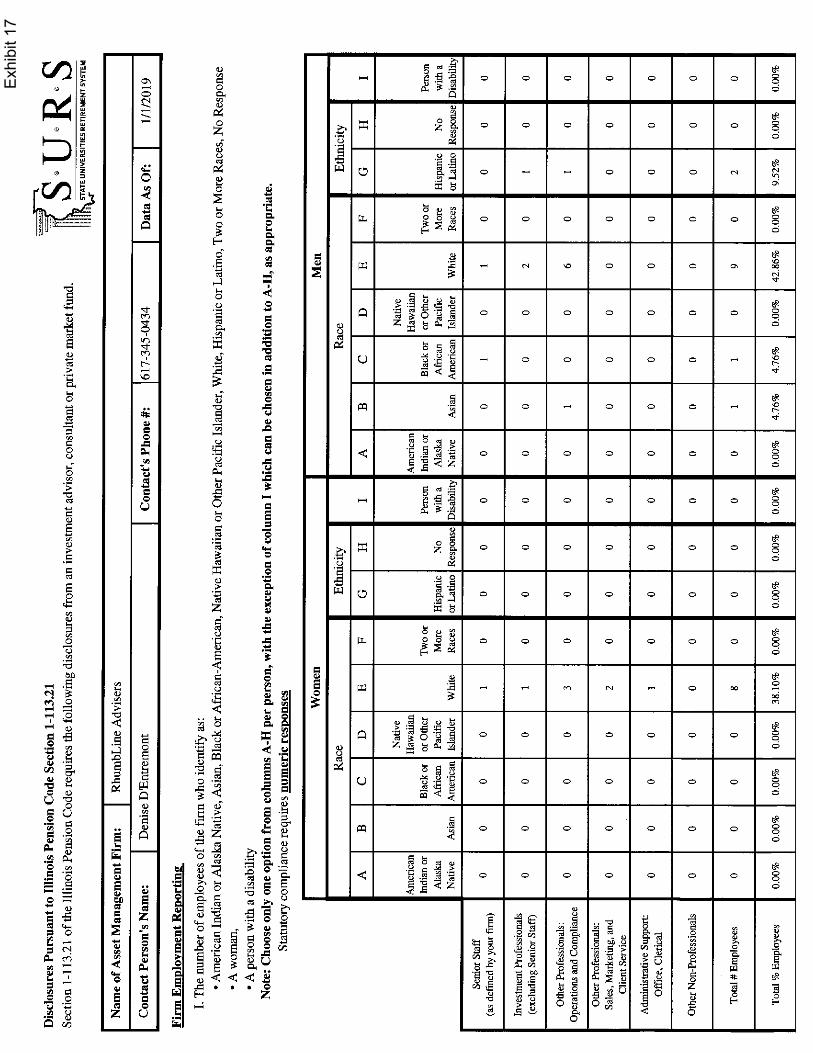
Exhi
bit 1
7

Exhi
bit 1
7

To: Investment Committee From: Douglas C. Wesley, CFA Date: August 22, 2019 Subject: Review of Procurement Policy The Investment Procurement Policy (Policy) was initially approved in March 2018. While working with Callan to develop their procurement process some minor clarifications were identified and approved in March 2019. More substantive edits were initially discussed at the Board Retreat in May 2019 and are reflected in the attached red-line Policy. Summary of Key Revisions Although several areas of the Policy underwent minor change, staff believes the revisions to the following areas are more significant and merit mention:
• Section 3 – Applicability of RFP Procedures • Section 4 - Procurement Procedures and Schedule • Section 6 - Procurement Requirements for Recommendations by a Specialty Consultant
Section 3 – Applicability of RFP Procedures The edit to section 3 was made to capture each of the procurement exceptions consistent with the Illinois Pension Code, specifically 40 ILCS 5/1-113.14(b). Section 4 - Procurement Procedures and Schedule Changes in this section allow staff to draft and issue RFPs for mandates included in the strategic allocation and, consistent with current practice, provide periodic search updates in the Investment Committee materials. The Board will continue to approve the hiring of investment managers recommended by staff and consultant. Section 6 - Procurement Requirements for Recommendations by a Specialty Consultant Changes would allow staff to authorize Specialty Consultant recommendations for commitments of $50 million or less with a report to the Investment Committee. Changes would also not require presentations to the Investment Committee from General Partners of follow-on funds previously approved by the Board. Commitments to new General Partners exceeding $50 million will require presentations to the Investment Committee. Conclusion and Recommendation Staff recommends that the revised Investment Procurement Policy be approved, as presented.
Exhibit 18

INVESTMENT PROCUREMENT POLICY
Amended: March 8September 13, 2019
Exhibit 19

1
1. Introduction This policy addresses the general procedures of the State Universities Retirement System (“SURS”) in soliciting bids and surveying the market for investment advisers, consultants and other iInvestment sServices (the “Policy”). The selection and appointment of firms to provide advisory, consulting and other iInvestment sServices by the Board shall be made and awarded in accordance with the Illinois Pension Code (the “Code”) and all other relevant authority under the Illinois Compiled Statutes. 2. Definitions “Board” means the Board of Trustees of SURS. “Consultant” means any person or entity retained or employed by the Board to make recommendations in developing an investment strategy, assist with finding appropriate investment advisers or monitor the Board’s investments. “Consultant” does not include non-investment related professionals or professionals offering services that are not directly related to the investment of assets, such as legal counsel, actuary, proxy-voting services, services used to track compliance with legal standards and investment in fund of funds where the Board has no direct contractual relationship with the investment advisers or partnerships. A Consultant must be registered as an investment adviser under the federal Investment Advisers Act of 1940 or as a bank, as defined in the federal Investment Advisers Act of 1940. Included in the definition of a Consultant is a “Specialty Consultant”. A “Specialty Consultant” means a Consultant selected by the Board pursuant to a Request for Proposal (“RFP”) process that specializes in one or more investment areas of expertise. “Chief Procurement Officer” is an individual designated by SURS to oversee and monitor the procurement process consistent with the requirements of this Policy, the Code and all other relevant authority under the Illinois Compiled Statutes. “Expenditure” means any investment, expense, or cost relating to Investment Services. “Investment Adviser” is any person or firm who: (1) is a fiduciary appointed by the Board in accordance with Section 1-109.1 of the Code; (2) has the power to manage, acquire or dispose of any asset of SURS; (3) has acknowledged in writing that he or she is a fiduciary with respect to SURS; (4) is registered as an investment adviser under the federal Investment Advisers Act of 1940 or as a bank, as defined in the federal Investment Advisers Act of 1940. “Investment Committee” means a duly authorized committee of the Board formed to assist the Board in the development of investment strategies and the review of prospective investments with the goal of supporting the Board in the prudent investment of SURS’ assets. The “Investment Committee Chair” shall mean the Chairman of the Investment Committee duly appointed pursuant to the Board’s by-laws and Investment Committee Charter. “Investment Services” means services provided by an Investment Adviser or a Consultant pursuant to Section 1-113.14 of the Code.
Exhibit 19

2
“Quiet Period” means a period of time during which a RFP for a potential Consultant, custodian, Investment Adviser or vendor is underway and during which a set of guidelines governs any communication by the Board, Consultant or Staff with such parties. “RFP” means a request for proposal. “SURS” has the meaning given in Section 1 (Introduction). “Staff” means the investment staff at SURS, including the designated Chief Investment Officer (the “CIO”). 3. Applicability of RFP Procedures a. General applicability. The RFP procedures in this Policy apply to all Expenditures, including but not limited to, hiring of Consultants, Investment Advisers, custodians, proxy voting service providers and defined contribution service providers other than (i) sole source procurements (ii) emergency procurements, and (iii) at the discretion of the Board, contracts that are nonrenewable and one year or less in duration, so long as the contract has a value of less than $20,000. All exceptions granted under this section must be published on the SURS web site, shall name the person authorizing the procurement, and shall include a brief explanation of the reason for the exception. b. Additional Expenditures Covered by this Policy Unless specifically waived by the Board, effective July 1, 2018, the following Expenditures shall be subject to this Policy as proscribed below:
i. fund-of-funds investments shall be subject to the procurement requirements of this Policy at least once every five years; and
ii. follow-on funds that are managed in distinct entities from prior investments shall be subject to the procurement requirements of this Policy. For the avoidance of doubt, any follow-on fund shall not be subject to the procurement requirements of this Policy if such follow-on fund is recommended by a Specialty Consultant consistent withshall be subject to Section 3(c)6 of this Policy.
Exhibit 19

3
4. Procurement Procedures and Schedule The following are the general procurement actions that shall be taken by SURS when considering Expenditures. SURS shall develop and use uniform documents for the solicitation, review and acceptances of all Investment Services. References to actions by the Staff in this Policy shall mean the Staff in consultation with any applicable Consultant retained by SURS.
Prior to the Issuance of a RFP
a. Staff is authorized to issue RFPs as necessary to implement, or maintain, the strategic policy targets established by the Board.
a.b. Prior to issuance of a RFP, Staff shall compile a list of potential respondents for such Expenditure. Staff is expected to consult with third parties and potential respondents prior to the proposed RFP as necessary to address any inquiries and encourage participation in the procurement process. Members of the Board may communicate with third parties and potential respondents consistent with applicable law and applicable policy.
b.c. Following initial due diligence by Staff and/or members of the Board, Staff shall prepare the RFP for the Expenditure. The RFP shall contain all information statutorily required, as well as such information as necessary for, or related to, any potential Expenditure. Staff shall provide a form of the RFP, specifically including a list of questions to be included in the RFP, to the Investment Committee or the Board, as may be applicable. The Investment Committee/Board shall recommend or approve the issuance of the RFP; provided, however, that the Investment Committee/Board may conclude that the issuance of the RFP is not in the best interest of SURS and may decline to approve its issuance. Staff shall also provide the Investment Committee with a tentative time-line for all actions relating to the RFP. Such time-line shall include, but not be limited to, the RFP issuance date, the date all responses are due and the date of the expected final decision. The Quiet Period is initiated with the approval to issuance of an RFP.
c. Staff, in consultation with the Board, shall establish a date on which a formal RFP shall be publicly announced following approval of the RFP by the Board. In general, such date shall be established not less than ten (10) days or more than thirty (30) days following the Board’s formal approval of the RFP. Following Approval of the RFP
d. At a minimum, Staff shall post the RFP on the SURS website, advertise the RFP in a nationally circulated investment publication and any other publication deemed appropriate by Staff or as required by law. Staff is expected tomay: (i) contact a reasonable number of potential respondents in order to notify them of the issuance of the RFP and (ii) disseminate such RFP to a reasonable number of potential respondents.
Exhibit 19

4
e. The RFP shall provide that questions regarding the solicitation shall be submitted in writing by respondents to the designated point of contact and by the date stated in the RFP. SURS shall post responses to all questions on its website.
f.e. The deadline for submission of proposals shall be not less than fourteen (14) days following the posting of the RFP. RFP responses received by the deadline stated in the RFP shall be recorded and receipted by Staff. Staff shall review and analyze the responses to the RFP as expeditiously as reasonably practical within the RFP specifications. Staff shall verify information submitted and resolve or confirm any discrepancies. Staff will eliminate any response that fails to conform to the minimum qualifications outlined in the RFP. Staff will periodically throughout the procurement process prepare an analysis outlining how all RFP responses conform to these categories and provide an update with respect to the RFP process and includemake such report in Investment Committee materials available to Members of the Board for review.
g.f. Staff and/or Consultants shall meet or conduct phone interviews with representatives of the respondents selected as semi-finalists by Staff and/or Consultants to obtain an independent assessment of the firm’s capabilities.
h.g.Following the interview process, Staff and/or Consultants shall identify one or more qualified firms and to recommend to the Investment Committee one or more RFP respondents, with a goal of presenting no less than three qualified firms, for possible engagement by the Board. If in any case an “emerging investment manager” (as such term is defined in the Code) submits a RFP response that meets the requirements for a specific search then the “emerging investment manager” shall receive an invitation to present to the Investment Committee/Board. In the case where multiple “emerging investment managers” meet the criteria of the search, the most qualified firm or firms shall be selected to present to the Investment Committee/Board.
i.h. Following Staff’s and/or Consultant’s recommendation, the Investment Committee shall interview the respondents recommended by Staff or direct that additional respondents be invited for interview. The Investment Committee shall approve a recommendation to the Board for selection of a respondent for the Expenditure. The Investment Committee may, in good faith, decline to recommend any respondent following such interviews. The Investment Committee may recommend a recommencement of the RFP process for such potential Expenditure, or terminate the search entirely.
j.i. The Board may approve or disapprove the recommendation of the Investment Committee with respect to any proposed Expenditure. If practical, at the time of selection the Board shall identify a second-choice respondent in the event that the Staff cannot negotiate terms with the first-choice respondent that are, in the opinion of Staff and the Board, prudent and in the best interests of SURS and consistent with the requirements of the Code.
k.j. Staff and/or Consultants shall, in conjunction with its legal counsel, negotiate the contract with the first-choiceapproved respondent. If required by the Code, such contract must at a minimum contain the specific requirements found in Section 1-113.14 of the Code. Staff
Exhibit 19

5
shall promptly provide a report to the Investment Committee in the event Staff is unable to negotiate contract terms with the first-choiceapproved respondent that meet the requirements of the Code before engaging in negotiations with the second-choice respondent. The Quiet Period concludes with the completion of successful contract negotiations.
l.k. SURS shall post the name(s) of the successful respondent(s) on SURS’ web site, along
with a disclosure including the total amount applicable to the contract, the total fees paid or to be paid, and a description of the factors that contributed to the selection of the respondent consistent with the requirements of the Code.
5. Other RFP Requirements
a. The RFP process shall comply with all relevant sections of State and Federal law, including the Code and applicable case law.
b. It shall be the goal for Staff to recommend at least three respondents to the Investment Committee/Board for interviews by the Investment Committee/Board. If in any case an “emerging investment manager” (as such term is defined in the Code) submits a RFP response that meets the requirements for a specific search then the “emerging investment manager” shall receive an invitation to present to the Investment Committee/Board. In the case where multiple “emerging investment managers” meet the criteria of the search, the most qualified firm or firms shall be selected to present to the Investment Committee/Board.
c.b. Fees are an important factor when evaluating procurement for Investment Services and will be given full consideration in the procurement process. If a recommended RFP respondent’s fees are materially different from other respondents presenting to the Investment Committee, Staff will include the rationale for considering the higher cost option in supporting materials provided to the Investment Committee.
d.c. SURS shall not enter into a contract with a Consultant that exceeds five (5) years in duration, unless approved by the Board and consistent with the requirements of the Code. No contract to provide consulting services may be renewed or extended. At the end of the term of a contract, however, the Consultant is eligible to compete for a new contract as permitted in the Code.
e.d. Any report, documentation, or list compiled or received by Staff or a Consultant relating to a RFP or Expenditure shall be promptly made available to the Board, or an individual Board member, upon request.
f.e. Nothing in this Policy is meant to prohibit or discourage any Board Member from being involved in any part of the procurement process; provided that such Board Member provides prior notice of his/her intent to participate to Staff in order to ensure such participation is in compliance with applicable law. It is expected that Staff and consultants
Exhibit 19

6
shall each provide independent recommendations to the Board regarding all such procurements.
g.f. No Board member, SURS employee or SURS vendor shall knowingly cause or advise the Board to engage in an investment transaction with a vendor when the Board member, SURS employee, SURS consultant or any of their spouses (i) has any direct interest in the income, gains or profits of the investment vendor through which the investment transaction is made or (ii) has a relationship with that investment vendor that would result in a pecuniary benefit to the Board member, SURS employee or SURS vendor or any of their spouses as a result of the investment transaction. References to the “investment vendor” include an employee or agent of such firm who has greater than 7.5% ownership of the consulting firm.
h.g.Quiet Period Policy 1. A Quiet Period will commence upon Board authorization to the issuance of an RFP
and end once a selection has been made by the Board and the completion of successful contract negotiations with a respondent;
2. Initiation, continuation and conclusion of the Quiet Period shall be publicly communicated to prevent inadvertent violations;
3. All Board members, and Staff other than those directly involved in the search or the Chief Procurement Officer or their designee, shall refrain from communicating with respondents regarding any product or service related to the search in process. All Board members and Staff shall refrain from accepting meals, travel, hotel, or other value from such respondents;
4. Throughout the Quiet Period, if any Board member is contacted by a respondent, the Board member shall refer such party to the Chief Procurement Officer;
5. All authority related to the search process shall be exercised solely by the Investment Committee or Board as a whole, and not by individual Board members;
6. The Quiet Period does not prevent Board approved due diligence, client conference attendance or communications with an existing vendor; provided, however, that discussions related to the procurement and pending selection shall be avoided during those activities;
7. The provisions of this Policy shall apply throughout the Quiet Period and shall be communicated to respondents in conjunction with any search; and
8. A respondent may be disqualified from a search process for a violation of the Quiet Period or any portion of this Policy.
6. Procurement Requirements for Recommendations by a Specialty Consultant The Board will not be required to fulfill the RFP procurement requirements of this Policy for a follow-on fund or any investment if the follow-on fund or investment is specifically recommended by a Specialty Consultant and if such Specialty Consultant has adhered to the procurement requirements specifically outlined in this Policy for a Specialty Consultant in formulating the recommendation.
Exhibit 19

7
The following are the general procurement requirements for any investment recommended by a Specialty Consultant hired by the Board; provided, however that any procurement or due diligence requirement in the contract between such Specialty Consultant and the Board and any specific directive from the Board to such Specialty Consultant regarding a proposed investment takes precedence over the general requirements of this Section.
a. In recommending any investment to the Investment Committee/Board for consideration, the Specialty Consultant shall develop and utilize a consistent and uniform competitive process for analyzing and vetting potential investments that shall be substantially similar to the competitive process outlined in Article 35 of the Illinois Procurement Code, if required by the Code.
b. The Specialty Consultant shall ensure that any potential investment and its terms are in compliance with the Code and any applicable law, regulation or directive of the Board, including SURS’ Investment Policy and approved asset allocation.
c. The Specialty Consultant shall conduct such competitive process in a transparent and streamlined manner to ensure the Specialty Consultant is recommending potential investments to the Board in a timely manner.
i. If in any case an “emerging investment manager” (as such term is defined in the Code) submits a response that meets the requirements for a specific search then the “emerging investment manager” shall receive an invitation to present to the Investment Committee/Board. In the case where multiple “emerging investment managers” meet the criteria of the search, the most qualified firm or firms shall be selected to present to the Investment Committee/Board.
d. In recommending any investment to the Investment Committee/Board, the Specialty Consultant shall prepare a detailed report for the Investment Committee/Board outlining the utilized competitive process and its due diligence of the potential investment. As part of the recommendation process the Specialty Consultant and Staff will secure and review all statutorily required disclosures and provide those disclosures to the Investment Committee/Board for consideration prior to taking action on the recommendation. Representatives from the General Partner must present to the Investment Committee/Board for initial commitments exceeding $50 million. Specialty Consultant recommendations for commitments of $50 million or less can be authorized by Staff with a report to the Investment Committee. The Specialty Consultant can recommend a follow-on fund commitment. The General Partner of any follow-on fund previously recommended by the Specialty Consultant and approved by the Board will not be required to present to the Investment Committee.
e. The Specialty Consultant should endeavor to recommend one or more qualified firms to the Investment Committee/Board on a quarterly basis, if consistent with SURS’ Investment Policy, asset class pacing plan and approved asset allocation.
Exhibit 19

8
Initially adopted March 9, 2018, Revised March 8, 2019
Exhibit 19