
Greystone Investment Committee Quarterly Report€¦ · James Menzies Investment Director Greystone...
14
Greystone Investment Committee Quarterly Report July 2019 Second quarter 2019
Transcript of Greystone Investment Committee Quarterly Report€¦ · James Menzies Investment Director Greystone...

Greystone Investment Committee
Quarterly Report
July 2019
Second quarter 2019

Conservative Managed Fund R Acc
IA Mixed Investment 0-35% Shares NR
Cautious Managed Fund R Acc
IA Mixed Investment 20-60% Shares NR
Balanced Managed Fund R Acc
IA Mixed Investment 40-85% Shares NR
Global Growth Fund R Acc
IA Global NR
2.81 2.412.78 2.70
4.63
3.78
6.265.80
0
2
4
6
8
2019 Q2
All performance in this report is based upon R share class accumulation units denominated in GBP. Investment Association (IA) sector NR refers to Nominal Returns. All performance data is sourced from Thomson Reuters Lipper for Investment Management and compiled to 30.06.2019 unless stated otherwise. The Conservative Managed Fund achieved a conservative allocation and assumed the name Conservative on 01.09.2012. The Cautious Managed Fund changed mandate on 24.07.2009. The Balanced Managed Fund changed mandate on 01.09.2010. The Global Growth Fund launched on 05.12.2005. Past, simulated past or future projected performance is not a reliable indicator of future performance and may not be repeated.
Quarterly Commentary 1
Second Quarter Review
We are pleased to send you our quarterly report for the Greystone funds. Portfolio performance and activity is discussed in our fund manager review, whilst global events are covered in the economic and market commentary.
The Investment Committee rotate between asset classes and incorporate high levels of portfolio diversification to help generate consistent returns.
Our strategic investment decisions help to reduce fluctuations in performance and protect the value of your investments.
Please see below a snapshot of our funds’ performance for Q2 2019 versus their respective Investment Association (IA) sector averages.
July 2019
Source: Thomson Reuters Lipper for Investment Management.
Q2 2019 Performance %
James MenziesInvestment Director Greystone Investment Committee
James JacksonHead of Investment ResearchGreystone Investment Committee
Christopher JeavonsInvestment AnalystGreystone Investment Committee

0
5
10
15
20
25
30
35
Sep/12 Sep/14 Sep/16 Sep/18
All performance in this report is based upon R share class accumulation units denominated in GBP. All performance data is sourced from Thomson Reuters Lipper for Investment Management and compiled to 30.06.2019. All Investment Association (IA) sector performance is Nominal Return (NR). The Conservative Managed Fund achieved a conservative allocation and assumed the name Conservative on 01.09.2012. The above are the views and opinions of the Greystone Investment Committee and are correct at the time of writing. Past, simulated past or future projected performance is not a reliable indicator of future performance and may not be repeated.
Fund Manager Commentary
Conservative Managed Fund
July 2019
Multi-asset Portfolio
Performance Summary
The fund rose 2.81% over the second quarter versus the Investment Association (IA) Mixed Investment 0-35% Shares sector average2.41% and the IA Standard Money Market 0.19%.
Since the fund’s re-launch on 1st September 2012 it has delivered 31.92% versus the IA sector average 31.20% and IA Standard Money Market 2.15%. The fund’s share price as at 28th June 2019 was; 127.47p (R share class accumulation units).
The fund continues to offer investors low risk access to investment markets and provides the opportunity to outperform inflation and cash rates over the course of an economic cycle.
Quarterly Commentary 2
Fund Objective
The fund’s objective is capital growth with outperformance of its sector average and cash. We aim to achieve this with less than a third of equity market risk. The fund holds a minimum of 45% investment grade bonds and between 0% - 35% UK and overseas shares.
We target 3% - 6% annualised growth over the recommended investment time horizon of at least three years.
Performance %
Cash 10%Fixed Interest 42%Allianz Short Duration Global Real Estate BondButler Credit OpportunitiesiShares UK Gilts 0-5 yrsRubrics Global CreditSanlam Strategic BondVanguard Global Bond Index Vanguard Global Short-Term Bond
Equity 21%TB Evenlode IncomeCFP SDL UK BuffettologyMI Chelverton UK Equity GrowthPolar Capital UK Absolute EquityLF Miton European OpportunitiesPolen Capital Focus U.S. GrowthHermes Global Emerging Markets
Alternatives 27%Carmignac Long-Short European Equity HedgedLazard Global Listed InfrastructureVT Gravis UK Infrastructure IncomeAberdeen UK Property FeederAviva Investors UK Property FeederLegal & General UK Property FeederStandard Life UK Property FeederThreadneedle UK Property FeederPolar Capital Global Insurance
Holdings
-5
0
5
10
2019YTD
2018 2017 2016 2015 2014 2013
Conservative Managed Fund R AccIA Mixed Investment 0-35% Shares NR
Source: Thomson Reuters Lipper for Investment Management.(Key applies to both charts).
Calendar Year Performance %

-24% -16% -8% 0% 8% 16% 24%
Alternatives
Emerging Markets Equity
Japanese Equity
Asian Equity
North American Equity
European Equity
UK Equity
Fixed Interest
Cash
OverweightUnderweight
Fund Manager Commentary
Conservative Managed Fund
July 2019
10%
42%
12%3%
3%
3%
27%
Cash
Fixed Interest
UK Equity
European Equity
North American Equity
Emerging Markets Equity
Alternatives
Asset Allocations
Please see below the current asset allocation for the Conservative Managed fund and the relative position versus the IA sector average.
Current Asset Allocation
Source: Greystone Investment Committee.
Quarterly Commentary 3
All data is sourced from the Greystone Investment Committee and Thomson Reuters Lipper for Investment Management, for fund asset allocation. Data compiled to 30.06.2019. The above are the views and opinions of the Greystone Investment Committee and are correct at the time of writing. Past, simulated past or future projected performance is not a reliable indicator of future performance and may not be repeated.
Relative Positioning versus IA Mixed Investment 0-35% Shares sector average
Source: Greystone Investment Committee and Lipper.
Fund Review
The fund outperformed sector average peers in Q2 and rose in value. UK and international equities drove performance, followed by infrastructure and fixed interest. Physical property and absolute return were mixed during the quarter.
Since December 2015 the US Federal Reserve (Fed) has raised interest rates nine times, driven by a robust US economy, strong enough to weather tighter monetary conditions. The Fed shifted to a more dovish stance at the end of 2018, citing a willingness to be patient with future rises, providing more accommodative policy.
Four times a year, policymakers at the Federal Open Market Committee (FOMC) submit projections about where they believe interest rates are headed. The result is the Fed’s ‘dot plots’, which now suggest no rate rises in 2019 and a possible rate cut from the Central Bank in 2020.
Changes in global monetary policy have the potential to impact all asset classes. Bonds with a longer time to maturity are particularly sensitive to both interest rate movements and market expectations on the direction of travel.
Against this backdrop, bond managers with greater sensitivity to interest rates fared better than those with less, as yields continued to fall and bond values rose. Our managers with shorter duration positioning struggled over the period. European high yield delivered for a flexible credit manager, whilst effective duration management and US Dollar strength, meant our sovereign debt fund was the standout performer.
Within UK equities, long positions in materials and consumer staples, coupled with short positions in index futures and industrials, delivered for a long-short manager. An automotive systems provider and games designer boosted performance for our multi-cap holding, whilst a data analytics business and beverages manufacturer helped a large-cap income fund.
All our international equity managers rose in value during Q2. Europe led the way up, followed by North America and emerging markets. Norwegian financials and a Swiss logistics company meant our European multi-cap growth manager was the top performer. Indian financials and an electronics company buoyed returns for our emerging markets holding, whilst technology and consumer discretionary stocks drove returns for a US large-cap fund.
Within alternatives, short positions in consumer goods and services, coupled with long positions in German manufacturers and healthcare, pushed our European long-short specialist into the red.
Our commercial property component was flat over the period. South East office space and retail warehouses powered returns for the top real estate fund, whilst industrial warehouses and an out-of-town shopping centre in the Midlands detracted for the laggard.
Listed infrastructure had another solid quarter. Italian and US utilities delivered for our global manager, whilst solar energy and wind farms boosted returns for a UK focused income specialist.
Cash 3%Fixed Interest 27%Ashmore Emerging Markets Short DurationCapital International Global High Income OpportunitiesRoyal London Global Bond OpportunitiesRoyal London Short Duration Global High Yield BondSanlam Strategic Bond
Equity 49%Eden Tree Higher IncomeLF Gresham House UK Multi-Cap IncomeLF Miton UK Multi-Cap IncomeMajedie UK IncomeMan GLG UK IncomeSchroder Income MaximiserTB Evenlode Income Montanaro European IncomePrusik Asian Equity IncomeArtemis US Extended AlphaArtemis Global IncomeLazard Global Equity FranchiseSarasin Global Higher Dividend
Alternatives 21%LF Ruffer Total ReturnLazard Global Listed InfrastructureVT Gravis UK Infrastructure IncomeAberdeen UK Property FeederAviva Investors UK Property FeederBMO UK Property FeederLegal & General UK Property FeederStandard Life UK Property FeederThreadneedle UK Property Feeder
0
25
50
75
100
Jul/09 Jul/11 Jul/13 Jul/15 Jul/17
All performance in this report is based upon R share class accumulation units denominated in GBP. All performance data is sourced from Thomson Reuters Lipper for Investment Management and compiled to 30.06.2019. All Investment Association (IA) sector performance is Nominal Return (NR). Cautious Managed Fund changed mandate on 24.07.2009. Natural yield data sourced from Thomson Reuters Lipper for Investment Management and Valu-Trac, and compiled to 29.03.2019. The above are the views and opinions of the Greystone Investment Committee and are correct at the time of writing. Past, simulated past or future projected performance is not a reliable indicator of future performance and may not be repeated.
Fund Manager Commentary
Cautious Managed Fund
July 2019
Quarterly Commentary 4
Fund Objective
The fund’s objective is high income generation and capital growth along with outperformance of the sector average. We aim to achieve this with less than half of equity market risk. The fund holds a minimum of 30% fixed interest and between 20% - 60% UK and overseas shares. We target 4% - 7% annualised growth over the recommended investment time horizon of at least five years.
Performance %
Holdings
-8
-4
0
4
8
12
2019YTD
2018 2017 2016 2015 2014 2013
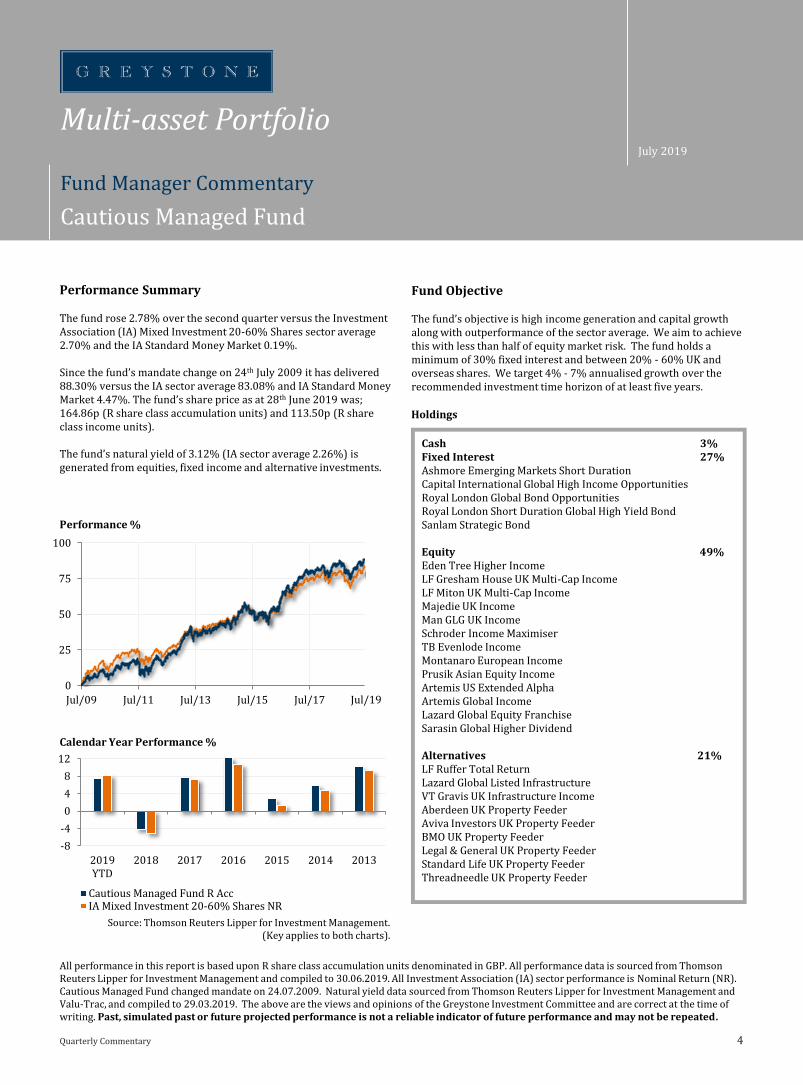
Cautious Managed Fund R AccIA Mixed Investment 20-60% Shares NR
Multi-asset Portfolio
Performance Summary
The fund rose 2.78% over the second quarter versus the Investment Association (IA) Mixed Investment 20-60% Shares sector average 2.70% and the IA Standard Money Market 0.19%.
Since the fund’s mandate change on 24th July 2009 it has delivered 88.30% versus the IA sector average 83.08% and IA Standard Money Market 4.47%. The fund’s share price as at 28th June 2019 was; 164.86p (R share class accumulation units) and 113.50p (R share class income units).
The fund’s natural yield of 3.12% (IA sector average 2.26%) is generated from equities, fixed income and alternative investments.
Source: Thomson Reuters Lipper for Investment Management.(Key applies to both charts).
Calendar Year Performance %
Jul/19
3%
27%
27%
7%
7%
8%
21%
Cash
Fixed Interest
UK Equity
European Equity
North American Equity
Asian Equity
Alternatives
Underweight
Fund Manager Commentary
Cautious Managed Fund
July 2019
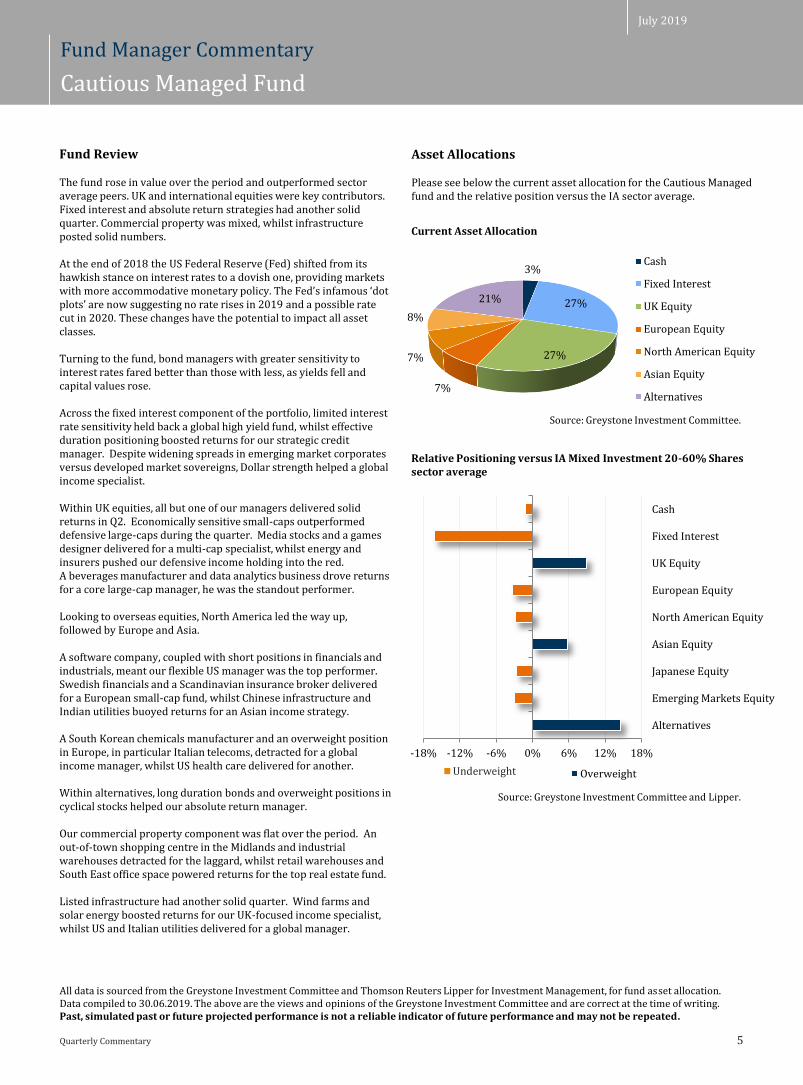
Asset Allocations
Please see below the current asset allocation for the Cautious Managed fund and the relative position versus the IA sector average.
Current Asset Allocation
Source: Greystone Investment Committee.
Quarterly Commentary 5
All data is sourced from the Greystone Investment Committee and Thomson Reuters Lipper for Investment Management, for fund asset allocation. Data compiled to 30.06.2019. The above are the views and opinions of the Greystone Investment Committee and are correct at the time of writing. Past, simulated past or future projected performance is not a reliable indicator of future performance and may not be repeated.
Relative Positioning versus IA Mixed Investment 20-60% Shares sector average
Source: Greystone Investment Committee and Lipper.
Fund Review
The fund rose in value over the period and outperformed sector average peers. UK and international equities were key contributors. Fixed interest and absolute return strategies had another solid quarter. Commercial property was mixed, whilst infrastructure posted solid numbers.
At the end of 2018 the US Federal Reserve (Fed) shifted from its hawkish stance on interest rates to a dovish one, providing markets with more accommodative monetary policy. The Fed’s infamous ‘dot plots’ are now suggesting no rate rises in 2019 and a possible rate cut in 2020. These changes have the potential to impact all asset classes.
Turning to the fund, bond managers with greater sensitivity to interest rates fared better than those with less, as yields fell and capital values rose.
Across the fixed interest component of the portfolio, limited interest rate sensitivity held back a global high yield fund, whilst effective duration positioning boosted returns for our strategic credit manager. Despite widening spreads in emerging market corporates versus developed market sovereigns, Dollar strength helped a global income specialist.
Within UK equities, all but one of our managers delivered solid returns in Q2. Economically sensitive small-caps outperformed defensive large-caps during the quarter. Media stocks and a games designer delivered for a multi-cap specialist, whilst energy and insurers pushed our defensive income holding into the red. A beverages manufacturer and data analytics business drove returns for a core large-cap manager, he was the standout performer.
Looking to overseas equities, North America led the way up, followed by Europe and Asia.
A software company, coupled with short positions in financials and industrials, meant our flexible US manager was the top performer. Swedish financials and a Scandinavian insurance broker delivered for a European small-cap fund, whilst Chinese infrastructure and Indian utilities buoyed returns for an Asian income strategy.
A South Korean chemicals manufacturer and an overweight position in Europe, in particular Italian telecoms, detracted for a global income manager, whilst US health care delivered for another.
Within alternatives, long duration bonds and overweight positions in cyclical stocks helped our absolute return manager.
Our commercial property component was flat over the period. An out-of-town shopping centre in the Midlands and industrial warehouses detracted for the laggard, whilst retail warehouses and South East office space powered returns for the top real estate fund.
Listed infrastructure had another solid quarter. Wind farms and solar energy boosted returns for our UK-focused income specialist, whilst US and Italian utilities delivered for a global manager.
-18% -12% -6% 0% 6% 12% 18%
Alternatives
Emerging Markets Equity
Japanese Equity
Asian Equity
North American Equity
European Equity
UK Equity
Fixed Interest
Cash
Overweight

-15
0
15
30
45
60
75
90
105
Sep/10 Sep/12 Sep/14 Sep/16 Sep/18
All performance in this report is based upon R share class accumulation units denominated in GBP. All performance data is sourced from Thomson Reuters Lipper for Investment Management and compiled to 30.06.2019. All Investment Association (IA) sector performance is Nominal Return (NR). Balanced Managed Fund changed mandate on 01.09.2010. The above are the views and opinions of the Greystone Investment Committee and are correct at the time of writing. Past, simulated past or future projected performance is not a reliable indicator of future performance and may not be repeated.
Fund Manager Commentary
Balanced Managed Fund
July 2019
Quarterly Commentary 6
Fund Objective
The fund’s objective is capital growth and outperformance of its sector average, with less risk than equity markets. The fund holds between 40% - 85% UK and overseas shares. We target 5% - 9% annualised growth over the recommended investment time horizon of at least seven years.
There is flexibility to rotate between asset classes which helps smooth returns and protect against volatility.
Performance %
Cash 3%Fixed Interest 15%Ashmore Emerging Markets Short DurationButler Credit OpportunitiesCapital International Global High Income OpportunitiesRoyal London Global Bond Opportunities
Equity 62%LF Miton UK Multi Cap IncomeMan GLG UK IncomeSchroder Income MaximiserTB Evenlode IncomeCFP SDL UK Buffettology Merian UK Dynamic EquityMI Chelverton UK Equity GrowthPolar Capital UK Absolute EquityJupiter EuropeanMontanaro European IncomeArtemis US Extended AlphaMajedie US EquityMerian North American EquityPolen Capital Focus U.S. GrowthHermes Asia ex Japan EquityPrusik Asian Equity IncomeHermes Global Emerging Markets
Alternatives 20%Carmignac Long-Short European Equity HedgedMerian Global Equity Absolute ReturnMerian UK Specialist EquityLazard Global Listed InfrastructureVT Gravis UK Infrastructure IncomePolar Capital Global Insurance
Holdings
-8
0
8
16
2019YTD
2018 2017 2016 2015 2014 2013
Balanced Managed Fund R AccIA Mixed Investment 40-85% Shares NR
Multi-asset Portfolio
Performance Summary
The fund rose 4.63% over the second quarter versus the Investment Association (IA) Mixed Investment 40-85% Shares sector average 3.78% and the IA Standard Money Market 0.19%.
Since the fund’s mandate change on 1st September 2010 it has delivered 102.76% versus the IA sector average 85.28% and IA Standard Money Market 3.05%. The fund’s share price as at 28th June 2019 was; 223.36p (R share class accumulation units) and 193.22p (R share class income units).
The fund continues to offer investors the ability to maximise capital growth whilst managing risk through a combination of bond, equity and alternative investments.
Source: Thomson Reuters Lipper for Investment Management.(Key applies to both charts).
Calendar Year Performance %

Underweight
-16% -8% 0% 8% 16%
Alternatives
Emerging Markets Equity
Japanese Equity
Asian Equity
North American Equity
European Equity
UK Equity
Fixed Interest
Cash
Overweight
Asset Allocations
Please see below the current asset allocation for the Balanced Managed fund and the relative position versus the IA sector average.
Fund Manager Commentary
Balanced Managed Fund
July 2019
3%
15%
31%
6%
13%
9%
3%20%
Cash
Fixed Interest
UK Equity
European Equity
North American Equity
Asian Equity
Emerging Markets Equity
Alternatives
Current Asset Allocation
Source: Greystone Investment Committee.
Quarterly Commentary 7
All data is sourced from the Greystone Investment Committee and Thomson Reuters Lipper for Investment Management, for fund asset allocation. Data compiled to 30.06.2019. The above are the views and opinions of the Greystone Investment Committee and are correct at the time of writing. Past, simulated past or future projected performance is not a reliable indicator of future performance and may not be repeated.
Relative Positioning versus IA Mixed Investment 40-85% Shares sector average
Source: Greystone Investment Committee and Lipper.
Fund Review
The fund outperformed sector average peers in Q2 and rose in value. UK and international equities drove performance. Fixed interest posted solid numbers, whilst alternative investment strategies delivered mixed returns.
Both fixed interest and equity markets performed well during the period. Bonds, particularly those with greater sensitivity to interest rate movements, rallied as the US Federal Reserve signalled a willingness to cut rates. Equity markets were strong amid more accommodative monetary policy, despite concerns over slowing global economic growth and US-China trade relations.
Within the fixed interest component, European high yield delivered for our flexible credit manager, whilst Dollar strength and US corporate debt helped a global high yield fund.
Turning to UK equities, defensive large-caps lagged behind more economically sensitive small-cap stocks, however both investment styles were positive during the quarter. A games designer and an automotive systems provider drove performance for our multi-cap fund, whilst a beverages manufacturer and data analytics business helped a large-cap income manager. Insurers and energy stocks pushed a defensive income holding into the red, whilst long positions in consumer staples and materials, coupled with short positions in index futures and industrials, delivered for a long-short manager.
Looking to overseas equities, Europe led the way up, followed by North America, emerging markets and Asia.
On the continent, large-cap growth outperformed small-cap value. Danish pharmaceuticals and German industrials meant our core European manager was the standout performer. A Scandinavian insurance broker and Swedish financials delivered for a small-cap holding.
In the US, a software company, coupled with short positions in financials and industrials, drove returns for our flexible manager. Overweight positions in technology and healthcare meant a large-cap fund was the laggard, whilst insurance and reinsurance powered returns for a sector specialist.
In Asia, Taiwanese semiconductors and a South Korean steel producer pushed a growth strategy into the red, whilst Indian utilities and Chinese infrastructure helped our Asian income manager to outperform. An electronics company and Indian financials buoyed returns for an emerging markets holding.
Within the alternatives component, our global equity market neutral manager struggled with increased levels of market volatility. Long positions in manufacturers, coupled with short positions in consumer goods and services, detracted for an absolute return fund.
Listed infrastructure had another solid quarter. Italian and US utilities delivered for our global manager, whilst solar energy and wind farms boosted returns for a UK-focused income specialist.

-50
0
50
100
150
200
250
Dec/05 Dec/08 Dec/11 Dec/14 Dec/17
All performance in this report is based upon R share class accumulation units denominated in GBP. All performance data is sourced from Thomson Reuters Lipper for Investment Management and compiled to 30.06.2019. All Investment Association (IA) sector performance is Nominal Return (NR). Global Growth Fund launched on 05.12.2005. The above are the views and opinions of the Greystone Investment Committee and are correct at the time of writing. Past, simulated past or future projected performance is not a reliable indicator of future performance and may not be repeated.
Fund Manager Commentary
Global Growth Fund
July 2019
Quarterly Commentary 8
Fund Objective
The fund’s objective is capital growth and outperformance of its sector average, with less risk than global equity markets. At least 80% of the fund will be held in overseas shares.
We target 6% - 10% annualised growth over the recommended investment time horizon of at least ten years.
Performance %
Cash 2%Equity 93%CFP SDL UK BuffettologyMI Chelverton UK Equity GrowthPolar Capital UK Absolute EquityArtemis US Extended AlphaBaillie Gifford AmericanBMO North AmericanFidelity American Special SituationsMajedie US EquityMerian North American EquityPolen Capital Focus U.S. GrowthSchroder US Smaller CompaniesVanguard US Equity IndexBlackRock European DynamicCarmignac Long-Short European EquityJupiter EuropeanLF Miton European OpportunitiesMontanaro European IncomeMan GLG Japan CoreAlphaMorant Wright SakuraHermes Asia ex Japan EquityPrusik Asian Equity IncomeHermes Global Emerging Markets
Alternatives 5%Polar Capital Global Insurance
Holdings
-10
0
10
20
2019YTD
2018 2017 2016 2015 2014 2013
Global Growth Fund R Acc IA Global NR
Source: Thomson Reuters Lipper for Investment Management.(Key applies to both charts).
Global Equity Portfolio
Performance Summary
The fund rose 6.26% over the second quarter versus the Investment Association (IA) Global sector average 5.80% and the IA Standard Money Market 0.19%.
Since the fund launched on 5th December 2005 it has delivered 237.22% outperforming the IA sector average 179.83% and IA Standard Money Market 13.29%. The fund’s share price as at 28th
June 2019 was; 337.22p (R share class accumulation units).
The fund continues to offer investors the potential for high levels of capital growth from geographically diverse investments across more than 30 countries worldwide.
Calendar Year Performance %
The Global Growth fund has outperformed its benchmark in eleven out of the past thirteen calendar years. (Source: Thomson Reuters Lipper for Investment Management).

Underweight
Fund Manager Commentary
Global Growth Fund
July 2019
2% 9%
45%15%
8%
10%6%
5%Cash
UK Equity
North American Equity
European Equity
Japanese Equity
Asian Equity
Emerging Markets Equity
Alternatives
Asset Allocations
Please see below the current asset allocation for the Global Growth fund and the relative position versus the IA sector average.
Current Asset Allocation
Source: Greystone Investment Committee.
Quarterly Commentary 9
All data is sourced from the Greystone Investment Committee and Thomson Reuters Lipper for Investment Management, for fund asset allocation. Data compiled to 30.06.2019. The above are the views and opinions of the Greystone Investment Committee and are correct at the time of writing. Past, simulated past or future projected performance is not a reliable indicator of future performance and may not be repeated.
Relative Positioning versus IA Global sector average
Source: Greystone Investment Committee and Lipper.
Fund Review
The fund rose in value during the second quarter and outperformed sector average peers. UK equities led the way up, followed by Europe, North America, emerging markets and Japan. Asian equities lagged over the period.
Despite continuing worries over the outlook for global economic growth and US-China trade war uncertainty, equity markets responded well to more accommodative monetary policy. The US Federal Reserve signalled a willingness to consider future rate cuts, whilst European Central Bank President Mario Draghi reiterated his “do whatever it takes” stance on monetary stimulus.
Turning to the fund, all but two holdings delivered positive numbers, whilst five managers posted double-digit returns during the quarter.
Within UK equities, a games designer and automotive systems provider delivered for our multi-cap holding, whilst more domestically-focused support services and IT stocks powered our cyclically-positioned small-cap growth manager. Long positions in materials and consumer staples, coupled with short positions in index futures and industrials, buoyed returns for a long-short fund.
On the continent, European equities performed well. Large-cap growth did better than small-cap value. German industrials and Danish pharmaceuticals boosted performance for our core holding, whilst Swiss financials and a Scandinavian insurance broker helpedour European small-cap fund.
Short positions in consumer goods and services, coupled with long positions in healthcare and German manufacturers, held back our European long-short specialist.
Across the Atlantic, an overweight position in North American equities, combined with Dollar strength, benefitted the Global Growth fund. Exposure to insurance and reinsurance drove returns for a sector specialist, he was the standout performer over the period. Overweight positions in technology and healthcare meant a large-cap manager was the laggard, whilst a software company and short positions in financials delivered for our flexible US manager.
Over in Asia, Indian financials and an electronics company buoyed returns for our emerging markets holding.
Chinese infrastructure and Indian utilities helped an Asian income strategy, whilst Taiwanese semiconductors and a South Korean steel producer pushed our growth manager into the red.
In Japan, banks and car manufacturers detracted for our large-cap holding, whilst construction and insurance stocks helped a mid-cap fund. Yen strength contributed positively over the period for both managers.
-8% -4% 0% 4% 8%
Alternatives
Emerging Markets Equity
Japanese Equity
Asian Equity
European Equity
North American Equity
UK Equity
Fixed Interest
Cash
Overweight

In late Spring, the mood of the nation was lifted by the birth of royal baby, Archie Harrison Mountbatten-Windsor, son of the Duke and Duchess of Sussex. A photograph of the couple introducing their new born to the Queen was distributed around the world by Prince Harry, after he posted the family snap on Twitter.
Another keen tweeter, US President Donald J Trump, took to Twitter on 13th May to express his thoughts about the escalating trade spat with the world’s second largest economy; “China buys MUCH less from us than we buy from them, by almost 500 Billion Dollars, so we are in a fantastic position. Make your product at home in the USA and there is no Tariff. You can also buy from a non-Tariffed country instead of China. Many companies are leaving China.....”.
Trade tariffs and the tensions between the world’s two most powerful nations have been concerning policymakers and investors alike. Monetary and fiscal policy is being influenced by the fallout, as are the decisions and valuations investors are placing on stocks and bonds around the world.
Optimism had been growing that a trade deal would be agreed between Mr Trump and China’s President Xi. However, talks broke down after US negotiators alleged that the Chinese had backed out of a draft text that had previously been agreed, but China’s negotiators said America’s diplomats were making unreasonable demands. As a consequence the US increased tariffs on $200bln1 worth of Chinese exports from 10%1 to 25%1, covering goods such as car parts and microchips.
Despite the US President’s almost constant twitter narrative detailing ongoing negotiations, China’s leaders have remained relatively quiet. However, rhetoric was ratcheted up by a Chinese state broadcaster exhorting a more defiant nationalistic tone following the latest US hike in tariffs, “If you want to talk, our door is wide open,” said the presenter on a popular news programme, but he also added “If you want to fight, we’ll fight you to the end.”
Mr Trump tweeted on the same day, warning China not to retaliate and suggested it will only get worse. Despite this, an hour later China increased tariffs on $60bln1 worth of imports from America.
Shortly after that, US negotiators began the process of slapping 25%1
tariffs on all China’s exports to America, worth nearly $560bln1. In the tit-for-tat exchange, $180bln1 worth of US exports to China could be subject to similar import taxes.
Each side has agreed to a delay in implementing their respective tariffs for several weeks in an effort to give negotiators more time to try and head off the deadlock; much hope is being pinned on the outcome of the G20 talks in Japan at the end of June. In the near term though, even if a trade deal is agreed, it is unlikely to reduce tensions to any significant degree between the world’s only super power and its rapidly-rising rival.
Quarterly Commentary 10
“May you live in interesting times…”
Another source of Sino-US tension has been Huawei, a giant Chinese technology firm. Following the failure of trade talks, only a few days later President Trump signed executive orders blocking Huawei from involvement with America’s 5G mobile telephone networks. America has also pushed its allies (including the UK) to shun the firm for security reasons.
Trade tensions are weighing on the export-led Chinese economy; recent data indicated that retail sales grew at their slowest pace since 2003 in April, whilst industrial production expanded at 5.4%2, its slowest growth rate in a decade.
US economic growth and the stock market continue to power ahead, particularly after the change of stance from the Federal Reserve (Fed) who now seem to be firmly set on reducing interest rates this year. This ‘U’ turn is in contrast to only six months ago, whereby Fed Chairman, Jerome Powell, had pledged to raise rates 3 or 4 times in 2019. US consumers and investors have responded accordingly, house prices are up as is the stock market. However, questions remain with regards to the robustness of the housing market and valuations being placed on some consumer goods and technology stocks.
Pivoting to the Middle East, tensions with Iran are escalating. A US aircraft carrier strike group arrived in the Persian Gulf in early June, supported by B-52 bombers after threats from Iran triggered the US national security adviser John Bolton to say any attack on America or its allies “will be met with unrelenting force”.
Iranian President, Hassan Rouhani, has declared that Iran will no longer comply with the terms of the deal signed with President Obama and other world powers, whereby it agreed to strict limits on its nuclear enrichment programme in return for a relaxation of trade sanctions. The Iranians now look set to resume their slow progress towards the manufacture of a nuclear bomb.
Disruption in the Strait of Hormuz, a choke point between Iran on one side and the United Arab Emirates on the other, would usually lead to a jump in the oil price, but despite the rumble of war drums, the price per barrel of Brent crude is down 1%3 over the quarter, partly due to the ever increasing supply of North American shale oil. However during the quarter, the price of a barrel had at one point risen 8%3 and then subsequently fallen as much as 16%3.
It is likely that we will see further volatility in the oil price as tensions ramp up (a higher oil price is viewed as a tax on global growth for most of the world, apart from oil exporting nations).
Strangely, the attack in May on Saudi oil refineries, the bombing of two oil tankers and the shooting down of a US military drone in June, only resulted in a modest tick-up in the price of a barrel from the low reached during the quarter.
Investment Committee
Economic & Market Commentary
July 2019
The above are the views and opinions of the Greystone Investment Committee and are correct at the time of writing. All performance data compiled from Thomson Reuters Lipper for Investment Management, data correct to 30.06.2019. 1The Economist, 2The Financial Times, 3Alpha Terminal, 4BBC. Past, simulated past or future projected performance is not a reliable indicator of future performance and may not be repeated.
Investment Committee
Economic & Market Commentary
July 2019
Quarterly Commentary 11
Turning to more domestic matters, Theresa May finally threw in the towel and announced she would step down as Conservative Party Leader on 7th June. She will stay on as Prime Minister until a new leader and Prime Minister is found. An extensive list of candidates was quickly narrowed down to Boris Johnson and Jeremy Hunt. Mr Johnson is the odds-on favourite to be the next leader of the Tory party and the next Prime Minister. Boris has vowed to take the UK out of the EU on 31st October, but Parliament may still thwart his ambitions.
European Parliamentary elections results on 23rd May fast forwarded the departure date of Prime Minister May. The Conservative Party came fifth (44 MEPs), behind the Brexit Party (294 MEPs), Liberal Democrats (164 MEPs), Labour (104 MEPs) and the Greens (74 MEPs). Whomever is the next Prime Minister, the task at hand is an unenviable one, as the House of Commons arithmetic remains a tricky equation to resolve, whilst we have a hung parliament and a government propped up by the Democratic Unionist Party, that only offers support in a ‘Confidence and Supply’ capacity.
Over in Brussels, the wheels of bureaucracy continue to turn. Member states are jostling for position in order to get their man or woman into the top job, in the newly formed European Commission. Commissioners start work on 1st November, one day after the UK is scheduled to leave the European Union.
European Central Bank (ECB) President, Mario Draghi, has also been busy reassuring policymakers and investors that the bank will still “do whatever it takes” and that he was prepared to “use all instruments that are in the toolbox” to prop up the Eurozone. Mr Draghi also steps down in October. His replacement will have to deftly tip toe through a multitude of political and economic obstacles; a slowdown in trade is hitting the Euro-area’s economy, and the row between Italy and the Commission over public debt, risks unnerving investors. Market expectations of Eurozone inflation in five years’ time has drifted below the ECB’s 2% target. On 6th June Mr Draghi said the bank would keep interest rates low for the next year, and gave the clearest hint yet of further asset purchases.
Changes in monetary policy and fears surrounding investment returns, led to the German government selling 10 year sovereign debt for a yield of minus 0.242 per cent in June. Investors are willing to hold an asset that guarantees, if held to maturity, a negative return. We live in strange times.
It is no surprise then to suggest that bonds look expensive whilst (some) areas of the equity market look relatively cheap. We believe active managers, long since derided by passive investors, will have the opportunities to deliver solid outperformance. Although, this will only occur when global investors stop and reflect on the valuations being charged for perceived certainty of earnings growth of consumer goods companies and go-go technology stocks. This is most apparent in the US stock market, but also true in other geographies.
Across the pond, the feverish nature of the 2020 US presidential election is heating up. Donald Trump launched his re-election campaign at a rally in Orlando on 18th June. Florida is a highly competitive state to win in presidential elections and the state is regarded as one of the biggest electoral prizes among the swing states. Twenty thousand supporters packed into the Amway Centerin Orlando to hear the President announce how he was going to ‘Keep America Great’.
Domestic and international politics will influence investor sentiment over the near term. However, it is valuations and future expectations of earnings growth (for equities) and the outlook for interest rates (for bonds) that will matter more to portfolios and the investment returns of your Greystone funds this year and next.
Since the volatility experienced at the end of last year, both bonds and equities have rallied strongly in the first half of 2019; this trend is unlikely to be repeated to the same magnitude in the second half of the year, and may even reverse. We at Greystone are acutely aware of the absolute and relative valuations investors are being asked to pay for varying asset classes. Relative valuations, for example; growth stocks versus value stocks, government bond yields versus global equity yields, are stretched, and in some cases reaching record levels.
We constantly focus on the unit of return we can expect to achieve, relative to the unit of risk we are being asked to take, when making investment decisions on your behalf. Our investment process enables us to choose the fund managers around the world that can identify opportunities and demonstrate an edge in delivering consistent risk-adjusted returns; whether they invest in equities, bonds, commercial property or infrastructure. It is this research process, which we rigorously employ, that enables us to optimise the portfolio returns for each of the Greystone funds.
Happy Summer to all our investors and thank you for your continued support. As always, please contact your usual adviser for further information or for access to our monthly updates.
The above are the views and opinions of the Greystone Investment Committee and are correct at the time of writing. All performance data compiled from Thomson Reuters Lipper for Investment Management, data correct to 30.06.2019. 1The Economist, 2The Financial Times, 3Alpha Terminal. 4BBC.Past, simulated past or future projected performance is not a reliable indicator of future performance and may not be repeated.

0
1
2
3
4
5
6
7
2006 2008 2010 2012 2014 2016 2018
BoE Base Rate (RHS)
0
10
20
30
40
50
60
UK House Price Index (LHS)
UK CPI (LHS)
“A Silver Lining“
Business confidence, as measured by the Purchasing Managers’ Indices (PMIs), is a leading indicator of economic growth. PMIs are constructed monthly from surveys of business leaders; a number greater than 50 indicates expansion, while a number less than 50 indicates contraction.
The chart shows the three main PMIs; Manufacturing, Services and Construction; for the UK since the 2016 referendum. All three have trended down since the second half of 2018, amid uncertainty around the UK economy and the Brexit process.
The Manufacturing PMI has experienced the most dramatic moves over the near-term as companies took on, and then unwound, higher levels of stock than usual ahead of the UK’s expected departure from the EU on 29th March (highlighted).
However, the latest Services PMI of 51.0 (in May) indicates some confidence in UK services, due to an increase in new work received by firms in this sector.
This is positive as the sector forms a large part of the UK economy. In Q1 2019, service industries made up 83%1 of the total contribution to UK GDP from all three sectors, whereas manufacturing contributed 10.5%1 and construction 6.5%1.
40
42
44
46
48
50
52
54
56
58
60
Jun/16 Dec/16 Jun/17 Dec/17 Jun/18 Dec/18 Jun/19
Manufacturing Services
Construction 50 point level
Gro
wth
(%
)
Quarterly Commentary 12
Key Charts
Final Thoughts
July 2019
The above are the views and opinions of the Greystone Investment Committee and are correct at the time of writing unless otherwise stated. All data is correct to 30.06.2019. 1Source: Office for National Statistics. Past, simulated past or future projected performance is not a reliable indicator of future performance and may not be repeated.
Source: UK Land Registry & Lipper for Investment Management.
UK PMIs – since June 2016
Source: IHS Markit.
UK House Prices, CPI and Base Rate – since 2006
Va
lue
“Where The Heart Is”
UK house prices have risen sharply in recent years, helped by low borrowing costs, as many people buy their home with the help of a mortgage.
The official statistic measuring growth in house prices in the UK is the House Price Index. A key measure of borrowing costs in the UK is the Bank of England (BoE) Base Rate, an important component of mortgage interest rates.
The chart shows the percentage growth of the UK House Price Index and how this compares to the increase in inflation, as measured by the Consumer Price Index (CPI), since 2006.
UK property prices fell sharply in 2009 following the Global Financial Crisis (shaded), but since then they have recovered and outpaced the rate of inflation.
The BoE may increase the Base Rate if it expects the annual rate of inflation to be substantially higher than its target of 2%, and has stated it expects rate rises to be gradual in coming years. At its latest reading in May, the annual inflation rate in the UK was 2%, in line with the BoE’s target.
Ba
nk
of E
ng
lan
d B
ase
Ra
te (%
)
29th March 2019

IMPORTANT INFORMATIONThis document is for advisers and retail clients. It does not constitute a form of financial advice and should not be relied upon. This is provided for information only. At Greystone we seek to guide you with your investment strategies by assessing and continually checking the levels of investment risk you are willing and able to take, thus ensuring suitable investments are made on your behalf. Past, simulated past or future projected performance is not a reliable indicator of future performance and may not be repeated. Investment markets and conditions can change rapidly and as such any views expressed herein should not be relied upon when making investment decisions. Neither the payment of dividends or return of capital is implied or guaranteed. There is a risk of loss of capital. Rates of exchange may cause the value of investments to go up or down. The information and any opinions expressed herein may change at any time and therefore this document does not constitute investment, tax, legal or other advice or recommendation or an offer to sell or an invitation to apply for any product or service. Investors should consider carefully whether an investment in this fund or portfolio is suitable in light of circumstances and resources.
The Greystone Investment Committee is part of Greystone Wealth Management, a trading name of Foundation Investment Management Limited who are authorised and regulated by the Financial Conduct Authority. Financial Services Register Number 612117.
Q2 19-July
Visit www.greystonefs.co.uk for additional information