Minnesota’s Aging Power Plant Fleet and the Clean Energy First Opportunity
11
Minnesota’s Aging Power Plant Fleet and the Clean Energy First Opportunity Joseph Sullivan Manager of Strategic Relations March 13, 2017
-
Upload
center-for-energy-and-environment -
Category
Environment
-
view
46 -
download
0
Transcript of Minnesota’s Aging Power Plant Fleet and the Clean Energy First Opportunity

Minnesota’s Aging Power Plant Fleet and the Clean Energy First
Opportunity
Joseph Sullivan
Manager of Strategic Relations
March 13, 2017

Technical Research Programs & Engineering
Community Energy Planning
Clean Energy Financing

The Transformation So Far…
1990 2007
49%
22%
17%
7% 5%
2014
Coal
Nuclear
Wind
Nat. Gas
Other
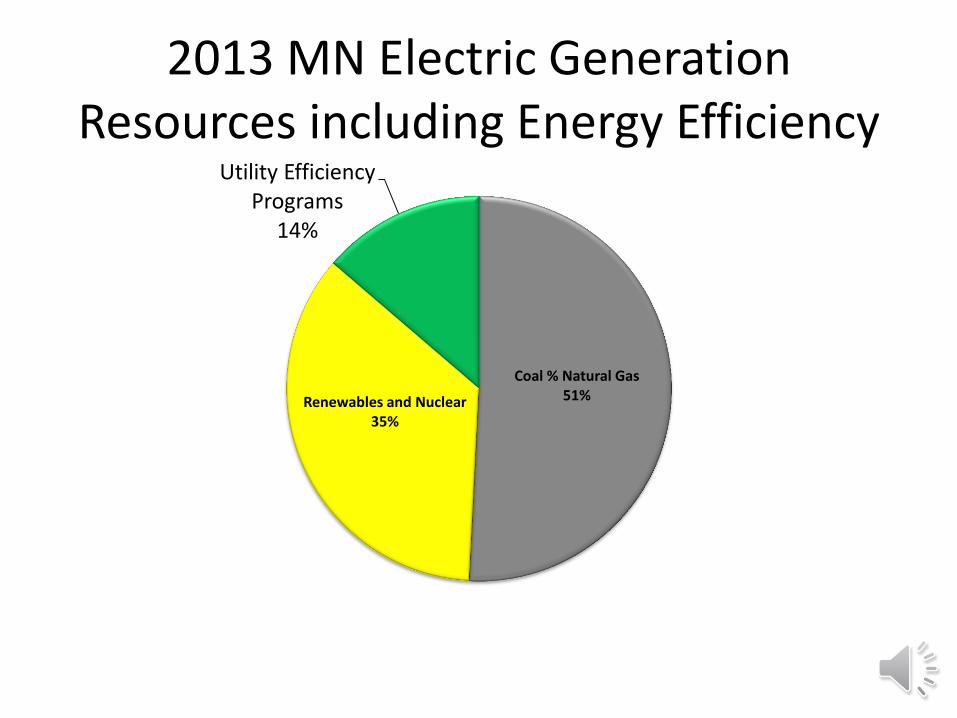
2013 MN Electric Generation Resources including Energy Efficiency
Coal % Natural Gas 51% Renewables and Nuclear
35%
Utility Efficiency Programs
14%

Minnesota’s Largest Power Plants Utility Power Plant Plant Capacity in MW
Projected End of Life or Announced Retirement
MP Taconite Harbor 168 2016*
MP Boswell Unit 1 & 2 150 2018
Otter Tail Hoot Lake Units 2 & 3 129 2020
Xcel Sherco 1 & 2 1360 2023 & 2026
Xcel Monticello 671 2031
Xcel Sherco 3 860 2033
Xcel Prairie Island 1 & 2 1100 2033, 2034
MP Boswell Unit 3 & 4 923 2035, 2036
Xcel Allen S. King 598 2037
Totals 4,104 coal
5,959 coal + nuclear

Announced & Projected Retirements
6
*MWs based on publicly announced utility retirements, reported facility “book life” in PUC depreciation filings and date nuclear operating licenses expire.
811 789 660
2580
1521
2015-2019 2020-2024 2025-2029 2030-2034 2035-2039
Baseload Retirements* to 2040

Minnesota 2020 Electricity Profile
7 Based on projected Minnesota total retail sales of 72,012,000 MWhs/year
73%
21%
1%
5%
Coal Retirements Create a 5% Clean Energy Opportunity
Coal Gas Imports NuclearOther
Wind
Solar
Clean Energy Opportunity
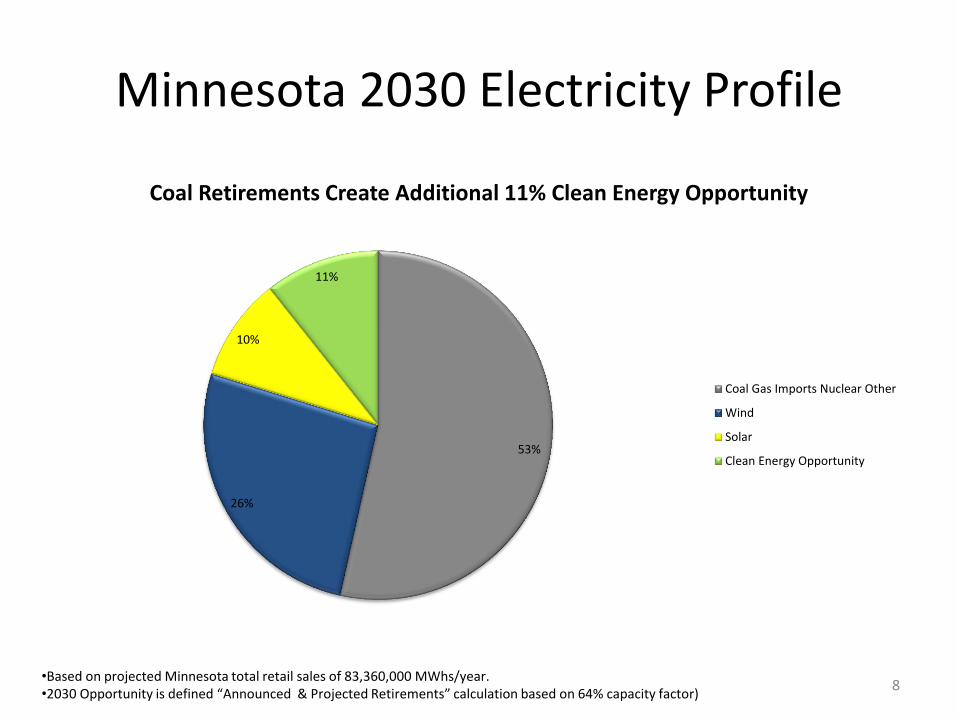
Minnesota 2030 Electricity Profile
8 •Based on projected Minnesota total retail sales of 83,360,000 MWhs/year. •2030 Opportunity is defined “Announced & Projected Retirements” calculation based on 64% capacity factor)
53%
26%
10%
11%
Coal Retirements Create Additional 11% Clean Energy Opportunity
Coal Gas Imports Nuclear Other
Wind
Solar
Clean Energy Opportunity

Minnesota 2035 Electricity Profile
9
•Based on projected Minnesota total retail sales of 84,750,000 MWhs/year.
33%
27%
10%
30%
Coal & Nuclear Retirements Create Another 30% Clean Energy Opportunity
Coal Gas Imports Other
Wind
Solar
Clean Energy Opportunity

By 2040, 70% of MN’s Electricity Generation will need to be Replaced
Megawatt Hours: 2013-2040
Coal
Nuclear
Natural Gas
Hydroelectric
Wind/Solar/Renewables

Joseph Sullivan
Manager of Strategic Relations Center for Energy & Environment
@Joe_mncee