MINISTRY OF FORESTY AND RESEARCH HIGH CONSERVATION …
14
July 2020 MINISTRY OF FORESTY AND RESEARCH HIGH CONSERVATION VALUE AREA SPECIFICATION AND MANAGEMENT MANUAL Version: 1.2
Transcript of MINISTRY OF FORESTY AND RESEARCH HIGH CONSERVATION …

July 2020
MINISTRY OF FORESTY AND
RESEARCH
HIGH CONSERVATION VALUE AREA
SPECIFICATION AND MANAGEMENT
MANUAL
Version: 1.2

HCV 1-3 probability maps: Methodology in Solomon Island
1. Overview
This report provides indicators and the methodology for developing HCV 1,
HCV 2, HCV 3 probability maps. Proposed places where these HCVs may exist
are separately identified by using each indicators mentioned later. A proposed
methodology is also provided for how the HCV 1-3 maps can be overlaid to
produce an HCV 1–3 probability map. These draft indicators are based on the
existing RSPO document: HCV 1-3 probability maps: methodology and
consultation (HCV_SH_7_mapping_methods.pdf).
The basic steps for developing the maps are as follows:
1. Define indicators for HCV 1-3
2. Collect data
3. Develop draft probability maps for HCV 1-3, and conduct accuracy
testing
4. Refine probability maps for HCV 1-3
5. Combine HCV 1, 2 and 3 maps into draft combined HCV 1-3 probability
map
6. Final revision of all maps. Final outputs will be a methods document and
shapefile/raster maps of: HCV 1-3 probability
2. Methodology
Indicators
Firstly, indicators are set up and converted to each Indicator Map, then these
maps are merged into the Probability Maps for each HCV.
Probability of HCV 1 presence
1. The presence of a recognized biodiversity priority area
2. A designation by national authorities, or by reputable conservation organizations
3. The presence of natural habitat in good condition
Probability of HCV 2 presence
1. Existing landscape-level designations (e.g. Ramsar sites, National parks,
Sanctuaries, etc.)
2. Areas with low levels of overall disturbance and high connectivity
3. Large, undisturbed landscape-level (Intact Forest Landscapes) forests comes from
the World Resources Institute
4. Other forests matching criteria (with an area of at least 5000 km2 etc.)
Probability of HCV 3 presence
1. In regions where many natural ecosystems or habitats have been eliminated, and
others have been heavily impacted by development, remaining natural ecosystems
of reasonable quality are likely to be HCV 3.
2. Where ecosystem proxies indicate the presence of RTE ecosystems, even if these
are inaccessible or have not been confirmed on the ground.

Dataset
High probability of HCV 1-3 presence
Natural Forest Patched >=1,000ha (plus an additional 50m buffer) Hansen Treecover
Hansen Lossyear
Create treecover2018 from above
data
Protected Areas (plus a 50m buffer) World Database on Protected
Areas(WDPA)
Intact Forest Landscape (IFL) (plus a 50m buffer) Intact Forest Landscape
Medium probability of HCV 1-3 presence
50m to 500m buffer around natural forest patches >1,000ha Treecover2018
Swamp ecosystems TROP-
SUBTROP_WetlandV2_2016_CIFOR
50m to 1km buffer around PAs World Database on Protected
Areas(WDPA)
50m to 1km buffer around IFLs Intact Forest Landscape
Natural forest patches of 50-1,000ha Treecover2018
Low probability of HCV 1-3 presence
All remaining areas, consisting of existing agriculture,
scrubland/degraded natural areas and natural forest patches <50ha
Remaining areas

Methods
High probability of HCV1-3 presence
Treecover2018 creation
1. Open Hansen Treecover map and merge these.
Parameter are like below
When you fail merge, use temporal file and save.
Merge Lossyear as well

2. Clip out Treecove2000 with Lossyear
Reclass Lossyear to (0,1)
*Make sure to open with QGIS with GRASS
Reclass rules text
0 = 1
1 thru 18 = 0
Make this as a temporary file
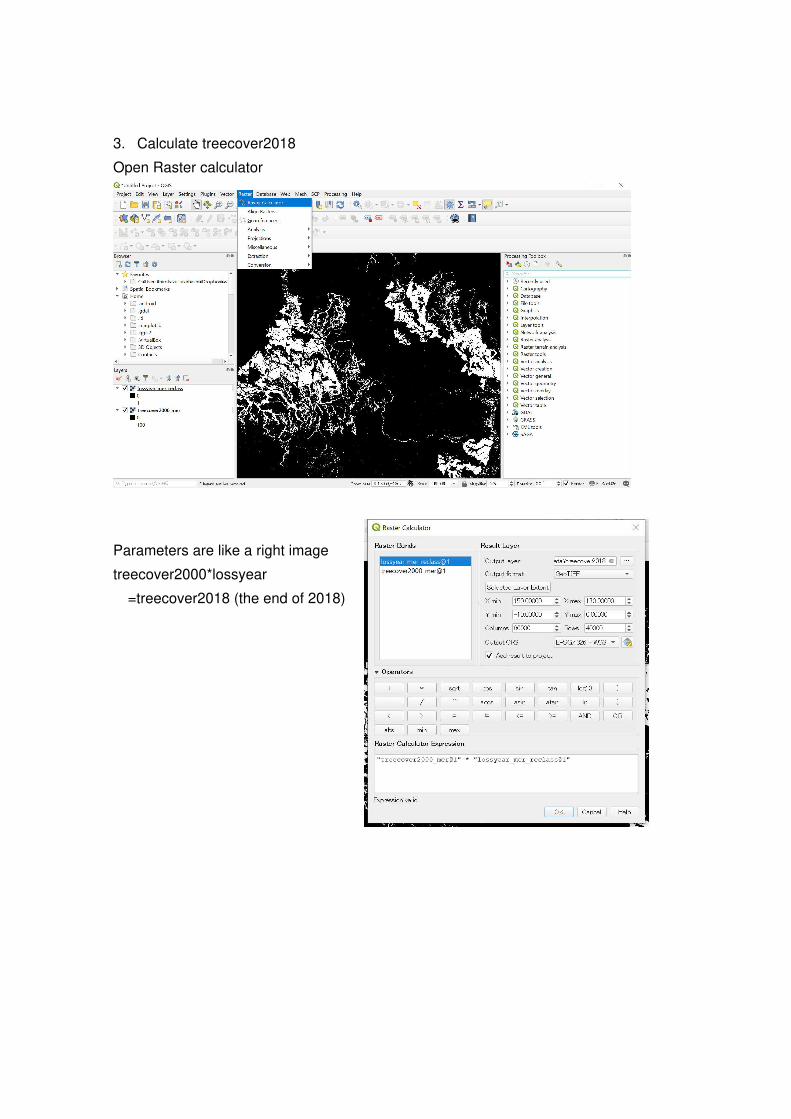
3. Calculate treecover2018
Open Raster calculator
Parameters are like a right image
treecover2000*lossyear
=treecover2018 (the end of 2018)

Reclass treecover2018 to (0,1)
Percentage indicates crown cover rate.
Classify this like below
0-89% =0
90-100=1
Save this as:
Treecover2018_reclass
*From now on, it is better to clip raster to each province to avoid processing into failure.
4. Polygonize trecover2018_reclass.
*It takes time so that it is preferable to leave processing overnight.
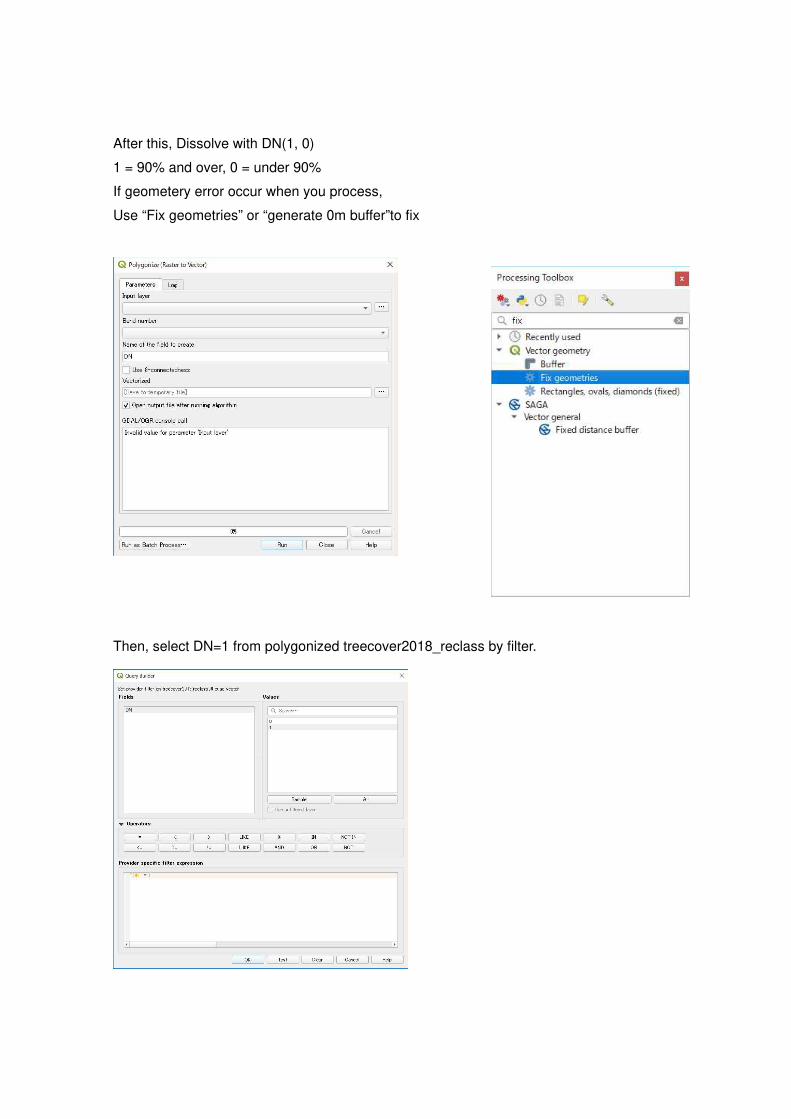
After this, Dissolve with DN(1, 0)
1 = 90% and over, 0 = under 90%
If geometery error occur when you process,
Use “Fix geometries” or “generate 0m buffer”to fix
Then, select DN=1 from polygonized treecover2018_reclass by filter.

Change the coordinate system to UTM57S
Calculate area with field calculator

Then Select area >=1000ha using filter>Query Builder
And save this as “treecover2018_reclass_selected1000ha”
5. Generate 50m buffer with “Buffer”
Parameters are below:

6. Open IFL and guad_admin. Clip out IFL by Guadalcanal area
Save file with UTM57S

7. Change project coordination to UTM57S
8. Generate 50m buffer
9. Generate 50m buffer with PA in same way
10. Merge “treecover2018_reclass_selected1000ha” and IFL and WP as High area.

11. Open Field Calculator and add field. Parameters are like below:
12. Dissolve with number 1
Medium probability of HCV1-3 presence
1. Open generated“treecover2018_reclass_selected1000ha”
2. Create 500m buffer and save this.
3. Select “code20: mangrove area” from WetlandV2
4. Select over 50ha to 1000ha area using original “treecover2018_reclass”
5. Create 1km buffer with IFL and PA
6. Merge and Dissolve these area with number 2
Probability of HCV1-3 presence
1. Put attribute number 3 on admin boundary (as Low)
2. Union High and Medium and admin boundary (as Low)
3. Clip out this map with admin boundary
4. Color Map with number 1(High), 2(Medium), 3(Low)