MINISTRY of ECONOMY ECONOMIC OUTLOOK DECEMBER 2012 Economic Outlook is revized in the 1st and the...
68
MINISTRY of MINISTRY of ECONOMY ECONOMY ECONOMIC OUTLOOK DECEMBER 2012 DECEMBER 2012 Economic Outlook is revized in the 1st and the 3rd weeks of the month. Recent Update: 04/12/2012 December 2012 December 2012 Ministry of Economy Ministry of Economy 1
-
Upload
mckayla-markham -
Category
Documents
-
view
215 -
download
1
Transcript of MINISTRY of ECONOMY ECONOMIC OUTLOOK DECEMBER 2012 Economic Outlook is revized in the 1st and the...

MINISTRY of ECONOMYMINISTRY of ECONOMY
ECONOMIC OUTLOOK
DECEMBER 2012DECEMBER 2012
Economic Outlook is revized in the 1st and the 3rd weeks of the month.Recent Update: 04/12/2012
December 2012 Ministry of EconomyDecember 2012 Ministry of Economy 11

A- MACROECONOMIC OUTLOOKA- MACROECONOMIC OUTLOOK
B- FOREIGN TRADE OUTLOOKB- FOREIGN TRADE OUTLOOK
1) MERCHANDISE1) MERCHANDISE
2) SERVICES2) SERVICES
C- INVESTMENTS , FOREIGN CAPITAL and INCENTIVESC- INVESTMENTS , FOREIGN CAPITAL and INCENTIVES
D- FREE ZONES in TURKEYD- FREE ZONES in TURKEY
E- BILATERAL, REGIONAL, PLURILATERAL and MULTILATERAL TRADEE- BILATERAL, REGIONAL, PLURILATERAL and MULTILATERAL TRADE
OUTLINEOUTLINE
DecemberDecember 2012 Ministry of Economy 2012 Ministry of Economy 22

A- MACROECONOMIC OUTLOOKA- MACROECONOMIC OUTLOOK
DecemberDecember 2012 Ministry of Economy 2012 Ministry of Economy 33

Growth Forecasts for Selected Countries/Country Groups (%)Growth Forecasts for Selected Countries/Country Groups (%)
According to the IMF, Turkish Economy is expected to grow by 3% in 2012.
In the first two quarters of 2012, Turkish economy grew by 3,2% and 2,9% respectively, resulting in an average growth of 3,05% in the first half of 2012
Source: IMF, OECD, UN, WB
DecemberDecember 2012 Ministry of Economy 2012 Ministry of Economy
Turkey Euro Area US Brazil Russia India China2012 3.0 -0.4 2.2 1.5 3.7 4.9 7.82013 3.5 0.2 2.1 4.0 3.8 6.0 8.22012 2.9 -0.4 2.2 1.5 3.4 4.5 7.52013 4.1 -0.1 2.0 4.0 3.8 5.9 8.52012 2.9 -0.3 2.1 2.9 3.5 6.6 7.72013 4.0 0.7 2.4 4.2 4.2 6.9 8.12014 5.0 1.4 2.8 3.9 4.0 7.1 8.42012 3.2 -0.3 2.1 3.3 4.4 6.7 8.32013 5.4 0.9 2.3 4.5 4.4 7.2 8.5
IMF
OECD
WB
UN
Growth Forecasts for Selected Countries/Country Groups (%)
44

According to the IMF estimates, global trade volume of merchandise and services is expected to increase by 3.2% in 2012 and 4,5% in 2013.
According to the WTO estimates, global trade volume of merchandise and services is expected to increase by 3.7% in 2012 and 5.6% in 2013.
Forecasts for Merchandise and Services Trade Growth (%)Forecasts for Merchandise and Services Trade Growth (%)
Source: IMF and WTO
DecemberDecember 2012 Ministry of Economy 2012 Ministry of Economy
YearsAdvanced Economies
Emerging Markets
Advanced Economies
Emerging Markets
2012 2.2 4.0 1.7 7.0 3.22013 3.6 5.7 3.3 6.6 4.52012 2.0 5.6 1.9 6.2 3.72013 4.1 7.2 3.9 7.8 5.6WTO
Forecasts for Merchandise and Services Trade Growth (%)Exports Imports World
Trade Volume
IMF
55

Economic Targets of 201Economic Targets of 20133-201-20155 Medium Term Programme Medium Term Programme
*Forecast (Medium Term Programme, Ministry of Development – October 9, 2012)
Medium Term Programme which covers 2013-2015 period aims to strengthen macroeconomic and financial stability by reaching potential economic growth rate, decreasing the current account deficit further, reducing inflation and improving public fiscal balances.
DecemberDecember 2012 Ministry of Economy 2012 Ministry of Economy
2012* 2013* 2014* 2015*GDP (Billion $, Current Prices) 799 858 919 998GDP Per Capita ($) 10,673 11,318 11,982 12,859Real GDP Growth 3.2 4.0 5.0 5.0Unemployment Rate (%) 9.0 8.9 8.8 8.7Tourism Income (Billion $) 23.5 25.4 27.0 28.4Current Account Balance (Billion $) -58.7 -60.7 -63.6 -64.7Current Account Balance / GDP (%) -7.3 -7.1 -6.9 -6.5
66

Real GDP Growth of Selected Countries/Country Groups (2011)Real GDP Growth of Selected Countries/Country Groups (2011)
Turkish Economy expanded by 8.5% in 2011, which was well beyond the expectations of the IMF (7.5%).
Source: TURKSTAT, IMF
DecemberDecember 2012 Ministry of Economy 2012 Ministry of Economy 77

Annual Economic Growth Rates (2002-2011)Annual Economic Growth Rates (2002-2011)
Source:TURKSTAT
Turkey has recovered fast from the global financial crisis and amongst those countries affected less from current global economic uncertainties.
Turkey has the fastest economic growth rates in Europe. Mean annual growth rate between 2002 and 2011 was 6%. Real GDP growth for 2011 realized as 8.5%. Turkey grows 3.05% in first the half of 2012.
DecemberDecember 2012 Ministry of Economy 2012 Ministry of Economy 88

GDP Per CapitaGDP Per Capita
Source: TURKSTAT, Worldbank
GDP per capita has tripled in the last 10 years from 3,492 USD to 10,444 USD. According to Purchasing Power Parity (PPP),GDP per capita surpassed 16 thousand USD.
December 2012 Ministry of EconomyDecember 2012 Ministry of Economy 99

Capacity Utilization Ratio (%)Capacity Utilization Ratio (%)
Source: TURKSTAT
Capacity utilization ratio realized as 74 % in November 2012.
December 2012 Ministry of EconomyDecember 2012 Ministry of Economy 1010

Industrial Production IndexIndustrial Production Index
Source: TURKSTAT
Industrial production index increased by 6.2% year-over-year in September 2012 up to 135.47.
December 2012 Ministry of EconomyDecember 2012 Ministry of Economy 1111

Inflation (Annual Percent Change)Inflation (Annual Percent Change)
Annual inflation in 2011 realized as 10.4%. Monthly CPI change in November 2012 realized as 6.37%.
Source: TURKSTAT
December 2012 Ministry of EconomyDecember 2012 Ministry of Economy 1212

Real Effective Foreign Exchange Rate (2003=100)Real Effective Foreign Exchange Rate (2003=100)
As of November 2012, Turkish Lira has appreciated by 1,6% monthly in terms of the CPI-based real effective exchange rate.
The level of appreciation is 2,9% in terms of the PPI-based real effective exchange rate.
Source: CBRT
December 2012 Ministry of EconomyDecember 2012 Ministry of Economy 1313

Total Credits and Consumer Credits (Billion TL)Total Credits and Consumer Credits (Billion TL)
Credits and specifically consumer credits increased to 187 billion Dollar in parallel to the growing domestic demand.
Total credits increased to 771,8 billion Dollar on a monthly basis in October 2012.
December 2012 Ministry of EconomyDecember 2012 Ministry of Economy
Source: BRSA
1414

CDS Premiums (Dec 4th, 2012)CDS Premiums (Dec 4th, 2012)
Source: DB Research* Higher CDS premiums indicate higher risk levels.
CDS premium of Turkey is significantly low compared to most of the European countries.
December 2012 Ministry of EconomyDecember 2012 Ministry of Economy 1515

Financial MarketsFinancial Markets
Total assets of the banking sector increased by 7.8% and reached 1.308 trillion TL in September 2012.
Capital Adequacy Ratio of Turkish Banking Sector is 16.49% in September 2012.
December 2012 Ministry of EconomyDecember 2012 Ministry of Economy
Source: BRSA
Data on Banking Sector 2012 September 2012 September
Number of Banks 48 48
Number of Domestic Branches 10,427 10,813
Number of Foreign Branches 74 79
Number of Total Domestic Personnel Employed 194,106 198,542
Total Assets (Million TL) 1,213,660 1,308,482
Total Equities (Million TL) 141,575 168,151
Net Profit or Loss (Million TL) 14,620 17,090
Nonperforming Loans (Gross) / Cash and Cash Equivalents (%) 2.71 2.95
Net Profit or Loss / Average Equities (%) 1.32 1.35
Liquid Assets with 12 Months of Maturity / Total Assets (%) 70 72
Capital Adequacy Ratio (%) 16 16
1616

EU Defined Budget Deficit/ GDP (%)EU Defined Budget Deficit/ GDP (%)
EU defined general government budget deficit/GDP ratio was 2.6% in Turkey in 2011 and Turkey satisfied the Maastricht criteria of 3%. Turkey also outperformed 18 EU Countries.
Central government budget deficit/GDP ratio was 1.3% in Turkey in 2011 and Turkey outperformed 23 EU Countries.
In January-October 2012, central government budget deficit has increased to 18.8 billion dollars.
2011
December 2012 Ministry of EconomyDecember 2012 Ministry of Economy 1717

Government Debt / GDP (%)Government Debt / GDP (%)
Debt/GDP ratio of Turkey was 39.4% in 2011, which was below the level in 21 EU Countries and the Maastricht Criteria (60%).
December 2012 Ministry of EconomyDecember 2012 Ministry of Economy
Source:Eurostat
1818

Unemployment Rates (%)Unemployment Rates (%)
In August 2012, the unemployment rate was 8.8%. Seasonally adjusted unemployment rate was 9.2%.
Seasonally adjusted unemployment rate in Euro Area was 11.7% and 10.7% in (EU27) in October 2012. In terms of unemployment ratio Turkey outperformed 14 EU countries according to current data.
After Russia, Germany, England and France, Turkey has the 5th largest labor force among the European countries. (2010, World Bank)
Source: TURKSTAT
December 2012 Ministry of EconomyDecember 2012 Ministry of Economy 1919
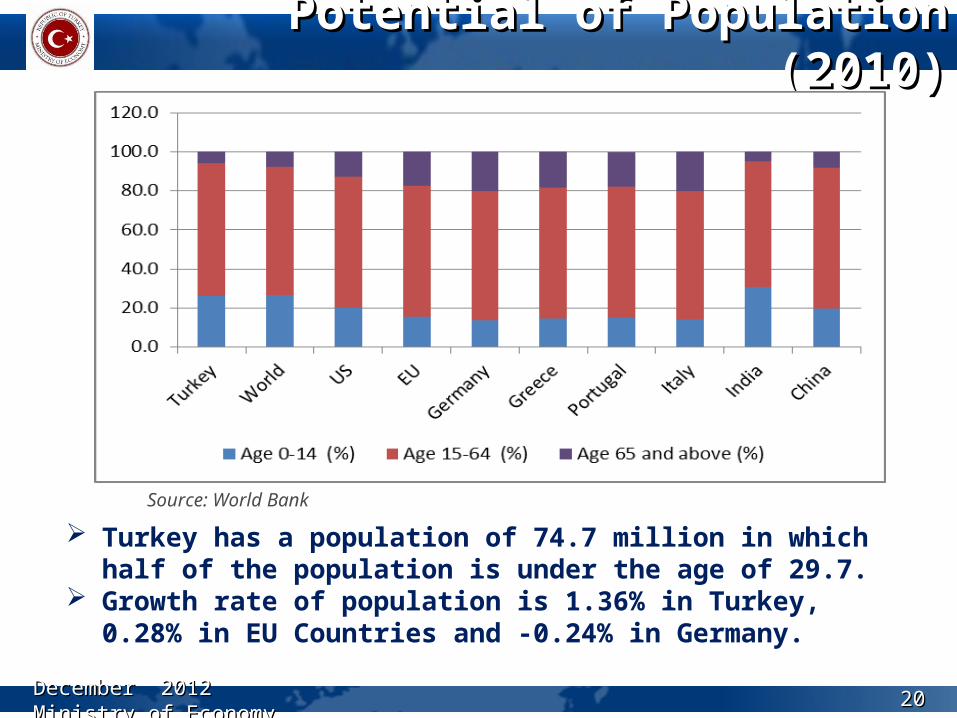
Potential of Population (2010)Potential of Population (2010)
Source: World Bank
Turkey has a population of 74.7 million in which half of the population is under the age of 29.7.
Growth rate of population is 1.36% in Turkey, 0.28% in EU Countries and -0.24% in Germany.
December 2012 Ministry of EconomyDecember 2012 Ministry of Economy 2020

Cell phone penetration rate in households: 93.2% Internet access rate in households: 47.2% Internet access rate in enterprises: 92.5% PC penetration rate in households: 31.8% Laptop penetration rate in households: 27.1% Digital camera penetration rate in households: 27.1% Printer penetration rate in households: 14.0% 1 of each 5 people owns a vehicle.
Growing Dynamism in Turkey's Domestic MarketGrowing Dynamism in Turkey's Domestic Market
December 2012 Ministry of EconomyDecember 2012 Ministry of Economy 2121

B- FOREIGN TRADE OUTLOOKB- FOREIGN TRADE OUTLOOK
December 2012 Ministry of EconomyDecember 2012 Ministry of Economy 2222

I) MERCHANDISEI) MERCHANDISE
December 2012 Ministry of EconomyDecember 2012 Ministry of Economy 2323

Targets in Merchandise TradeTargets in Merchandise Trade
* Actual (Source: TURKSTAT)**Forecast: Medium Term Programme, Ministry of Development- 10/09/2012)
December 2012 Ministry of EconomyDecember 2012 Ministry of Economy
(Billion $) 2011* 2012** 2013** 2014** 2015**
Exports 135 149,5 158 172,3 187,1Imports 240,8 239,5 253 272,2 291,2Volume of trade 375,8 389 411 444,5 478,3Balance of trade -106 -90 -95 -99,9 -104,1Exports/Imports (%) 56,1 62,4 62,5 63,3 64,3
2424

Turkey's Share in Global Merchandise Exports (%)Turkey's Share in Global Merchandise Exports (%)
Turkey’s share in global merchandise exports was %0.74 in 2011.
December 2012 Ministry of EconomyDecember 2012 Ministry of Economy
0.77
0.82 0.81
0.750.74
0.68
0.70
0.72
0.74
0.76
0.78
0.80
0.82
0.84
2007 2008 2009 2010 2011
Source: WTO
2525
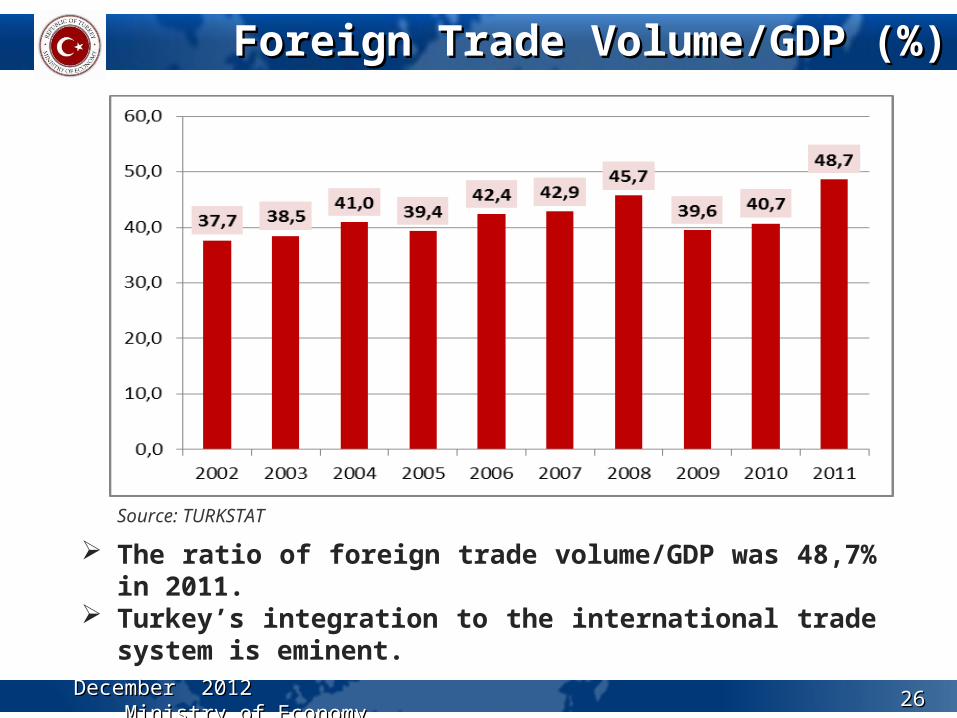
Foreign Trade Volume/GDP (%)Foreign Trade Volume/GDP (%)
The ratio of foreign trade volume/GDP was 48,7% in 2011. Turkey’s integration to the international trade system is eminent.
December 2012 Ministry of EconomyDecember 2012 Ministry of Economy
Source: TURKSTAT
2626
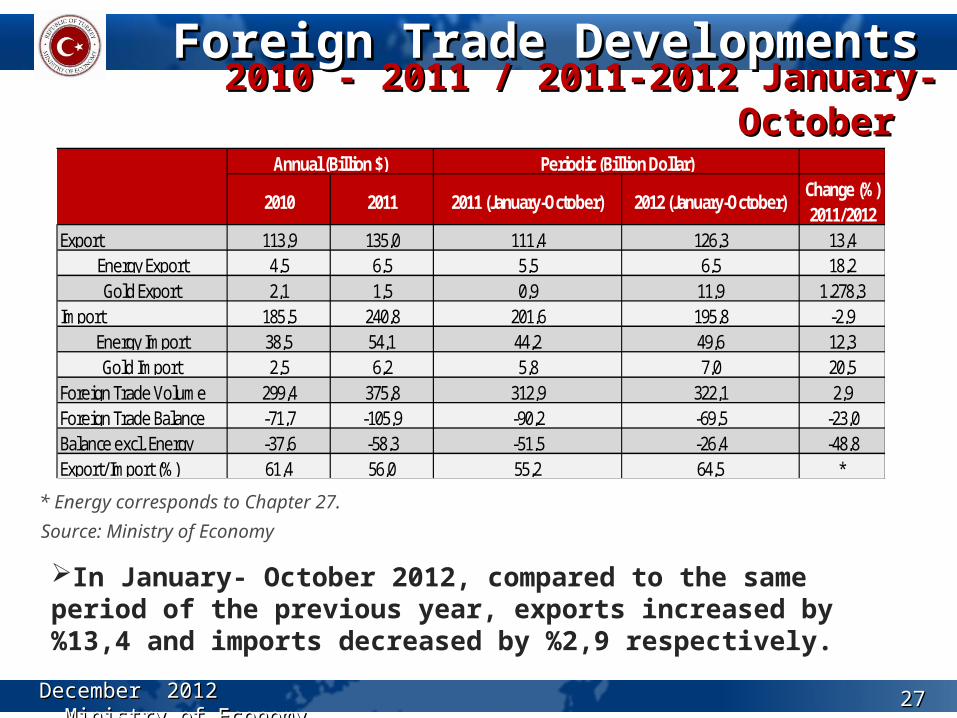
Foreign Trade Developments Foreign Trade Developments
In January- October 2012, compared to the same period of the previous year, exports increased by %13,4 and imports decreased by %2,9 respectively.
Source: Ministry of Economy
December 2012 Ministry of EconomyDecember 2012 Ministry of Economy
2010 - 2011 / 2011-2012 January-October 2010 - 2011 / 2011-2012 January-October
* Energy corresponds to Chapter 27.
2010 2011 2011 (January-October) 2012 (January-October)Change (%) 2011/2012
Export 113,9 135,0 111,4 126,3 13,4Energy Export 4,5 6,5 5,5 6,5 18,2Gold Export 2,1 1,5 0,9 11,9 1.278,3
Import 185,5 240,8 201,6 195,8 -2,9Energy Import 38,5 54,1 44,2 49,6 12,3Gold Import 2,5 6,2 5,8 7,0 20,5
Foreign Trade Volume 299,4 375,8 312,9 322,1 2,9Foreign Trade Balance -71,7 -105,9 -90,2 -69,5 -23,0Balance excl. Energy -37,6 -58,3 -51,5 -26,4 -48,8Export/Import (%) 61,4 56,0 55,2 64,5 *
Annual (Billion $) Periodic (Billion Dollar)
2727

Monthly Exports/Imports Monthly Exports/Imports
December 2012 Ministry of EconomyDecember 2012 Ministry of Economy
In October 2012 compared to October 2011 exports have increased by 11,6% and reached to the level of 13,3 billion dollar and imports have decreased by 5,6%, to the level of 18,8 billion dollar.
2010-3
2010-4
2010-5
2010-6
2010-7
2010-8
2010-9
2010-10
2010-11
2010-12
2011-1
2011-2
2011-3
2011-4
2011-5
2011-6
2011-7
2011-8
2011-9
2011-10
2011-11
2011-12
2012-01
2012-02
2012-03
2012-04
2012-05
2012-06
2012-07
2012-08
2012-09
2012-10
Export 9,9 9,4 9,8 9,5 9,6 8,5 8,9 11 9,4 11,9 9,5 10,1 11,8 11,9 10,9 11,4 11,9 11,3 10,8 11,9 11,1 12,5 10,4 11,8 13,3 12,7 13,2 13,3 12,9 12,9 13 13,3
Import 15 14,9 14,7 15,2 16,1 15,4 15,6 17,3 17,1 20,6 16,9 17,5 21,6 21 21,0 21,6 21,1 19,5 21,2 19,9 18,6 20,6 17,4 17,7 20,6 19,3 21,7 20,4 20,8 18,7 19,8 18,8
0
5
10
15
20
25
2828
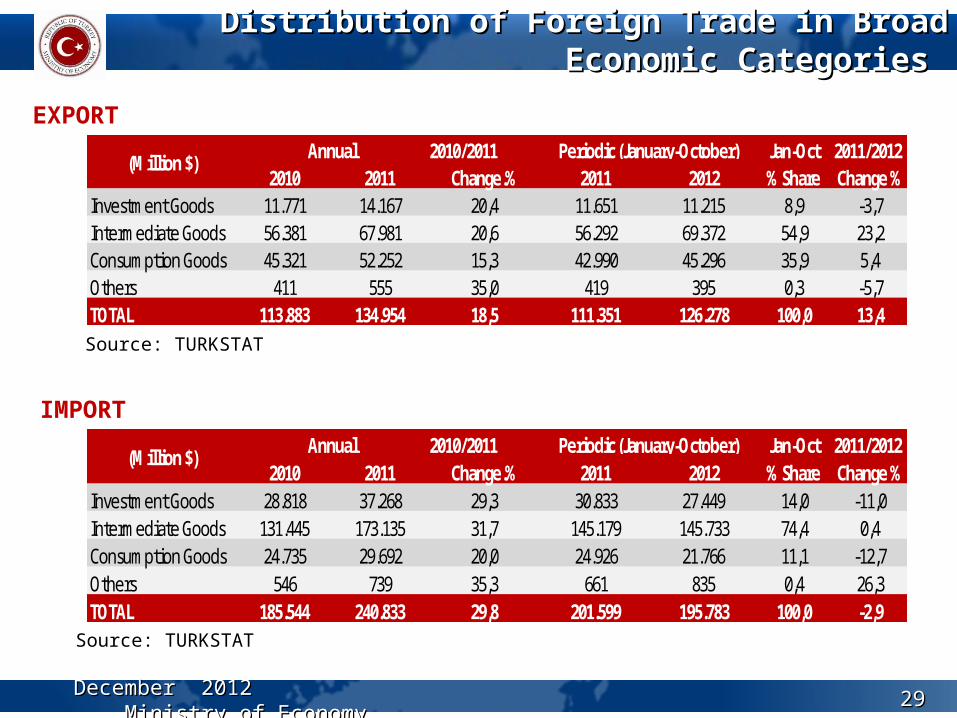
Distribution of Foreign Trade in Broad Economic Categories Distribution of Foreign Trade in Broad Economic Categories
EXPORT
IMPORT
December 2012 Ministry of EconomyDecember 2012 Ministry of Economy
2010/2011 2011/20122010 2011 Change.% 2011 2012 Change %
Investment Goods 11.771 14.167 20,4 11.651 11.215 8,9 -3,7Intermediate Goods 56.381 67.981 20,6 56.292 69.372 54,9 23,2Consumption Goods 45.321 52.252 15,3 42.990 45.296 35,9 5,4Others 411 555 35,0 419 395 0,3 -5,7TOTAL 113.883 134.954 18,5 111.351 126.278 100,0 13,4
(Million $) Annual Periodic (January-October) Jan-Oct % Share
2010/2011 2011/20122010 2011 Change.% 2011 2012 Change %
Investment Goods 28.818 37.268 29,3 30.833 27.449 14,0 -11,0Intermediate Goods 131.445 173.135 31,7 145.179 145.733 74,4 0,4Consumption Goods 24.735 29.692 20,0 24.926 21.766 11,1 -12,7Others 546 739 35,3 661 835 0,4 26,3TOTAL 185.544 240.833 29,8 201.599 195.783 100,0 -2,9
(Million $) Annual Periodic (January-October) Jan-Oct % Share
2929
Source: TURKSTAT
Source: TURKSTAT

Main Export Items Main Export Items
Source: TURKSTAT
* Percent change is related to the annual change in exports in 2012.
December 2012 Ministry of EconomyDecember 2012 Ministry of Economy
Million Dolar CHANGE % Rank Code Periodic (January-October) 2011 2012 2011 2012 2011 2012 2011/2012
1 71 Pearls, precious stones, precious metals and articles thereof 2.716 14.340 6.542 7.700 -3.826 6.640 428,02 87 Vehicle other than railway or tramway rolling-stock, parts thereof 13.125 12.371 14.152 11.511 -1.026 860 -5,73 84 Boilers, machinery and mechanical appliances, parts thereof 9.532 9.916 22.629 21.327 -13.097 -11.411 4,04 72 Iron and steel 9.317 9.657 17.011 16.603 -7.694 -6.946 3,75 85 Electrical machinery and equipment: parts thereof 7.102 7.677 14.057 13.208 -6.956 -5.531 8,16 61 Knitted and crocheted goods and articles thereof 7.091 6.942 970 709 6.121 6.233 -2,17 27 Mineral fuels, minerals oils and product of their distillation 5.509 6.512 44.218 49.640 -38.708 -43.128 18,28 73 Articles of iron and steel 4.777 4.923 2.129 1.889 2.648 3.035 3,19 62 Non knitted and crocheted goods and articles thereof 4.325 4.515 1.656 1.291 2.669 3.224 4,4
10 39 Plastic and articles thereof 3.848 4.162 10.714 10.406 -6.865 -6.244 8,267.341 81.015 134.077 134.284 -66.736 -53.269 20,3
111.351 126.277 201.598 195.783 -90.248 -69.505 13,4LIST TOTAL
TOTAL
EXPORT IMPORT BALANCE
3030

Main Import Items Main Import Items
Source: TURKSTAT * Percent change is related to the annual change in imports in 2012
December 2012 Ministry of EconomyDecember 2012 Ministry of Economy
Million Dollar CHANGE %Sıra Fasıl Periodic (January-October) 2011 2012 2011 2012 2011 2012 2011/2012
1 27 Mineral fuels, minerals oils and product of their distillation 44.218 49.640 5.509 6.512 -38.708 -43.128 12,32 84 Boilers, machinery and mechanical appliances, parts thereof 22.629 21.327 9.532 9.916 -13.097 -11.411 -5,83 72 Iron and steel 17.011 16.603 9.317 9.657 -7.694 -6.946 -2,44 85 Electrical machinery and equipment, parts thereof 14.057 13.208 7.102 7.677 -6.956 -5.531 -6,05 87 Vehicle other than railway or tramway rolling-stock, parts thereof 14.152 11.511 13.125 12.371 -1.026 860 -18,76 39 Plastic and articles thereof 10.714 10.406 3.848 4.162 -6.865 -6.244 -2,97 71 Pearls, precious stones, precious metals and articles thereof 6.542 7.700 2.716 14.340 -3.826 6.640 17,78 29 Organic chemicals 4.690 4.256 441 545 -4.249 -3.712 -9,29 90 Optical, photographic, cinematographic, measuring checking, precision 3.406 3.245 362 457 -3.043 -2.788 -4,7
10 30 Pharmaceutical Products 3.751 3.204 478 497 -3.274 -2.707 -14,6141.169 141.101 52.430 66.134 88.739 74.967 0,0201.598 195.783 111.351 126.277 -90.248 -69.505 -2,9
IMPORT EXPORT BALANCE
LIST TOTAL TOTAL
3131
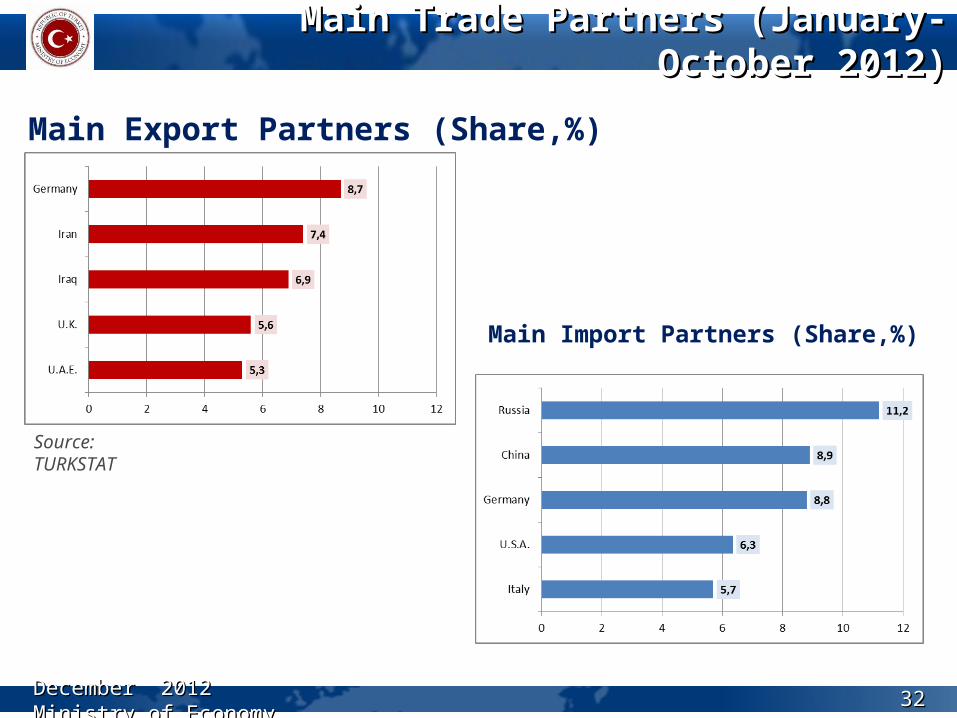
Main Export Partners (Share,%)
Main Trade Partners (JanuaryMain Trade Partners (January-October -October 20120122))
Main Import Partners (Share,%)
Source: TURKSTAT
December 2012 Ministry of EconomyDecember 2012 Ministry of Economy 3232

Exports by RegionsExports by Regions
Source: TURKSTAT
December 2012 Ministry of EconomyDecember 2012 Ministry of Economy
2011 2012 Change(%) 2011 2012 Change(%) A- EU (27) 5.261 5.315 1,0 52.211 48.560 -7,0 B- FREE ZONES IN TURKEY 219 180 -17,7 2.025 1.913 -5,5 C- OTHER COUNTRIES 6.427 7.797 21,3 57.116 75.804 32,7 1- OTHER EUROPE 1.255 1.646 31,2 10.490 11.729 11,8 2- AFRICA 991 1.209 22,0 8.388 11.014 31,3 North Africa 648 857 32,2 5.501 7.773 41,3 Other Africa 343 352 2,8 2.887 3.241 12,2 3- AMERICA 678 909 34,1 6.494 8.010 23,3 North America 490 632 29,0 4.416 5.563 26,0 Central America And Caraips 53 48 -9,9 514 658 28,1 South America 135 229 69,7 1.565 1.789 14,3 4- ASIA 3.427 3.983 16,2 31.193 44.558 42,8 Near And Middle Eastern 2.529 3.036 20,1 22.753 35.957 58,0 Other Asia 899 946 5,3 8.440 8.601 1,9 5- AUSTRALIA AND NEW ZEALAND 47 46 -2,0 392 401 2,2 6- OTHER COUNTRIES AND REGIONS 30 4 -85,5 158 92 -41,7
TOTAL 11.907 13.292 11,6 111.351 126.277 13,4
(Million $)October January-October
3333
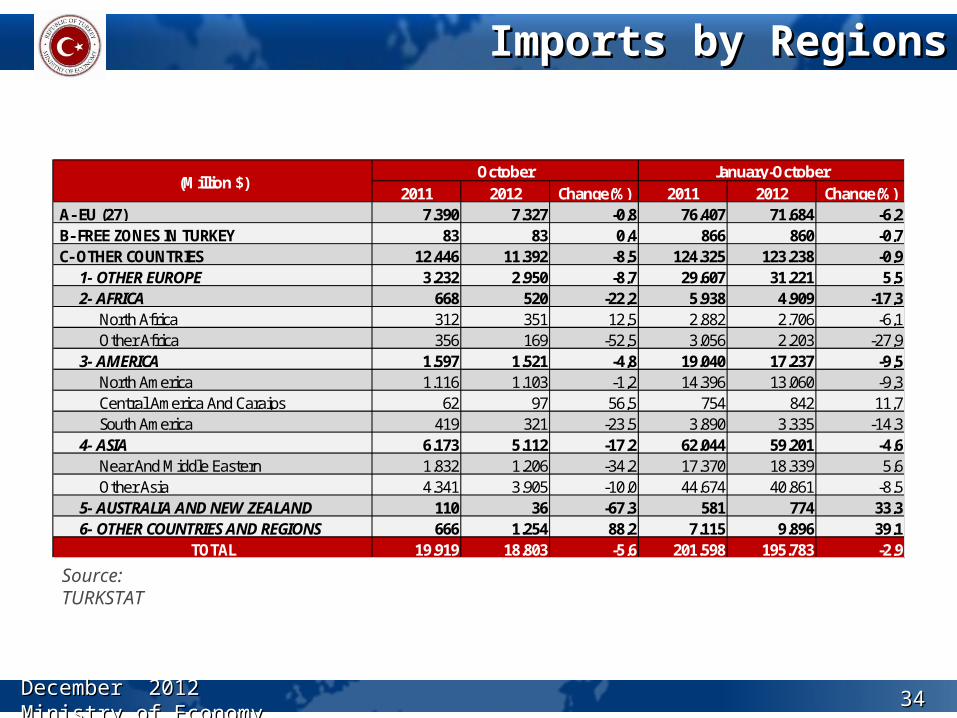
ImportImports by Regionss by Regions
Source: TURKSTAT
December 2012 Ministry of EconomyDecember 2012 Ministry of Economy
2011 2012 Change(%) 2011 2012 Change(%) A- EU (27) 7.390 7.327 -0,8 76.407 71.684 -6,2 B- FREE ZONES IN TURKEY 83 83 0,4 866 860 -0,7 C- OTHER COUNTRIES 12.446 11.392 -8,5 124.325 123.238 -0,9 1- OTHER EUROPE 3.232 2.950 -8,7 29.607 31.221 5,5 2- AFRICA 668 520 -22,2 5.938 4.909 -17,3 North Africa 312 351 12,5 2.882 2.706 -6,1 Other Africa 356 169 -52,5 3.056 2.203 -27,9 3- AMERICA 1.597 1.521 -4,8 19.040 17.237 -9,5 North America 1.116 1.103 -1,2 14.396 13.060 -9,3 Central America And Caraips 62 97 56,5 754 842 11,7 South America 419 321 -23,5 3.890 3.335 -14,3 4- ASIA 6.173 5.112 -17,2 62.044 59.201 -4,6 Near And Middle Eastern 1.832 1.206 -34,2 17.370 18.339 5,6 Other Asia 4.341 3.905 -10,0 44.674 40.861 -8,5 5- AUSTRALIA AND NEW ZEALAND 110 36 -67,3 581 774 33,3 6- OTHER COUNTRIES AND REGIONS 666 1.254 88,2 7.115 9.896 39,1
TOTAL 19.919 18.803 -5,6 201.598 195.783 -2,9
(Million $)October January-October
3434
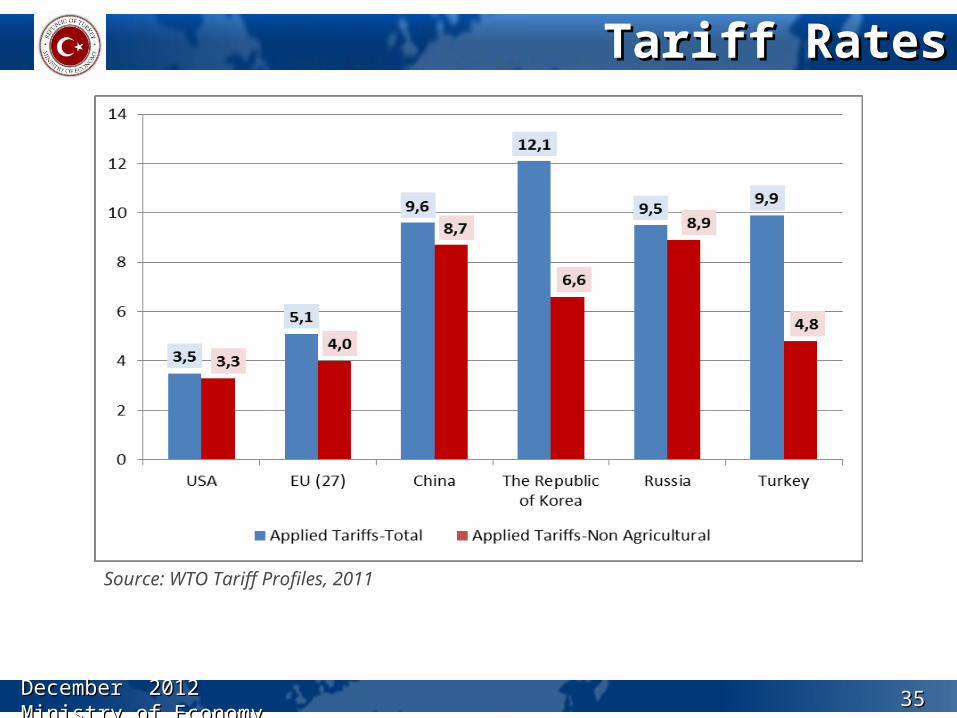
Tariff RatesTariff Rates
Source: WTO Tariff Profiles, 2011
December 2012 Ministry of EconomyDecember 2012 Ministry of Economy 3535

2) SERVICES2) SERVICES
December 2012 Ministry of EconomyDecember 2012 Ministry of Economy 3636

Tourism: Besides increasing the number of tourist arrivals, creating a structure that improves service quality, targets high-income groups by diversifying marketing channels, preserves natural capital and sustainability, and stimulates those types of tourism where Turkey has comparative advantages
Construction, Engineering-Architecture, Technical Consultancy and Contracting Services: Establishing a structure that fits Turkey’s economic and social needs, that is compatible with high technology and international rules, that is sensitive to environment, that creates high value added, high foreign exchange inflow and high employment, that grants high service quality, and that relies on qualified human and physical capital.
Commercial Services: Increasing productivity and commercial trade volume in a competitive way, and to encourage technology and innovation.
Targets in ServicesTargets in Services
December 2012 Ministry of EconomyDecember 2012 Ministry of Economy 3737

Turkey's Share in Global Services Exports (%)Turkey's Share in Global Services Exports (%)
Source: WTO, CBRT
Turkey’s share in global exports of services was 0.92% in 2011.
December 2012 Ministry of EconomyDecember 2012 Ministry of Economy 3838
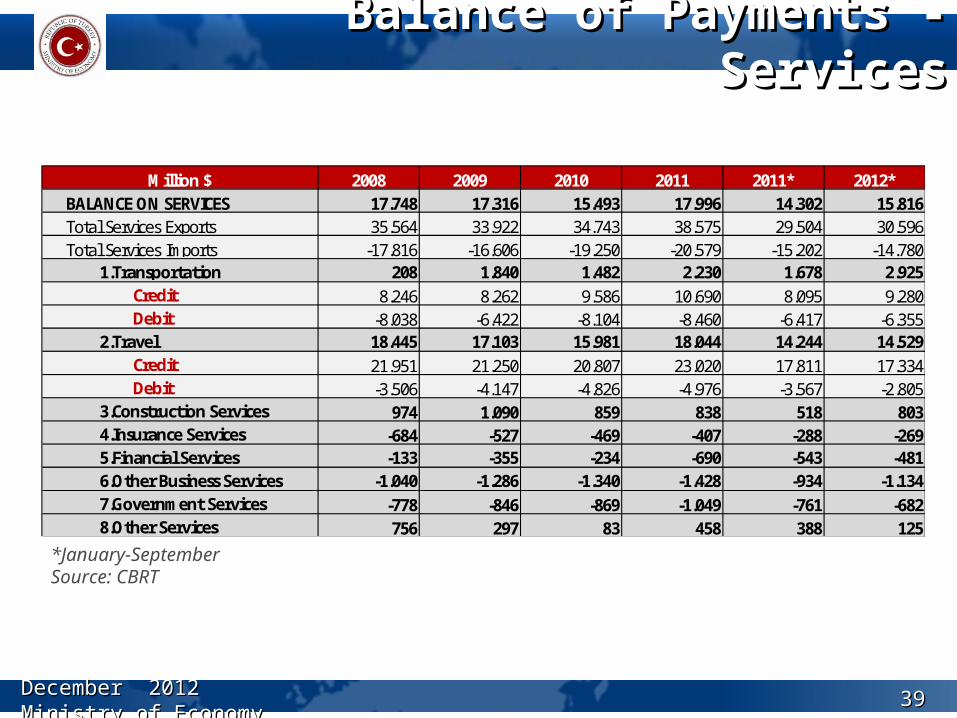
Balance of Payments - ServicesBalance of Payments - Services
*January-SeptemberSource: CBRT
December 2012 Ministry of EconomyDecember 2012 Ministry of Economy
Million $ 2008 2009 2010 2011 2011* 2012* BALANCE ON SERVICES 17.748 17.316 15.493 17.996 14.302 15.816 Total Services Exports 35.564 33.922 34.743 38.575 29.504 30.596 Total Services Imports -17.816 -16.606 -19.250 -20.579 -15.202 -14.780 1.Transportation 208 1.840 1.482 2.230 1.678 2.925 Credit 8.246 8.262 9.586 10.690 8.095 9.280 Debit -8.038 -6.422 -8.104 -8.460 -6.417 -6.355 2.Travel 18.445 17.103 15.981 18.044 14.244 14.529 Credit 21.951 21.250 20.807 23.020 17.811 17.334 Debit -3.506 -4.147 -4.826 -4.976 -3.567 -2.805 3.Construction Services 974 1.090 859 838 518 803 4.Insurance Services -684 -527 -469 -407 -288 -269 5.Financial Services -133 -355 -234 -690 -543 -481 6.Other Business Services -1.040 -1.286 -1.340 -1.428 -934 -1.134 7.Government Services -778 -846 -869 -1.049 -761 -682 8.Other Services 756 297 83 458 388 125
3939

Tourism Statistics (Quarterly, 1000)Tourism Statistics (Quarterly, 1000)
December 2012 Ministry of EconomyDecember 2012 Ministry of Economy
Tourists visited, Source: TURKSTAT Turkey ranks as the 6th in the world and the 4th in Europe among the
most favourite tourism destinations. Turkey’s income per tourist increased by 18% in 2010 and 1% in 2011.
4040

Contracting Services AbroadContracting Services Abroad
31 out of the world’s top 225 contracting companies are Turkish.
Turkey ranks as the 2nd country (following China) in terms of the number of top contracting companies.
Contributions to the overall economic performance: Creating foreign exchange inflow, exports, employment, technology transfer; adding to the machinery stock, facilitating internationalization
December 2012 Ministry of EconomyDecember 2012 Ministry of Economy
Years Projects CountriesCum. Project Volume (M $)
Avr. Project Volume (M$)
2002 131 32 2.570 202003 278 36 4.503 162004 423 38 11.322 272005 406 34 12.317 302006 519 36 24.256 472007 574 44 24.992 442008 620 39 24.359 392009 482 45 21.417 442010 574 50 22.320 392011 478 48 19.169 40
2012* 227 31 18.471 81* First 10 Months
4141

LogisticsLogistics
Europe’s biggest truck fleet (45 thousands trucks and 1,420 companies) Almost 1 million flights in 2011 (2.3 million tonnes freight and 117 million passengers) 25. biggest fleet in the world 45 airports and 51 ports Total length of divided highways will reach 15 thousand
kilometers. High-speed railway projects are carried out rapidly.
December 2012 Ministry of EconomyDecember 2012 Ministry of Economy 4242

EnergyEnergy
Turkey is an energy hub between energy producer and consumer regions
December 2012 Ministry of EconomyDecember 2012 Ministry of Economy 4343

C- INVESTMENTS, FOREIGN CAPITAL and C- INVESTMENTS, FOREIGN CAPITAL and INCENTIVESINCENTIVES
December 2012 Ministry of EconomyDecember 2012 Ministry of Economy 4444

Investment Climate in TurkeyInvestment Climate in Turkey
1- SOUND ECONOMIC PERFORMANCE 6- CENTRAL LOCATION2- YOUNG and DYNAMIC POPULATION
7- ENERGY CORRIDOR and TERMINAL of EUROPE
3- QUALIFIED and COMPETITIVE LABOR FORCE
8- LOW TAX RATES and INCENTIVE FACILITIES
4- LIBERAL and INNOVATIVE INVESTMENT CLIMATE
9- CUSTOMS UNION with EU and OPEN ECONOMY
5- INFRASTRUCTURE 10- DOMESTIC MARKET
10 REASONS TO INVEST IN TURKEY
December 2012 Ministry of EconomyDecember 2012 Ministry of Economy 4545

Time Time RRequired to equired to SStart a tart a BBusinessusiness
The required time to start a business is 6 days in Turkey.
Source: Invest In Turkey
December 2012 Ministry of EconomyDecember 2012 Ministry of Economy 4646
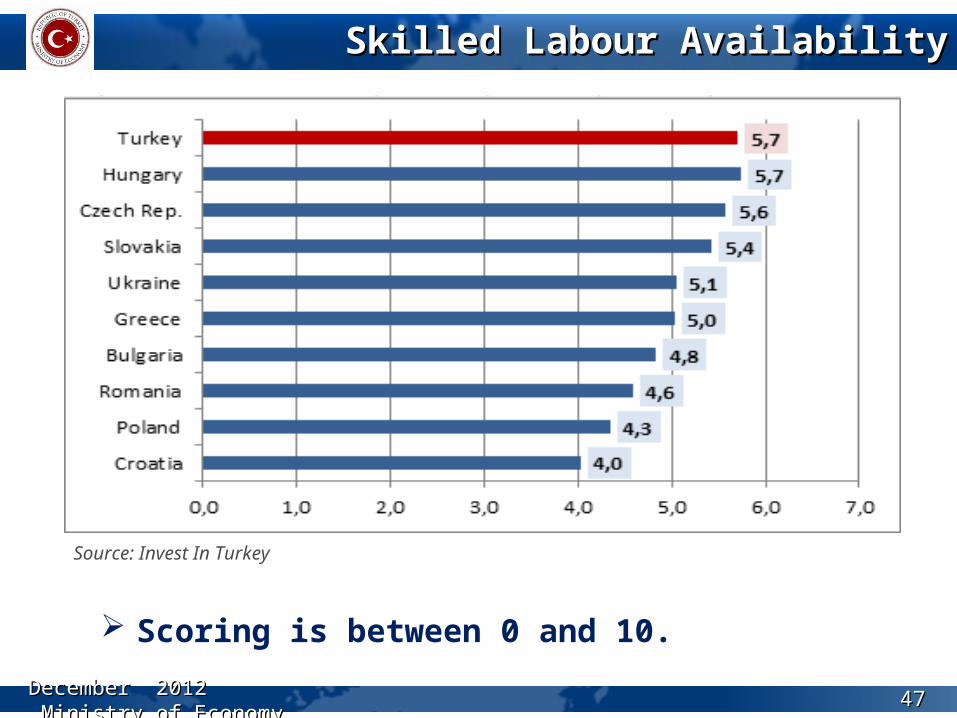
Skilled Labour AvailabilitySkilled Labour Availability
Scoring is between 0 and 10.
Source: Invest In Turkey
December 2012 Ministry of EconomyDecember 2012 Ministry of Economy 4747

Transparency in Finance SectorTransparency in Finance Sector
Source: Invest In Turkey
Scoring is between 0 and 10.
December 2012 Ministry of EconomyDecember 2012 Ministry of Economy 4848

The Sectoral Breakdown of Foreign InvestmentsThe Sectoral Breakdown of Foreign Investments
Source: CBRT
* January - September
DecemberDecember 2012 Ministry of Economy 2012 Ministry of Economy
(Million $) 2010 2011 2011* 2012*AGRICULTURE 80 32 26 34INDUSTRIAL SECTORS 2,884 7,830 4,607 4,537 Mining and Quarrying 135 144 43 146 Manifacturing 923 3,413 1,925 3,696 Production and Distribution of Electricity, Gas, 1,823 4,271 2,638 695SERVICES SECTOR 3,274 7,993 7,166 3,403
TOTAL 6,238 15,855 11,799 7,974
4949

Breakdown of Foreign Investments by CountryBreakdown of Foreign Investments by Country
Source: CBRT
DecemberDecember 2012 Ministry of Economy 2012 Ministry of Economy
* January – September
2010 2011 2011* 2012*1 England 245 917 698 1,9572 Austria 1,584 2,236 2,234 1,3943 Luxemburg 292 481 382 1,0444 Netherlands 486 1,588 1,253 8755 Germany 597 604 376 4146 Lebanon 29 44 42 3157 Switzerland 122 233 155 3078 Azerbaijan 12 1,265 10 2949 USA 323 1,402 641 278
10 Malaysia 6 15 11 23011 Italy 25 98 85 14912 Norway 19 76 40 9013 Spain 205 2,230 2,175 8414 France 623 986 949 7215 Republic of Korea 20 51 46 5116 Czech Republic 36 6 2 4117 Kuwait 193 38 28 3918 Greece 436 123 36 3719 Saudi Arabia 39 25 11 3520 Hong Kong 21 162 150 34
5,313 12,580 10,790 7,7746,238 16,060 11,799 7,974
LIST TOTALTOTAL
Million $
5050

Investment Incentive SystemInvestment Incentive System
The current investment incentive system of Turkey is structured in four sub systems:
General Investment Incentive System Regional Investment Incentive System Investment Incentive System for Big Scale
Projects Encouraging the Strategic Investments
DecemberDecember 2012 Ministry of Economy 2012 Ministry of Economy 5151

Investment Incentives (January-October)Investment Incentives (January-October)
Source: General Directorate of Incentive Implementation and Foreign Investment
December 2012 Ministry of EconomyDecember 2012 Ministry of Economy
*January-October
2010 3,501 47,082 110,3322011 3,787 46,764 109,2562012 3,511 40,054 116,771
Certificates Issued
Amount of Fixed Investments (Million TL)
Potential Employment
(People)
Region I Region II Region III Region IV Region V Region VI Various TOTAL2010 960 631 588 494 414 414 0 3,5012011 1,230 726 582 508 380 351 10 3,7872012 1,234 631 586 409 280 364 7 3,511
CERTIFICATES ISSUED
5252

D - FREE ZONES IN TURKEYD - FREE ZONES IN TURKEY
DecemberDecember 2012 Ministry of Economy 2012 Ministry of Economy 5353

Tax advantages for manufacturers Medium-and long-term investment view Availability to transfer profits Commercial facilities Exemptiın from customs duties Acquisition of the documents relating to the free movement of goods under the
scope of Customs Union with the EU Principle of equality No time restrictions Flexibility to adjust to the market needs and conditions Reliable inflation accounting Market access to domestic and foreign markets Reduced bureaucratic procedures and dynamic business management Strategic advantages. Affordable and compatible infrastructure Supply chain opportunities
The Advantages of Free Zones for UsersThe Advantages of Free Zones for Users
DecemberDecember 2012 Ministry of Economy 2012 Ministry of Economy 5454
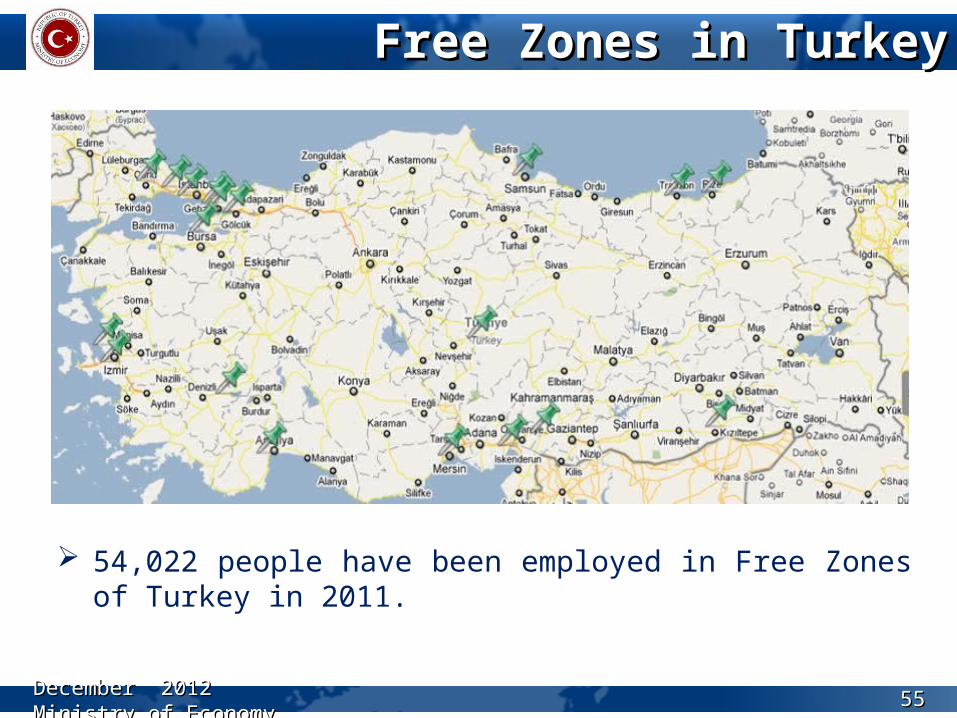
Free Zones in TurkeyFree Zones in Turkey
54,022 people have been employed in Free Zones of Turkey in 2011.
DecemberDecember 2012 Ministry of Economy 2012 Ministry of Economy 5555

Trade Flows of Free ZonesTrade Flows of Free Zones
In January-September 2012 total trade volume of the Free Zones reached to 16.9 billion dollars, decreasing 0.45% annually.
Source: General Directorate of Free Zones, Foreign Investments and Services
*January-September
DecemberDecember 2012 Ministry of Economy 2012 Ministry of Economy
Million $ 2008 2009 2010 2011 2011* 2012*From Domestic Market to Free Zones 3,195 2,177 2,295 2,668 1,902 2,249From Free Zones to Abroad 5,874 4,914 4,361 6,924 5,074 5,005From Abroad to Free Zones 8,248 5,493 6,626 7,253 5,600 5,340From Free Zones to Domestic Market 7,262 5,174 5,291 5,801 4,358 4,264
TOTAL TRADE VOLUME 24,578 17,757 18,572 22,646 16,934 16,857
5656
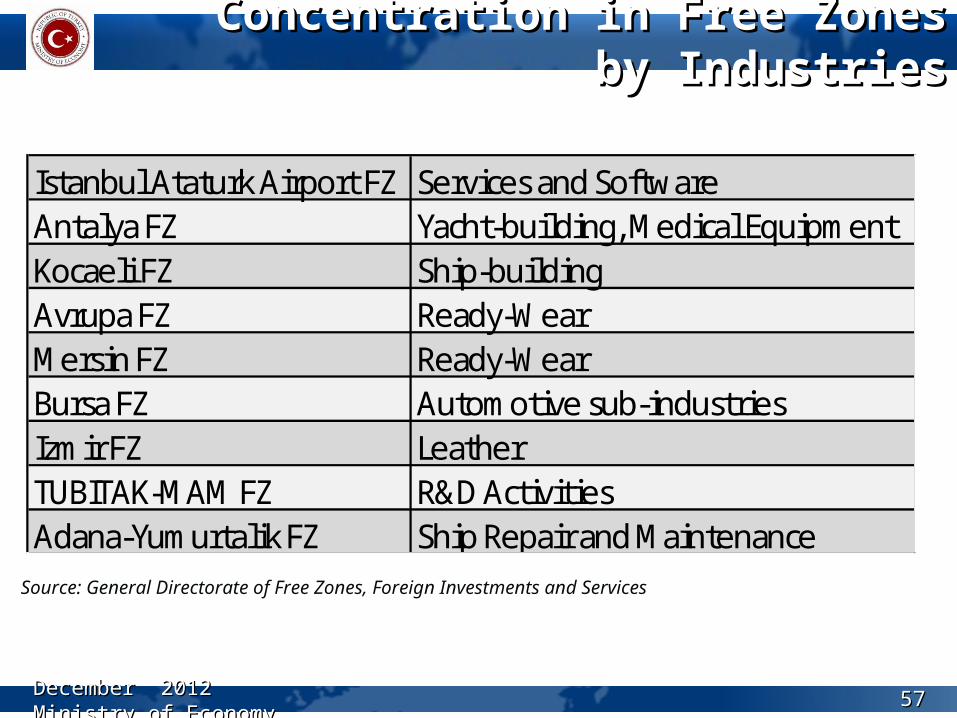
Concentration in Free Zones by IndustriesConcentration in Free Zones by Industries
Source: General Directorate of Free Zones, Foreign Investments and Services
Istanbul Ataturk Airport FZ Services and SoftwareAntalya FZ Yacht-building, Medical EquipmentKocaeli FZ Ship-buildingAvrupa FZ Ready-WearMersin FZ Ready-WearBursa FZ Automotive sub-industriesIzmir FZ LeatherTUBITAK-MAM FZ R&D ActivitiesAdana-Yumurtalik FZ Ship Repair and Maintenance
December 2012 Ministry of EconomyDecember 2012 Ministry of Economy 5757

E - E - BBIILATERAL, REGLATERAL, REGIIONAL, ONAL, PLURILATERAL and PLURILATERAL and MULTMULTIILATERAL LATERAL
TRADETRADE
DecemberDecember 2012 Ministry of Economy 2012 Ministry of Economy 5858

Trade Relationships of Turkey with OthersTrade Relationships of Turkey with Others
Bilateral Trade Relationships of Turkey
Europe, Asia-Pacific, Eurasia, Middle East and North Africa, Sub-Saharan Africa, Americas
Regional and Multiple Trade Relationships of Turkey
EU, ECO, D8, BSEC, OIC, COMCEC
Multilateral Trade Relationships of Turkey
WTO, OECD, ACTA
December 2012 Ministry of EconomyDecember 2012 Ministry of Economy 5959

Regional Breakdown of ExportsRegional Breakdown of Exports
Source: TURKSTAT
* January-October ** Except Lebanon and Mauritius
In January-October period of 2012, our exports to EFTA countries increased 58.3% and our exports to FTA countries increased 7.7% annually. The annual increase of our exports to ECO countries in the same period was 94.9% and ECO countries became the fastest growing export destination of the regions above.
DecemberDecember 2012 Ministry of Economy 2012 Ministry of Economy
(Million $) 2010 2011 Change %Share % (2011)
2011* 2012* Change %Share % (2012*)
CIS 10,288 13,376 30.0 9.9 10,941 12,365 13.0 9.8EFTA 2,416 1,887 -21.9 1.4 1,330 2,106 58.3 1.7Economic Cooperation Organisation 7,617 9,292 22.0 6.9 7,593 14,798 94.9 11.7Organization of Islamic Conference 32,470 37,325 15.0 27.7 30,369 46,516 53.2 36.8Black Sea Economic Cooperation 14,456 17,768 22.9 13.2 14,591 15,412 5.6 12.2FTA Countries** 12,694 13,602 7.2 10.1 11,238 12,105 7.7 9.6OECD 61,491 71,616 16.5 53.1 55,844 54,424 -2.5 43.1Turkic Republics 3,921 5,040 28.5 3.7 4,135 4,804 16.2 3.8
TOTAL 113,883 134,907 18.5 100.0 111,351 126,277 13.4 100.0
6060

Chronological Evolution of the Relationship between Turkey and the EUChronological Evolution of the Relationship between Turkey and the EU
12 September 1963: Ankara Agreement 13 November 1970: The signing of the Additional Protocol 1 January 1973: Additional Protocol to come into force 14 April 1987: Turkey’s Application for Membership 5 March 1995: The Association Council Decision Establishing the
Customs Union 10-11 December 1999: Recognition of the Candidate Status of
Turkey at the Helsinki Summit 8 March 2001: The first Accession Partnership Document issued 17 December 2004: European Council decision to start
Negotiations with Turkey in Brussels Summit 3 October 2005: Start of the Negotiations between Turkey and the
EU 20 October 2005: Start of the Screening Process 13 October 2006: End of the Screening Process
DecemberDecember 2012 Ministry of Economy 2012 Ministry of Economy 6161
The process of Accession Negotiations between Turkey and the EUThe process of Accession Negotiations between Turkey and the EU
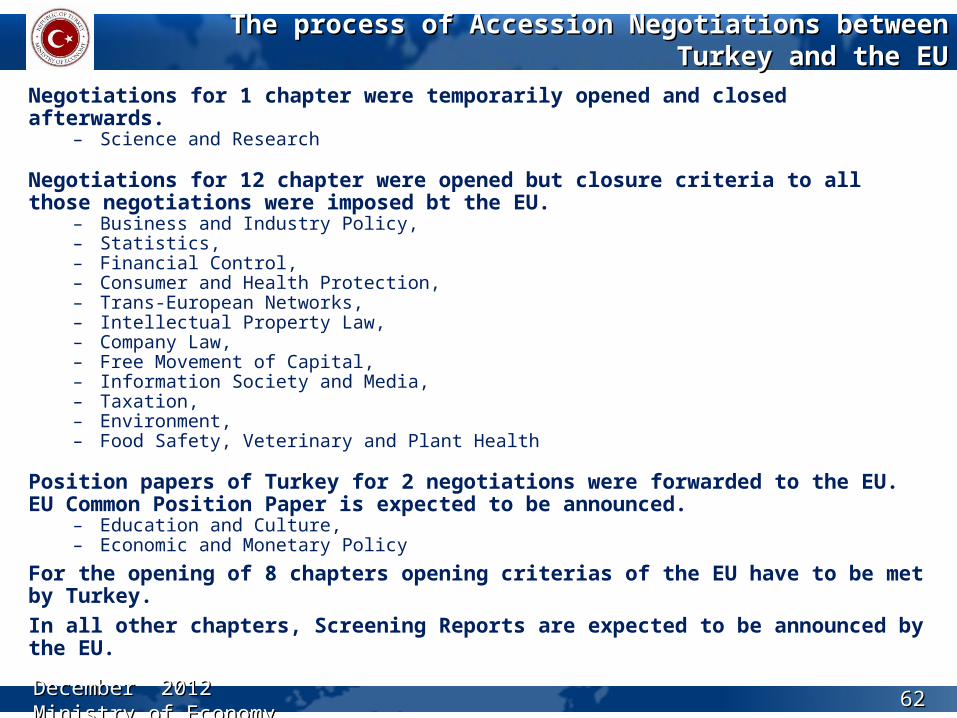
Negotiations for 1 chapter were temporarily opened and closed afterwards.– Science and Research
Negotiations for 12 chapter were opened but closure criteria to all those negotiations were imposed bt the EU.
– Business and Industry Policy, – Statistics, – Financial Control, – Consumer and Health Protection, – Trans-European Networks, – Intellectual Property Law, – Company Law, – Free Movement of Capital, – Information Society and Media, – Taxation, – Environment, – Food Safety, Veterinary and Plant Health
Position papers of Turkey for 2 negotiations were forwarded to the EU. EU Common Position Paper is expected to be announced.
– Education and Culture,– Economic and Monetary Policy
For the opening of 8 chapters opening criterias of the EU have to be met by Turkey.In all other chapters, Screening Reports are expected to be announced by the EU.
DecemberDecember 2012 Ministry of Economy 2012 Ministry of Economy 6262

Trade between Turkey and the EUTrade between Turkey and the EU
*January-OctoberSource: Data Source of the Ministry of Economy
DecemberDecember 2012 Ministry of Economy 2012 Ministry of Economy 6363

1. EFTA (Norway, Switzerland, Iceland, Liechtenstein)
2. Israel3. Macedonia4. Croatia5. Bosnia and Herzegovina6. Palestine7. Tunisia8. Morocco9. Syria
FTA CountriesFTA Countries
10. Egypt11. Albania12. Georgia13. Montenegro14. Serbia15. Chile16. Jordan17. Lebanon*18. Mauritius*19. South Korea*
(*) Agreements that are in the approval process
DecemberDecember 2012 Ministry of Economy 2012 Ministry of Economy 6464
Our exports to FTA Countries increased %7,2 in 2011. The share of FTA Countries in total exports reached
10,5%. Turkey recorded a trade surplus of 1,4 billion USD in
2011 with FTA Countries, while there was a trade deficit of 1.5 billion USD in 2002.
Trade with FTA CountriesTrade with FTA Countries
December 2012 Ministry of EconomyDecember 2012 Ministry of Economy 6565

Trade Representatives AbroadTrade Representatives Abroad
232 trade representatives from the Ministry are serving in 105 locations and 6 offices abroad.
DecemberDecember 2012 Ministry of Economy 2012 Ministry of Economy 6666

Daimi Temsilci Yardımcılığı
Ticaret Müşavirliği
Ticaret Ataşeliği
İrtibat Büroları
AFRİKA
KahireNairobi PretoriaRabatTrablusTunusKazablanka
ASYA
Astana Aşkabat Bangkok Bişkek Cakarta Duşanbe Hanoiİslamabad Kabil Kuala Lumpur Manila Pekin Seul Singapur
AVRUPA/KAFKASYAAVRUPA/KAFKASYAABDTÖOECDAtina Bakü Belgrad Berlin Bern BratislavaBrüksel Budapeşte Bükreş Dublin Helsinki Kiev Kişinev Kopenhag Lahey LizbonLefkoşa
Londra LubliyanaMadrid Minsk MoskovaOslo ParisPodgoricaPragPriştineRomaSaraybosna Sofya Stokholm TiflisTiran Üsküp Varşova Viyana Zagreb
BarselonaBatumDüsseldorfHamburgHannoverKazanMarsilyaMilanoMünihNovorossiskOdessaRotterdamSelanikSt. PetersburgStutgartBirminghamKrasnodarNovosibirskYekaterinburg
Taşkent Tokyo Ulan Bator Yeni Delhi AlmatıGuangzhouHong Kong KaraçiMumbaiŞangayGeorgetown
AbujaAddis Ababa AkraCezayirDakarDarüsselamHartumİskenderiye
Buenos Aires KarakasMexico CityOttavaSantiagoVaşingtonHoustonLos Angeles
AMERİKA
ORTA DOĞUORTA DOĞUAbu Dhabi Amman BağdatBeyrutDohaKuveytManama
MuskatRiyadSana ŞamTahranTel Aviv Basra
CiddeDubaiErbilHalepKudüsMusulTebriz
SidneyMelbourne
AVUSTRALYAAVUSTRALYA
New YorkSao PauloŞikagoTorontoMiamiSan FranciscoSeattle
GEORGETOWN
Locations of Trade RepresentativesLocations of Trade Representatives
December 2012 Ministry of EconomyDecember 2012 Ministry of Economy 6767

• Export Oriented Production Strategy and Input Supply Strategy
• Market Access Strategy• Supporting Exports • Trade Remedies• Restructuring the Incentive System• Improving the Investment Climate• Trade Agreements• Next-Generation Free Zones• Trade in Services and Turkish Investments Abroad • Market Surveillance and Inspection• Strengthening the Organization Abroad
Projects with Future ProspectsProjects with Future Prospects
DecemberDecember 2012 Ministry of Economy 2012 Ministry of Economy 6868