Minding the gap in Asia: foreign and local currency ratings · only 27% of countries in the B...
26
174 BIS Papers No 30 Minding the gap in Asia: foreign and local currency ratings Kate Kisselev 1 and Frank Packer 2 Introduction As governments embrace the goal of developing local currency bond markets as an alternative to inflows of foreign capital, 3 rating agencies now commonly assign a domestic currency rating to sovereigns in addition to a foreign currency one. In Asia, 18 major sovereigns with foreign debt ratings now have a domestic currency rating from a major rating agency. Usually the domestic rating is higher, reflecting the presumed greater ability and willingness of sovereigns to service debt denominated in their own currency. However, the gap between the two ratings is uniform neither across borrowers nor across agencies. The distinctions between local and foreign currency ratings are likely to have increasingly important implications for the development of capital markets globally and in Asia in particular. The degree to which rating policies favour a particular currency of denomination might provide significant incentives in terms of investor acceptance and market pricing. Rating policies might reinforce government policy initiatives and regulations as well. 4 In this paper, we first provide a comparative overview of domestic and foreign currency ratings globally and in Asia in particular. Asian credits are similar to the global sample in terms of both the newcomer status of local currency ratings and the tendency for the local/foreign currency rating gap to be largest in the lower investment grade/upper non-investment grade region. However, differences of opinion among rating agencies regarding the relative creditworthiness of local and foreign currency obligations are quite pronounced in Asia. Within a linear regression framework, we then examine the determinants of the difference between local and foreign currency ratings, and find evidence that differences among agencies are driven by distinctions in their overall rating policy rather than a distinct Asian factor per se. Other than the paper of Trevino and Thomas (2001), ours is 1 Former Vice President, Citigroup Global Country Risk Management. 2 This paper was completed in early 2005. Márcia Elyseau provided helpful research assistance. Thanks are also due to Robert McCauley, as well as the discussant at the BIS-Korea University Asian bond markets conference, Thomas Byrne, for useful comments at an earlier stage of the paper. Participants in the BIS workshop on bond markets in Hong Kong, and the 17th annual Australasian Banking and Finance Conference in Sydney in 2004, also provided useful comments. The views expressed do not necessarily represent those of the Bank for International Settlements or Citigroup. 3 While the first Asian Bond Fund invested in dollar-denominated debt, East Asian central banks announced in late 2004 the launch of a second fund with a mandate to invest in domestic currency denominated bonds. See the press statement of the Executives’ Meeting of East Asia-Pacific Central Banks (EMEAP), 16 December 2004. 4 For the most part, regulations that key off agency ratings make little distinction between foreign and domestic currency rated claims. Those exceptions that do exist favour domestic currency ratings and/or domestic currency claims. For instance, under the standardised approach of Basel II, a new capital adequacy framework for banks, in the case of foreign currency exposures to multilateral development banks whose convertibility and transfer risk are “considered by national supervisory authorities to be effectively mitigated”, the domestic currency rating may be used for risk weighting purposes instead of the foreign currency rating (see Basel Committee on Banking Supervision (2004)). In addition, the framework gives national authorities the general discretion to apply even lower risk weights to their banks’ exposures to sovereign (or central bank) domestic currency obligations, which is not the case with foreign currency obligations.
Transcript of Minding the gap in Asia: foreign and local currency ratings · only 27% of countries in the B...

174 BIS Papers No 30
Minding the gap in Asia: foreign and local currency ratings
Kate Kisselev1 and Frank Packer2
Introduction
As governments embrace the goal of developing local currency bond markets as an alternative to inflows of foreign capital,3 rating agencies now commonly assign a domestic currency rating to sovereigns in addition to a foreign currency one. In Asia, 18 major sovereigns with foreign debt ratings now have a domestic currency rating from a major rating agency. Usually the domestic rating is higher, reflecting the presumed greater ability and willingness of sovereigns to service debt denominated in their own currency. However, the gap between the two ratings is uniform neither across borrowers nor across agencies.
The distinctions between local and foreign currency ratings are likely to have increasingly important implications for the development of capital markets globally and in Asia in particular. The degree to which rating policies favour a particular currency of denomination might provide significant incentives in terms of investor acceptance and market pricing. Rating policies might reinforce government policy initiatives and regulations as well.4
In this paper, we first provide a comparative overview of domestic and foreign currency ratings globally and in Asia in particular. Asian credits are similar to the global sample in terms of both the newcomer status of local currency ratings and the tendency for the local/foreign currency rating gap to be largest in the lower investment grade/upper non-investment grade region. However, differences of opinion among rating agencies regarding the relative creditworthiness of local and foreign currency obligations are quite pronounced in Asia. Within a linear regression framework, we then examine the determinants of the difference between local and foreign currency ratings, and find evidence that differences among agencies are driven by distinctions in their overall rating policy rather than a distinct Asian factor per se. Other than the paper of Trevino and Thomas (2001), ours is
1 Former Vice President, Citigroup Global Country Risk Management. 2 This paper was completed in early 2005. Márcia Elyseau provided helpful research assistance. Thanks are
also due to Robert McCauley, as well as the discussant at the BIS-Korea University Asian bond markets conference, Thomas Byrne, for useful comments at an earlier stage of the paper. Participants in the BIS workshop on bond markets in Hong Kong, and the 17th annual Australasian Banking and Finance Conference in Sydney in 2004, also provided useful comments. The views expressed do not necessarily represent those of the Bank for International Settlements or Citigroup.
3 While the first Asian Bond Fund invested in dollar-denominated debt, East Asian central banks announced in late 2004 the launch of a second fund with a mandate to invest in domestic currency denominated bonds. See the press statement of the Executives’ Meeting of East Asia-Pacific Central Banks (EMEAP), 16 December 2004.
4 For the most part, regulations that key off agency ratings make little distinction between foreign and domestic currency rated claims. Those exceptions that do exist favour domestic currency ratings and/or domestic currency claims. For instance, under the standardised approach of Basel II, a new capital adequacy framework for banks, in the case of foreign currency exposures to multilateral development banks whose convertibility and transfer risk are “considered by national supervisory authorities to be effectively mitigated”, the domestic currency rating may be used for risk weighting purposes instead of the foreign currency rating (see Basel Committee on Banking Supervision (2004)). In addition, the framework gives national authorities the general discretion to apply even lower risk weights to their banks’ exposures to sovereign (or central bank) domestic currency obligations, which is not the case with foreign currency obligations.

BIS Papers No 30 175
the first to empirically estimate the determinants of the local and foreign currency gap for sovereign credits.
Foreign and local currency ratings
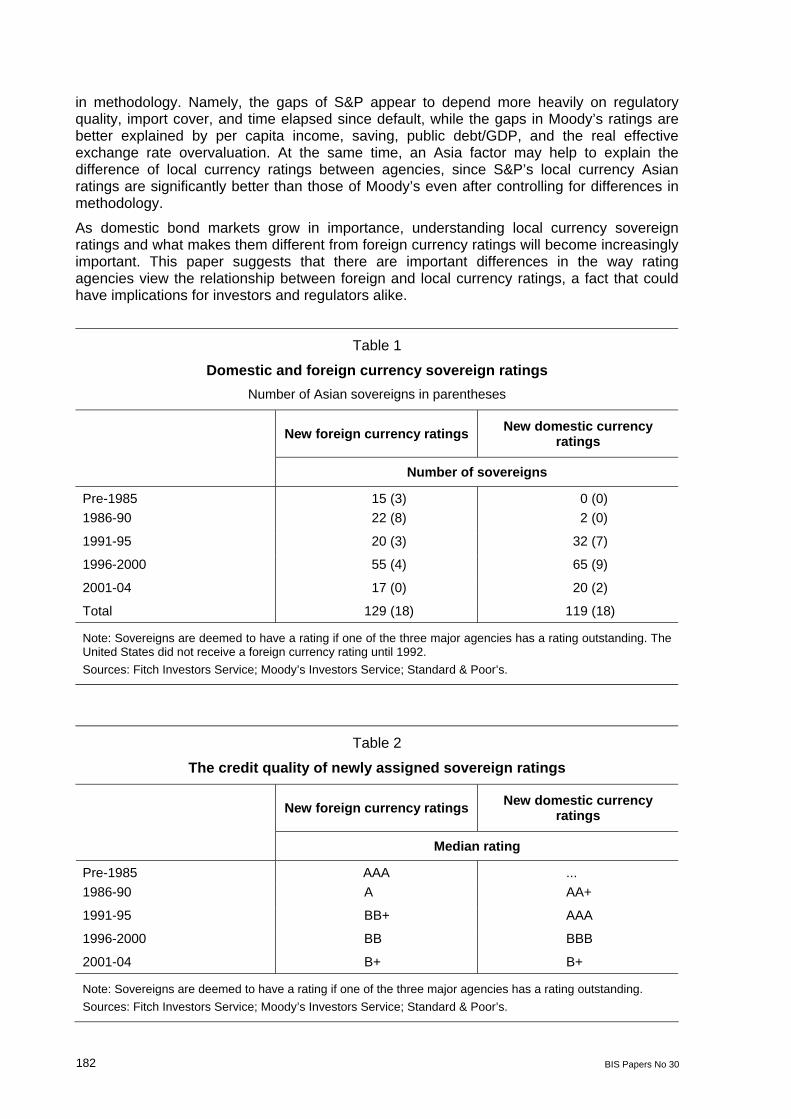
Over the past few decades, the business of providing sovereign ratings has grown considerably. As of 1985, only 15 countries obtained credit agency bond ratings to borrow in international capital markets. Most of these countries were rated AAA; less financially strong countries relied on bank finance or privately placed bonds. However, over the past 15-20 years, countries at the lower end of the credit quality spectrum have relied increasingly on bond markets, and obtained a credit rating for that purpose.
Initially, most of the new sovereign ratings applied to foreign currency debt, as sovereigns apparently felt little need to obtain a rating for domestic currency obligations. But sovereigns gradually moved to having domestic currency ratings, a likely reflection of efforts to increase the investor base for domestic currency bonds (Tables 1 and 2).
Pretty much the same story holds with Asian ratings. Among Asian sovereigns, only Japan and Australia had foreign currency ratings as of 1975, but more than half of the 18 Asian sovereigns had a foreign currency rating by 1990. And although none had a local currency rating before 1990, the catch-up is now complete, which parallels the global rating phenomenon (Tables 1 and 3).
What might drive the rating gap?
Rating agencies often give higher ratings to the domestic currency obligations of sovereign states than to their foreign currency ones. This is a global phenomenon: for instance, the average gap between Standard & Poor’s local and foreign currency ratings was 0.7 notches globally in late 2004, while the Moody’s gap was 0.4 notches. Differences are often justified in terms of the sovereign’s ability to tax and appropriate domestic currency assets, which is often judged to be greater than in the case of foreign currency assets. In addition, while the sovereign must generate foreign exchange to repay foreign currency debts, it can print money to meet domestic currency obligations (see, for example, Fitch Investors Service (2003)).5
Following this logic, constraints on the sovereign’s ability to print domestic currency would tend to reduce the justification for a rating gap. Prime examples would be sovereigns that use the currencies of foreign countries, such as Panama and El Salvador. The countries of the euro area are also special cases; here the delegation of monetary policy to the ECB has greatly diminished the distinctions drawn between local and foreign currency debt.6 Countries
5 Another frequently cited justification for notching is that the incidence of default on local currency debt has
been lower than that on foreign currency debt (S&P (2003)). However, this is usually based on the default statistics, which include defaults on bank debt. As for the cases of default on rated bonds, the limited default experience to date suggests that it is not obvious that default on foreign currency bonds tends to precede or be more likely than that on domestic currency bonds (see Packer (2003)).
6 Though there was a difference of approach over whether foreign currency ratings should be upgraded or domestic currency ratings downgraded, the major rating agencies eliminated or narrowed outstanding domestic/foreign currency rating gaps for euro area countries ahead of and during the transition to the euro (for further discussion, see McCauley and White (1997)).

176 BIS Papers No 30
whose local currency obligations are held by foreigners may also have smaller rating gaps. In these countries, it is the local banking system, rather than the sovereign, that must hedge foreign investments in local currency denominated sovereign debt, and the government may be unwilling to print money if that would impose substantial costs on the banking system. More generally, the frequent existence of significant political costs to high levels of inflation should limit the applicability of the “printing press” argument for high domestic currency ratings.
Another possible exception would be if foreign currency issuance is small relative to the total debt outstanding of a sovereign. After all, one of the underlying principles of sovereign debt analysis is that sovereign risk always depends on the willingness as well as the ability to pay. Given a small enough burden, the sovereign might conceivably make an extra effort to avoid default on foreign currency obligations. It is likely that the relatively small size of the international bonds of emerging market countries in the early 1980s explains why the default experience on bonds at that time was rather limited, despite a range of bank loan restructuring programmes.
Another factor influencing the size of the gap is a purely technical one: there is no rating higher than AAA (Aaa) in the rating agencies’ symbology. The additional credit standing that a foreign currency AAA credit might gain by being denominated in domestic currency is unobservable. In addition, countries that are AA+ can only be raised by one notch, and so forth. Notching should thus become more pronounced and frequent as the foreign currency rating drifts downwards from AAA and AA, which is in fact what we generally observe both globally and in Asia. Little surprise, then, that countries such as Malaysia and the Philippines have marked notching relative to highly rated Singapore, Australia and New Zealand, which have little to no room for a notching-up on their domestic currency obligations.
On the other hand, it appears that the gap peaks in the mid-grade rating category BB. For instance, according to Standard & Poor’s, 83% of all rated sovereigns in the BB category in late 2004 had domestic currency obligations that were rated at least one notch higher than foreign currency obligations (Table 4). By contrast, the relative advantage of domestic currency obligations was much smaller for countries that are further below investment grade; only 27% of countries in the B category enjoy a rating gap. For its part, Standard & Poor’s posits that low-rated countries face risks, such as high degrees of social and political stress, that would also impair their ability to keep servicing domestic obligations in circumstances where foreign currency debts were allowed to default (S&P (2002)).
Asia does follow the same global hump-shaped pattern in the distribution of rating gaps, as is evident in Table 4. The propensity for rating gaps to exceed one notch is noticeable in the A range, where two out of three sovereigns - Korea and Malaysia - have large gaps. Meanwhile, Indonesia has one of the lowest ratings among Asian sovereigns and gets only a single one-notch improvement in the local currency rating from only one of the rating agencies.
Differences among the rating agencies
There are surprisingly sharp differences among the rating agencies with respect to the frequency at and degree to which domestic obligations are given favourable ratings. In particular, Moody’s tends to notch up its domestic currency rating much less frequently than the other agencies; for instance, in November 2004 it gave a higher domestic currency rating on only 30% of its rated universe of sovereigns, compared with 44% for S&P (Table 5).

BIS Papers No 30 177
Moody’s also assigned a higher foreign currency rating than domestic currency rating in four cases,7 with a relatively small proportion of outstanding foreign currency debt relative to foreign exchange reserves always cited as a reason (see Moody’s (2003c,d)). By contrast, S&P did not assign a higher foreign currency rating to any sovereign, while Fitch assigned a higher foreign currency rating only in the case of Japan.
Consistent with this global finding, Asian countries see far less notching from Moody’s than from Standard & Poor’s (Table 6). In fact, the differences are starker in the case of Asia: the average gap between S&P’s foreign and local currency ratings was 0.9 notches in Asia, even wider than the 0.6 notch gap for non-Asian countries (Table 6). At the same time, Moody’s actually notched Asian countries in the other direction, on average, with a mean Asian gap of –0.3 notches compared to a gap of 0.5 notches for non-Asians. This pattern, that the Asia subsample shows an accentuation of the differences in notching policies among the agencies, has held since 1995, when Asian sovereigns began to receive foreign and local currency ratings widely. In the regression analysis to follow, we explore possible reasons why this may be the case.
Regression analysis
The previous sections present the stylised facts that, in the case of S&P ratings, there is more likely to be a gap between the foreign currency and domestic currency ratings if a country is in Asia, and that such a gap is likely to be larger if a country is in Asia rather than elsewhere. In the case of Moody’s, rating gaps in Asia are smaller than elsewhere. Are these facts simply the by-product of different observable endowments among the Asian economies versus elsewhere, which might tend to magnify both the gap and the agency differences, given the agencies’ respective rating technologies? Or rather, might there be an unobserved factor common to Asia that is driving the results, reflecting rating agency biases and/or omitted variables?
Previous literature According to general descriptions of the rating process by the rating agencies themselves (see Moody’s (2003a, 2004) and S&P (2002, 2004), sovereign local and foreign currency ratings are based on a wide array of quantitative and qualitative factors that are intended to capture political risk, income and economic structure, growth, monetary policy, budgetary and public debt management, and external liquidity and debt. However, quantitative studies of ratings - such as Cantor and Packer (1996), Moody’s (2003b) and Borio and Packer (2004) - find that most of the variance in Moody’s and S&P ratings can be explained by a relatively small number of variables. Typically, the debt burden itself, default history, per capita income and economic growth are important as indicators of a country’s wealth and ability to pay, and indices of political risk are also important, presumably because they proxy for willingness to pay.
Partly because they have been around longer, the literature is more developed with regard to the determinants of foreign currency ratings. Specifically, Cantor and Packer (1996) found that per capita income, inflation, external debt, economic development, and default history were particularly strong predictors of foreign currency ratings. A weaker relationship existed between sovereign ratings and GDP growth and the fiscal balance, and there was no statistical relationship between ratings and the external balance. Moody’s (2004) found that
7 The four countries are India, Lebanon (one notch), Turkey (two notches) and Japan (five notches).
178 BIS Papers No 30
per capita income, debt/exports, growth, external transfer risk, and government effectiveness explain 91% of the variation in its own foreign currency ratings. In addition to many of the above-listed variables, Borio and Packer (2004) also found corruption perceptions to have significant explanatory power in predicting variation in a panel of foreign currency ratings.
The examination of the determinants of local currency ratings includes another study of Moody’s (2003b), which found that government debt/government revenue, per capita income, growth, and government effectiveness explained 87% of the variation in Moody’s local currency ratings. In a study of the gap between local and foreign currency ratings, which used a probit methodology, Trevino and Thomas (2001) looked at many of the variables discussed above and also added measures of the term structure of bank debt, a country’s share of bank lending, bank commitments, bank borrowing/ deposits, reserves and IMF credit usage, rating agency dummy variables, and regional dummy variables. The authors found regional and rating agency biases present even after the inclusion of these variables.
Methodology To address our questions about what is driving the prevalence and magnitude of rating gaps in Asia and globally, we estimate regression models for the foreign currency ratings of Moody’s and S&P, the local currency ratings of each agency, and the gap between the foreign currency and local currency ratings. We also estimate a set of regressions where the left-hand side variables are the differences between Moody’s and S&P’s local currency ratings, foreign currency ratings, and notching gaps. In each of our regressions, we use a fixed effects specification and examine the Asian countries’ fixed effects for evidence of an unobserved common factor.
We proceed by identifying 61 variables that reflect political risk, default history, external debt burden, macroeconomic performance, and government financial management, and we collect annual data on these variables for the 101 countries that have both foreign currency and local currency ratings at either S&P or Moody’s from 1995 to 2003.8 Ratings are recoded numerically with AAA and Aaa equal to 1, AA+ and Aa1 equal to 2, and so on. Each end-year rating is assumed to be the function of explanatory variables from that same year, and the candidate explanatory variables are listed in Table 7. In many cases, these variables may capture overlapping aspects of ability and willingness to repay foreign or local currency debt, so we pare the list of variables in each regression by identifying subcategories of variables that may capture the same concept. These subcategories are also listed in Table 7.
We start by fitting a regression model to S&P foreign currency ratings. Within each subcategory of variables, we test the fit of each variable separately. For example, we start by testing the fit of each of the CPI-related variables. If no CPI variable is significant at the .10 level, we proceed to the GDP growth subcategory, leaving out a CPI variable. In cases where only one CPI variable is significant, we retain it while testing GDP growth variables. In cases where several CPI variables are separately significant, we include them together in the regression to see whether they are robust to one another’s inclusion. We then eliminate variables that are not robust according to t-statistic, and retain robust CPI variables while testing GDP growth variables. After moving through all subcategories in this way, we then eliminate variables that are no longer statistically significant at the .10 level to arrive at the final S&P foreign currency specification. Hausman tests in nearly every specification suggest
8 The sample criteria are that a country must have a foreign currency rating and a local currency rating from
either S&P or Moody’s at any time between 1995 and 2003, and all economic, political, and financial indicators must be available from the sources listed in Table 7.

BIS Papers No 30 179
that fixed effects rather than random effects are present, so we retain a fixed effects specification for consistency throughout. F-tests in every regression specification confirm the importance of the fixed effects. All regressions are estimated in SAS with two-way (cross-sectional and time-series) fixed effects, and we require countries to have more than one time-series observation in each regression.
We follow the same procedure for Moody’s foreign currency ratings, except that the starting point is the final S&P specification, for convenience. We first eliminate variables that are not significant for Moody’s, and then move through the subcategories again, testing candidate variables in the same way as we did in fitting the S&P model.
Our starting point for the S&P (Moody’s) local currency rating specification is the S&P (Moody’s) foreign currency specification. The starting point for the S&P (Moody’s) rating gap specification is the union of variables in the S&P (Moody’s) foreign currency and local currency specifications. Similarly, the starting point for the S&P-Moody’s foreign currency (local currency) rating difference specification is the union of variables in the S&P and Moody’s foreign currency (local currency) rating specifications.
Rating regressions The final regressions of S&P and Moody’s foreign currency ratings on full sets of explanatory variables are shown in the first two columns of Table 8. In both regressions, all of the explanatory variables are significant at the .05 level and take the expected signs. Per capita GDP is significant at both agencies, with higher levels of income leading to better ratings. While higher per capita GDP may well imply higher costs associated with default, this variable is also likely to proxy for other indicators of development and creditworthiness. M2/reserves is also significant at both agencies, and this variable captures monetary volatility, excess monetary liquidity, and reserve volatility, so that greater variation in this ratio leads to a worse foreign currency rating. Investment is significant at both agencies and has the expected interpretation: higher rates of investment should generate the ability to repay debts. Overall political risk is an important determinant of both agencies’ ratings; higher levels of political risk are associated with worse ratings. The importance of political risk is underscored by the fact that an additional source of political risk is significant in each agency’s ratings, with control of corruption associated with better S&P ratings, and regulatory quality associated with better Moody’s ratings. Finally, the time elapsed since the last default on foreign currency obligations is also important at both agencies, with longer periods without default associated with better ratings.
The most obvious difference between the agencies’ foreign currency rating methodologies is in the treatment of debt and external vulnerability, two critical components of foreign currency ratings. Standard & Poor’s appears to focus on total public sector indebtedness, with higher public debt/GDP ratios resulting in worse ratings. It also considers exchange rate regime, with pegged and managed floating regimes penalised by half a notch. The significance of the exchange rate regime variable highlights the view that rigid exchange rates may be a direct constraint on debt servicing capacity; if governments must use reserves to defend a currency, less foreign exchange remains available for debt servicing. By contrast, Moody’s appears to weight more directly the net external debt burden, as a fraction of exports.
Adding country-specific fixed effects to the regression improves the fit, as all of the cross-sectional fixed effects are significant. It is noteworthy that although the average of the fixed effects in both the S&P and Moody’s regressions implies ratings for Asian sovereigns that are 1.4-1.5 notches better on average than for other countries, there is enough variation within the country fixed effect coefficients that an F-test cannot reject the hypothesis of no difference between Asian and non-Asian countries. Thus, higher credit ratings in Asia can be explained more on the basis of better fundamentals in Asian countries and country-specific factors than the result of an “Asia factor”.
180 BIS Papers No 30
Regressions of the local currency ratings of each agency on the explanatory variables are presented in the final two columns of Table 8. All variables are significant at the .05 level and all coefficients take the correct signs. As in the foreign currency rating regressions, per capita GDP is an important explanatory variable for both agencies. Public debt/GDP is now significant for both agencies as well. However, while Moody’s appears to weight more heavily in its assessments the variables of economic growth and M2/reserves, S&P appears to weight many more additional variables, including inflation, investment, political risk, control of corruption, exchange rate rigidity, the nominal exchange rate change, and the time elapsed since the last local currency default. The relative parsimony of the Moody’s regression bears out the agency’s own finding that most of the variation in its local currency ratings can be explained with just a few variables (Moody’s (2003b)).
The local currency regression results are consistent with our earlier findings regarding Asian foreign currency ratings. While the average Asian fixed effect is 1.1-1.2 notches better than that of non-Asian countries, this difference is not statistically significant, so we conclude that better average Asian local currency ratings tend to be driven by fundamentals and country-specific effects rather than an “Asia factor”.
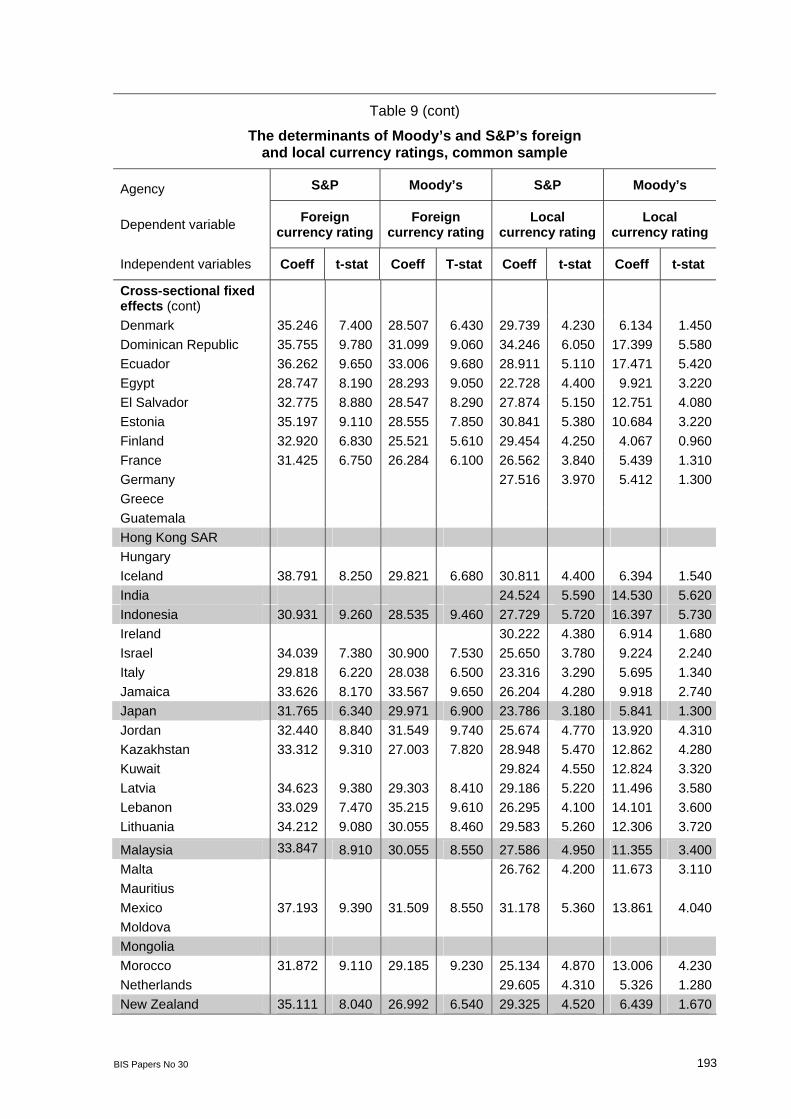
One of the drawbacks of the above approach to discerning differences in rating agency methodology is the fact that the agencies have rated different sets of countries over time, and it may be these differences in samples, rather than differences in methodology, that drive the regression results. To control for this effect, we impose the requirement that the S&P and Moody’s samples be the same and rerun the regressions (Table 9). The explanatory variables from the foreign currency rating regressions are highly robust, with all variables still significant at the .10 level and all coefficients remaining at roughly the same order of magnitude. The Moody’s local currency regression is also robust to the sample change. The S&P local currency regression is slightly less robust, with three variables becoming insignificant when we change the sample: the investment, political risk score, and exchange rate rigidity variables are no longer significant at the .10 level.
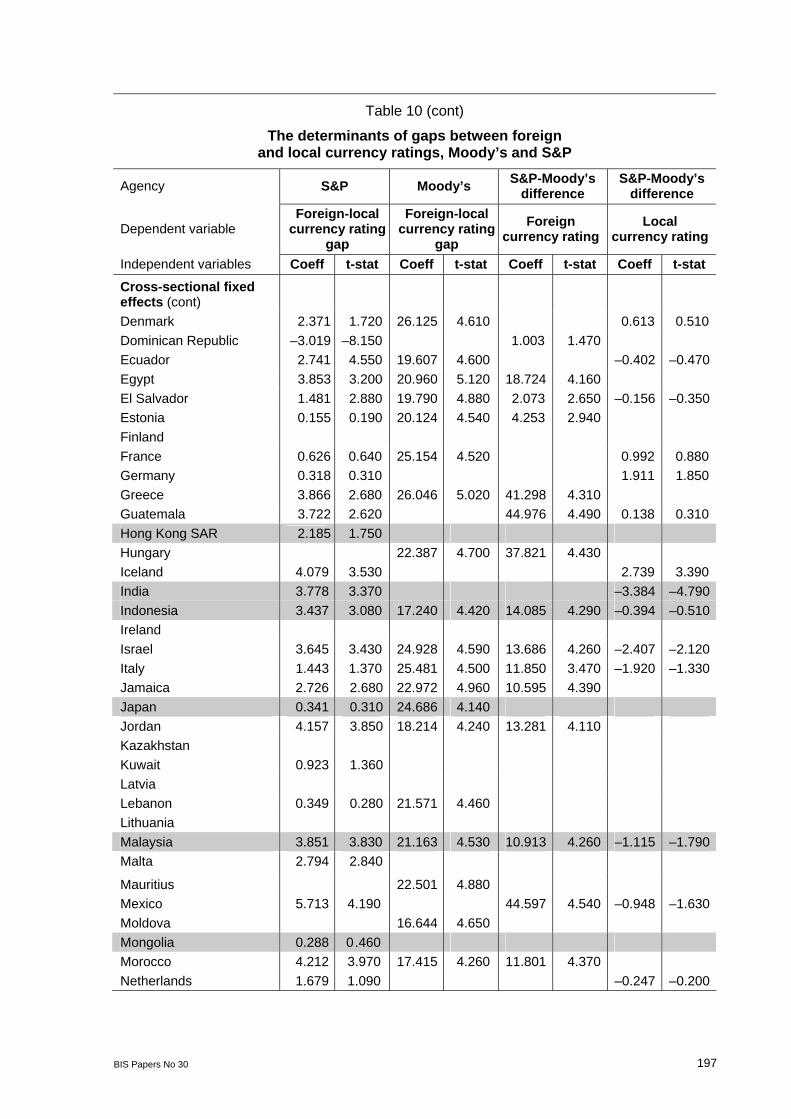
Rating gap regressions Next, we report the results of regressions of the gap between local and foreign currency ratings of S&P and Moody’s on the explanatory variables (Table 10, first two columns). Our convention is that a positive gap means that the local currency rating is better than the foreign currency rating. Among the variables, inflation, M2, and M2/reserves are important determinants of the gap between foreign and local currency ratings at both agencies. High inflation tends to lead to a smaller gap between ratings, consistent with high levels of inflation eroding the creditworthiness of the sovereign across the board and thus diminishing the relative safety of local currency obligations. The positive coefficients on the change in M2 or M2/reserves suggest that monetary expansion is initially associated with relatively safer local currency obligations, though the negative coefficients on the volatility of the same variables suggest that this effect has diminishing marginal returns, perhaps for the same reason that high inflation is associated with a diminished rating gap.
Some variables explain rating gaps for Moody’s rating only. Per capita GDP is significant in the Moody’s regression, with higher levels of income associated with smaller rating gaps. This variable may well be picking up the fact that sovereigns with the best foreign currency ratings cannot enjoy a rating gap because they are already at the top of the rating scale, though it is not clear why such an effect would only hold for Moody’s. Saving is also significant in the Moody’s regression, with higher saving rates permitting larger rating gaps. When a sovereign can tap a large pool of local savings, Moody’s may view it as easier for the sovereign to roll over local currency debt and avoid default. Public debt/GDP leads to smaller rating gaps in the Moody’s regression, which suggests that Moody’s views very heavy debt burdens as making default more likely on all debt, regardless of currency. Real effective exchange rate overvaluation also leads to larger gaps at Moody’s, and this may illustrate the

BIS Papers No 30 181
fact that it is expensive to maintain an overvalued exchange rate, and using foreign exchange to defend a currency reduces the availability of foreign exchange for repaying debt.
A few variables enter uniquely into the S&P gap regressions as well. For instance, the measures of regulatory quality and import cover lead to larger rating gaps in the S&P regression, while the time elapsed since local currency default narrows the gap. The latter result perhaps indicates that S&P is more likely to view longer default-free periods as an important sign of creditworthiness on all obligations, which should diminish any foreign-local currency differential.
In the gap regressions, the fixed effect for Asian countries is even more muted than it was in the simple foreign and local currency rating regressions. Both the Moody’s and S&P regressions suggest that the average expected Asian rating gap is nearly equal to the expected gap in other countries. This finding supports the view that the different degree of “notching” in Asia between local and foreign currency ratings can be better explained by broadly applicable fundamentals than by Asia-specific factors.
Rating difference regressions The regressions discussed above suggest that the rating agencies may weight variables differently when they assess foreign and local currency creditworthiness. In order to further investigate how the rating agency methodologies differ, we regress the difference between S&P and Moody’s foreign currency ratings, and then the difference between their local currency ratings, on the explanatory variables, with the results reported in the final two columns of Table 10. Here, our convention is that positive differences imply a better rating by Moody’s.
As in the gap regressions, inflation, M2, and M2/reserves are important determinants of the differences between the agencies’ foreign and local currency ratings. S&P tends to weight inflation more heavily as a negative factor in local currency ratings, but relatively less heavily as a negative factor for foreign currency ratings. S&P also tends to weight monetary expansion less heavily as a negative factor for both foreign and local currency ratings. Additionally, control of corruption, domestic debt/GDP, budget revenue/GDP, short-term debt/GDP, exchange rate changes, and time elapsed since default all appear to be weighted significantly differently across the agencies.
Two final findings are that while average Asian fixed effects do not provide assistance in predicting differences between Moody’s and S&P foreign currency credit ratings, there is a significant Asian effect in the difference between S&P and Moody’s local currency ratings. That is, S&P’s Asian local currency rating are significantly better than those of Moody’s, even after controlling for differences in rating methodology.
Conclusion
This paper has analysed the patterns of the foreign and local currency ratings of S&P and Moody’s both in Asia and globally, with a particular emphasis on whether ratings and the gaps between foreign and local currency ratings are driven by the same factors in Asia as elsewhere in the world, and whether the different rating agencies take the same approach to ratings and gaps. We find that rating gaps in Asia can be explained by many of the same factors that drive gaps globally, and that the evidence for an Asia-wide effect on ratings is slim.
The local-foreign currency rating gaps of both agencies can be partly explained by inflation, M2, and M2/reserves, but we also find evidence of a divergence across the rating agencies
182 BIS Papers No 30
in methodology. Namely, the gaps of S&P appear to depend more heavily on regulatory quality, import cover, and time elapsed since default, while the gaps in Moody’s ratings are better explained by per capita income, saving, public debt/GDP, and the real effective exchange rate overvaluation. At the same time, an Asia factor may help to explain the difference of local currency ratings between agencies, since S&P’s local currency Asian ratings are significantly better than those of Moody’s even after controlling for differences in methodology.
As domestic bond markets grow in importance, understanding local currency sovereign ratings and what makes them different from foreign currency ratings will become increasingly important. This paper suggests that there are important differences in the way rating agencies view the relationship between foreign and local currency ratings, a fact that could have implications for investors and regulators alike.
Table 1
Domestic and foreign currency sovereign ratings Number of Asian sovereigns in parentheses
New foreign currency ratings New domestic currency ratings
Number of sovereigns
Pre-1985 15 (3) 0 (0) 1986-90 22 (8) 2 (0)
1991-95 20 (3) 32 (7)
1996-2000 55 (4) 65 (9)
2001-04 17 (0) 20 (2)
Total 129 (18) 119 (18)
Note: Sovereigns are deemed to have a rating if one of the three major agencies has a rating outstanding. The United States did not receive a foreign currency rating until 1992. Sources: Fitch Investors Service; Moody’s Investors Service; Standard & Poor’s.
Table 2
The credit quality of newly assigned sovereign ratings
New foreign currency ratings New domestic currency ratings
Median rating
Pre-1985 AAA ... 1986-90 A AA+
1991-95 BB+ AAA
1996-2000 BB BBB
2001-04 B+ B+
Note: Sovereigns are deemed to have a rating if one of the three major agencies has a rating outstanding. Sources: Fitch Investors Service; Moody’s Investors Service; Standard & Poor’s.

BIS Papers No 30 183
Table 3
Local and foreign currency credit rating of selected Asian economies, November 2004
S&P Moody’s Fitch R&I LC FC LC FC LC FC LC FC
Australia AAA AAA Aaa Aaa AAA AA+ AAA AA+
China BBB+ BBB+ – A2 A A– – A
Hong Kong SAR AA– A+ Aa3 A1 AA+ AA– AA AA–
India BB+ BB Ba2 Baa3 BB+ BB+ – BBB
Indonesia B+ B B2 B2 B+ B+ – B
Japan AA– AA– A2 Aaa AA– AA AAA AAA
Korea A+ A– A3 A3 AA– A – A–
Macau SAR – – A1 A1 – – – –
Malaysia A+ A– A3 Baa1 A+ A– – A–
Mongolia B B – – – – – –
New Zealand AAA AA+ Aaa Aaa AAA AA+ AAA AA+
Pakistan BB B+ B2 B2 – – – –
Papua New Guinea B+ B B1 B1 B+ B – –
Philippines BBB– BB Ba2 Ba2 BB+ BB – BBB–
Singapore AAA AAA Aaa Aaa AAA AAA AAA AAA
Taiwan, China AA– AA– Aa3 Aa3 AA A+ – AA
Thailand A BBB+ Baa1 Baa1 A– BBB – BBB+
Vietnam BB BB– – B1 BB BB– – –
Note: LC refers to local currency rating, and FC to foreign currency rating.
Sources: Fitch Investors Service; Japan Rating and Investment Information, Inc (R&I); Moody’s Investors Service; Standard & Poor’s.

184 BIS Papers No 30
Table 4
Domestic vs foreign currency rating gaps by rating, November 2004
Asian countries in parentheses
No difference Domestic currency debt rated higher by exactly
one notch
Domestic currency debt rated higher by more
than one notch S&P foreign
currency rating
Number of sovereigns
AAA 18 (2) 0 0
AA 8 (2) 2 (1) 0
A 7 (0) 8 (1) 5 (2)
BBB 2 (1) 6 (0) 6 (1)
BB 3 (0) 11 (2) 4 (1)
B 18 (1) 4 (2) 1 (1)
Note: Ratings indicate the broad letter grade category, eg AA stands for credits rated AA+, AA and AA–.
Source: Standard & Poor’s.
Table 5
Domestic vs foreign currency rating gaps, November 2004 Asian countries in parentheses
Moody’s S&P
Number of sovereigns
4-notch differential – –
3-notch 6 (0) 8 (0)
2-notch 7 (0) 8 (4)
1-notch 15 (2) 31 (6)
No difference 62 (10) 59 (6)
–1-notch 2 (0) –
–2-notch 1 (1) –
–3-notch – –
–4-notch – –
–5-notch 1 (1) –
Total 94 (14) 106 (16)
Sources: Moody’s Investors Service; Standard & Poor’s.

BIS Papers No 30 185
Table 6
Notching of local currency credit rating of Asian economies, November 2004
S&P LC/FC gap
Moody’s LC/FC gap
Fitch LC/FC gap
R&I LC/FC gap
Australia 0 0 1 1
China 0 – 1 –
Hong Kong SAR 1 1 2 1
India 1 –2 0 –
Indonesia 1 0 0 –
Japan 0 –5 –1 0
Korea 2 0 2 –
Macau SAR – 0 – –
Malaysia 2 1 2 –
Mongolia 0 – – –
New Zealand 1 0 1 1
Pakistan 2 0 – –
Papua New Guinea 1 0 1 –
Philippines 2 0 1 –
Singapore 0 0 0 0
Taiwan, China 0 0 2 –
Thailand 2 0 2 –
Vietnam 1 – 1 –
Average 0.94 –0.33 1.00 0.60
Average (ex Japan) 1.00 0.00 1.14 0.75
Note: LC refers to local currency rating, and FC to foreign currency rating.
Sources: Fitch Investors Service; Japan Rating and Investment Information, Inc (R&I); Moody’s Investors Service; Standard & Poor’s.

186 BIS Papers No 30
Table 7
Explanatory regression variables
Category Subcategory Variables
Inflation Inflation over 1 year, 5 years and 10 years Log inflation over 1 year, 5 years and 10 years
GDP Log per capita GDP Per capita GDP GDP growth 1-year rate GDP growth 3-year rate GDP growth 3-year average annual rate
Monetary M2: 1-year, 5-year, 10-year, % change M2: log 1-year, 5-year and 10-year change M2: 1-year, 5-year and 10-year volatility M2: log 1-year, 5-year and 10-year volatility
Monetary/liquidity M2/reserves: 1-year, 5-year, 10-year, % change M2/reserves: log 1-year, 5-year and 10-year change M2/reserves: 1-year, 5-year and 10-year volatility M2/reserves: log 1-year, 5-year and 10-year volatility
Macroeconomic
Saving/investment Saving/GDP Investment/GDP
Political Political Transparency International Corruption Perceptions Index Political risk score (Political Risk Services) Government control of corruption (latest available, Kaufmann et al (2003)) Government effectiveness (latest available, Kaufmann et al (2003)) Government regulatory quality (latest available, Kaufmannet al (2003))
Government finance
Government finance
Public debt/GDP Fiscal balance/GDP Budget revenue/GDP Domestic debt/GDP Government debt/revenue
Debt Net debt/GDP Net debt/exports Gross debt/exports Gross debt/GDP Short-term debt/reserves Short-term debt/GDP Import cover
Exchange rate Nominal exchange rate 1-year change Real effective exchange rate, % deviation from LT average (JPMorgan Chase) IMF exchange rate regime dummy variable (pegs and managed floats are coded as 1)
External position
Default Years since foreign currency default Log years since foreign currency default Years since local currency default Log years since local currency default
Sources: Transparency International; Political Risk Services’ International Country Risk Guide; Kaufmann et al (2003); EIU; Datastream; Standard & Poor’s; JPMorgan Chase.

BIS Papers No 30 187
Table 8
The determinants of Moody’s and S&P’s foreign and local currency ratings
Agency S&P Moody’s S&P Moody’s
Dependent variable Foreign currency rating
Foreign currency rating
Local currency rating
Local currency rating
R-squared .9949 .9961 .9879 .9951
F-test of significance of fixed effects, p-value <.0001 <.0001 <.0001 <.0001 Hausman test, fixed/ random effects, p-value .0068 .1642 .0026 .0004 Degrees of freedom 329 235 358 340
Independent variables Coeff t-stat Coeff t-stat Coeff t-stat Coeff t-stat
Macroeconomic Inflation, log 1-yr 0.366 3.930 Inflation, 1-yr Inflation, log 10-yr Per capita GDP, log –3.016 –7.870 –2.231 –5.360 –1.752 –3.170 –0.985 –2.950GDP growth, 3-yr avg –0.093 –3.460M2, 10-yr % chg M2, log 10-yr % chg M2, 1-yr log volatility 0.334 2.600 M2, 5-yr volatility M2/reserves, 5-yr log volatility 0.463 2.680 0.908 4.950 0.734 4.840M2/reserves, log 10-yr % chg M2/reserves, 1-yr volatility M2/reserves, log 5-yr % chg Investment –0.053 –2.970 –0.083 –4.210 –0.064 –3.000 Saving Political Political risk score –0.034 2.560 –0.030 1.970 –0.045 –2.630 Regulatory quality –1.418 –6.300 Control of corruption –1.264 –4.120 –1.466 –3.700 Government finance Public debt/GDP 0.041 7.040 0.072 9.690 0.037 7.300Domestic debt/GDP Budget revenue/GDP External Net debt/exports 0.004 2.420 Short-term debt/GDP Import cover

188 BIS Papers No 30
Table 8 (cont)
The determinants of Moody’s and S&P’s foreign and local currency ratings
Agency S&P Moody’s S&P Moody’s
Dependent variable Foreign currency rating
Foreign currency rating
Local currency rating
Local currency rating
Independent variables Coeff t-stat Coeff t-stat Coeff t-stat Coeff t-stat
External (cont) Exchange rate rigidity 0.493 2.580 0.584 2.510 Exchange rate, 1-yr chg –0.012 –3.320 Real effective exchange rate Years since foreign currency default, log –0.346 –2.910 –0.236 –2.790 Years since local currency default, log –0.661 –2.110 Years since local currency default Time-series fixed effects Year 1995 –0.143 –0.580Year 1996 –0.197 –0.650 0.013 0.040 –0.854 –2.330 –0.151 –0.610Year 1997 –0.031 –0.110 0.482 1.650 –0.613 –1.790 –0.049 –0.230Year 1998 –0.255 –1.400 0.376 1.960 –0.461 –2.070 0.195 1.220Year 1999 –0.298 –1.810 0.224 1.240 –0.154 –0.730 0.023 0.160Year 2000 –0.196 –1.230 0.121 0.710 –0.237 –1.150 0.035 0.250Year 2001 –0.244 –1.580 0.158 0.950 –0.123 –0.590 –0.003 –0.020Year 2002 –0.341 –2.380 –0.259 –1.590 –0.327 –1.760 –0.029 –0.220Cross-sectional fixed effects
Argentina 42.066 11.990 36.030 9.340 30.755 6.210 20.740 6.650Australia 38.690 10.100 29.766 7.150 27.594 5.110 8.888 2.590Austria 24.271 4.310 7.661 2.100Bahrain 37.817 10.290 26.200 5.090 Barbados Belgium 21.543 3.750 Bolivia 31.343 10.230 Botswana 35.650 11.300 25.630 5.710 12.167 4.310Brazil 39.252 11.950 34.015 9.460 27.670 5.950 19.606 6.750Bulgaria 35.604 11.350 33.375 10.180 26.324 6.060 17.419 6.340Canada 36.597 9.060 29.884 7.130 24.147 4.270 7.431 2.060Chile 37.966 11.700 32.059 9.160 26.727 5.840 12.227 4.190Colombia 33.313 10.380 26.989 7.660 23.193 5.430 11.423 4.040Costa Rica 39.463 11.870 33.270 9.380 30.149 6.480 16.238 5.480Croatia 36.586 10.760 32.284 8.980 23.328 4.780 13.537 4.480Cyprus 37.123 9.760 31.503 7.860 23.764 4.450 11.859 3.480Czech Republic 36.820 10.910 31.375 8.690 23.978 4.950 11.826 3.910

BIS Papers No 30 189
Table 8 (cont)
The determinants of Moody’s and S&P’s foreign and local currency ratings
Agency S&P Moody’s S&P Moody’s
Dependent variable Foreign currency rating
Foreign currency rating
Local currency rating
Local currency rating
Independent variables Coeff t-stat Coeff t-stat Coeff t-stat Coeff t-stat
Cross-sectional fixed effects (cont)
Denmark 38.360 9.380 29.897 6.880 26.363 4.600 7.895 2.150Dominican Republic 38.269 12.400 32.239 9.560 30.655 6.800 18.846 6.970Ecuador 38.642 12.060 34.761 10.510 25.128 5.550 19.327 6.970Egypt 30.896 10.180 29.295 9.540 19.215 4.590 11.276 4.250El Salvador 35.873 11.580 29.702 8.800 24.268 5.580 14.114 5.200Estonia 36.972 11.500 29.650 8.300 27.612 6.030 12.079 4.190Finland 36.491 8.890 27.110 6.100 26.513 4.700 6.196 1.690France 34.486 8.610 27.636 6.530 22.736 4.050 7.248 2.010Germany 35.456 8.850 24.001 4.270 7.269 2.010Greece 23.261 4.310 9.722 2.800Guatemala 16.280 6.170Hong Kong SAR 42.158 11.200 32.084 6.070 Hungary 24.702 5.080 Iceland 41.818 10.380 31.264 7.140 27.720 4.870 8.048 2.230India 31.870 12.330 21.837 6.190 15.682 7.020Indonesia 32.841 11.540 29.574 9.980 23.548 5.990 17.839 7.220Ireland 37.489 9.390 26.707 4.770 8.711 2.450Israel 37.226 9.370 32.177 7.990 21.479 3.870 10.981 3.090Italy 33.010 7.990 29.440 6.960 19.251 3.340 7.742 2.100Jamaica 35.997 10.120 34.626 10.150 22.921 4.660 11.676 3.760Japan 34.617 7.990 31.204 7.300 20.567 3.390 7.603 1.980Jordan 34.562 10.920 32.587 10.230 22.675 5.220 15.437 5.550Kazakhstan 35.176 11.550 28.188 8.300 26.046 6.260 14.228 5.450Kuwait 37.615 10.110 25.484 4.810 14.352 4.270Latvia 36.325 11.560 30.374 8.870 25.933 5.850 12.829 4.590Lebanon 35.836 9.370 36.395 10.130 22.581 4.370 15.976 4.760Lithuania 36.458 11.320 31.195 8.930 26.082 5.790 13.767 4.790Malaysia 35.989 11.030 31.147 9.020 24.230 5.350 12.750 4.400Malta 36.123 9.870 23.025 4.490 13.197 4.050Mauritius 12.026 4.140Mexico 39.169 11.620 32.694 9.030 27.604 5.880 15.226 5.130Moldova 18.243 7.750Mongolia 37.041 11.780 24.691 5.480 Morocco 33.859 11.220 30.190 9.710 22.095 5.310 14.429 5.420Netherlands 37.108 9.170 26.405 4.710 7.186 1.990New Zealand 37.625 10.050 28.299 7.000 26.987 5.130 8.080 2.400

190 BIS Papers No 30
Table 8 (cont)
The determinants of Moody’s and S&P’s foreign and local currency ratings
Agency S&P Moody’s S&P Moody’s
Dependent variable Foreign currency rating
Foreign currency rating
Local currency rating
Local currency rating
Independent variables Coeff t-stat Coeff t-stat Coeff t-stat Coeff t-stat
Cross-sectional fixed effects (cont)
Nicaragua 30.400 10.390 14.347 5.670Norway 39.149 9.610 28.197 4.910 9.101 2.490Oman 40.673 11.660 32.591 8.510 31.162 6.520 16.078 5.180Pakistan 30.697 11.400 28.556 9.950 21.952 6.060 17.578 7.520Panama Papua New Guinea 32.810 11.660 22.335 5.810 15.894 6.590Paraguay 37.156 12.600 27.770 6.800 18.626 7.290Peru 36.977 12.040 32.898 10.050 28.206 6.640 15.282 5.620Philippines 32.411 11.240 29.233 9.850 21.378 5.350 13.338 5.330Poland 36.635 11.040 30.687 8.630 25.441 5.450 11.975 4.030Portugal 34.721 9.280 23.997 4.550 8.481 2.540Qatar 40.000 9.770 26.635 4.650 14.710 4.040Romania 38.991 12.850 34.770 10.550 29.474 6.930 20.244 7.560Russia 35.430 11.070 32.009 9.180 24.258 5.310 17.049 6.140Senegal 24.887 6.810 Singapore 35.674 8.950 23.292 4.100 7.136 1.990Slovakia 37.991 11.490 32.044 8.990 25.251 5.370 12.211 4.160Slovenia 37.127 10.310 30.644 7.890 23.436 4.510 South Africa 35.953 11.180 29.310 8.460 24.724 5.500 11.810 4.120Spain 35.348 9.100 28.584 7.000 24.312 4.530 7.837 2.270Sweden 37.393 9.120 24.457 4.180 7.650 2.080Switzerland 39.128 9.490 28.306 4.950 8.411 2.280Thailand 33.952 10.990 30.294 9.300 24.058 5.640 12.422 4.540Trinidad 37.049 10.550 32.732 8.840 24.834 5.090 13.992 4.500Tunisia 34.659 11.100 22.762 5.280 13.575 4.920Turkey 38.494 11.610 33.704 9.780 28.213 6.090 19.083 6.490Ukraine 34.907 12.320 30.390 9.840 26.194 6.530 20.564 8.480United Kingdom 37.322 9.360 29.444 7.000 26.323 4.720 8.137 2.300United States 37.749 9.170 26.569 4.640 8.305 2.260Uruguay 38.842 11.300 33.406 9.030 28.855 6.010 16.581 5.370Venezuela 39.969 11.910 34.759 9.520 21.854 7.350Vietnam 22.940 6.270 Asia average 35.473 3.311 29.931 3.571 24.272 4.551 11.963 2.931
Non-Asia average 36.897 3.471 31.457 3.581 25.381 4.851 13.124 3.071
1 Standard deviations are given for the average Asian and non-Asian fixed effect. Asian countries are shaded.

BIS Papers No 30 191
Table 9
The determinants of Moody’s and S&P’s foreign and local currency ratings, common sample
Agency S&P Moody’s S&P Moody’s
Dependent variable Foreign currency rating
Foreign currency rating
Local currency rating
Local currency rating
R-squared .9954 .9959 .9880 .9947
F-test of significance of fixed effects, p-value <.0001 <.0001 <.0001 <.0001 Hausman test, fixed/ random effects, p-value .0209 .1801 .0026 .0010 Degrees of freedom 219 220 269 274
Independent variables Coeff t-stat Coeff T-stat Coeff t-stat Coeff t-stat
Macroeconomic Inflation, log 1-yr 0.308 2.830 Inflation, 1-yr Inflation, log 10-yr Per capita GDP, log –2.711 –5.950 –2.121 –4.980 –2.375 – 3.510 –0.873 – 2.280GDP growth, 3-yr avg –0.084 – 2.700M2, 10-yr % chg M2, log 10-yr % chg M2, 1-yr log volatility 0.311 1.920 M2, 5-yr volatility M2/reserves, 5-yr log volatility 0.713 3.230 0.995 4.970 0.909 4.910 M2/reserves, log 10-yr % chg M2/reserves, 1-yr volatility M2/reserves, log 5-yr % chg Investment –0.069 –3.000 –0.086 –3.920 –0.029 –0.940 Saving Political Political risk score –0.046 –2.760 –0.029 –1.820 –0.024 –1.090 Regulatory quality –1.497 –6.400 Control of corruption –1.140 –2.750 –0.972 – 1.960 Government finance Public debt/GDP 0.045 6.770 0.073 7.730 0.040 6.430 Domestic debt/GDP Budget revenue/GDP External Net debt/exports 0.004 2.480 Short-term debt/GDP Import cover Exchange rate rigidity 0.787 3.230 –0.005 –0.020

192 BIS Papers No 30
Table 9 (cont)
The determinants of Moody’s and S&P’s foreign and local currency ratings, common sample
Agency S&P Moody’s S&P Moody’s
Dependent variable Foreign currency rating
Foreign currency rating
Local currency rating
Local currency rating
Independent variables Coeff t-stat Coeff T-stat Coeff t-stat Coeff t-stat
Exchange rate, 1-yr chg –0.012 – 2.800 Real effective exchange rate Years since foreign currency default, log –0.325 –2.430 –0.221 –1.790 Years since local currency default, log –0.660 – 1.720 Years since local currency default Time-series fixed effects Year 1995 Year 1996 –0.215 –0.600 0.059 0.190 –1.545 – 1.270 –0.214 –0.260Year 1997 –0.058 –0.180 0.516 1.730 –0.973 –1.370 –0.248 –0.500Year 1998 –0.213 –0.930 0.456 2.240 –0.646 – 2.370 0.220 1.220Year 1999 –0.443 –2.170 0.255 1.380 –0.262 – 1.100 0.044 0.280Year 2000 –0.266 –1.350 0.158 0.900 –0.272 – 1.180 0.071 0.460Year 2001 –0.148 –0.780 0.196 1.150 –0.200 – 0.860 0.042 0.280Year 2002 –0.263 –1.470 –0.177 –1.060 –0.376 – 1.830 –0.025 –0.170Cross-sectional fixed effects Argentina 39.570 9.620 34.692 8.830 35.235 5.710 19.210 5.350Australia 36.199 8.100 28.422 6.690 30.294 4.550 7.289 1.850Austria Bahrain Barbados Belgium Bolivia Botswana 28.629 5.140 10.885 3.360Brazil 37.071 9.640 32.753 8.940 30.491 5.300 18.052 5.390Bulgaria 33.426 9.130 32.276 9.680 29.534 5.510 15.930 5.020Canada 33.786 7.190 28.552 6.680 26.811 3.860 5.802 1.390Chile 36.166 9.590 31.014 8.710 29.023 5.160 10.972 3.280Colombia 30.443 7.980 25.606 7.110 27.059 5.160 9.520 2.910Costa Rica 37.060 9.570 32.133 8.910 33.356 5.830 14.695 4.300Croatia 34.400 8.690 31.170 8.530 26.913 4.430 12.095 3.470Cyprus 34.230 7.720 30.211 7.390 27.498 4.170 10.130 2.580Czech Republic 34.822 8.830 30.308 8.260 27.211 4.490 10.487 3.020
BIS Papers No 30 193
Table 9 (cont)
The determinants of Moody’s and S&P’s foreign and local currency ratings, common sample
Agency S&P Moody’s S&P Moody’s
Dependent variable Foreign currency rating
Foreign currency rating
Local currency rating
Local currency rating
Independent variables Coeff t-stat Coeff T-stat Coeff t-stat Coeff t-stat
Cross-sectional fixed effects (cont) Denmark 35.246 7.400 28.507 6.430 29.739 4.230 6.134 1.450Dominican Republic 35.755 9.780 31.099 9.060 34.246 6.050 17.399 5.580Ecuador 36.262 9.650 33.006 9.680 28.911 5.110 17.471 5.420Egypt 28.747 8.190 28.293 9.050 22.728 4.400 9.921 3.220El Salvador 32.775 8.880 28.547 8.290 27.874 5.150 12.751 4.080Estonia 35.197 9.110 28.555 7.850 30.841 5.380 10.684 3.220Finland 32.920 6.830 25.521 5.610 29.454 4.250 4.067 0.960France 31.425 6.750 26.284 6.100 26.562 3.840 5.439 1.310Germany 27.516 3.970 5.412 1.300Greece Guatemala Hong Kong SAR Hungary Iceland 38.791 8.250 29.821 6.680 30.811 4.400 6.394 1.540India 24.524 5.590 14.530 5.620Indonesia 30.931 9.260 28.535 9.460 27.729 5.720 16.397 5.730Ireland 30.222 4.380 6.914 1.680Israel 34.039 7.380 30.900 7.530 25.650 3.780 9.224 2.240Italy 29.818 6.220 28.038 6.500 23.316 3.290 5.695 1.340Jamaica 33.626 8.170 33.567 9.650 26.204 4.280 9.918 2.740Japan 31.765 6.340 29.971 6.900 23.786 3.180 5.841 1.300Jordan 32.440 8.840 31.549 9.740 25.674 4.770 13.920 4.310Kazakhstan 33.312 9.310 27.003 7.820 28.948 5.470 12.862 4.280Kuwait 29.824 4.550 12.824 3.320Latvia 34.623 9.380 29.303 8.410 29.186 5.220 11.496 3.580Lebanon 33.029 7.470 35.215 9.610 26.295 4.100 14.101 3.600Lithuania 34.212 9.080 30.055 8.460 29.583 5.260 12.306 3.720
Malaysia 33.847 8.910 30.055 8.550 27.586 4.950 11.355 3.400Malta 26.762 4.200 11.673 3.110Mauritius Mexico 37.193 9.390 31.509 8.550 31.178 5.360 13.861 4.040Moldova Mongolia Morocco 31.872 9.110 29.185 9.230 25.134 4.870 13.006 4.230Netherlands 29.605 4.310 5.326 1.280New Zealand 35.111 8.040 26.992 6.540 29.325 4.520 6.439 1.670

194 BIS Papers No 30
Table 9 (cont)
The determinants of Moody’s and S&P’s foreign and local currency ratings, common sample
Agency S&P Moody’s S&P Moody’s
Dependent variable Foreign currency rating
Foreign currency rating
Local currency rating
Local currency rating
Independent variables Coeff t-stat Coeff T-stat Coeff t-stat Coeff t-stat
Cross-sectional fixed effects (cont) Nicaragua Norway 31.563 4.460 7.284 1.730Oman 38.029 9.320 31.326 8.000 34.929 5.960 14.607 4.100Pakistan 28.435 9.000 27.448 9.390 25.254 5.660 16.048 5.920Panama Papua New Guinea 25.262 5.310 14.443 5.180Paraguay 31.890 6.350 17.309 5.880Peru 35.454 9.880 31.861 9.560 31.107 5.970 14.024 4.480Philippines 30.846 9.170 28.249 9.360 23.465 4.760 11.988 4.140Poland 34.677 8.970 29.568 8.180 28.262 4.880 10.558 3.090Portugal 27.063 4.140 6.578 1.700Qatar 30.920 4.380 12.818 3.040Romania 36.963 10.400 33.667 10.040 33.541 6.370 18.908 6.140Russia 33.202 8.820 30.807 8.690 28.237 4.940 15.516 4.840Senegal Singapore 25.594 3.650 5.476 1.320Slovakia 35.933 9.310 30.909 8.520 28.566 4.830 10.749 3.180Slovenia 34.746 8.280 29.469 7.470 South Africa 33.759 8.970 28.144 7.990 27.465 4.970 10.311 3.130Spain 32.397 7.180 27.208 6.490 27.726 4.220 5.962 1.490Sweden 27.250 3.790 5.706 1.350Switzerland 31.229 4.460 6.731 1.580Thailand 32.163 8.920 29.257 8.840 26.611 5.060 11.044 3.510Trinidad 34.435 8.380 31.531 8.370 28.781 4.790 12.344 3.440Tunisia 25.662 4.790 12.084 3.800Turkey 36.244 9.370 32.518 9.250 31.240 5.420 17.487 5.150Ukraine 32.890 9.850 29.594 9.320 29.730 5.920 18.295 6.480United Kingdom 34.690 7.480 28.127 6.550 29.196 4.270 6.513 1.590United States 29.777 4.260 6.786 1.600Uruguay 36.342 9.060 32.170 8.540 32.392 5.510 15.040 4.230Venezuela 37.592 9.500 33.532 9.020 Vietnam Asia average 32.980 3.891 28.783 3.561 26.418 5.671 10.480 3.391
Non-Asia average 34.401 3.951 30.279 3.681 28.944 5.991 11.373 3.571
1 Standard deviations are given for the average Asian and non-Asian fixed effect. Asian countries are shaded.

BIS Papers No 30 195
Table 10
The determinants of gaps between foreign and local currency ratings, Moody’s and S&P
Agency S&P Moody’s S&P-Moody’s difference
S&P-Moody’s difference
Dependent variable Foreign-local
currency rating gap
Foreign-local currency rating
gap Foreign
currency rating Local
currency rating
R-squared .8981 .8659 .6900 .8804 F-test of significance of fixed effects, p-value <.0001 <.0001 <.0001 <.0001 Hausman test, fixed/ random effects, p-value .0006 .0782 .0116 .0002 Degrees of freedom 319 199 170 128 Independent variables Coeff t-stat Coeff t-stat Coeff t-stat Coeff t-stat Macroeconomic Inflation, log 1-yr –0.174 –2.730 0.159 2.180 Inflation, 1-yr –0.028 –3.440 Inflation, log 10-yr –0.107 –1.690 Per capita GDP, log –2.608 –5.030 GDP growth, 3-yr avg M2, 10-yr % chg –0.001 –3.350 M2, log 10-yr % chg 0.100 1.970 M2, 1-yr log volatility M2, 5-yr volatility –0.011 –1.890 0.110 1.790 M2/reserves, 5-yr log volatility M2/reserves, log 10-yr % chg 0.101 3.150 –0.072 –2.040M2/reserves, 1-yr volatility –0.006 –2.970 M2/reserves, log 5-yr % chg 0.089 2.680 Investment Saving 0.073 3.210 Political Political risk score Regulatory quality 0.509 2.950 Control of corruption –0.791 –2.350
Government finance Public debt/GDP –0.010 –1.740 Domestic debt/GDP 0.033 3.000 Budget revenue/GDP 0.050 1.680 –0.041 –2.160External Net debt/exports Short-term debt/GDP 0.000 1.850 Import cover 0.079 2.510 Exchange rate rigidity Exchange rate, 1-yr change –0.006 –2.770

196 BIS Papers No 30
Table 10 (cont)
The determinants of gaps between foreign and local currency ratings, Moody’s and S&P
Agency S&P Moody’s S&P-Moody’s difference
S&P-Moody’s difference
Dependent variable Foreign-local
currency rating gap
Foreign-local currency rating
gap Foreign
currency rating Local
currency rating
Independent variables Coeff t-stat Coeff t-stat Coeff t-stat Coeff t-stat External (cont) Real effective exchange rate 0.018 2.460 Years since foreign currency default, log Years since local currency default, log –0.567 –2.220 Years since local currency default –0.248 –4.500 Time-series fixed effects Year 1995 0.501 1.990 –1.328 –4.840Year 1996 1.228 6.650 0.338 1.390 –1.797 –3.810 –1.212 –4.470Year 1997 1.078 6.090 0.325 1.560 –1.589 –4.060 –1.193 –4.800Year 1998 0.852 5.170 0.330 1.900 –1.366 –3.920 –0.844 –4.230Year 1999 0.468 3.040 0.109 0.690 –0.977 –3.310 –0.734 –3.840Year 2000 0.485 3.170 –0.087 –0.580 –0.672 –2.990 –0.706 –3.710Year 2001 0.358 2.450 –0.175 –1.160 –0.381 –2.110 –0.570 –2.990Year 2002 0.232 1.660 –0.313 –2.210 –0.088 –0.570 –0.404 –2.140
Cross-sectional fixed effects Argentina 0.759 1.310 22.009 4.600 3.046 3.640 Australia 2.238 1.880 25.821 4.840 25.155 4.470 Austria 0.584 0.470 25.302 4.520 1.402 1.280 Bahrain 1.590 1.560 Barbados 3.833 3.940 –2.826 –3.420Belgium Bolivia 3.358 2.450 42.320 4.290 Botswana –0.087 –0.060 Brazil 2.769 3.530 19.932 4.550 1.767 1.420 Bulgaria 3.047 2.420 18.875 4.590 20.894 3.940 Canada 2.265 1.790 25.789 4.610 –0.696 –0.670Chile 5.189 3.750 23.424 5.150 47.390 4.510 –1.081 –1.870Colombia 7.109 4.430 23.118 5.440 46.876 4.410 –1.425 –2.150Costa Rica 3.064 2.240 46.742 4.730 –0.117 –0.220Croatia Cyprus 2.330 2.350 23.800 4.630 9.962 3.890 –1.451 –1.590Czech Republic
BIS Papers No 30 197
Table 10 (cont)
The determinants of gaps between foreign and local currency ratings, Moody’s and S&P
Agency S&P Moody’s S&P-Moody’s difference
S&P-Moody’s difference
Dependent variable Foreign-local
currency rating gap
Foreign-local currency rating
gap Foreign
currency rating Local
currency rating
Independent variables Coeff t-stat Coeff t-stat Coeff t-stat Coeff t-stat Cross-sectional fixed effects (cont) Denmark 2.371 1.720 26.125 4.610 0.613 0.510 Dominican Republic –3.019 –8.150 1.003 1.470 Ecuador 2.741 4.550 19.607 4.600 –0.402 –0.470Egypt 3.853 3.200 20.960 5.120 18.724 4.160 El Salvador 1.481 2.880 19.790 4.880 2.073 2.650 –0.156 –0.350Estonia 0.155 0.190 20.124 4.540 4.253 2.940 Finland France 0.626 0.640 25.154 4.520 0.992 0.880 Germany 0.318 0.310 1.911 1.850 Greece 3.866 2.680 26.046 5.020 41.298 4.310 Guatemala 3.722 2.620 44.976 4.490 0.138 0.310 Hong Kong SAR 2.185 1.750 Hungary 22.387 4.700 37.821 4.430 Iceland 4.079 3.530 2.739 3.390 India 3.778 3.370 –3.384 –4.790Indonesia 3.437 3.080 17.240 4.420 14.085 4.290 –0.394 –0.510Ireland Israel 3.645 3.430 24.928 4.590 13.686 4.260 –2.407 –2.120Italy 1.443 1.370 25.481 4.500 11.850 3.470 –1.920 –1.330Jamaica 2.726 2.680 22.972 4.960 10.595 4.390 Japan 0.341 0.310 24.686 4.140 Jordan 4.157 3.850 18.214 4.240 13.281 4.110 Kazakhstan Kuwait 0.923 1.360 Latvia Lebanon 0.349 0.280 21.571 4.460 Lithuania Malaysia 3.851 3.830 21.163 4.530 10.913 4.260 –1.115 –1.790Malta 2.794 2.840
Mauritius 22.501 4.880 Mexico 5.713 4.190 44.597 4.540 –0.948 –1.630Moldova 16.644 4.650 Mongolia 0.288 0 .460 Morocco 4.212 3.970 17.415 4.260 11.801 4.370 Netherlands 1.679 1.090 –0.247 –0.200

198 BIS Papers No 30
Table 10 (cont)
The determinants of gaps between foreign and local currency ratings, Moody’s and S&P
Agency S&P Moody’s S&P-Moody’s difference
S&P-Moody’s difference
Dependent variable Foreign-local
currency rating gap
Foreign-local currency rating
gap Foreign
currency rating Local
currency rating
Independent variables Coeff t-stat Coeff t-stat Coeff t-stat Coeff t-stat Cross-sectional fixed effects (cont) New Zealand 1.681 1.430 24.492 4.770 24.177 4.550 Nicaragua 16.783 4.540 Norway 1.547 1.300 25.300 4.420 2.152 1.990 Oman 2.625 1.930 1.399 2.090 Pakistan 4.206 3.730 15.497 4.370 12.046 3.820 –3.639 –5.560Panama 23.914 4.290 Papua New Guinea 3.835 4.010 –1.978 –2.350Paraguay 5.162 3.620 Peru 3.440 2.460 21.425 5.220 44.160 4.430 Philippines 4.878 4.530 17.575 4.470 13.998 4.420 –2.444 –4.350Poland 4.145 3.510 22.285 4.890 22.124 4.810 0.019 0.040 Portugal 0.947 1.080 23.108 4.570 5.684 2.970 –0.139 –0.140Qatar 1.983 2.110 23.922 4.120 6.494 3.130 –0.242 –0.310Romania 3.788 2.830 19.746 4.770 29.041 4.210 –0.782 –1.080Russia Senegal Singapore –0.171 –0.180 Slovakia Slovenia 3.348 4.250 3.548 2.550 South Africa 4.522 4.510 22.469 5.060 7.579 2.670 –0.385 –0.560Spain 2.369 1.490 23.931 4.480 0.613 0.780 Sweden 1.151 1.310 27.070 4.780 1.363 1.140 Switzerland 1.498 0.940 Thailand 4.821 3.540 20.095 4.620 43.601 4.430 –1.826 –3.010Trinidad 3.407 3.410 9.245 3.940 Tunisia 4.940 4.750 Turkey 2.416 1.960 19.034 4.130 20.297 4.570 –1.379 –1.430Ukraine 0.766 1.250 16.151 4.210 0.485 0.440 United Kingdom 1.086 0.820 25.085 4.610 1.207 1.360 United States 1.551 1.120 0.662 1.310 Uruguay 3.325 2.420 21.675 4.670 44.227 4.540 –0.595 –1.020Venezuela 19.667 4.290 0.016 0.020 Vietnam Asia average 2.597 1.011 21.581 4.741 21.988 4.931 –1.857 0.601
Non-Asia average 2.579 1.041 21.883 4.701 20.109 4.611 –0.176 0.751
1 Standard deviations are given for the average Asian and non-Asian fixed effect. Asian countries are shaded.

BIS Papers No 30 199
References
Bank for International Settlements (2001): “The development of bond markets in emerging economies”, BIS Papers, no 11, Basel, June.
Basel Committee on Banking Supervision (2004): International convergence of capital measurement and capital standards: a revised framework, Bank for International Settlements, June.
Borio, C and F Packer (2004): “Assessing new perspectives on country risk”, BIS Quarterly Review, December.
Cantor, R and F Packer (1996): “Determinants and impact of sovereign credit ratings”, FRBNY Economic Policy Review, October.
Claessens, S, D Klingebiel and S Schmukler (2003): “Government bonds in domestic and foreign currency: the role of macroeconomic and institutional factors”, Discussion Paper no 3789, Centre for Economic Policy Research, February.
Eichengreen, B, R Hausmann and U Panizza (2003): “Currency mismatches, debt intolerance and original sin: why they are not the same and why it matters”, NBER Working Paper Series, October.
Executives’ Meeting of East Asia-Pacific Central Banks (2004): “EMEAP central banks announce the launch of the Asian Bond Fund 2”, Press Release, 16 December.
Fitch Investors Service (2003): Presentation at Daiwa Securities Japan Symposium, February.
International Monetary Fund (2003): “Local securities and derivatives markets in emerging markets: selected policy issues”, IMF Financial Markets Quarterly.
Kaufmann, D, A Kraay and M Mastruzzi (2003): Governance matters III: governance indicators for 1996-2002, World Bank.
McCauley, R N and G Jiang (2004): “Diversifying with Asian local currency bonds”, BIS Quarterly Review, September, pp 51-66.
McCauley, R and W White (1997): “The euro and European financial markets”, BIS Working Papers, no 41, May; also in Paul Masson, Thomas H Krueger and Bart G Turtelboom (eds) (1997), EMU and the international monetary system, IMF, Washington DC, pp 324-88.
Merrill Lynch (2000): Bond index rules & definitions, 12 October.
Moody’s Investors Service (2003a): Sovereign bond defaults, rating transitions, and recoveries (1985-2002), February.
——— (2003b): A quantitative model for local currency bond ratings, September.
——— (2003c): India: analysis, February.
——— (2003d): “Japan: a rating agency perspective”, Special Comment, February.
——— (2004): A quantitative model for foreign currency government bond ratings, February.
Packer, F (2003): “Mind the gap: domestic versus foreign currency sovereign ratings”, BIS Quarterly Review, September.
Standard & Poor’s (2002): Sovereign credit ratings: a primer, April.
——— (2003): Foreign/local currency and sovereign/nonsovereign ratings differentials, 22 September.
——— (2004): Sovereign credit ratings: a primer, April.
Trevino, L and S Thomas (2001): “Local and foreign currency ratings: what determines sovereign transfer risk?”, Journal of Fixed Income, June.