PROVIDERS ” from ” from Standard & Poor’s
121
Appendices to Amended and Restated OSA 1 APPENDIX 2 CREDITWORTHINESS STANDARDS FOR GUARANTORS AND LETTER OF CREDIT PROVIDERS Standards for Guarantors: Minimum tangible net worth of $500 Million and Minimum credit rating from two of the following credit rating agencies of: “BBB” from Fitch Ratings, “Baa2” from Moody’s Investors Services, and “BBB” from Standard & Poor’s; or Standards for Letter of Credit Providers: A U.S. commercial bank or foreign bank with a U.S. branch; Net assets of not less than $1 Billion; and Minimum credit rating from two of the following credit rating agencies of: “A‐” from Fitch Ratings, “A3” from Moody’s Investors Services, and “A‐” from Standard & Poor’s
Transcript of PROVIDERS ” from ” from Standard & Poor’s

Appendices to Amended and Restated OSA
1
APPENDIX 2
CREDITWORTHINESS STANDARDS FOR GUARANTORS AND LETTER OF CREDIT PROVIDERS
Standards for Guarantors: Minimum tangible net worth of $500 Million and Minimum credit rating from two of the following credit rating agencies of: “BBB” from Fitch Ratings, “Baa2” from Moody’s Investors Services, and “BBB” from Standard & Poor’s; or Standards for Letter of Credit Providers: A U.S. commercial bank or foreign bank with a U.S. branch; Net assets of not less than $1 Billion; and Minimum credit rating from two of the following credit rating agencies of: “A‐” from Fitch Ratings, “A3” from Moody’s Investors Services, and “A‐” from Standard & Poor’s

1
APPENDIX 3
STANDARD CLAUSES FOR LIPA CONTRACTS
For the purposes of this Appendix, the Long Island Power Authority and its operating subsidiary the Long Island Lighting Company d/b/a LIPA are hereinafter referred to as “LIPA.”
The parties to the attached contract, license, lease, amendment or other agreement of any kind (hereinafter, “the contract” or “this contract”) agree to be bound by the following clauses which are hereby made a part of the contract (the word “Contractor” herein refers to any party other than LIPA, whether a contractor, consultant, licensor, licensee, lessor, lessee or other party):
NON-ASSIGNMENT CLAUSE. In accordance with Section 138 of the State Finance Law, other than as provided in Section 9.6(b), this Agreement may not be assigned by Contractor or its right, title or interest therein assigned, transferred, conveyed, sublet or otherwise disposed of without the previous consent, in writing, of LIPA, and any attempts to assign the contract without LIPA's written consent are null and void. Contractor may, however, assign its right to receive payment without LIPA's prior written consent unless this contract concerns Certificates of Participation pursuant to Article 5-A of the State Finance Law.
COMPTROLLER’S APPROVAL. In accordance with Section 112 of the New York State Finance Law (the “State Finance Law”), this Agreement shall not be valid, effective or binding upon LIPA until it has been approved by the State Comptroller and filed in his office.
WORKER’S COMPENSATION BENEFITS. In accordance with Section 142 of the State Finance Law, this Agreement shall be void and of no force and effect unless Contractor provides and maintains coverage during the life of this Agreement for the benefit of such employees as are required to be covered by the provisions of the Workers’ Compensation Law.
NON-DISCRIMINATION REQUIREMENTS. In accordance with Article 15 of the Executive Law (also known as the Human Rights Law) and all other New York State and Federal statutory and constitutional non–discrimination provisions, Contractor shall not discriminate against any employee or applicant for employment because of race, creed, color, sex, national origin, age, disability, marital status, sexual orientation, genetic predisposition or carrier status. Furthermore, in accordance with Article 220–e of the New York Labor Law, and to the extent that this Agreement shall be performed within the State of New York, Contractor agrees that neither it nor its subcontractors shall, by reason of race, creed, color, disability, sex, national origin, sexual orientation, genetic predisposition or carrier status; (a) discriminate in hiring against any New York State citizen who is qualified and available to perform the work; or (b) discriminate against or intimidate any employee for the performance of work under this Agreement.
WAGE AND HOURS PROVISIONS. If this is a public work contract covered by Article 8 of the Labor Law or a building service contract covered by Article 9 thereof, neither Contractor’s employees nor the employees of its subcontractors may be required or permitted to work more than the number of hours or days stated in said statutes, except as otherwise provided in the Labor Law and as set forth in prevailing wage and supplement schedules issued by the State

2
Labor Department. Furthermore, Contractor and its subcontractors must pay at least the prevailing wage rate and pay or provide the prevailing supplements, including the premium rates for overtime pay, as determined by the State Labor Department in accordance with the Labor Law and shall comply with all requirements set forth in Article 8 or Article 9 of the Labor Law whichever Article applies.
NON-COLLUSIVE BIDDING CERTIFICATION. In accordance with Section 2878 of the Public Authorities Law, if this contract was awarded based upon the submission of bids, Contractor warrants, under penalty of perjury, that its bid was arrived at independently and without collusion aimed at restricting competition. Contractor further warrants that, at the time Contractor submitted its bid, an authorized and responsible person executed and delivered to LIPA a non-collusive bidding certification on Contractor's behalf.
INTERNATIONAL BOYCOTT PROHIBITION. In accordance with Section 220-f of the Labor Law and Section 139-h of the State Finance Law, if this contract exceeds $5,000, Contractor agrees, as a material condition of the contract, that neither Contractor nor any substantially owned or affiliated person, firm, partnership or corporation has participated, is participating, or shall participate in an international boycott in violation of the federal Export Administration Act of 1979 (50 USC app. Sections 2401 et seq.) or regulations thereunder. If such Contractor, or any of the aforesaid affiliates of Contractor, is convicted or is otherwise found to have violated said laws or regulations upon the final determination of the United States Commerce Department or any other appropriate agency of the United States subsequent to the contract’s execution, such contract, amendment or modification thereto shall be rendered forfeit and void. Contractor shall so notify the State Comptroller within five (5) business days of such conviction, determination or disposition of appeal (2NYCRR 105.4).
SET-OFF RIGHTS. LIPA shall have all of its common law, equitable and statutory rights of set-off. These rights shall include, but not be limited to, LIPA’s option to withhold for the purposes of set-off any moneys due to Contractor under this contract up to any amounts due and owing to LIPA with regard to this contract, any other contract with LIPA, including any contract for a term commencing prior to the term of this contract, plus any amounts due and owing to LIPA for any other reason including, without limitation, tax delinquencies, fee delinquencies or monetary penalties relative thereto. LIPA shall exercise its set-off rights in accordance with normal State practices including, in cases of set-off pursuant to an audit, the finalization of such audit by LIPA, its representatives, or the State Comptroller.
RECORDS. Contractor shall establish and maintain complete and accurate books, records, documents, accounts and other evidence directly pertinent to performance under this contract (hereinafter, collectively, “the Records”). The Records must be kept for six (6) years following the expiration or earlier termination of the contract. The State Comptroller, the Attorney General and any other person or entity authorized to conduct an examination, as well as the agency or agencies involved in this contract, shall have access to the Records during normal business hours at an office of Contractor within the State of New York or, if no such office is available, at a mutually agreeable and reasonable venue within the State, for the term specified above for the purposes of inspection, auditing and copying. LIPA shall take reasonable steps to protect from public disclosure any of the Records which are exempt from disclosure under Section 87 of the Public Officers Law (the "Statute") provided that: (i) Contractor shall timely inform LIPA in

3
writing, that said records should not be disclosed; and (ii) said records shall be sufficiently identified; and (iii) designation of said records as exempt under the Statute is reasonable. Nothing contained herein shall diminish, or in any way adversely affect, the State's right to discovery in any pending or future litigation.
DISCLOSURE OF LIPA RECORDS OR INFORMATION. If any third party requests that Contractor disclose LIPA records or information, as defined in subdivision 4 of Section 86 of the Public Officers Law, Contractor shall notify LIPA of such request and LIPA shall determine, in accordance with Chapter 39 of the Laws of 2010, whether such LIPA records or information may be disclosed.
EQUAL EMPLOYMENT FOR MINORITIES AND WOMEN. In accordance with Section 312 of the New York Executive Law: (i) Contractor shall not discriminate against employees or applicants for employment because of race, creed, color, national origin, sex, age, disability, marital status, sexual orientation, genetic predisposition or carrier status and shall undertake or continue existing programs of affirmative action to ensure that minority group members and women are afforded equal employment opportunities without discrimination. Affirmative action shall mean recruitment, employment, job assignment, promotion, upgradings, demotion, transfer, layoff, or termination and rates of pay or other forms of compensation; (ii) at the request of LIPA, Contractor shall request each employment agency, labor union, or authorized representative of workers with which it has a collective bargaining or other agreement or understanding, to furnish a written statement that such employment agency, labor union or representative will not discriminate on the basis of race, creed, color, national origin, sex, age, disability, marital status, sexual orientation, genetic predisposition or carrier status and that such union or representative will affirmatively cooperate in the implementation of Contractor’s obligations herein; and (iii) Contractor shall state, in all solicitations or advertisements for employees, that, in the performance of this Agreement, all qualified applicants will be afforded equal employment opportunities without discrimination because of race, creed, color, national origin, sex, age, disability, marital status, sexual orientation, genetic predisposition or carrier status. Contractor shall include the provisions of (i), (ii) and (iii) above, in every subcontract over twenty–five thousand dollars ($25,000.00) for the construction, demolition, replacement, major repair, renovation, planning or design of real property and improvements thereon (the “Work”) except where the Work is for the beneficial use of Contractor. Upon request, Contractor shall submit within ten (10) days of such request an equal employment opportunity program statement and compliance report.
MINORITY AND WOMEN-OWNED BUSINESS ENTERPRISES. It is the policy of the Authority to provide Minority and Women-Owned Business Enterprises (M/WBEs) the greatest practicable opportunity to participate in the Authority's contracting activity for the procurement of goods and services. To effectuate this policy, Contractor shall comply with the provisions of Article 15-A of the New York Executive Law, the provisions of this Appendix 3 and the provisions relating to M/WBEs as set forth in the Contract Administration Manual.
The Contractor will employ good faith efforts to achieve the M/WBE Goals established for this contract including, but not limited to, inspecting the current New York State Certification Directory of Minority and Women Owned Businesses, prepared for use by state agencies and contractors in complying with Executive law Article 15-A, (the Directory) which is available at

4
the same location where the Authority's bid document or request for proposals may be obtained or inspected and also at the Authority's office at 333 Earle Ovington Boulevard, Suite 403, Uniondale, NY 11553.
For the purposes of the competitive procurement to select a Service Provider, the following goals have been established and upon which a preliminary utilization will be prepared:
Minority-Owned Business Enterprise (MBE) Subcontracting Goal 3.0 %
Women-Owned Business Enterprise (WBE) Subcontracting Goal 1.5%
Six months prior to the first year of operation and annually thereafter, the Authority shall establish M/WBE subcontracting goals and which shall be set forth in the Contract Administration Manual.
Waivers shall only be considered in accordance with the provisions of Article 15-A of the Executive Law.
Upon request, Contractor shall submit within ten (10) days of such request, a complete Utilization Plan, which shall include identification of the M/WBEs which the Contractor intends to use; the estimated dollar amount of business with each such M/WBE; the Contract Scope of Work which the Contractor intends to have performed by such M/WBEs; the commencement and end dates of such performance and other information required by 5 NYCRR 142.4. The Authority will review the plan and, within twenty (20) days of its receipt, issue a written acceptance of the plan or comments on deficiencies in the plan. Following execution of the contract, the Contractor’s preliminary utilization plan based on the goals set forth above will be posted on the Authority’s website. Three months prior to the first year operation and annually thereafter, Contractor shall submit a utilization plan based on the goals set forth in the Contract Administration Manual. Upon approval by the Authority, the annual utilization plans will be posted on the Authority website.
The Contractor shall include in each Subcontract, in such a manner that the provisions will be binding upon each Subcontractor, all of the provisions herein including those requiring Subcontractors to make a good faith effort to solicit participation by M/WBEs.
The Contractor shall cooperate in any efforts of the Authority, or any government agency which may have jurisdiction, to monitor and assist Contractor's compliance with the Authority's M/WBE program. Such cooperation shall include, but is not limited to, submission of Contractor compliance reports as required by 5 NYCRR 142.11. Reports are due on the first business day of each month, beginning thirty (30) days after Contract award.
The Contractor shall not use the requirements of this section to discriminate against any qualified company or group of companies.
Any contractor or subcontractor who willfully and intentionally fails to comply with the M/WBE participation requirements of Executive Law Article 15-A and as such requirements are set forth in the contract shall be liable to the Authority for liquidated damages or other appropriate damages.

5
CONFLICTING TERMS. In the event of a conflict between the terms of the contract (including any and all attachments thereto and amendments thereof) and the terms of this Appendix, the terms of this Appendix shall control.
GOVERNING LAW. This contract shall be governed by the laws of the State of New York except where the Federal supremacy clause requires otherwise.
LATE PAYMENT. Timeliness of payment and any interest to be paid to Contractor for late payment shall be governed by Section 2880 of the Public Authorities Law and the guidelines adopted by LIPA thereto.
PROHIBITION ON PURCHASE OF TROPICAL HARDWOODS. Contractor certifies and warrants that all wood products to be used under this contract award will be in accordance with, but not limited to, the specifications and provisions of State Finance Law §165 (Use of Tropical Hardwoods) which prohibits purchase and use of tropical hardwoods, unless specifically exempted, by the State or any governmental agency or political subdivision or public benefit corporation. Qualification for an exemption under this law will be the responsibility of Contractor to establish to meet with the approval of the State. In addition, when any portion of this contract involving the use of woods, whether supply or installation, is to be performed by any subcontractor, Contractor will indicate and certify in the submitted bid proposal that the subcontractor has been informed and is in compliance with specifications and provisions regarding use of tropical hardwoods as detailed in §165 State Finance Law. Any such use must meet with the approval of the State; otherwise, the bid may not be considered responsive. Under bidder certifications, proof of qualification for exemption will be the responsibility of Contractor to meet with the approval of the State.
MACBRIDE FAIR EMPLOYMENT PRINCIPLES. In accordance with the MacBride Fair Employment Principles (Chapter 807 of the New York Laws of 1992), Contractor hereby stipulates that Contractor either (i) has no business operations in Northern Ireland, or (ii) shall take lawful steps in good faith to conduct any business operations in Northern Ireland in accordance with the MacBride Fair Employment Principles (as described in Article 165 of, the New York State Finance Law), and shall permit independent monitoring of compliance with such principles.
OMNIBUS PROCUREMENT ACT OF 1992. It is the policy of New York State to maximize opportunities for the participation of New York State business enterprises, including minority and women-owned business enterprises as bidders, subcontractors and suppliers on its procurement contracts. Information on the availability of New York State subcontractors and suppliers is available from:
NYS Department of Economic Development Division for Small Business
One Commerce Plaza Albany, New York 12245.
A directory of certified minority and women–owned business enterprises is available from:

6
NYS Department of Economic Development Minority and Women’s Business Development Division
One Commerce Plaza Albany, New York 12245
The Omnibus Procurement Act of 1992 requires that by signing this Agreement, Contractor certifies that:
Contractor has made commercially reasonable efforts to encourage the participation of New York State Business Enterprises as suppliers and subcontractors, including certified minority and woman–owned business enterprises, on this Project, and has retained the documentation of these efforts to be provided upon request to the State; Contractor has complied with the Federal Equal Opportunity Act of 1972 (P.L. 92–261), as amended; and Contractor agrees to make commercially reasonable efforts to provide notification to New York State residents of employment opportunities on this Project through listing any such positions with the Job Service Division of the New York State Department of Labor, or providing such notification in such manner as is consistent with existing collective bargaining contracts or agreements. Contractor agrees to document these efforts and to provide said documentation to the State upon request. Contractor acknowledges that the State may seek to obtain offset credits from foreign countries as a result of this contract and agrees to cooperate with the State in these efforts. RECIPROCITY AND SANCTIONS PROVISIONS. Contractor is hereby notified that if its principal place of business is located in a state that penalizes New York State vendors, and if the goods or services it offers are substantially produced or performed outside New York State, the Omnibus Procurement Act 1994 amendments (Chapter 684, Laws of 1994) require that Contractor be denied contracts which it would otherwise obtain.
PURCHASES OF APPAREL. In accordance with State Finance Law 162 (4-a), LIPA shall not purchase any apparel from any Contractor unable or unwilling to certify that: (i) such apparel was manufactured in compliance with all applicable labor and occupational safety laws, including, but not limited to, child labor laws, wage and hours laws and workplace safety laws, and (ii) Contractor will supply, with its bid (or, if not a bid situation, prior to or at the time of signing a contract with LIPA), if known, the names and addresses of each subcontractor and a list of all manufacturing plants to be utilized by the bidder.
CONTRACTOR AFFIRMATION OF COMPLIANCE AND CERTIFICATION OF DISCLOSURE. Contractor affirms that it understands and agrees to comply with the procedures of the Governmental Entity relative to permissible contacts as required by the State Finance Law § 139-j (3) and § 139-j (6)(b). Furthermore, Contractor certifies that the information disclosed pursuant to State Finance Law § 139-k (5) is complete true and accurate.
OPTIONAL TERMINATION BY THE AUTHORITY. LIPA reserves the right to terminate this contract in the event it is found that the certification filed by Contractor in accordance with New York State Finance Law § 139-k was intentionally false or intentionally incomplete. Upon such finding, LIPA may exercise its termination right by providing written notification to Contractor in accordance with the written notification terms of the contract.

7
CONTINGENT FEES. Contractor hereby certifies and agrees that (a) Contractor has not employed or retained and will not employ or retain any individual or entity for the purpose of soliciting or securing any LIPA contract or any amendment or modification thereto pursuant to any agreement or understanding for receipt of any form of compensation which in whole or in part is contingent or dependent upon the award of any such contract or any amendment or modification thereto; and (b) Contractor will not seek or be paid an additional fee that is contingent or dependent upon the completion of a transaction by LIPA.
NONPUBLIC PERSONAL INFORMATION. Contractor shall comply with the provisions of the New York State Information Security Breach and Notification Act (General Business Law Section 899-aa; State Technology Law Section 208). Contractor shall be liable for the costs associated with such breach if caused by Contractor’s negligent or willful acts or omissions, or the negligent or willful acts or omissions of the Contractor’s agents, officers, employees or subcontractors.

8
Non-Collusive Bidding Certification
Required by Section 2878 of the Public Authorities Law By submission of this bid, bidder and each person signing on behalf of bidder certifies, and in the case of joint bid, each party thereto certifies as to its own organization, under penalty of perjury, that to the best of his/her knowledge and belief:
[1] The prices in this bid have been arrived at independently, without collusion, consultation, communication, or agreement, for the purposes of restricting competition, as to any matter relating to such prices with any other Bidder or with any competitor;
[2] Unless otherwise required by law, the prices which have been quoted in this bid have not been knowingly disclosed by the Bidder and will not knowingly be disclosed by the Bidder prior to opening, directly or indirectly, to any other Bidder or to any competitor; and
[3] No attempt has been made or will be made by the Bidder to induce any other person, partnership or corporation to submit or not to submit a bid for the purpose of restricting competition.
A BID SHALL NOT BE CONSIDERED FOR AWARD NOR SHALL ANY AWARD BE MADE WHERE [1], [2], [3] ABOVE HAVE NOT BEEN COMPLIED WITH; PROVIDED HOWEVER, THAT IF IN ANY CASE THE BIDDER(S) CANNOT MAKE THE FOREGOING CERTIFICATION, THE BIDDER SHALL SO STATE AND SHALL FURNISH BELOW A SIGNED STATEMENT WHICH SETS FORTH IN DETAIL THE REASONS THEREFORE:
[AFFIX ADDENDUM TO THIS PAGE IF SPACE IS REQUIRED FOR STATEMENT.]
Subscribed to under penalty of perjury under the laws of the State of New York, this _________ day of _____________________________, 20 as the act and deed of said corporation of partnership.
IF BIDDER(S) (ARE) A PARTNERSHIP, COMPLETE THE FOLLOWING:
NAMES OF PARTNERS OR PRINCIPALS LEGAL RESIDENCE
______________________________________ ___________________________
______________________________________ ___________________________
______________________________________ ___________________________
______________________________________ __________________________
IF BIDDER(S) (ARE) A CORPORATION, COMPLETE THE FOLLOWING:
NAMES LEGAL RESIDENCE

9
______________________________________ ___________________________
President
______________________________________ ___________________________
Secretary
______________________________________ ___________________________
Treasurer
______________________________________ ___________________________
President
______________________________________ ___________________________
Secretary
______________________________________ ___________________________
Treasurer
Identifying Data:
Potential Consultant: _____________________________________________________________
Street Address: ______________________________________________________________
City, Town, etc. ______________________________________________________________
Telephone: ____________________ Title: __________________________ ________________________________________________ If applicable, Responsible Corporate Officer Name ________________________________________________ Title ________________________________________________ Signature Joint or combined bids by companies or firms must be certified on behalf of each participant: ________________________________________________________________________

10
Legal name of person, firm or corporation Legal name of person, firm or corporation By _____________________________________ By ___________________________ (Name) … (Name) ________________________________________________________________________ Title Title ________________________________________________________________________ Street Address Street Address ________________________________________________________________________ City and State City and State

11
NONDISCRIMINATION IN EMPLOYMENT IN NORTHERN IRELAND: MACBRIDE FAIR EMPLOYMENT PRINCIPLES In accordance with Section 165 of the State Finance Law, the bidder, by submission of this bid certifies that it or any individual or legal entity in which the bidder holds a 10% or greater ownership interest, or any individual or legal entity that holds a 10% or greater ownership in the bidder, either: (answer yes or no to one or both of the following, as applicable), (1) has business operations in Northern Ireland; Yes___ or No___ If yes: (2) shall take lawful steps in good faith to conduct any business operations that it has in Northern Ireland in accordance with the MacBride Fair Employment Principles relating to nondiscrimination in employment and freedom of workplace opportunity regarding such operations in Northern Ireland, and shall permit independent monitoring of their compliance with such Principles. Yes___ or No___ ____________________________ Signature

12
Offerer Disclosure of Prior Non-Responsibility Determinations ************************************************************************ Name of Individual or Entity Seeking to Enter into the Procurement Contract: Address: Name and Title of Person Submitting this Form: Contract Procurement Number: Date: 1. Has any Governmental Entity made a finding of non-responsibility regarding the individual or entity seeking to enter into the procurement contract in the previous four years? (Please circle): No Yes 2. If yes, was the basis for the finding of non-responsibility due to a violation of State Finance Law § 139-j? (Please circle): No Yes 3. Was the basis for the finding of non-responsibility due to the intentional provision of false or incomplete information to a Governmental Entity? (Please circle): No Yes 4. If yes, please provide details regarding the finding of non-responsibility below. Governmental Entity: ____________________________________________________ Date of Finding of Non-Responsibility: ______________________________________ Basis of Finding of Non-Responsibility: ______________________________________ ________________________________________________________________________ ________________________________________________________________________ ________________________________________________________________________ ________________________________________________________________________ ________________________________________________________________________ ________________________________________________________________________ ________________________________________________________________________ ________________________________________________________________________

13
5. Has any Governmental Entity or other governmental agency terminated or withheld a procurement contract with the above-named individual or entity due to the intentional provision of false or incomplete information? (Please circle): No Yes 6. If yes, please provide details below. Governmental Entity: _____________________________________________________ Date of Termination or Withholding of Contract: _______________________________ Basis of Termination or Withholding: ________________________________________ ________________________________________________________________________ ________________________________________________________________________ ________________________________________________________________________ ________________________________________________________________________ ________________________________________________________________________ ________________________________________________________________________ ________________________________________________________________________ ________________________________________________________________________ ________________________________________________________________________ ________________________________________________________________________ ________________________________________________________________________ Offerer certifies that all information provided to the Long Island Power Authority with respect to State Finance Law § 139-k in complete, true and accurate. By: Date:__________________________ Signature

14
CONTINGENT FEE CERTIFICATION In accordance with Section F.2 of Article II of the Long Island Power Authority “Guidelines Regarding the Use, Awarding, Monitoring and Reporting of Procurement Contracts” (the “Guidelines”), Proposer, by submission of this proposal certifies the following with respect to the payment of contingent fees: Proposer has not employed or retained and will not employ or retain any individual or entity for the purpose of soliciting or securing any Long Island Power Authority contract or any amendment or modification thereto pursuant to any agreement or understanding for receipt of any form of compensation which in whole or in part is contingent or dependent upon the award of any such contract or any amendment or modification thereto; and Proposer will not seek or be paid an additional fee that is contingent or dependent upon the completion of a transaction by the Long Island Power Authority. ************************************************************************ FAILURE TO PROVIDE THIS CERTIFICATION WILL BE GROUNDS FOR DISQUALIFICATION IN THE PROCUREMENT PROCESS. VIOLATION OF EITHER (1) OR (2) OF THIS CERTIFICATION SHALL RESULT IN: disqualification of Proposer from the procurement process; and
prohibition of the Proposer from being awarded any contract for a period of three years from the commencement of the procurement process. ************************************************************************ Certified as of the ______ day of _____________, 20__ _______________________________________________ Name of person, firm or corporation By _____________________________________ (Name and Title)

APPENDIX 4
Illustrative Contract Administration Manual Topical Outline1
• Contract Administration Manual (CAM) Overview
• Purpose and Scope of CAM
• CAM Preparation, Review and Approval
• Operations Services Organization
• Service Provider Senior Management, Responsibilities and Delivery Organization
• LIPA Management Organization and Responsibilities
• Key Contact List – Service Provider, LIPA, Third Parties
• Appointment and Replacement of Service Provider Senior Management
• Continuous Improvement
− Performance Metrics Definition and Adjustment Process − Monitoring of Performance − Corrective Actions
• Contract Management
− Contract Change Control − LIPA Service Satisfaction − Contract Auditing − Intellectual Property Control − Subcontractor Approval Process
• Insurance and Risk Management − Operating Period Insurance Validation − Notification of changes or cancellation of Required Operating Period Insurance − Claim Management
1 This preliminary outline is designed to set forth the items expected to be contained in the Contract
Administration Manual. The outline is not intended, nor should it be deemed to be an exclusive list, but rather representative of the matters the Parties intend the Manual to address. The actual provisions of the Manual will be developed and agreed upon by LIPA and the Service Provider.

• Business Continuity and Disaster Planning Recovery
− Backup Power in Key Facilities − Alternate Facilities and Systems − Integrated and common communication systems − Backup Communications − Backup Records − Physical Security − Other
• Asset Strategy and Objectives
• Procurement of Goods and Services
− Competitive Solicitation − Approval Authorization
• Communications
• Security
• Legal Services
• General Record Keeping and Reporting • Service Provider Obligations Upon Termination or Expiration
− Back-End Transition Services Requirements − Back-End Transition Reporting Requirement − Exit Test − Other Service Provider Obligations − Transfer of the Contract Administration Manual and Operations Manual Upon
Termination or Expiration − Procedure to transfer to Successor Service Provider − Procedure to transfer to LIPA − Other
• Other

APPENDIX 5
Illustrative Operations Manual Topical Outline2
• Operations Manual Overview • Purpose and Scope of Operations Manual • Preparation, Review, Approval and Control of Operations Manual Procedures • T&D Systems Operations and Maintenance3
- TD Overhead and Underground Design Configuration Control Electric Distribution System New Business Construction, Public Works, Accident Billing Training Transmission Inside Plant Transmission Outside Plant Electric Distribution System - TD Services Administrative-Clerical Electric Maintenance Environmental Environmental/Manual Environmental/National Grid Environmental Procedures Environmental/Permits Environmental/Substation and Cable SPCC Environmental/Substation and Cable SPCC/Fluid Filled Cable SPCC Environmental/Substation and Cable SPCC/ORIGINAL SUB PLANS 2006 Environmental/Substation and Cable SPCC/Select Revised Sub SPCCs Fleet Management Materials and Logistics Management Safety Safety/Line Safety Evaluation Practice Safety/Training - TD Projects and Construction Design Configuration Control
2 This preliminary outline is designed to set forth the items expected to be contained in the Operations Manual.
The outline is not intended, nor should it be deemed to be an exclusive list, but rather representative of the matters the Parties intend the Manual to address. The actual provisions of the Manual will be developed and agreed upon by LIPA and the Service Provider.
3 The level of detail depicted in this section applies to all sections of this outline.

Electric Maintenance New Business Construction, Public Works, Accident Billing Infrastructure Access - T&D - Asset Management Design Configuration Control Field Operations Management Information Performance Management Process Mapping Project and Contractor Management System and Capacity Planning Transmission - Policy Work-Cost Plan Optimization - T&D - Operations Design Configuration Control Electric Distribution System Electric Maintenance Field Operations Electric System Operations Tagging Transmission Reliability, Standards and Compliance - T&D - Substation Protection and Telecom Design Configuration Control Design Standards/Typical Substation Design Guidelines Equipment Standards and Specs Electric Distribution System Electric Maintenance Training Transmission Inside Plant Electric Distribution System - Functional Area - T&D - Emergency Planning Emergency Response ERIP 1.1.1 - Operations System - Sys HQ Procedures ERIP 1.1.2- Operations System - Sys HQ Procedures ERIP 1.2.1 - Operations System - Div HQ Procedures ERIP 1.3.1 - Operations System - Substation Procedures ERIP 2.2.1 - Support Services - Emergency Comm Procedures ERIP 3.1.1 - Regional Information Center - Emergency Comm Procedures LSEP 1.1.0 - Logistics Support Emergency Plan

• Customer Service Operations
− Customer Satisfaction − Customer Contact - Call Centers Walk-ins, etc. − Inbound and Outbound Communications − Marketing and Sales − Billing, Collection and Revenue Cycle − Rates, Tariffs and Load Forecasting − Records and Reports
• Business Services Operations: − Finance, Accounting, Budgeting and Financial Forecasting and Treasury Operations − Human Resources − Information Technology − Procurement − Business Shared Services
− Business Continuity − Security − Nine Mile Point II − Records Management − Legal − Facilities − Performance Excellence − Public Affairs

1
APPENDIX 6
Term Extension Option Criteria
The Service Provider shall be deemed to have achieved the level of performance set forth under Section 2.1(B) of the Agreement if, during the last six (6) Contract Years of the first ten (10) Contract Years of the Term, the Service Provider has, for any four (4) of such six (6) Contract Years, achieved targeted performance levels as provided in Appendix 9 to the Agreement for at least a majority of the Performance Metrics listed in Table 3 in Appendix 9 to the Agreement.

1
APPENDIX 7
Power Supply, Fuel Procurement and Related Services
(See Attached)

APPENDIX 8
Optional Capital Additions
The following list is intended to be illustrative:
Energy efficiency and/or demand response investments
• Incentives or investments to increase customer adoption of energy efficiency and demand response programs in hard to reach markets such as residential demand response and energy efficiency, and energy efficiency in under-served commercial applications (including government, schools, multi-family and hospital facilities)
Renewable energy investments
• Install, own and operate renewable energy facilities on underutilized and hard to develop properties such as landfills and brownfields
Energy Storage
• Install, own and operate energy storage technologies to alleviate delivery system constraints
• Integrate energy storage with renewable sources to enhance critical customer reliability and storm resiliency, and/or mitigating distribution system impacts inherent with renewable sources
Distributed generation investments
• Install, own and operate backup generation at critical facilities
Electric vehicle charging stations
• Install, own and operate electric charging stations to facilitate the development of the alternative fuel vehicle markets
Other discrete, energy-related investment programs

1
APPENDIX 9
Performance Metrics Chart
(A) General. For each Contract Year, the Service Provider shall be eligible to earn Incentive
Compensation based on Service Provider’s performance during the Contract Year as measured against the
Performance Goals for the Operations Services as set forth in the Performance Metrics.
(B) Performance Categories. To ensure the Performance Goals are appropriately weighted,
the Incentive Compensation Pool shall be allocated among several key areas of performance (“Performance
Categories”) as set forth in Table 1. No portion of the Incentive Compensation Pool is allocated to the Cost
Management Performance Category because the Service Provider must achieve the Cost Management
Performance Metrics to be eligible for Incentive Compensation in the other Performance Categories (see
Section (C)(2)).
Table 1: Summary of Performance Categories
Performance
Category Performance Goal
Allocation of
Incentive
Compensation
Pool
1. Cost Management Achieve the spending levels equal to or less than 102% of the approved Capital Budget, and achieve the spending levels equal to or less than 102% of the approved Operating Budget.
Not Applicable (NA)
2. Customer Satisfaction Achieve high levels of end use customer satisfaction.
40%
3. Technical and Regulatory Performance
Provide safe, reliable power supply in a manner compliant with applicable safety, environmental and other regulations.
30%
4. Financial Performance Meet LIPA's financial performance needs.
30%
(C) Measurement of Performance.

2
(1) For each Contract Year, the level of performance in each Performance Category
shall be measured based on actual results achieved for the Contract Year. For this purpose, one or more
Performance Metrics shall be associated with each Performance Category. All Performance Metrics will be set
forth in the Contract Administration Manual and are subject to revision as described in Section (G).
(2) The Service Provider must achieve both Performance Metrics associated with the
Cost Management Performance Category to be eligible for 100% of Incentive Compensation in the other
Performance Categories for a Contract Year. If, in any Contract Year, the Service Provider achieves only one
of the Cost Management Performance Metrics, the Service Provider will be eligible for a maximum of 50% of
the Incentive Compensation for that year. If, in any Contract Year, the Service Provider achieves neither of the
Cost Management Performance Metrics, the Service Provider will not be eligible for any Incentive
Compensation for that year. If the Service Provider fails to achieve a Performance Metric in the Cost
Management Performance Category for two consecutive Contract Years, the Service Provider will not be
eligible for any Incentive Compensation for the second Contract Year.
(3) For all Performance Categories other than Cost Management, the Service
Provider performance shall be determined by the level of achievement of the Performance Objective for each
Performance Metric under a Performance Category as described in Section (C)(4). Such level of achievement
will determine the portion of the allocated Incentive Compensation Pool earned by the Service Provider as
described in Section (D).
(4) As a general standard for metrics and where appropriate, the Target Performance
Level will be First Quartile performance. Any benchmark source used to establish First Quartile values and any
adjustments to a Target Performance Level must reflect local and regulatory considerations and will be subject
to the Parties’ approval. First Quartile, Second Quartile, Third Quartile and Fourth Quartile under the
Agreement and the Appendices thereto shall be determined as follows: the relevant data will be set in order
from best result to worst result. The “Median” will be determined as the middle value in the data set. Should
the Median fall between two numbers, it will be the mean of those two values. Once the Median is determined,
the top half values not including the Median will be used to determine the First Quartile. The lower boundary
of the “First Quartile” will be computed as the median value of the top half results. If such lower boundary is
between two data points, the mean of the two values shall be the lower boundary. The quartile below the lower
boundary of the First Quartile and at or above the Median shall be the “Second Quartile”. To determine the
“Third Quartile”, the lower half values not including the Median will be used and the median of that data set
will be the lower boundary of the Third Quartile. Should the median fall between two data points, the mean of
the two values shall be the lower boundary. The quartile below the lower boundary of the Third Quartile shall
be the “Fourth Quartile”.

3
(5) Each Performance Metric, other than those contained in the Cost Management
Performance Category, will have an assigned point weighting (“Base Points”) and shall be designated as either
(i) a Maintenance Metric, or (ii) an Improvement Metric.
(a) Maintenance Metrics are those Performance Metrics for which satisfactory
performance levels are currently being achieved. The general goal of Maintenance Metrics is to incent
continued satisfactory performance (generally First Quartile).
Each Maintenance Metric will have a specified “Minimum Performance Level,” a “Points Earned
Threshold,” and an “Above Target Performance Threshold.” The Minimum Performance Level is that level of
performance below which potential Incentive Compensation may be reduced as set forth in Section (D)(4). The
Points Earned Threshold Performance Level is that level of achieved performance at or above which the Service
Provider shall be awarded the Base Points assigned to that Performance Metric. The Above Target
Performance Threshold is that level of achieved performance at or above which the Service Provider shall be
awarded points at a specified multiple of the Base Points.
Maintenance Metrics incorporate award of points in varying amounts (percentages of Base Points) based
on actual performance relative to several ranges of performance illustrated in Figure 1 and listed below.
• Target Range: The range of performance for which the Service Provider will earn 100% of the
Base Points. The Target Range of Performance for each Maintenance Metric shall be established
by the Parties before the Service Commencement Date or the Parties after the Service
Commencement Date, as per Section (G), as appropriate, considering actual historical
performance or other relevant data and described in Section (L).
• Below Target Range: A range between the Points Earned Threshold (exclusive) and the
Minimum Performance Level (inclusive), in which the Service Provider will earn no points.
Although the Service Provider will not earn points for performance in the Below Target Range,
such level of performance shall not constitute a failure to perform to the Minimum Performance
Level for the subject Performance Metric.
• Below Minimum Range: A range comprised of all levels of performance that are unfavorable in
comparison to the Minimum Performance Level. The Service Provider will not earn points for
performance in the Below Minimum Range.
• Above Target Range: A range of performance that is considered to be in excess of Above
Target Performance Threshold and is in excess of performance of the Target Range. The Service
Provider shall be awarded a multiple of the Base Points for performance in the Above Target
Range.

4
The levels of performance and associated point multipliers that define each range for each Maintenance
Metric are set forth in the description is contained in Section (L).
Figure 1. Example Maintenance Metric
(b) Improvement Metrics are those Performance Metrics for which current
performance is unsatisfactory. The goal of Improvement Metrics (generally First Quartile) is to incent
improved performance over time. These metrics provide for the award of Base Points in varying degrees
(percentages) based on the Service Provider’s actual performance relative to several ranges of performance that
vary annually. Figure 2 illustrates a generic design for an Improvement Metric.
Improvement is measured relative to a “Baseline Performance Level” that represents the starting level of
performance, e.g., the level of performance at Handover, typically 2013 performance. For Performance Metrics
that are not currently tracked, Baseline Performance Level may be an average of performance measured during
the Transition Period (as defined in the TSA). Baseline Performance Level for each Improvement Metric shall
be established by the Parties before the Service Commencement Date or the Parties after the Service
Commencement Date as per Section (G), as appropriate, considering actual historical performance and other
relevant factors. The Minimum Performance Level for Improvement Metrics is determined by a straight line
between the Baseline Performance Level and Target Performance Level in Contract Year 10.
Performance ranges for determination of Base Points earned shall be based on achieving performance
improvement from the Baseline Performance Level to the Target Performance Level over a specified period of
time (e.g., five years) ending in the “Target Year.” The straight line between the Baseline Performance Level

5
and the Target Performance Level achieved in the Target Year shall determine the performance levels necessary
to earn 100% of the Base Points in each Contract Year. The performance levels necessary to earn greater or
lesser percentages, the “Base Point Multipliers,” of Base Points in each Contract Year shall be established by
the straight lines between the Baseline Performance Level and the Target Performance Level achieved in one-
year increments or decrements to the Target Year. For example, if the Target Year is 2018, the straight line
between the Baseline Performance Level at 2013 and 2017 shall establish the performance levels to earn 125%
of the Base Points in a given Contract Year.
The levels of performance and associated Base Point Multipliers for each Improvement Metric are set forth in Section (L).
Figure 2.
Example Improvement Metric
(D) Incentive Compensation.
(1) Eligibility. The Service Provider shall be eligible to earn Incentive Compensation
for a Contract Year only to the extent that the Cost Management Performance Category Performance Metrics
are achieved as described in Section (C)(2).
(2) Allocation of Incentive Compensation Pool. The annual Incentive Compensation
Pool shall be allocated among the Performance Categories as set forth in Table 1.

6
(3) Determination of Incentive Compensation. If the Service Provider is eligible to
earn Incentive Compensation for a Contract Year, the Incentive Compensation shall be determined as follows:
(a) For each Performance Category, the points earned for meeting or
exceeding the Performance Levels of the associated Performance Metrics (as set forth in each Performance
Metric) shall be aggregated.
(b) The point total earned for each Performance Category shall be divided by
the total points specified in the Base Points column of Table 3 opposite the description “Maximum Possible
Points in Category” for the relevant Performance Category to produce a fraction (the “Performance Score”) for
each Performance Category. (Example: If the points earned in the Customer Satisfaction Category total 20 and
given that the “Maximum Possible Points in Category” for the Customer Satisfaction Performance Category as
set forth in Table 3 are 50, then the Performance Score would be 0.4 (20 divided by 50)).
(c) The Service Provider’s Incentive Compensation for each Performance
Category shall be the product of (i) the potential Incentive Compensation Pool and (ii) the Performance Score
for the Performance Category. (Example: If the Performance Score is 0.4 and the allocated Incentive
Compensation Pool is $2 million for the subject Performance Category, then the Service Provider would earn
$800,000 for that Performance Category ($2,000,000 times 0.4)).
(d) The total annual Incentive Compensation paid to the Service Provider
shall be the sum of the Incentive Compensation earned for all Performance Categories, adjusted in accordance
with Section (D)(4); provided, however, that total annual Incentive Compensation may not exceed the limitation
set forth in Section 5.1(C)(2) of the Agreement.
(4) Incentive Compensation Adjustment. Commencing in Contract Year three, the
annual Incentive Compensation for a Performance Category for any Contract Year shall be reduced by (i) 50%
if the Service Provider has failed to achieve the Minimum Performance Level for the same Performance Metric
in that Performance Category in the then-current Contract Year and any one of the two preceding Contract
Years, or (ii) 100% if the Service Provider has failed to achieve the Minimum Performance Level for two or
more of the same Performance Metrics in that Performance Category in the then-current Contract Year and any
one of the two preceding Contract Years; provided, however, that, in each case such failure shall be excused to
the extent of a Force Majeure event or LIPA Fault, but only to the extent that such event prevents or delays the
Service Provider’s achievement of such metric. Further, for the purposes of this adjustment, the Performance
Metrics in the Customer Satisfaction Category; 2.1 and 2.2, JD Power Customer Satisfaction Survey

7
(Residential and Business) 2.3 and 2.4 After Call Survey (Residential and Business) and 2.5 Personal Contact
Survey will operate as a single performance metric, the “Customer Survey Performance Metric”. Failure of the
Customer Survey Performance Metric is defined as the Service Provider achieving less than 60% of the total
points assigned to the Customer Survey Performance Metric.
(E) Penalties. Notwithstanding the provisions above for determination of adjustments to
Incentive Compensation, commencing in Contract Year three, failure of the Service Provider to (i) earn at least
60% of the total points assigned to the Customer Survey Performance Metric, or (ii) meet the Minimum
Performance Level for SAIDI, in either case in the then-current Contract Year and any one of the two preceding
Contract Years, shall result in (a) forfeiture of 100% of Incentive Compensation for the Contract Year, and (b)
payment to LIPA of a penalty of 5% of the fixed component of the Management Services Fee; provided,
however, that, in each case such failure shall be excused to the extent of a Force Majeure event or LIPA Fault,
but only to the extent that such event prevents or delays the Service Provider’s achievement of such metric.
(F) Performance Metric Tiers. In addition to the Performance Metrics that are subject of the
annual Incentive Compensation provisions of this Section, the Parties shall establish and track other
Performance Metrics to assist in managing the Operations Services. All Performance Metrics shall be arranged
in Tiers as summarized in Table 2. All Performance Metrics, regardless of tier assignment, shall be defined in
the Contract Administration Manual, as appropriate, to reflect evolving business conditions.
Table 2: Summary of Performance Metric Tiers
Tier Description 1 Tied to Incentive Compensation: Performance Metrics subject to the
annual Incentive Compensation provisions of the Agreement. 2 Subject to Active Performance Management: Performance Metrics that
are subject to active performance management as determined by the Parties, and not included in Tier 1.
(G) Adjustments to Performance Metrics. (1) The Parties may revise Performance Metrics
from time-to-time based on changes in LIPA’s business conditions, the desire to re-focus performance on other
aspects of operations, actual levels of performance achieved, timing considerations, capital investments, major
system implementations, staffing considerations or other reasons. For example, such revisions may include
modification of the Minimum Performance Level, the Target Performance Level, or change in the points
assigned to the subject Performance Metric. Revisions may also include reassignment of Performance Metrics
among the designated Performance Categories and tiers, creation of new Performance Metrics, or elimination of
existing Performance Metrics. In particular, the Parties may modify the parameters of a Maintenance Metric if

8
business or technical conditions indicate a need, or move a Maintenance Metric to Tier 2. Also, after
performance of an Improvement Metric reaches the established Target Level, the Performance Metric may be
(i) modified to establish a new improvement Target Level; (ii) switched to the Maintenance Metric design with
appropriate parameters; or (iii) assigned to Tier 2 at the discretion of the Parties.
(2) The Parties agree to adopt and implement the outage management system
developed by PSEG Services Corporation (the “New Outage Management System”). The Parties acknowledge
that their expectation based on industry practice is that the implementation of the New Outage Management
System will lead to improvement in outage identification capabilities, which may result in a change in the
number and/or the duration of outages identified. Accordingly, notwithstanding anything to the contrary in this
Appendix 9 or in the Agreement, upon implementation of the New Outage Management System, the Baseline,
the Base Points Multiplier, the Minimum Performance Levels, the Target Performance Levels, the Points
Earned Thresholds and Above Target Performance Thresholds assigned to the SAIDI, SAIFI, and CAIDI
Performance Metrics will be adjusted to account for the impacts of the new system. The adjustment
methodology and impact will be mutually agreed upon by the Parties at or promptly after the implementation of
the New Outage Management System. The Performance Metrics as adjusted shall be effective for all purposes
under the Agreement and this Appendix 9 including with respect to the Major Storm Performance Metric, the
Minimum Performance Level Metric and the Term Extension Option Criteria.
(H) Monitoring and Reporting. In addition to the Service Provider’s other reporting
obligations as set forth in this Agreement, during the Term, the Service Provider will monitor actual
performance relative to all Performance Metrics and industry peer benchmarks, and provide a comprehensive
annual report to LIPA with respect to such performance in accordance with Section 5.1(C) of the Agreement.
LIPA shall have full access to all records necessary to verify the reported performance.
(I) Continuous Improvement. It is the intent of the Parties to seek continuous improvement
in the performance of the overall operation of the T&D System where appropriate to achieve the Performance
Objectives.
(1) The Service Provider shall develop and implement performance management
programs for each Tier 1 Performance Metric. Such plans shall include identification of related processes, key
drivers of performance, methods to improve or maintain performance (depending on the Performance Objective
of the subject Performance Metric), implementation steps and schedule.

9
(2) The Parties may agree to (i) increase the Minimum Performance Levels and
Target Performance Levels to reflect improved performance capabilities associated with advances in the proven
processes, technologies and methods available to perform the Operations Services, (ii) add new Performance
Metrics to permit further measurement or monitoring of the accuracy, quality, completeness, timeliness,
responsiveness, cost-effectiveness, or productivity of the Operations Services, (iii) modify the Minimum
Performance Levels and Target Performance Levels to reflect changes in the processes, architecture, standards,
strategies, needs or objectives defined by the Parties, and (iv) modify the Minimum Performance Levels and
Target Performance Levels to reflect agreed upon changes in the manner in which the Operations Services are
performed by the Service Provider.
(3) For purposes of determining the Service Provider’s Incentive Compensation
under Section 5.1(C) of the Agreement, the Parties acknowledge and agree that, notwithstanding anything to the
contrary in this Appendix 9 or the Agreement, the baselines, targeted levels and thresholds assigned to the
Performance Metrics as set forth in this Appendix 9 including the Baseline, the Base Points Multiplier, the
Minimum Performance Levels, the Target Performance Levels, the Points Earned Thresholds and Above Target
Performance Thresholds shall not be adjusted to reflect improvement in the Service Provider’s performance
capabilities if such improvement resulted from any expenditures made by the Service Provider in accordance
with an approved Budget, unless such adjustment is agreed upon in writing by the Service Provider.
(J) Corrective Action. If the Service Provider fails to achieve the Minimum Performance
Level for a Tier 1 Performance Metric in any year, the Service Provider shall prepare within 30 days of the date
upon which the Parties become aware of the failure, and provide to LIPA a Corrective Action Report, which
includes an analysis of the root cause of the failure, including technical, process and resource evaluations, and a
Corrective Action Plan including a detailed schedule for implementation of the actions to remediate the failure.
LIPA shall regularly monitor the Service Provider’s progress on improving its performance in accordance with
the Corrective Action Plan.
(K) Summary of Performance Metrics. The Performance Metrics that form the basis for
Incentive Compensation (Tier 1) are summarized in Table 3. Details of these Performance Metrics are
described in the text following Table 3.
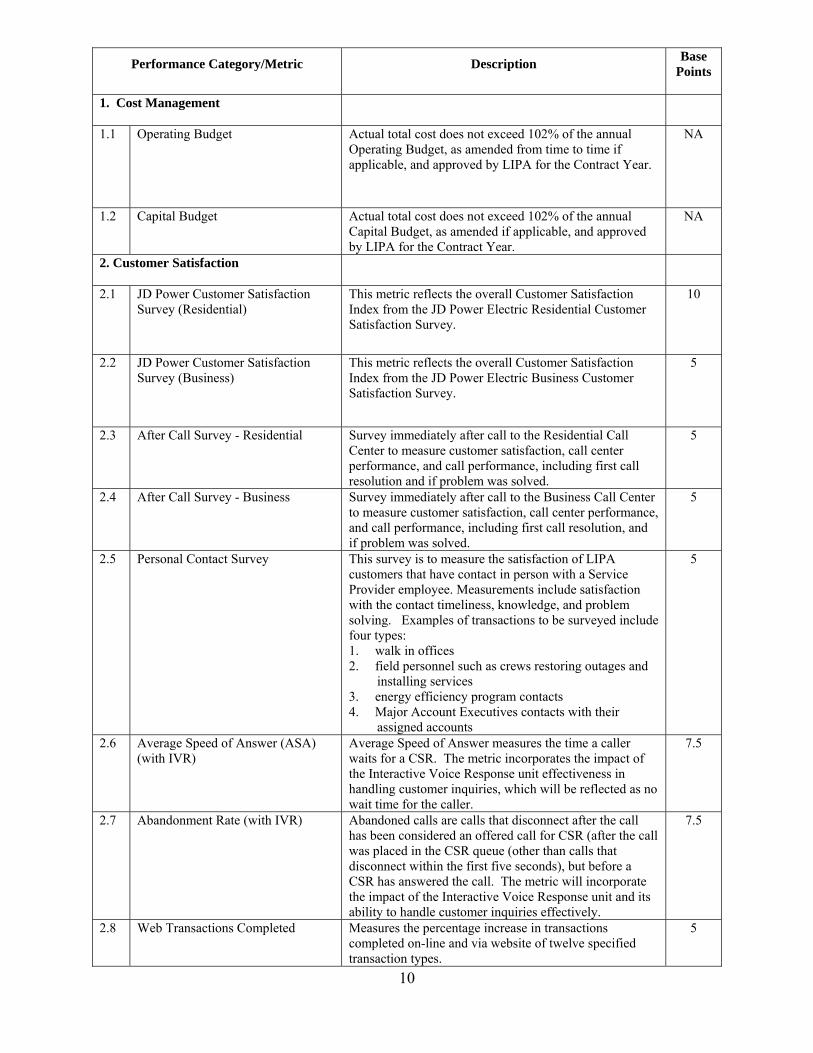
Table 3: Summary of Initial Tier 1 Performance Metrics
Performance Category/Metric
Description
Base Points
10
Performance Category/Metric
Description
Base Points
1. Cost Management
1.1 Operating Budget Actual total cost does not exceed 102% of the annual Operating Budget, as amended from time to time if applicable, and approved by LIPA for the Contract Year.
NA
1.2 Capital Budget Actual total cost does not exceed 102% of the annual Capital Budget, as amended if applicable, and approved by LIPA for the Contract Year.
NA
2. Customer Satisfaction
2.1 JD Power Customer Satisfaction Survey (Residential)
This metric reflects the overall Customer Satisfaction Index from the JD Power Electric Residential Customer Satisfaction Survey.
10
2.2 JD Power Customer Satisfaction Survey (Business)
This metric reflects the overall Customer Satisfaction Index from the JD Power Electric Business Customer Satisfaction Survey.
5
2.3 After Call Survey - Residential Survey immediately after call to the Residential Call Center to measure customer satisfaction, call center performance, and call performance, including first call resolution and if problem was solved.
5
2.4 After Call Survey - Business Survey immediately after call to the Business Call Center to measure customer satisfaction, call center performance, and call performance, including first call resolution, and if problem was solved.
5
2.5 Personal Contact Survey This survey is to measure the satisfaction of LIPA customers that have contact in person with a Service Provider employee. Measurements include satisfaction with the contact timeliness, knowledge, and problem solving. Examples of transactions to be surveyed include four types: 1. walk in offices 2. field personnel such as crews restoring outages and
installing services 3. energy efficiency program contacts 4. Major Account Executives contacts with their
assigned accounts
5
2.6 Average Speed of Answer (ASA) (with IVR)
Average Speed of Answer measures the time a caller waits for a CSR. The metric incorporates the impact of the Interactive Voice Response unit effectiveness in handling customer inquiries, which will be reflected as no wait time for the caller.
7.5
2.7 Abandonment Rate (with IVR) Abandoned calls are calls that disconnect after the call has been considered an offered call for CSR (after the call was placed in the CSR queue (other than calls that disconnect within the first five seconds), but before a CSR has answered the call. The metric will incorporate the impact of the Interactive Voice Response unit and its ability to handle customer inquiries effectively.
7.5
2.8 Web Transactions Completed Measures the percentage increase in transactions completed on-line and via website of twelve specified transaction types.
5

11
Performance Category/Metric
Description
Base Points
Maximum Possible Points in Category 50 3. Technical and Regulatory Performance
3.1 System Average Interruption Duration Index (SAIDI)
Total duration of interruption for the average customer during each Contract Year, computed in accordance with IEEE standard 1366 measured for each Contract Year. Excludes only outages due to Major Storms.
10
3.2 System Average Interruption Frequency Index (SAIFI)
Frequency of sustained interruption within a Contract Year, computed in accordance with IEEE standard 1366 measured for each Contract Year. Excludes only outages due to Major Storms.
5
3.3 Customer Average Interruption Duration Index (CAIDI)
Average time per customer to restore service, computed in accordance with IEEE standard 1366 measured for each Contract Year. Excludes only outages due to Major Storms.
5
3.4 OSHA Recordable Incidence Rate Total illness and injury rate. The total OSHA recordable injury and illness cases based on the exposure of 100 full-time workers, using 200,000 hours as the equivalent. This metric includes hearing loss.
5
3.5 OSHA Days Away Rate (Severity) The severity of OSHA incidents that have occurred as measured by the number of lost workdays that can be attributed to an OSHA incident.
5
Maximum Possible Points in Category 30
4. Financial Performance
4.1 Actual Meter Read Rate Actual Meter Read Rate measures the timely reading of meters scheduled to be read, residential and business, subject to exclusions for reasons approved by the Parties.
5
4.2 Timely Billing Timely Billing measures the timely rendering of accurate bills to customers by focusing the Service Provider on timeliness of working billing exceptions. This metric measures the % of “no-bill” billing exceptions completed and accounts billed within the prescribed 3 day requirement for completion.
5
4.3 Days Sales Outstanding Days Sales Outstanding measures the days of revenues billed but not yet collected. This metric is a measure of the average number of days that it takes the Service Provider to collect revenue after the account has been billed.
5
4.4 Net Write Offs per $100 Billed revenue
Net Write-Offs per $100 Billed Revenues measures the effectiveness of recovery efforts of uncollectible revenue. The metric is an overall measure of the possibility of the business incurring bad debts and represents a comparison between total sales and those for which payment is not recoverable and therefore written off as losses.
5
4.5 Electric Damages per 1,000 Locates Number of Third Party damages to electric facilities per 1,000 markout requests.
5

12
Performance Category/Metric
Description
Base Points
4.6 ELI Achieved Load Reduction Coincident peak reduction in comparison to the goal for
each Contract Year with associated energy reduction designed to improve overall LIPA system load factor, subdivided between customer segments as appropriate.
5
Maximum Possible Points in Category 30
(L) Performance Metrics. Each Tier 1 Performance Metric is described in detail below and
an example of the calculation, illustrative performance metric graph, and historical data, as available, is
included as Attachment 1 to this Appendix.
(1) Cost Management Performance Category. Performance Metrics in this category
are directed at achieving spending levels at or below 102% of each of the approved annual Operating and
Capital Budgets.
1.1 Operating Budget
Performance Objective: Work within 102% of the amount of the approved Operating Budget, as
amended from time to time if applicable.
Description: Actual total cost does not exceed 102% of the approved annual Operating Budget,
as amended from time to time if applicable, and approved by LIPA for the Contract Year.
Points Assigned: No points are assigned. However, the Service Provider must achieve at least
one of the two Performance Metrics in the Cost Management Performance Category to be eligible for
any Incentive Compensation in the other Performance Categories.
Calculation of Operating Budget: For purposes of this Performance Metric the Operating Budget
shall be as defined in Appendix 1 of the Agreement.
Target Level of Performance: For a Contract Year, the amounts spent shall not exceed 102% of
the approved Operating Budget, as amended from time to time if applicable.
Minimum Level of Performance: Not applicable.
1.2 Capital Budget
Performance Objective: Work within 102% of the amount of the approved Capital Budget, as
amended from time to time if applicable, in all material respects.

13
Description: Actual total cost associated with Capital Work Plan, as amended from time to time
if applicable, does not exceed 102% of the amount for the annual Capital Budget, as amended from time
to time if applicable, and approved by LIPA for the Contract Year.
Points Assigned: No points are assigned. However, the Service Provider must achieve at least
one of the two Performance Metrics in the Cost Management Performance Category to be eligible for
any Incentive Compensation in the other Performance Categories.
Calculation of Capital Budget: For purposes of this Performance Metric the Capital Budget shall
be as defined in Appendix 1 of the Agreement.
Target Level of Performance: For a Contract Year, the amounts spent shall not exceed 102% of
the approved Capital Budget, as amended from time to time if applicable.
Minimum Level of Performance: Not applicable.
(2) Customer Satisfaction Category. Performance Metrics in this category are
directed at achieving high levels of end use customer satisfaction.
2.1 JD Power Customer Satisfaction Survey (Residential)
Performance Objective: Improvement in the overall Customer Satisfaction Index result from the
JD Power Customer Satisfaction Survey for Residential customers .
Type of Performance Metric: Improvement
Description: This metric comprises the overall JD Power and Associates Annual Electric Utility
Customer Satisfaction Study for Residential Customers for the “East Region, Large Segment”.
Points Assigned: 10 points total

14
Calculation: The score will be as reported as the JD Power Customer Satisfaction Survey
(Residential) score, adjusted as appropriate to reflect, for Contract Year 2014, the survey results from
the calendar year 2014 only, and thereafter, the survey results produced under the standard JD Power
approach.
Target Level of Performance (assuming funding at requested levels): Set at the First Quartile
lower boundary value for the Large Customer East Peer Panel to be achieved by Contract Year five.
Baseline: Set at 2013 performance.
Minimum Level of Performance: Set at a straight line from the Baseline to Target Level of
Performance by Contract Year 10 for each question in the JD Power Customer Satisfaction Survey
(Residential).
Base Points Multiplier: The table below indicates the Base Points Multipliers associated with
performance leading to achievement of the Target Performance Level by each Contract Year:
Contract Year 1 - 3 4 5 6 7 8 – 10
Base Points Multiplier 150% 125% 100% 50% 25% 0%
2.2 JD Power Customer Satisfaction Survey (Business)
Performance Objective: Improvement in the overall Customer Satisfaction Index result from the
JD Power Customer Satisfaction Survey result for Business Customers.
Type of Performance Metric: Improvement
Description: This metric comprises the overall result from the JD Power and Associates Annual
Electric Utility Customer Satisfaction Study for Business Customers for the “East Region, Large
Segment”.
Points Assigned: 5 points total.

15
Calculation: The score will be as reported as the JD Power Customer Satisfaction Survey
(Business) score, adjusted as appropriate to reflect survey results, for Contract Year 2014, the survey
results from the calendar year 2014 only, and thereafter, the survey results produced under the standard
JD Power approach.
Target Level of Performance: Set at the First Quartile lower boundary value of the Large
Customer East Peer Panel to be achieved by Contract Year five.
Baseline: Set at 2013 performance.
Minimum Level of Performance: Set at a straight line from the Baseline to Target Level of
Performance by Contract Year 10 for each question in the JD Power Customer Satisfaction Survey
(Business).
Base Points Multiplier: The table below indicates the Base Points Multipliers associated with
performance leading to achievement of the Target Performance Level by each Contract Year:
Contract Year 1 - 3 4 5 6 7 8 – 10
Base Points Multiplier 150% 125% 100% 50% 25% 0%
2.3 After Call Survey – Residential
Performance Objective: Residential customers value phone contact as a positive experience that
meets their service needs.
Type of Performance Metric: Improvement
Description: Survey immediately after calls to the Residential Call Center to measure customer
satisfaction, call center performance, and call performance, including first call resolution and if problem
was solved.

16
After Call Survey specifics: Interactive Voice Response (IVR) survey immediately after calls
that asks a few (3-5) questions with a scale, for example, of Very Satisfied (VS), Satisfied (S), Neither
Satisfied nor Unsatisfied, Unsatisfied, and Very Unsatisfied. The top two boxes (VS, S) are counted as
percent customer satisfied.
Points Assigned: 5 points.
Calculation: Calculated as the percent of responses to each of 3-5 short IVR based questions
indicating that the respondent is top two box satisfied (out of 5 box option) with the services received.
Target Level of Performance: Target performance level will be based on an established and
agreed upon percentage improvement from Baseline performance, to be achieved by Contract Year Five.
Baseline: Set at 2013 performance.
Minimum Level of Performance: Set at a straight line from the Baseline to Target Level of
Performance by Contract Year 10.
Base Points Multiplier: The table below indicates the Base Points Multipliers associated with
performance leading to achievement of the Target Performance Level by each Contract Year:
Contract Year 1 - 3 4 5 6 7 8 – 10
Base Points Multiplier 150% 125% 100% 50% 25% 0%
2.4 After Call Survey – Business
Performance Objective: Business customers value phone contact as a positive experience that
meets their service needs.
Type of Performance Metric: Improvement

17
Description: Survey immediately after call to the Business Call Center to measure customer
satisfaction, call center performance, and call performance, including first call resolution, and if problem
was solved.
After Call Survey Specifics: IVR survey immediately after calls that asks a few (3-5) questions
with scale, for example, of Very Satisfied, Satisfied, Neither Satisfied nor Unsatisfied, Unsatisfied, and
Very Unsatisfied. The top two boxes (VS, S) are counted as percent customer satisfied.
Points Assigned: 5 points.
Calculation: Calculated as the percent of responses to each of 3-5 short IVR based questions
indicating that the respondent is top two box satisfied (out of 5 box option) with the services received.
Target Level of Performance: Target performance level will be based on an established and
agreed upon percentage improvement from Baseline performance, to be achieved by Contract Year 5.
Baseline: Set at 2013 performance.
Minimum Level of Performance: Set at a straight line from the Baseline to Target Level of
Performance by Contract Year 10.
Base Points Multiplier: The table below indicates the Base Points Multipliers associated with
performance leading to achievement of the Target Performance Level by each Contract Year:
Contract Year 1 - 3 4 5 6 7 8 – 10
Base Points Multiplier 150% 125% 100% 50% 25% 0%
2.5 Personal Contact Survey
Performance Objective: Customers value personal contact service as positive experience that
meets their service needs.
Type of Performance Metric: Improvement

18
Description: This survey is to measure the satisfaction of LIPA customers that have in person
contact with a Service Provider employee. Measurements include satisfaction with the contact
timeliness, knowledge, and problem solving. Examples of transactions to be surveyed include four
types:
1. walk in offices
2. field personnel such as crews restoring outages and installing services
3. energy efficiency program contacts
4. Major Account Executives contacts with their assigned accounts
Personal Contact Survey specifics: Telephone survey conducted monthly that asks a few (3-5)
questions with a scale, for example, of Very Satisfied, Satisfied, Neither Satisfied nor Unsatisfied,
Unsatisfied, and Very Unsatisfied. Top two boxes (VS, S) are counted as percent customer satisfied.
Methodology for the survey may consider weighting of transactions by difficulty to avoid simple
transactions (such as payment in an office) to overly influence survey outcomes. There may be different
questions between the 4 survey types based on customer services provided.
Points Assigned: 5 points.
Calculation: Calculated as the percent of responses to each of 3-5 short questions indicating that
the respondent is top two box satisfied (out of 5 box option) with the services received. The monthly
metric will be an average of the individual survey types, with appropriate weighting. The annual metric
will be computed based on the cumulative results for the year.
Target Level of Performance: Target performance level will be based on an established and
agreed upon percentage improvement from Baseline performance to be achieved by Contract Year Five.
Baseline: Set at 2013 performance.
Minimum Level of Performance: Set at a straight line from the Baseline to Target Level of
Performance by Contract Year 10.

19
Base Points Multiplier: The table below indicates the Base Points Multipliers associated with
performance leading to achievement of the Target Performance Level by each Contract Year:
Contract Year 1 - 3 4 5 6 7 8 – 10
Base Points Multiplier 150% 125% 100% 50% 25% 0%
2.6 Average Speed of Answer (ASA)
Performance Objective: Residential customers experience reasonable wait to talk with a CSR.
Type of Performance Metric: Improvement
Description: Average Speed of Answer measures the time a caller waits for a CSR. The metric
incorporates the impact of the Interactive Voice Response unit effectiveness in handling customer
inquiries, which will be reflected as no wait time for the caller.
Points Assigned: 7.5 points.
Calculation: The Average Speed of Answer is calculated as the total time on hold of all
answered calls, plus the calls effectively concluded within the IVR, which are included as no wait time,
each month divided by the total number of calls answered each month.
Target Level of Performance: Target set at First Quartile lower boundary level performance, to
be achieved by Contract Year five.
Baseline: Set at 2013 performance.
Minimum Level of Performance: Set at a straight line from the Baseline to Target Level of
Performance by Contract Year 10.
Base Points Multiplier: The table below indicates the Base Points Multipliers associated with
performance leading to achievement of the Target Performance Level by each Contract Year:

20
Contract Year 1 – 3 4 5 6 7 8 – 10
Base Points Multiplier 150% 125% 100% 50% 25% 0%
2.7 Abandonment Rate
Performance Objective: Customers do not hang up while waiting to talk with a CSR.
Type of Performance Metric: Improvement
Description: Abandoned calls are calls that disconnect after the call has been considered an
offered call for CSR (after the call was placed in the CSR queue (other than calls that disconnect within
the first five seconds), but before a CSR has answered the call. The metric will incorporate the impact
of the Interactive Voice Response unit and its ability to handle customer inquiries effectively.
Points Assigned: 7.5 points.
Calculation: Abandonment Rate is calculated as the percent of calls that hang up (abandon) after
they are offered to the CSR queue. This statistic is calculated as the number of abandoned calls per
month divided by the total offered calls per month including those handled by the IVR, expressed as a
percentage.
Target Level of Performance: Target set at First Quartile lower boundary level performance, to
be achieved by Contract Year five.
Baseline: Set at 2013 performance.
Minimum Level of Performance: Set at a straight line from the Baseline to Target Level of
Performance by Contract Year 10.
Base Points Multiplier: The table below indicates the Base Points Multipliers associated with
performance leading to achievement of the Target Performance Level by each Contract Year:

21
Contract Year 1 - 3 4 5 6 7 8 – 10
Base Points Multiplier 150% 125% 100% 50% 25% 0%
2.8 Web Transactions Completed
Performance Objective: Customers who prefer on-line transactions are utilizing for high value
transactions.
Type of Performance Metric: Improvement
Description: Measures the percentage increase in transactions completed on-line and via website
of twelve specified transaction types. On-line transactions included in the metric are:
Category 1 (each weighted at 20%)
1. Bill payment through bank (auto bank and single bank payments)
2. Bill payment through website (auto and single payments)
3. Credit Card payments (auto and single payments)
4. IVR payments
5. Direct Pay (number of payments made through Direct Pay)
Category 2 (weighted as indicated below)
6. Paperless bills e-LERT (enrollment and de-enrollment) – 40%
7. Updated personal information on web – 30%
8. On line self help includes the following transactions – 30%
i. Meter reads entered on web
ii. Balanced Billing Online (enrollment)
iii. Open Account on web/Close Account on web (includes account transfers)
iv. Outages reported on web or texting (excludes catastrophic events, each of which
results in more than 150,000 service Interruptions (as defined in Section 97.1 of the
NYCRR)
v. Energy efficiency audit on web
Points Assigned: 5 points.

22
Calculation: Calculated monthly as a weighted average percent increase in transactions for the
two Categories above, each weighted at 50%. The annual metric will be computed based on the
cumulative results for the year, on a weighted average basis.
Target Level of Performance: Target set at an improvement of 25% performance relative to
2013 performance, to be achieved by Contract Year five.
Baseline: Set at 2013 performance.
Minimum Level of Performance: Set at a straight line from the Baseline to Target Level of
Performance by Contract Year 10.
Base Points Multiplier: The table below indicates the Base Points Multipliers associated with
performance leading to achievement of the Target Performance Level by each Contract Year:
Contract Year 1 - 3 4 5 6 7 8 – 10
Base Points Multiplier 150% 125% 100% 50% 25% 0%
(3) Technical and Regulatory Performance Category. Performance Metrics in this category
are directed at providing safe, reliable power supply in a manner compliant with applicable safety,
environmental and other regulations.
3.1 System Average Interruption Duration Index (SAIDI)
Performance Objective: Maintain First Quartile performance.
Type of Performance Metric: Maintenance
Description: Total duration of interruption for the average customer during each Contract Year,
computed in accordance with IEEE standard 1366 measured for each Contract Year.

23
Points Assigned: 10 points.
Calculation: SAIDI = Σ(ri * Ni ) / NT
Where,
SAIDI = System Average Interruption Duration Index, minutes.
Σ = Summation function.
ri = Restoration time, minutes.
Ni = Total number of customers interrupted.
NT = Total number of customers served.
Excludes only outages due to Major Storms.
Target Level of Performance: Target range set using 2004-2013 results at two standard
deviations above and below the mean value.
Minimum Level of Performance: Minimum performance represents lower boundary level of
First Quartile performance or two standard deviations above the mean value, whichever is greater.
Base Points Multiplier for Above Target Performance Range: 100%
3.2 System Average Interruption Frequency Index (SAIFI)
Performance Objective: Maintain First Quartile performance.
Type of Performance Metric: Maintenance
Description: Frequency of sustained interruption within a Contract Year, computed in
accordance with IEEE standard 1366 measured for each Contract Year.
Points Assigned: 5 points.
Calculation: SAIFI = Σ(Ni ) / NT

24
Where,
SAIFI = System Average Interruption Frequency Index
Σ = Summation function.
Ni = Total number of customers interrupted.
NT = Total number of customers served.
Excludes only outages due to Major Storms.
Target Level of Performance: Target range set using 2004-2013 results at two standard
deviations above and below the mean value.
Minimum Level of Performance: Minimum performance represents lower boundary level of
First Quartile performance or two standard deviations above the mean value, whichever is greater.
Base Points Multiplier for Above Target Performance Range: 100%
3.3 Customer Average Interruption Duration Index (CAIDI)
Performance Objective: Maintain First Quartile performance.
Type of Performance Metric: Maintenance
Description: Average time per customer to restore service, computed in accordance with IEEE
standard 1366 measured for each Contract Year.
Points Assigned: 5 points.
Calculation: CAIDI = Σ(ri * Ni ) / Σ( Ni )
Where,
CAIDI = Customer Average Interruption Duration Index

25
Σ = Summation function.
ri = Restoration time, minutes.
Ni = Total number of customers interrupted.
Excludes only outages due to Major Storms.
Target Level of Performance: Target range set using 2004-2013 results at two standard
deviations above and below the mean value.
Minimum Level of Performance: Minimum performance represents lower boundary level of
First Quartile performance or two standard deviations above the mean value, whichever is greater.
Base Points Multiplier for Above Target Range: 100%
3.4 OSHA Recordable Incidence Rate
Performance Objective: Employees of ServCo work safely as measured by OSHA Recordable
Incidence rate as defined by OSHA.
Type of Performance Metric: Improvement or Maintenance
Description: Total illness and injury rate. The total OSHA recordable injury and illness cases
based on the exposure of 100 full-time workers, using 200,000 hours as the equivalent. This metric
includes hearing loss.
Points Assigned: 5 points.
Calculation: Number of OSHA cases X 200,000 hrs / Total exposure hours (Note: 200,000 =
100 employees x 2,000 hours per employee per year)
Target Level of Performance: Target set at First Quartile lower boundary level performance, to
be achieved by Contract Year five.

26
Baseline: Set at 2013 performance.
Minimum Level of Performance: Set at a straight line from the Baseline to Target Level of
Performance by Contract Year 10.
Base Points Multiplier: The table below indicates the Base Points Multipliers associated with
performance leading to achievement of the Target Performance Level by each Contract Year:
Contract Year 1 - 3 4 5 6 7 8 – 10
Base Points Multiplier 150% 125% 100% 50% 25% 0%
3.5 OSHA Days Away Rate (Severity)
Performance Objective: Employees of ServCo work safely.
Type of Performance Metric: Improvement or Maintenance
Description: The severity of OSHA incidents that have occurred as measured by the number of
lost workdays that can be attributed to an OSHA incident.
Points Assigned: 5 points.
Calculation: Total number of Lost Time Days due to injury x 200,000 hrs / Total exposure hours.
Target Level of Performance: Target set at First Quartile lower boundary level performance, to
be achieved by Contract Year five. Should the baseline results for the last three years be equivalent to
Top Quartile, this metric will then shift to a Maintenance Metric.
Baseline: Set at 2013 performance.
Minimum Level of Performance: Set at a straight line from the Baseline to Target Level of
Performance by Contract Year 10.

27
Base Points Multiplier: The table below indicates the Base Points Multipliers associated with
performance leading to achievement of the Target Performance Level by each Contract Year:
Contract Year 1 - 3 4 5 6 7 8 – 10
Base Points Multiplier 150% 125% 100% 50% 25% 0%
(4) Financial Performance Category. Performance Metrics in this category are directed at
meeting LIPA's financial performance needs.
4.1 Actual Meter Read Rate
Performance Objective: Customers receive an actual bill (not estimated) as often as possible
through regularly scheduled meter reading.
Type of Performance Metric: Improvement
Description: Actual Meter Read Rate measures the timely reading of meters scheduled to be
read, Residential and Business, subject to exclusions for reasons approved by the Parties. This metric
includes both manual and automated (AMR & AMI) meters.
Points Assigned: 5 points.
Calculation: Measured monthly as the number of meters read in each month, divided by the
number of electric meters scheduled for read each month, expressed as a percentage. The annual metric
will be computed based on the cumulative results for the year.
Target Level of Performance: Target set at First Quartile lower boundary level performance, to
be achieved by Contract Year five.
Baseline: Set at 2013 performance.
Minimum Level of Performance: Set at a straight line from the Baseline to Target Level of
Performance by Contract Year 10.

28
Base Points Multiplier: The table below indicates the Base Points Multipliers associated with
performance leading to achievement of the Target Performance Level by each Contract Year:
Contract Year 1 - 3 4 5 6 7 8 – 10
Base Points Multiplier 150% 125% 100% 50% 25% 0%
4.2 Timely Billing
Performance Objective: Customers receive an accurate bill each month.
Type of Performance Metric: Improvement
Description: Timely Billing measures the timely rendering of accurate bills to customers. This
metric measures the percent of “no-bill” billing exceptions completed and accounts billed within the
prescribed three day requirement for completion.
Points Assigned: 5 points.
Calculation: Calculated as the number of no-bill billing exceptions (identified by specific types
of billing exceptions) completed and account accurately billed (defined as the customer bill is issued and
no subsequent cancel/re-bill is performed) within the required number of days (three days) divided by
the total number of no bill billing exceptions generated by month, expressed as a percentage. Any
change in the parameters set for billing exceptions must be approved by the Parties. The annual metric
will be computed based on the cumulative results for the year.
Target Level of Performance: Target established as a percentage improvement from the Baseline
performance, to be achieved by Contract Year five.
Baseline: Set at 2013 performance.

29
Minimum Level of Performance: Set at a straight line from the Baseline to Target Level of
Performance by Contract Year 10.
Base Points Multiplier: The table below indicates the Base Points Multipliers associated with
performance leading to achievement of the Target Performance Level by each Contract Year:
Contract Year 1 - 3 4 5 6 7 8 – 10
Base Points Multiplier 150% 125% 100% 50% 25% 0%
4.3 Days Sales Outstanding
Performance Objective: LIPA revenues are collected efficiently and effectively, while
demonstrating concern for both positive customer experience and applicable rules/regulations.
Type of Performance Metric: Improvement
Description: Days Sales Outstanding (DSO) measures the days of revenues billed but not yet
collected. This metric is a measure of the average number of days that it takes the Service Provider to
collect revenue after the account has been billed. A low DSO number means that it takes fewer days to
collect accounts receivable and a high DSO number shows it is taking longer to collect.
Points Assigned: 5 points.
Calculation: Measured as the 12-month average Accounts Receivable (A/R) value divided by
the average daily 12-month revolving sales (e.g. (12 month average A/R)/(12-month revolving sales /
365). Exclusions to be agreed upon by the Parties.4
Target Level of Performance: Target set at First Quartile lower boundary level performance, to
be achieved by Contract Year five.
4 Previously, portions of the LIRR A/R were in dispute and excluded from this calculation. The dispute has been settled and the previously disputed A/R will not be included in the 2014 calculations. Moving forward any new LIRR A/R will be included in the calculation.

30
Baseline: Set at 2013 performance.
Minimum Level of Performance: Set at a straight line from the Baseline to Target Level of
Performance by Contract Year 10.
Base Points Multiplier: The table below indicates the Base Points Multipliers associated with
performance leading to achievement of the Target Performance Level by each Contract Year:
Contract Year 1 - 3 4 5 6 7 8 – 10
Base Points Multiplier 150% 125% 100% 50% 25% 0%
4.4 Net Write-Offs per $100 Billed Revenue
Performance Objective: LIPA debt is collected efficiently and effectively, while demonstrating
concern for both positive customer experience and applicable rules/regulations.
Type of Performance Metric: Improvement or Maintenance
Description: Net Write-Offs per $100 Billed Revenue measures the effectiveness of recovery
efforts of uncollectible revenue. The metric is an overall measure of the possibility of the business
incurring bad debts and represents a comparison between total sales and those for which payment is not
recoverable and therefore written off as losses.
Points Assigned: 5 points.
Calculation: Calculated monthly and measured as the net write-off divided by the electric billed
revenues (in multiples of $100) for a rolling 12 months. Exclusions to be agreed upon by the Parties.
Target Level of Performance: Target set at First Quartile lower boundary level performance, to
be achieved by Contract Year five.
Baseline: Set at 2013 performance.

31
Minimum Level of Performance: Set at a straight line from the Baseline to Target Level of
Performance by Contract Year 10.
Base Points Multiplier: The table below indicates the Base Points Multipliers associated with
performance leading to achievement of the Target Performance Level by each Contract Year:
Contract Year 1 - 3 4 5 6 7 8 – 10
Base Points Multiplier 150% 125% 100% 50% 25% 0%
4.5 Electric Damages per 1,000 Locates
Performance Objective: Potential damage to the electric system is prevented through markouts.
Type of Performance Metric: Improvement or Maintenance
Description: Number of Third Party damages to electric facilities per 1,000 markout requests.
Points Assigned: 5 points.
Calculation: Total number of Third Party Electric Damages x 1000 / Electric Locate Requests
Target Level of Performance: Target set at First Quartile lower boundary level performance, to
be achieved by Contract Year five.
Minimum Level of Performance: Set at a straight line from the Baseline to Target Level of
Performance by Contract Year 10.
Base Points Multiplier for Above Target Performance Range:
The table below indicates the Base Points Multipliers associated with performance leading to
achievement of the Target Performance Level by each Contract Year:

32
Contract Year 1 - 3 4 5 6 7 8 – 10
Base Points Multiplier 150% 125% 100% 50% 25% 0%
4.6 ELI Achieved Load Reduction
Performance Objective: Achieve targeted system coincident peak load reduction and
improvement in LIPA system load factor.
Type of Performance Metric: Maintenance
Requirement to earn Base Points: In order to earn the Base Points for this Performance Metric,
the Service Provider must perform the services within the LIPA approved Budget for these services, as
amended from time to time if applicable.
Description: Efficiency Long Island coincident peak reduction in comparison to the annual goal
for each Contract Year.
Points Assigned: 5 points.
Calculation: Summer MW peak load reduction, net of free riders, at the generator. The savings
from Information/Education programs are excluded from the cumulative total for the following year to
calculate the cumulative values.
Target Level of Performance: Target level of performance will be developed and approved by
the Parties each Contract Year.
Minimum Level of Performance: Minimum performance set at 20% below the Target that is set
in each Contract Year.

33
Base Points Multiplier for Above Target Performance Range: 125% of points set at 10% above
the Above Target Performance Threshold, 150% of points set at 20% above the Above Target
Performance Threshold.
Base Points Multiplier for Below Target Performance Range: 50% of points set at 10% below
Target Performance Level.

Attachment 1 to Appendix 9 1
Attachment 1
Initial Tier 1 Performance Metric Examples5 Attachment 1 to Appendix 9 provides an example for each Performance Metric in the Initial Tier 1 Performance Metrics in the Customer Satisfaction, Technical and Regulatory Performance, and Financial Performance Categories. Included for each Performance Metric:
1. Example Target and Minimum Performance Level and corresponding Base Point Multipliers for Improvement Metrics and Example Target Range and Minimum Performance Level and corresponding Base Point Multipliers for Maintenance Metrics
2. Illustrative Performance Metric graph utilizing the example calculation 3. Example calculation and data utilized; historical performance data if available, and if unavailable, example
data.
5 The data and graphs in this Attachment 1 are examples that are meant to serve as illustrations only.

Attachment 1 to Appendix 9 2
Metrics 2.1 & 2.2: JD Power Customer Satisfaction Survey (Residential) and (Business) Example Target and Minimum Performance Levels and Corresponding Base Point Multipliers
2.1 and 2.2 JD Power Customer Satisfaction Survey
Year Target
Performance Level
Minimum Performance
Level 150% 125% 100% 50% 25%
Baseline Performance Level 519.0 519.0 519.0 519.0 519.0
2014 634.0 530.5 557.3 547.8 542.0 538.2 535.4
2015 634.0 542.0 595.7 576.5 565.0 557.3 551.9
2016 634.0 553.5 634.0 605.3 588.0 576.5 568.3
2017 634.0 565.0 634.0 611.0 595.7 584.7
2018 634.0 576.5 634.0 614.8 601.1
2019 634.0 588.0 634.0 617.6
2020 634.0 599.5 634.0
2021 634.0 611.0
2022 634.0 622.5
2023 634.0 634.0
Baseline Performance Level 519
Target Performance Level 634 Notes: The data and graph are examples based on actual 2013 baseline performance for Metric 2.1 and are meant to serve as illustrations only.

Attachment 1 to Appendix 9 3
Metric 2.1 & 2.2: JD Power Customer Satisfaction Index (Residential) and (Business) Illustrative Performance Metric Graph Utilizing the Example Calculation
Notes: This illustration is based on actual 2013 baseline performance for Metric 2.1 and are meant to serve as illustrations only.

Attachment 1 to Appendix 9 4
Metric 2.1 & 2.2: JD Power Customer Satisfaction Index (Residential) and (Business) Example Calculation and Data
JD Power Overall Customer Satisfaction Index 2013 1st Quartile
Performance
2.1 Electric Residential Survey 519 634
2.2 Electric Business Survey 540 639

Attachment 1 to Appendix 9 5
Metric 2.3 & 2.4: After Call Survey – Residential and Business Example Target and Minimum Performance Levels and Corresponding Base Point Multipliers 2.3 and 2.4 After Call Survey (example)
Year Target
Performance Level
Minimum Performance
Level 150% 125% 100% 50% 25%
Baseline Performance Level 80% 80% 80% 80% 80%
2014 84% 80% 81% 81% 81% 81% 81%
2015 84% 81% 83% 82% 82% 81% 81%
2016 84% 81% 84% 83% 82% 82% 82%
2017 84% 82% 84% 83% 83% 82%
2018 84% 82% 84% 83% 83%
2019 84% 82% 84% 83%
2020 84% 83% 84%
2021 84% 83%
2022 84% 84%
2023 84% 84%
Baseline Performance Level 80%
Target Performance Level 84%
Target % Improvement by Contract Year 5 5% Notes: All data included is for example and illustration only. Assumption that Baseline Performance Level and Target Performance Level equal the percentages specified below.

Attachment 1 to Appendix 9 6
Metric 2.3 & 2.4: After Call Survey – Residential and Business Illustrative Performance Metric Graph Utilizing the Example Calculation
Notes: All data included is for example and illustration only.
Illustration

7 Attachment 1 to Appendix 9
Metric 2.3 & 2.4: After Call Survey – Residential and Business Example Calculation and Data
Notes: All data included is for example and illustration only. The structure of the Residential and Business table are identical. The "# of Responses to Question" each month should equal the sum of Very Satisfied, Satisfied, Neither Satisfied nor Unsatisfied, Unsatisfied, and Very Unsatisfied for that month. Blue titles indicate where data is input. Orange titles indicate where a calculation occurs.
Question
Month
# of Responses to Question
Very Satisfied
(VS) Satisfied (S)
Neither Satisfied nor Unsatisfied Unsatisfied
Very Unsatisfied
Total Satisfied (VS + S) % Satisfied
# of Responses to Question
Very Satisfied
(VS) Satisfied (S)
Neither Satisfied nor Unsatisfied Unsatisfied
Very Unsatisfied
Total Satisfied (VS + S) % Satisfied
# of Responses to Question
Very Satisfied
(VS) Satisfied (S)
Neither Satisfied nor Unsatisfied Unsatisfied
Very Unsatisfied
Total Satisfied (VS + S) % Satisfied
January 20 1 14 2 2 1 15 75% 20 1 14 2 2 1 15 75% 20 2 15 1 1 1 17 85%February 20 1 14 2 2 1 15 75% 20 1 14 2 2 1 15 75% 20 2 15 1 1 1 17 85%March 20 1 14 2 2 1 15 75% 20 1 14 2 2 1 15 75% 20 2 15 1 1 1 17 85%April 20 1 14 2 2 1 15 75% 20 1 14 2 2 1 15 75% 20 2 15 1 1 1 17 85%May 20 1 14 2 2 1 15 75% 20 1 14 2 2 1 15 75% 20 2 15 1 1 1 17 85%June 20 1 14 2 2 1 15 75% 20 1 14 2 2 1 15 75% 20 2 15 1 1 1 17 85%July 20 1 14 2 2 1 15 75% 20 1 14 2 2 1 15 75% 20 2 15 1 1 1 17 85%August 20 1 14 2 2 1 15 75% 20 1 14 2 2 1 15 75% 20 2 15 1 1 1 17 85%September 20 1 14 2 2 1 15 75% 20 1 14 2 2 1 15 75% 20 2 15 1 1 1 17 85%October 20 1 14 2 2 1 15 75% 20 1 14 2 2 1 15 75% 20 2 15 1 1 1 17 85%November 20 1 14 2 2 1 15 75% 20 1 14 2 2 1 15 75% 20 2 15 1 1 1 17 85%December 20 1 14 2 2 1 15 75% 20 1 14 2 2 1 15 75% 20 2 15 1 1 1 17 85%Total for Question 240 12 168 24 24 12 180 75% 240 12 168 24 24 12 180 75% 240 24 180 12 12 12 204 85%Question
Month
# of Responses to Question
Very Satisfied
(VS) Satisfied (S)
Neither Satisfied nor Unsatisfied Unsatisfied
Very Unsatisfied
Total Satisfied (VS + S) % Satisfied
# of Responses to Question
Very Satisfied
(VS) Satisfied (S)
Neither Satisfied nor Unsatisfied Unsatisfied
Very Unsatisfied
Total Satisfied (VS + S) % Satisfied
Total # of Responses -
Month
Total Satisfied -
Month
Metric Result -
MONTH
Total # of Responses -
YTD
Total Satisfied -
YTD
Metric Result -
YTD
January 20 2 15 1 1 1 17 85% 20 2 14 2 1 1 16 80% 100 80 80% 100 80 80%February 20 2 15 1 1 1 17 85% 20 2 14 2 1 1 16 80% 100 80 80% 200 160 80%March 20 2 15 1 1 1 17 85% 20 2 14 2 1 1 16 80% 100 80 80% 300 240 80%April 20 2 15 1 1 1 17 85% 20 2 14 2 1 1 16 80% 100 80 80% 400 320 80%May 20 2 15 1 1 1 17 85% 20 2 14 2 1 1 16 80% 100 80 80% 500 400 80%June 20 2 15 1 1 1 17 85% 20 2 14 2 1 1 16 80% 100 80 80% 600 480 80%July 20 2 15 1 1 1 17 85% 20 2 14 2 1 1 16 80% 100 80 80% 700 560 80%August 20 2 15 1 1 1 17 85% 20 2 14 2 1 1 16 80% 100 80 80% 800 640 80%September 20 2 15 1 1 1 17 85% 20 2 14 2 1 1 16 80% 100 80 80% 900 720 80%October 20 2 15 1 1 1 17 85% 20 2 14 2 1 1 16 80% 100 80 80% 1000 800 80%November 20 2 15 1 1 1 17 85% 20 2 14 2 1 1 16 80% 100 80 80% 1100 880 80%December 20 2 15 1 1 1 17 85% 20 2 14 2 1 1 16 80% 100 80 80% 1200 960 80%Total for Question 240 24 180 12 12 12 204 85% 240 24 168 24 12 12 192 80% 1200 960 80%
OVERALL
Question 1 Question 2
Question 4 Question 5
Question 3

8 Attachment 1 to Appendix 9
Metric 2.5: Personal Contact Survey Example Target and Minimum Performance Levels and Corresponding Base Point Multipliers
2.5 Personal Contact Survey (example)
Year Target
Performance Level
Minimum Performance
Level 150% 125% 100% 50% 25%
Baseline Performance Level 65.0% 65.0% 65.0% 65.0% 65.0%
2014 68% 65% 66.1% 65.8% 65.7% 65.5% 65.5%
2015 68% 66% 67.2% 66.6% 66.3% 66.1% 65.9%
2016 68% 66% 68.3% 67.4% 67.0% 66.6% 66.4%
2017 68% 66% 68.3% 67.6% 67.2% 66.9%
2018 68% 67% 68.3% 67.7% 67.3%
2019 68% 67% 68.3% 67.8%
2020 68% 67% 68.3%
2021 68% 68%
2022 68% 68%
2023 68% 68%
Baseline Performance Level 65.0%
Target Performance Level 68.3%
Target % Improvement by Contract Year 5 5.0% Notes: All data included is for example and illustration only. Assumption that Baseline Performance Level and Target Performance Level equal the percentages specified below.

9 Attachment 1 to Appendix 9
Metric 2.5: Personal Contact Survey Illustrative Performance Metric Graph Utilizing the Example Calculation
Notes: All data included is for example and illustration only.
Illustration

10 Attachment 1 to Appendix 9
Metric 2.5: Personal Contact Survey Example Calculation and Data For each of the four transaction types, the following calculations will be used to determine the result for that individual type. Example: Walk-in Offices
Question
Month
# of Responses to Question
Very Satisfied
(VS) Satisfied (S)
Neither Satisfied nor Unsatisfied Unsatisfied
Very Unsatisfied
Total Satisfied (VS + S) % Satisfied
# of Responses to Question
Very Satisfied
(VS) Satisfied (S)
Neither Satisfied nor Unsatisfied Unsatisfied
Very Unsatisfied
Total Satisfied (VS + S) % Satisfied
# of Responses to Question
Very Satisfied
(VS) Satisfied (S)
Neither Satisfied nor Unsatisfied Unsatisfied
Very Unsatisfied
Total Satisfied (VS + S) % Satisfied
January 40 8 18 6 7 1 26 65% 40 7 18 7 7 1 25 63% 40 7 17 8 7 1 24 60%February 40 8 18 6 7 1 26 65% 40 7 18 7 7 1 25 63% 40 7 17 8 7 1 24 60%March 40 8 18 6 7 1 26 65% 40 7 18 7 7 1 25 63% 40 7 17 8 7 1 24 60%April 40 8 18 6 7 1 26 65% 40 7 18 7 7 1 25 63% 40 7 17 8 7 1 24 60%May 40 8 18 6 7 1 26 65% 40 7 18 7 7 1 25 63% 40 7 17 8 7 1 24 60%June 40 8 18 6 7 1 26 65% 40 7 18 7 7 1 25 63% 40 7 17 8 7 1 24 60%July 40 8 18 6 7 1 26 65% 40 7 18 7 7 1 25 63% 40 7 17 8 7 1 24 60%August 40 8 18 6 7 1 26 65% 40 7 18 7 7 1 25 63% 40 7 17 8 7 1 24 60%September 40 8 18 6 7 1 26 65% 40 7 18 7 7 1 25 63% 40 7 17 8 7 1 24 60%October 40 8 18 6 7 1 26 65% 40 7 18 7 7 1 25 63% 40 7 17 8 7 1 24 60%November 40 8 18 6 7 1 26 65% 40 7 18 7 7 1 25 63% 40 7 17 8 7 1 24 60%December 40 8 18 6 7 1 26 65% 40 7 18 7 7 1 25 63% 40 7 17 8 7 1 24 60%Total for Question 480 96 216 72 84 12 312 65% 480 84 216 84 84 12 300 63% 480 84 204 96 84 12 288 60%Question
Month
# of Responses to Question
Very Satisfied
(VS) Satisfied (S)
Neither Satisfied nor Unsatisfied Unsatisfied
Very Unsatisfied
Total Satisfied (VS + S) % Satisfied
# of Responses to Question
Very Satisfied
(VS) Satisfied (S)
Neither Satisfied nor Unsatisfied Unsatisfied
Very Unsatisfied
Total Satisfied (VS + S) % Satisfied
Total # of Responses -
Month
Total Satisfied -
Month
Metric Result -
MONTH
Total # of Responses -
YTD
Total Satisfied -
YTD
Metric Result -
YTD
January 40 9 18 6 6 1 27 68% 40 10 18 6 5 1 28 70% 200 130 65% 200 130 65%February 40 9 18 6 6 1 27 68% 40 10 18 6 5 1 28 70% 200 130 65% 400 260 65%March 40 9 18 6 6 1 27 68% 40 10 18 6 5 1 28 70% 200 130 65% 600 390 65%April 40 9 18 6 6 1 27 68% 40 10 18 6 5 1 28 70% 200 130 65% 800 520 65%May 40 9 18 6 6 1 27 68% 40 10 18 6 5 1 28 70% 200 130 65% 1000 650 65%June 40 9 18 6 6 1 27 68% 40 10 18 6 5 1 28 70% 200 130 65% 1200 780 65%July 40 9 18 6 6 1 27 68% 40 10 18 6 5 1 28 70% 200 130 65% 1400 910 65%August 40 9 18 6 6 1 27 68% 40 10 18 6 5 1 28 70% 200 130 65% 1600 1040 65%September 40 9 18 6 6 1 27 68% 40 10 18 6 5 1 28 70% 200 130 65% 1800 1170 65%October 40 9 18 6 6 1 27 68% 40 10 18 6 5 1 28 70% 200 130 65% 2000 1300 65%November 40 9 18 6 6 1 27 68% 40 10 18 6 5 1 28 70% 200 130 65% 2200 1430 65%December 40 9 18 6 6 1 27 68% 40 10 18 6 5 1 28 70% 200 130 65% 2400 1560 65%Total for Question 480 108 216 72 72 12 324 68% 480 120 216 72 60 12 336 70% 2400 1560 65%
WALK-IN OFFICES
Question 1 Question 2 Question 3
Question 4 Question 5 OVERALL

11 Attachment 1 to Appendix 9
Metric 2.5: Personal Contact Survey Example Calculation and Data (Continued) The Overall Result is a combination of the four transaction type results, each weighted equally at 25%. The same method is used to determine both month and YTD results.
YTD CALCULATION
WALK IN OFFICES
(25% Weighting) FIELD PERSONNEL
(25% Weighting)ENERGY EFFICIENCY
(25% Weighting
MAJOR ACCOUNT EXECUTIVES (25%
Weighting) OVERALL
YTD Result
Contribution to Overall
Score
YTD Result
Contribution to Overall
Score
YTD Result
Contribution to Overall
Score
YTD Result
Contribution to Overall
Score
YTD Result
January 65.0% 16.3% 70.0% 17.5% 60.0% 15.0% 65.0% 16.3% 65.0%
February 65.0% 16.3% 70.0% 17.5% 60.0% 15.0% 65.0% 16.3% 65.0%
March 65.0% 16.3% 70.0% 17.5% 60.0% 15.0% 65.0% 16.3% 65.0%
April 65.0% 16.3% 70.0% 17.5% 60.0% 15.0% 65.0% 16.3% 65.0%
May 65.0% 16.3% 70.0% 17.5% 60.0% 15.0% 65.0% 16.3% 65.0%
June 65.0% 16.3% 70.0% 17.5% 60.0% 15.0% 65.0% 16.3% 65.0%
July 65.0% 16.3% 70.0% 17.5% 60.0% 15.0% 65.0% 16.3% 65.0%
August 65.0% 16.3% 70.0% 17.5% 60.0% 15.0% 65.0% 16.3% 65.0%
September 65.0% 16.3% 70.0% 17.5% 60.0% 15.0% 65.0% 16.3% 65.0%
October 65.0% 16.3% 70.0% 17.5% 60.0% 15.0% 65.0% 16.3% 65.0%
November 65.0% 16.3% 70.0% 17.5% 60.0% 15.0% 65.0% 16.3% 65.0%
December 65.0% 16.3% 70.0% 17.5% 60.0% 15.0% 65.0% 16.3% 65.0% Notes: All data included is for example and illustration only. The "# of Responses to Question" each month should equal the sum of Very Satisfied, Satisfied, Neither Satisfied nor Unsatisfied, Unsatisfied, and Very Unsatisfied for that month.

12 Attachment 1 to Appendix 9
Blue titles indicate where data is input. Orange titles indicate where a calculation occurs.

13 Attachment 1 to Appendix 9
Metric 2.6: Average Speed of Answer (ASA) Example Target and Minimum Performance Levels and Corresponding Base Point Multipliers
2.6 Average Speed of Answer
Year Target
Performance Level
Minimum Performance
Level 150% 125% 100% 50% 25%
Baseline Performance Level 63 63 63 63 63
2014 26 60 51 54 56 57 582015 26 56 38 45 48 51 532016 26 52 26 35 41 45 472017 26 48 26 33 38 422018 26 45 26 32 372019 26 41 26 312020 26 37 262021 26 33 2022 26 30 2023 26 26
Baseline Performance Level 63 Target Performance Level 26
Note: This is an example based on 2012 historical performance and is meant to serve as an illustration only.

14 Attachment 1 to Appendix 9
Metric 2.6: Average Speed of Answer (ASA) Illustrative Performance Metric Graph Utilizing the Example Calculation
Notes: This is an example based on 2012 historical performance and is meant to serve as an illustration only.

15 Attachment 1 to Appendix 9
Metric 2.6: Average Speed of Answer (ASA) Example Calculation and Data
Notes:
This is an example based on 2012 historical performance and is meant to serve as an illustration only.
Month YTD Month YTD Month YTD Month YTD Month YTD Month YTDJan 84,513 84,513 1,554 1,554 121,207 121,207 207,274 207,274 15,878,117 15,878,117 76.6 76.6Feb 76,336 160,849 0 1,554 112,249 233,456 188,585 395,859 10,214,659 26,092,776 54.2 65.9Mar 78,165 239,014 0 1,554 113,532 346,988 191,697 587,556 9,763,752 35,856,528 50.9 61.0Apr 76,509 315,523 1,365 2,919 109,708 456,696 187,582 775,138 10,093,136 45,949,664 53.8 59.3May 79,667 395,190 0 2,919 118,438 575,134 198,105 973,243 10,304,106 56,253,770 52.0 57.8Jun 106,264 501,454 15,612 18,531 131,793 706,927 253,669 1,226,912 11,465,991 67,719,761 45.2 55.2Jul 108,676 610,130 9,933 28,464 136,053 842,980 254,662 1,481,574 13,741,353 81,461,114 54.0 55.0Aug 94,060 704,190 2,125 30,589 139,972 982,952 236,157 1,717,731 14,417,116 95,878,230 61.0 55.8Sep 92,303 796,493 5,039 35,628 128,819 1,111,771 226,161 1,943,892 20,482,221 116,360,451 90.6 59.9Oct 173,346 969,839 327,192 362,820 252,858 1,364,629 753,396 2,697,288 23,010,078 139,370,529 30.5 51.7Nov 281,745 1,251,584 616,606 979,426 413,606 1,778,235 1,311,957 4,009,245 98,851,834 238,222,363 75.3 59.4Dec 106,327 1,357,911 7,013 986,439 162,452 1,940,687 275,792 4,285,037 32,977,756 271,200,119 119.6 63.3
ASA (with IVR)Total Seconds to
AnswerIVR Calls
21st Century Calls (outsourced IVR)
Rep Calls HandledTotal Calls Handled (IVR + 21st Century
+ Rep Handled)

16 Attachment 1 to Appendix 9
Metric 2.7: Abandonment Rate Example Target and Minimum Performance Levels and Corresponding Base Point Multipliers
2.7 Abandonment Rate
Year Target
Performance Level
Minimum Performance
Level 150% 125% 100% 50% 25%
Baseline Performance Level 3.6% 3.6% 3.6% 3.6% 3.6%
2014 2.2% 3.5% 3.2% 3.3% 3.3% 3.4% 3.4%2015 2.2% 3.3% 2.7% 2.9% 3.1% 3.2% 3.2%2016 2.2% 3.2% 2.2% 2.6% 2.8% 2.9% 3.0%2017 2.2% 3.1% 2.2% 2.5% 2.7% 2.8%2018 2.2% 2.9% 2.2% 2.4% 2.6%2019 2.2% 2.8% 2.2% 2.4%2020 2.2% 2.6% 2.2%2021 2.2% 2.5% 2022 2.2% 2.3% 2023 2.2% 2.2%
Baseline Performance Level 3.6% Target Performance Level 2.2%
Notes: This is an example based on 2012 historical performance and is meant to serve as an illustration only.

17 Attachment 1 to Appendix 9
Metric 2.7: Abandonment Rate Illustrative Performance Metric Graph Utilizing the Example Calculation
Notes: This is an example based on 2012 historical performance and is meant to serve as an illustration only.

18 Attachment 1 to Appendix 9
Metric 2.7: Abandonment Rate Example Calculation and Data
Notes: Source - LIPA Call Center Statistics Report This is an example based on 2012 historical performance and is meant to serve as an illustration only. The Annual result is calculated using the total of all offered and handled calls throughout the year.
Month YTD Month YTD Month YTD Month YTD Month YTD Month YTD Month YTDJan 84,513 84,513 1,554 1,554 128,472 128,472 214,539 214,539 121,207 121,207 207,274 207,274 3.4% 3.4%Feb 76,336 160,849 0 1,554 117,134 245,606 193,470 408,009 112,249 233,456 188,585 395,859 2.5% 3.0%Mar 78,165 239,014 0 1,554 118,182 363,788 196,347 604,356 113,532 346,988 191,697 587,556 2.4% 2.8%Apr 76,509 315,523 1,365 2,919 114,574 478,362 192,448 796,804 109,708 456,696 187,582 775,138 2.5% 2.7%May 79,667 395,190 0 2,919 123,746 602,108 203,413 1,000,217 118,438 575,134 198,105 973,243 2.6% 2.7%Jun 106,264 501,454 15,612 18,531 139,194 741,302 261,070 1,261,287 131,793 706,927 253,669 1,226,912 2.8% 2.7%Jul 108,676 610,130 9,933 28,464 143,682 884,984 262,291 1,523,578 136,053 842,980 254,662 1,481,574 2.9% 2.8%Aug 94,060 704,190 2,125 30,589 147,020 1,032,004 243,205 1,766,783 139,972 982,952 236,157 1,717,731 2.9% 2.8%Sep 92,303 796,493 5,039 35,628 138,765 1,170,769 236,107 2,002,890 128,819 1,111,771 226,161 1,943,892 4.2% 2.9%Oct 173,346 969,839 327,192 362,820 270,575 1,441,344 771,113 2,774,003 252,858 1,364,629 753,396 2,697,288 2.3% 2.8%Nov 281,745 1,251,584 616,606 979,426 482,771 1,924,115 1,381,122 4,155,125 413,606 1,778,235 1,311,957 4,009,245 5.0% 3.5%Dec 106,327 1,357,911 7,013 986,439 178,128 2,102,243 291,468 4,446,593 162,452 1,940,687 275,792 4,285,037 5.4% 3.6%
Rep Calls HandledTotal Calls Handled
(IVR + 21st Century + Rep Handled)
Abandonment Rate (with IVR)
IVR Calls21st Century Calls (outsourced IVR)
Rep Calls OfferedTotal Calls Offered
(IVR + 21st Century + Rep Offered)

19 Attachment 1 to Appendix 9
Metric 2.8: Web Transactions Completed Example Target and Minimum Performance Levels and Corresponding Base Point Multipliers
Notes: The data provided in the graphs is solely intended to serve as an example. This is historical data as available. Assumption that Baseline Performance Level is percentage specified below. Target Performance Level set at percent improvement in number of transactions as specified below.
2.8 Web Transactions Completed (example)
Year
Target Performance
Level
Minimum Performance
Level 150% 125% 100% 50% 25%Baseline Performance Level 0.0% 0.0% 0.0% 0.0% 0.0%
2014 25.0% 2.5% 8.3% 6.3% 5.0% 4.2% 3.6%2015 25.0% 5.0% 16.7% 12.5% 10.0% 8.3% 7.1%2016 25.0% 7.5% 25.0% 18.8% 15.0% 12.5% 10.7%2017 25.0% 10.0% 25.0% 20.0% 16.7% 14.3%2018 25.0% 12.5% 25.0% 20.8% 17.9%2019 25.0% 15.0% 25.0% 21.4%2020 25.0% 17.5% 25.0%2021 25.0% 20.0%2022 25.0% 22.5%2023 25.0% 25.0%
Baseline Performance Level 0%Targeted yearly improvement 5.0%Target Performance Level 25.0% improvement in transactions completed on Web.

20 Attachment 1 to Appendix 9
Metric 2.8: Web Transactions Completed Illustrative Performance Metric Graph Utilizing the Example Calculation
Notes: This is an example based on historical performance as available and is meant to serve as an illustration only.

21 Attachment 1 to Appendix 9
Metric 2.8: Web Transactions Completed Example Calculation and Data
Notes: All data shown is for example and illustration only.
Example of Web Transactions Data by MonthItem Description Weighting Jan Feb Mar Apr May Jun Jul Aug Sep Oct Nov Dec Total
1 Bill Payment through bank (auto bank and single bank payments) 20% 204,827 209,940 222,838 210,390 224,949 204,963 218,789 225,611 200,904 224,779 179,824 226,619 2,554,4332 Bill Payment through LIPA website (auto and single payments) 20% 90,417 90,816 97,440 89,849 92,677 93,249 94,283 96,687 95,874 95,316 83,585 93,066 1,113,2593 Credit Card Payments 20% 0 0 0 0 0 0 0 0 0 0 0 1 14 IVR Payments 20% 28,536 27,497 27,678 28,190 27,586 27,247 29,705 26,598 26,672 29,928 23,597 25,367 328,6015 Direct Pay - Number of Payments Made 20% 27,125 27,245 29,232 26,955 27,803 27,975 28,285 29,006 28,762 28,595 25,076 27,920 333,9786 Paperless bills e-LERT (enrollment and de-enrollment) 40% 1,710 1,322 1,638 1,352 1,229 1,663 1,823 2,080 1,656 1,882 1,643 1,523 19,5217 Updated personal information on web 30% 1,155 1,077 1,013 1,013 978 944 1,083 1,139 1,101 2,875 2,778 1,110 16,2668 Online self help - includes the following transactions 30%8.i Meter reads entered on web 1,219 1,120 1,198 1,112 1,101 1,094 1,288 1,258 1,271 1,116 1,399 1,697 14,8738.ii Balanced Billing Online (enrollment) 505 446 402 350 398 440 474 799 646 740 436 299 5,9358.iii Open/Close Account on web 527 497 519 586 653 729 723 734 611 624 1,711 606 8,5208.iv Outages reported on web or texting 142 83 31 114 139 981 1164 452 676 0 0 1918 57008.v Energy efficiency audit on web 772 922 717 631 593 682 552 4 448 1,462 1,335 699 8,817
Cat
egor
y 1
Cat
egor
y 2
Example of YE Calculation:
Item Description Weighting
1 Bill Payment through bank (auto bank and single bank payments) 20%2 Bill Payment through LIPA website (auto and single payments) 20%3 Credit Card Payments 20%4 IVR Payments 20%5 Direct Pay - Number of Payments Made 20%
100%6 Paperless bills e-LERT (enrollment and de-enrollment) 40%7 Updated personal information on web 30%8 Online self help - includes the following transactions 30%8.i Meter reads entered on web 6%8.ii Balanced Billing Online (enrollment) 6%8.iii Open/Close Account on web 6%8.iv Outages reported on web or texting 6%8.v Energy efficiency audit on web 6%
100%Overall Result (Category Results Weighted at 50% each) 12.21%
0.05%0.57%0.34%0.32%0.06%
12.07%
1.14%1.56%8.00%0.69%0.96%
12.35%11.23%-0.49%1.33%
1%10%6%5%1%8900
6%8%
40%3%5%
28%-2%16000
150006500900060005,700
8,817
2,700,0001200000
350340000350000
2500019,52116,266
14,8735,9358,520
2,554,4331,113,259
250328,601333,978
Cat
egor
y 1
Cat
egor
y 2
Category 1 Subtotal
Category 2 Subtotal
Baseline Year Total Transactions
Contract Year X Total Transactions
% Difference from Baseline
Weighted Contribution

22 Attachment 1 to Appendix 9
Outages reported via web/text will be normalized through the exclusion of catastrophic events, each of which results in more than 150,000 service Interruptions (as defined in Section 97.1 of the NYCRR).

23 Attachment 1 to Appendix 9
Metric 3.1: System Average Interruption Duration Index (SAIDI) Example Target Range and Minimum Performance Level and Corresponding Base Point Multipliers
All data included is for example and illustration only.
Normal DistributionMean 59
Standard Deviation 6
Target Range
# of Standard Deviation from Mean (+/-) 2.0
Lower End 47
Higher End 71
Probability in Range (normal distribution) 95.4%
Minimum Performance Level 90
Points Earned Threshold 71Above Target Performance Threshold 47

24 Attachment 1 to Appendix 9
Metric 3.1: System Average Interruption Duration Index (SAIDI) Illustrative Performance Metric Graph Utilizing the Example Calculation

25 Attachment 1 to Appendix 9
Metric 3.1: System Average Interruption Duration Index (SAIDI) Example Calculation and Data
Notes: This is an example based on 2010 historical performance as available and is meant to serve as an illustration only.
MonthCustomers
ServedCustomers Interrupted
Customer Minutes
InterruptedMonth SAIDI
Customers Interrupted
Customer Minutes
InterruptedYTD SAIDI
January 1,117,281 55,912 3,214,401 2.9 55,912 3,214,401 2.9February 1,117,281 63,802 3,664,609 3.3 119,714 6,879,010 6.2March 1,117,281 47,124 2,002,221 1.8 166,838 8,881,231 7.9April 1,117,281 67,810 3,872,730 3.5 234,648 12,753,961 11.4May 1,117,281 84,063 5,252,661 4.7 318,711 18,006,622 16.1June 1,117,281 52,891 3,759,390 3.4 371,602 21,766,012 19.5July 1,117,281 63,625 5,565,169 5.0 435,227 27,331,181 24.5August 1,117,281 75,146 6,439,607 5.8 510,373 33,770,788 30.2September 1,117,281 77,268 5,384,869 4.8 587,641 39,155,657 35.0October 1,117,281 96,477 7,657,777 6.9 684,118 46,813,434 41.9November 1,117,281 55,321 3,595,021 3.2 739,439 50,408,455 45.1December 1,117,281 72,530 3,893,616 3.5 811,969 54,302,071 48.6
MONTH YTD

26 Attachment 1 to Appendix 9
Metric 3.2: System Average Interruption Frequency Index (SAIFI) Example Target Range and Minimum Performance Level and Corresponding Base Point Multipliers
Normal DistributionMean 0.77
Standard Deviation 0.08
Target Range
# of Standard Deviation from Mean (+/-) 2.0
Lower End 0.62
Higher End 0.92
Probability in Range (normal distribution) 95.4%
First Quartile Lower Boundary 0.90Minimum Performance Level / Points Earned Threshold 0.92Above Target Performance Threshold 0.62

27 Attachment 1 to Appendix 9
Metric 3.2: System Average Interruption Frequency Index (SAIFI) Illustrative Performance Metric Graph Utilizing the Example Calculation

28 Attachment 1 to Appendix 9
Metric 3.2: System Average Interruption Frequency Index (SAIFI) Example Calculation and Data
Notes: This is an example based on 2010 historical performance as available and is meant to serve as an illustration only.
MonthCustomers
ServedCustomers Interrupted
Customer Minutes
InterruptedMonth SAIFI
Customers Interrupted
Customer Minutes
InterruptedYTD SAIFI
January 1,117,281 55,912 3,214,401 0.05 55,912 3,214,401 0.05February 1,117,281 63,802 3,664,609 0.06 119,714 6,879,010 0.11March 1,117,281 47,124 2,002,221 0.04 166,838 8,881,231 0.15April 1,117,281 67,810 3,872,730 0.06 234,648 12,753,961 0.21May 1,117,281 84,063 5,252,661 0.08 318,711 18,006,622 0.29June 1,117,281 52,891 3,759,390 0.05 371,602 21,766,012 0.33July 1,117,281 63,625 5,565,169 0.06 435,227 27,331,181 0.39August 1,117,281 75,146 6,439,607 0.07 510,373 33,770,788 0.46September 1,117,281 77,268 5,384,869 0.07 587,641 39,155,657 0.53October 1,117,281 96,477 7,657,777 0.09 684,118 46,813,434 0.61November 1,117,281 55,321 3,595,021 0.05 739,439 50,408,455 0.66December 1,117,281 72,530 3,893,616 0.06 811,969 54,302,071 0.73
MONTH YTD
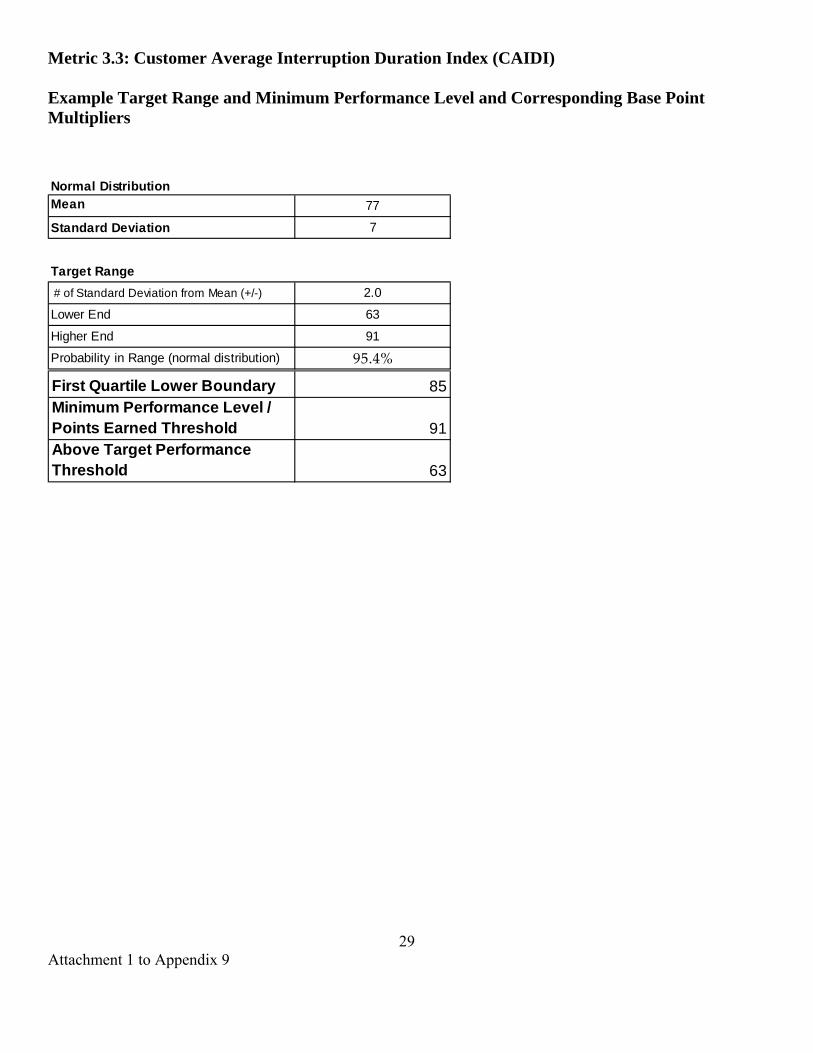
29 Attachment 1 to Appendix 9
Metric 3.3: Customer Average Interruption Duration Index (CAIDI) Example Target Range and Minimum Performance Level and Corresponding Base Point Multipliers
Normal DistributionMean 77
Standard Deviation 7
Target Range
# of Standard Deviation from Mean (+/-) 2.0
Lower End 63
Higher End 91
Probability in Range (normal distribution) 95.4%
First Quartile Lower Boundary 85Minimum Performance Level / Points Earned Threshold 91Above Target Performance Threshold 63

30 Attachment 1 to Appendix 9
Metric 3.3: Customer Average Interruption Duration Index (CAIDI) Illustrative Performance Metric Graph Utilizing the Example Calculation

31 Attachment 1 to Appendix 9
Metric 3.3: Customer Average Interruption Duration Index (CAIDI) Example Calculation and Data
Notes: This is an example based on 2010 historical performance as available and is meant to serve as an illustration only.
MonthCustomers
ServedCustomers Interrupted
Customer Minutes
InterruptedMonth CAIDI
Customers Interrupted
Customer Minutes
InterruptedYTD CAIDI
January 1,117,281 55,912 3,214,401 57.5 55,912 3,214,401 57.5February 1,117,281 63,802 3,664,609 57.4 119,714 6,879,010 57.5March 1,117,281 47,124 2,002,221 42.5 166,838 8,881,231 53.2April 1,117,281 67,810 3,872,730 57.1 234,648 12,753,961 54.4May 1,117,281 84,063 5,252,661 62.5 318,711 18,006,622 56.5June 1,117,281 52,891 3,759,390 71.1 371,602 21,766,012 58.6July 1,117,281 63,625 5,565,169 87.5 435,227 27,331,181 62.8August 1,117,281 75,146 6,439,607 85.7 510,373 33,770,788 66.2September 1,117,281 77,268 5,384,869 69.7 587,641 39,155,657 66.6October 1,117,281 96,477 7,657,777 79.4 684,118 46,813,434 68.4November 1,117,281 55,321 3,595,021 65.0 739,439 50,408,455 68.2December 1,117,281 72,530 3,893,616 53.7 811,969 54,302,071 66.9
MONTH YTD

32 Attachment 1 to Appendix 9
Metric 3.4: OSHA Days Away Rate (Severity) Example Target Range and Minimum Performance Level and Corresponding Base Point Multipliers 3.4 OSHA Days Away Rate (Severity)
Year Target
Performance Level
Minimum Performance
Level 150% 125% 100% 50% 25%
Baseline Performance Level 18.00 18.00 18.00 18.00 18.00
2014 15.00 17.70 17.00 17.25 17.40 17.50 17.57
2015 15.00 17.40 16.00 16.50 16.80 17.00 17.14
2016 15.00 17.10 15.00 15.75 16.20 16.50 16.71
2017 15.00 16.80 15.00 15.60 16.00 16.29
2018 15.00 16.50 15.00 15.50 15.86
2019 15.00 16.20 15.00 15.43
2020 15.00 15.90 15.00
2021 15.00 15.60
2022 15.00 15.30
2023 15.00 15.00
Baseline Performance Level 18.00
Target Performance Level 15.00 Notes: The above values for Baseline and Target Level of Performance are for illustrative purposes only.

33 Attachment 1 to Appendix 9
Metric 3.4: OSHA Days Away Rate (Severity) Illustrative Performance Metric Graph Utilizing the Example Calculation
Notes: This graph is for illustration purposes only.
Illustration

34 Attachment 1 to Appendix 9
Metric 3.4: OSHA Days Away Rate (Severity) Example Calculation and Data
YTD Total Exposure
Hours YTD Total OSHA
Cases YTD Total Lost Time
Days YTD OSHA Days
Away Rate
January 189,737 3 1 1.05
February 453,149 2 1 0.44
March 677,194 4 1 0.30
April 897,059 6 3 0.67
May 1,198,129 10 5 0.83
June 1,427,509 12 98 13.73
July 1,653,440 15 111 13.43
August 1,920,379 17 111 11.56
September 2,146,675 19 150 13.98
October 2,452,680 20 150 12.23
November 2,875,769 22 257 17.87
December 3,430,267 23 282 16.44 This is an example based on 2012 historical performance and is meant to serve as an illustration only. OSHA Days Away Rate (Severity) = Number of Lost Time Days that can be attributed to an OSHA Case x 200,000 Number of employee labor hours worked

35 Attachment 1 to Appendix 9
Metric 3.5: OSHA Recordable Incidence Rate Example Target and Minimum Performance Levels and Corresponding Base Point Multipliers 3.5 OSHA Recordable Incidence Rate
Year Target
Performance Level
Minimum Performance
Level 150% 125% 100% 50% 25%
Baseline Performance Level 1.60 1.60 1.60 1.60 1.60
2014 1.20 1.56 1.47 1.50 1.52 1.53 1.54
2015 1.20 1.52 1.33 1.40 1.44 1.47 1.49
2016 1.20 1.48 1.20 1.30 1.36 1.40 1.43
2017 1.20 1.44 1.20 1.28 1.33 1.37
2018 1.20 1.40 1.20 1.27 1.31
2019 1.20 1.36 1.20 1.26
2020 1.20 1.32 1.20
2021 1.20 1.28
2022 1.20 1.24
2023 1.20 1.20
Baseline Performance Level 1.60
Target Performance Level 1.20 Notes: The above values for Baseline and Target Level of Performance are for illustrative purposes only.

36 Attachment 1 to Appendix 9
Metric 3.5: OSHA Recordable Incidence Rate Illustrative Performance Metric Graph Utilizing the Example Calculation
Notes: This graph is for illustration purposes only.
Illustration

37 Attachment 1 to Appendix 9
Metric 3.5: OSHA Recordable Incidence Rate Example Calculation and Data
YTD Total Exposure
Hours YTD Total OSHA
Cases YTD Total Lost Time
Days
YTD OSHA Recordable Incidence
Rate
January 189,737 3 1 3.16
February 453,149 2 1 0.88
March 677,194 4 1 1.18
April 897,059 6 3 1.34
May 1,198,129 10 5 1.67
June 1,427,509 12 98 1.68
July 1,653,440 15 111 1.81
August 1,920,379 17 111 1.77
September 2,146,675 19 150 1.77
October 2,452,680 20 150 1.63
November 2,875,769 22 257 1.53
December 3,430,267 23 282 1.34 Notes: This is an example based on 2012 historical performance and is meant to serve as an illustration only. OSHA Recordable Incidence Rate = Number of OSHA recordable incidents x 200,000 Number of employee labor hours worked

38 Attachment 1 to Appendix 9
Metric 4.1: Actual Meter Read Rate Example Target and Minimum Performance Levels and Corresponding Base Point Multipliers 4.1 Actual Meter Read Rate
Year Target
Performance Level
Minimum Performance
Level 150% 125% 100% 50% 25%
Baseline Performance Level 97.2% 97.2% 97.2% 97.2% 97.2%
2014 98.0% 97.3% 97.5% 97.4% 97.3% 97.3% 97.3%
2015 98.0% 97.3% 97.7% 97.6% 97.5% 97.5% 97.4%
2016 98.0% 97.4% 98.0% 97.8% 97.7% 97.6% 97.5%
2017 98.0% 97.5% 98.0% 97.8% 97.7% 97.6%
2018 98.0% 97.6% 98.0% 97.9% 97.8%
2019 98.0% 97.7% 98.0% 97.9%
2020 98.0% 97.8% 98.0%
2021 98.0% 97.8%
2022 98.0% 97.9%
2023 98.0% 98.0%
Baseline Performance Level 97.2%
Target Performance Level 98.0% Note: This is an example based on 2012 historical performance and is meant to serve as an illustration only.

39 Attachment 1 to Appendix 9
Metric 4.1: Actual Meter Read Rate Illustrative Performance Metric Graph Utilizing the Example Calculation
Notes: This is an example based on 2012 historical performance and is meant to serve as an illustration only.
Illustration

40 Attachment 1 to Appendix 9
Metric 4.1: Actual Meter Read Rate Example Calculation and Data Month YTD
TOT ADJ EST (ELE)
Total Scheduled to be Read
ACTUAL READS
% ELEC EST
% Actual Meters Read
Total Scheduled to be Read
Actual Reads
% Actual Meters Read
January 14,558 629,424 614,866 2.31% 97.69% 629,424 614,866 97.69%
February 17,321 617,347 600,026 2.81% 97.19% 1,246,771 1,214,892 97.44%
March 14,014 629,840 615,826 2.23% 97.77% 1,876,611 1,830,718 97.55%
April 16,434 617,581 601,147 2.66% 97.34% 2,494,192 2,431,865 97.50%
May 14,871 629,909 615,038 2.36% 97.64% 3,124,101 3,046,903 97.53%
June 17,166 617,534 600,368 2.78% 97.22% 3,741,635 3,647,271 97.48%
July 17,938 630,253 612,315 2.85% 97.15% 4,371,888 4,259,586 97.43%
August 17,069 617,810 600,741 2.76% 97.24% 4,989,698 4,860,327 97.41%
September 17,871 629,921 612,050 2.84% 97.16% 5,619,619 5,472,377 97.38%
October 15,768 551,621 535,853 2.86% 97.14% 6,171,240 6,008,230 97.36%
November 6,480 143,349 136,869 4.52% 95.48% 6,314,589 6,145,099 97.32%
December 25,765 612,482 586,717 4.21% 95.79% 6,927,071 6,731,816 97.18%
TOTAL 195,255 6,927,071 6,731,816 2.82% 97.18% Notes: This is an example based on 2012 historical performance and is meant to serve as an illustration only.

41 Attachment 1 to Appendix 9
Metric 4.2: Timely Billing Example Target Range and Minimum Performance Level and Corresponding Base Point Multipliers
Notes: This is an example and is meant to serve as an illustration only. The Baseline Performance Level is assumed to be the specified percentage below. Billing Exception parameter changes require LIPA approval.
4.2 Timely Billing (example)Year Target
Performance Level
Minimum Performance
Level
150% 125% 100% 50% 25%
Baseline Performance Level 89.00% 89.00% 89.00% 89.00% 89.00%2014 99.61% 90.06% 92.54% 91.65% 91.12% 90.77% 90.52%2015 99.61% 91.12% 96.07% 94.31% 93.24% 92.54% 92.03%2016 99.61% 92.18% 99.61% 96.96% 95.37% 94.31% 93.55%2017 99.61% 93.24% 99.61% 97.49% 96.07% 95.06%2018 99.61% 94.31% 99.61% 97.84% 96.58%2019 99.61% 95.37% 99.61% 98.09%2020 99.61% 96.43% 99.61%2021 99.61% 97.49%2022 99.61% 98.55%2023 99.61% 99.61%
Baseline Performance Level 89.00%Target Performance Level 99.61%

42 Attachment 1 to Appendix 9
Metric 4.2: Timely Billing Illustrative Performance Metric Graph Utilizing the Example Calculation
Notes: This is an example and is meant to serve as an illustration only.

43 Attachment 1 to Appendix 9
Metric 4.2: Timely Billing Example Calculation and Data
Notes: Data included as example and illustration only. Billing Exception parameter changes require LIPA approval.
Date
"No Bill" Billing Exceptions Billed
within 3 days
Total "No Bill" Billing Exceptions
% Completed within 3 days
"No Bill" Billing Exceptions Billed
within 3 days
Total "No Bill" Billing Exceptions
% Completed within 3 days
January 16,000 18,000 88.9% 16,000 18,000 88.9%February 16,500 18,400 89.7% 32,500 36,400 89.3%March 16,000 18,000 88.9% 48,500 54,400 89.2%April 16,500 18,400 89.7% 65,000 72,800 89.3%May 16,000 18,000 88.9% 81,000 90,800 89.2%June 16,500 18,400 89.7% 97,500 109,200 89.3%July 16,000 18,000 88.9% 113,500 127,200 89.2%August 16,500 18,400 89.7% 130,000 145,600 89.3%September 16,000 18,000 88.9% 146,000 163,600 89.2%October 16,500 18,400 89.7% 162,500 182,000 89.3%November 16,000 18,000 88.9% 178,500 200,000 89.3%December 16,500 18,400 89.7% 195,000 218,400 89.3%
Month YTD

44 Attachment 1 to Appendix 9
Metric 4.3: Days Sales Outstanding Example Target and Minimum Performance Levels and Corresponding Base Point Multipliers 4.3 Days Sales Outstanding
Year Target
Performance Level
Minimum Performance
Level 150% 125% 100% 50% 25%
Baseline Performance Level 41.91 41.91 41.91 41.91 41.91
2014 36.20 41.34 40.01 40.48 40.77 40.96 41.09
2015 36.20 40.77 38.10 39.06 39.63 40.01 40.28
2016 36.20 40.20 36.20 37.63 38.48 39.06 39.46
2017 36.20 39.63 36.20 37.34 38.10 38.65
2018 36.20 39.06 36.20 37.15 37.83
2019 36.20 38.48 36.20 37.02
2020 36.20 37.91 36.20
2021 36.20 37.34
2022 36.20 36.77
2023 36.20 36.20
Baseline Performance Level 41.91
Target Performance Level 36.20 Notes: Previously, portions of the LIRR A/R were in dispute and excluded from this calculation. The dispute has been settled and the previously disputed A/R will not be included in the 2014 calculations. Moving forward any new LIRR A/R will be included in the calculation. This is an example based on 2012 historical performance and is meant to serve as an illustration only. The data and calculations do not include any exclusions.

45 Attachment 1 to Appendix 9
Metric 4.3: Days Sales Outstanding Illustrative Performance Metric Graph Utilizing the Example Calculation
Notes: This is an example based on 2012 historical performance and is meant to serve as an illustration only.
Illustration

46 Attachment 1 to Appendix 9
Metric 4.3: Days Sales Outstanding Example Calculation and Data
Month 12-Month Rolling
Billed Revenue Avg. 12 Mo. A/R Days Sales
Outstanding
January $3,602,462,344 $397,678,105 40.29
February $3,602,905,661 $394,833,908 40.00
March $3,593,915,221 $394,263,615 40.04
April $3,588,319,509 $394,757,481 40.15
May $3,581,637,375 $392,790,405 40.03
June $3,572,701,150 $392,356,092 40.08
July $3,565,113,903 $390,702,369 40.00
August $3,586,997,470 $392,392,388 39.93
September $3,574,261,380 $392,357,127 40.07
October $3,557,407,944 $390,827,805 40.10
November $3,476,270,514 $390,457,055 41.00
December $3,408,680,130 $391,394,236 41.91
Notes: This is an example based on 2012 historical performance and is meant to serve as an illustration only.

47 Attachment 1 to Appendix 9
Metric 4.4: Net Write-Offs / $100 Billed Example Target and Minimum Performance Levels and Corresponding Base Point Multipliers
4.4 Net Write-Offs / $100 Billed
Year Target
Performance Level
Minimum Performance
Level 150% 125% 100% 50% 25%
Baseline Performance Level 0.58 0.58 0.58 0.58 0.58
2014 0.37 0.56 0.51 0.53 0.54 0.55 0.55
2015 0.37 0.54 0.44 0.48 0.50 0.51 0.52
2016 0.37 0.52 0.37 0.42 0.45 0.48 0.49
2017 0.37 0.50 0.37 0.41 0.44 0.46
2018 0.37 0.48 0.37 0.41 0.43
2019 0.37 0.45 0.37 0.40
2020 0.37 0.43 0.37
2021 0.37 0.41
2022 0.37 0.39
2023 0.37 0.37
Baseline Performance Level 0.58
Target Performance Level 0.37 Notes: The data and calculations do not include any exclusions. This is an example based on 2012 historical performance and is meant to serve as an illustration only.

48 Attachment 1 to Appendix 9
Metric 4.4: Net Write-Offs / $100 Billed Illustrative Performance Metric Graph Utilizing the Example Calculation
Notes: This is an example based on 2012 historical performance and is meant to serve as an illustration only.
Illustration

49 Attachment 1 to Appendix 9
Metric 4.4: Net Write-Offs / $100 Billed Revenue Example Calculation and Data
Month 12-Month Rolling Billed
Revenue 12-Month Rolling Write-
Offs Net Write-Offs / $100
Billed
January $ 3,602,462,344 $ 24,725,175 0.69
February $ 3,602,905,661 $ 24,599,310 0.68
March $ 3,593,915,221 $ 23,909,865 0.67
April $ 3,588,319,509 $ 24,282,911 0.68
May $ 3,581,637,375 $ 22,909,494 0.64
June $ 3,572,701,150 $ 21,705,833 0.61
July $ 3,565,113,903 $ 20,839,337 0.58
August $ 3,586,997,470 $ 19,952,789 0.56
September $ 3,574,261,380 $ 20,360,828 0.57
October $ 3,557,407,944 $ 20,031,894 0.56
November $ 3,476,270,514 $ 19,734,184 0.57
December $ 3,408,680,130 $ 19,750,339 0.58 Notes: This is an example based on 2012 historical performance and is meant to serve as an illustration only.

50 Attachment 1 to Appendix 9
Metric 4.5: Electric Damages per 1,000 Locates Example Target Range and Minimum Performance Level and Corresponding Base Point Multipliers
4.5 Electric Damages per 1,000 Locates
Year Target
Performance Level
Minimum Performance
Level 150% 125% 100% 50% 25%
Baseline Performance Level 0.56 0.56 0.56 0.56 0.56
2014 0.43 0.55 0.52 0.53 0.54 0.54 0.55
2015 0.43 0.54 0.47 0.50 0.51 0.52 0.53
2016 0.43 0.52 0.43 0.46 0.48 0.50 0.51
2017 0.43 0.51 0.43 0.46 0.47 0.49
2018 0.43 0.50 0.43 0.45 0.47
2019 0.43 0.48 0.43 0.45
2020 0.43 0.47 0.43
2021 0.43 0.46
2022 0.43 0.44
2023 0.43 0.43
Baseline Performance Level 0.56
Target Performance Level 0.43 Notes: Data included as example and illustration only.

51 Attachment 1 to Appendix 9
Metric 4.5: Electric Damages per 1,000 Locates Illustrative Performance Metric Graph Utilizing the Example Calculation
Notes: Data included as example and illustration only.
Illustration

52 Attachment 1 to Appendix 9
Metric 4.5: Electric Damages per 1,000 Locates Example Calculation and Data
Notes: Data included as example and illustration only.
No Valid Request
Marked Accurately
Did Not Maintain
Marks
Human Error
No/Poor Records
No Tracer Wire
No Valid Request
Marked Accurately
Did Not Maintain
Marks
Human Error
No/Poor Records
No Tracer Wire
January 1 2 4 7 9,000 0.78 1 - 2 4 - - - 7 9,000 0.78February 2 3 5 9,000 0.56 1 2 2 4 - - 3 12 18,000 0.67March 3 3 9,000 0.33 1 2 2 4 3 - 3 15 27,000 0.56April 1 2 3 9,000 0.33 1 2 3 4 3 - 5 18 36,000 0.50May 1 1 1 3 9,000 0.33 1 3 3 5 3 1 5 21 45,000 0.47June 2 4 1 7 9,000 0.78 1 3 5 5 7 1 6 28 54,000 0.52July 2 2 9,000 0.22 3 3 5 5 7 1 6 30 63,000 0.48August 2 3 2 1 8 9,000 0.89 5 3 8 5 9 1 7 38 72,000 0.53September 3 1 4 9,000 0.44 5 6 8 5 9 1 8 42 81,000 0.52October 2 1 3 1 1 8 9,000 0.89 7 7 8 5 12 2 9 50 90,000 0.56November 1 4 5 9,000 0.56 8 11 8 5 12 2 9 55 99,000 0.56December 4 1 1 6 9,000 0.67 12 11 8 5 13 2 10 61 108,000 0.56
Total Locate
Requests
Electric Damages per 1,000
Locate Requests
Excavator @ Fault Operator @ Fault
Could Not Determine
Excavator @ Fault Operator @ Fault
Could Not Determine
MONTH YTDCause
Total Damages
Total Locate
Requests
Electric Damages per 1,000
Locate Requests
Cause
Total Damages

53 Attachment 1 to Appendix 9
Metric 4.6: ELI Achieved Load Reduction Example Target Range and Minimum Performance Level and Corresponding Base Point Multipliers
Notes: Minimum Performance Level is 20% below the 2014 Total Annual MW Reduction.
4.6 2014 Achieved Load Reduction (MW)2014 Above Target
Performance Threshold
150%
Above Target Performance
Threshold125%
Target Performance
Level
Below Target Performance Threshold
50% / Points Earned
Threshold
Minimum Performance
Level
2014 Total Annual MW Reduction 67.86 81.44 74.65 67.86 61.08 54.2920% of 2014 Total Annual MW Reduction 13.57

54 Attachment 1 to Appendix 9
Metric 4.6: ELI Achieved Load Reduction Illustrative Performance Metric Graph Utilizing the Example Calculation
Notes: This example is based on an illustrative target, not the 2014 Target.

1
APPENDIX 10
Definition of Storm Event and Operation of Storm Reserve
For purposes of this Agreement, a “Storm Event” shall mean an event where (i) at least 15,400 customers are interrupted or (ii) at least 150 outage jobs are logged, in each case within a 24-hour period due to a storm. A Storm Event will end when “System Normal Status” is achieved. System Normal Status is a state in which fewer than 1,000 customers remain interrupted for a continuous period of eight (8) hours following a storm.
Costs related to Storm Events (“Storm Costs”) shall be Pass-Through Expenditures and shall consist of costs incurred by the Service Provider as a result of (i) responding to a Storm Event and restoring the T&D System to System Normal Status; (ii) completing any related follow-up work performed within the five-day period commencing from the end of a Storm Event ((i) and (ii) collectively, the “Initial Storm Costs”), and (iii) completing all subsequent follow-up work approved by LIPA (“Follow-up Storm Costs”), which approval shall not be unreasonably withheld or delayed.
Pursuant to Section 5.3(B) hereof, the Service Provider shall be entitled to withdraw funds from a storm reserve established by LIPA to pay for Storm Costs (the “Storm Reserve”). LIPA will initially fund the Storm Reserve in the amount of $15 million. If during a Contract Year the Storm Reserve balance falls below $3 million due to withdrawals by the Service Provider, LIPA will replenish the Storm Reserve to restore the balance in the Storm Reserve to $15 million. The Service Provider may request that LIPA replenish the Storm Reserve or temporarily fund the Storm Reserve in an amount exceeding $15 million if Storm Costs are anticipated to exceed the funds available in the Storm Reserve. The Parties may modify these amounts from time to time as circumstances warrant.
The parties will follow the procedures and provisions related to accounting for and invoicing of Storm Costs set forth below. Invoicing for Storm Costs
Within five (5) Business Days following the day after a Storm Event ends, the Service Provider will provide a list of pending follow-up work and estimated costs to LIPA. Within five (5) Business Days following the day after LIPA receives the list of proposed follow-up work, LIPA will provide the Service Provider with written approval of the follow-up work authorized to be performed as Storm Event work. Only Storm Costs, including the cost of follow-up work that has been approved by LIPA, may be withdrawn from the Storm Reserve.
Invoices for Storm Costs (“Storm Invoices”) shall be submitted separately for each individual Storm Event. The Service Provider will issue two (2) Storm Invoices for each Storm Event (except as provided in Section 3 below) as follows:

2
(a) An initial Storm Invoice will be submitted to LIPA within three (3) months from the last day of a Storm Event. This initial Storm Invoice will include Initial Storm Costs as well as those Follow-up Storm Costs incurred to date.
(b) A second Storm Invoice will be submitted within six (6) months following the last day of a Storm Event and will include only those Follow-up Storm Costs performed after submittal of the initial Storm Invoice and/or Storm Costs not previously billed in the initial Storm Invoice.
Notwithstanding the above, the parties acknowledge that the Service Provider may incur Storm Costs that are delayed past the six (6) month period for issuance of the second Storm Invoice due to (a) a late contractor invoice (but only to the extent that LPA has given its prior, written approval of such an extension, which will not be unreasonably withheld); (b) LIPA agreed-to demands from customers and/or municipalities (e.g., school requests that storm follow-up work be delayed until the summer when classes are not in session); or (c) system clearances which prohibit completing the work within such period. These exceptional circumstances will, to the extent known by the Service Provider, be outlined in the initial list of follow-up storm work. The Service Provider will provide LIPA with timely updates of the pending follow-up work list.
LIPA shall review Storm Invoices and related cost substantiation information and, within forty-five (45) days of receipt of a Storm Invoice, inform the Service Provider of any and all disputed items. The Service Provider shall resolve the dispute within thirty (30) days of notification by LIPA. The Service Provider shall [reimburse] LIPA for any unresolved disputed items related to insufficient cost substantiation or mischarges, along with accrued interest at the Default Interest Rate. Cost substantiation shall be governed by the provisions of Section 1.1(E) and the additional cost substantiation guidelines set forth below.
Invoicing procedures and timing identified above may be modified by the Parties for those Storms Events where (a) Federal Emergency Management Agency (“FEMA”) assistance or Mutual Aid Assistance is sought by LIPA, and/or (b) where the outages exceed 150,000 customers. The Contract Administration Manual shall specify accounting and invoicing procedures for such Storm Events.
Cost Substantiation for Storm Costs The purpose of cost substantiation is to detail the accuracy and justify the reasonableness of all invoiced Storm Costs. Cost substantiation shall be provided with each Storm Invoice and shall include the information set forth below: Electronic spreadsheet summary/backup file of all storm costs and a copy of the invoice coversheet with a cost summary.

3
Transactional sheets (“invoice overview,” “project expenditure items,” and “distributions” summary sheets) will accompany each cost detail. All invoiced labor costs will be supported by employee, day, and number of hours worked summary from time keeping system (cost types 100, 105, 107, 108, 110, 112, 113, 115 in the attached table of example cost types). All invoiced third party costs will be supported by contractor/vendor invoice, supporting time and expense detail, purchase order, and release (cost types 264, 265,300, 301,302, 310, 313, 320, 406, 410, etc). The Service Provider will require vendors to submit invoices that contain only Storm Costs. Vendor “mixed” invoices (e.g., invoices containing storm and non-storm related work) will not be approved. All travel and other employee expenses will be supported by employee expense account submittal and appropriate receipts (cost types 477, 478, 479, 480, 481, 485, 501, etc.). All benefits and burden related costs will be supported by appropriate schedules for allocation of such costs for the specific time period (cost types 716, 717, 718, 719, 720, 721, 722, 733, etc.). All stock issues and stock returns will be supported by detailed spreadsheet listing of equipment issued/returned, date of issue/return, associated cost, individual issued to/returned to, etc. cost types 200, 210). Petty cash (cost type 131) associated costs will be accompanied by detailed spreadsheet indicating individual, date, hours worked, and cash distributed. Petty cash costs for items other than “paper meals” (i.e., dollars paid to employees pursuant to the current collective bargaining agreement) will be accompanied by additional explanation and substantiation for those costs (e.g., mileage reimbursement). Other Employee Related Cash Payments (cost type 132) will be accompanied by adequate supporting information including individual, date(s) worked, letter recommending award, and related approvals. All cost transfers will be accompanied by a detailed copy of the transfer, identifying the cost transferred and explanation for the transfer. All cost types not explicitly listed above, or created in the future, will follow the general guidelines listed above for the most similar category. All billings for Mutual Aid Assistance received will conform to the EEI Mutual Aid Agreement.
Example of Cost Types for Storm Invoices
Cost Type Type Name Description/Types of Charges Included
100 ST Mgmt Labor Labor 105 ST Nonmgmt Labor Labor 107 Labor - Premium Nonmgmt Premium Pay 108 Labor - OT Premium Non-Mgt Overtime Pay 110 OT Mgmt Labor 112 Labor - Premium Mgmt 113 Labor - Premium OT Mgmt 115 OT Nonmgmt Labor 131 Petty Cash Overtime payment for meals - contractual 132 Other Empl Related Cash Payments Overtime Payments

4
Cost Type Type Name Description/Types of Charges Included200 Stock Issues Materials issued from inventory 210 Stock Returns Materials returned to inventory 264 Other Materials Purchases Non - Stock materials - Direct purchase 265 Freight Expenses Shipping on direct purchase materials 300 Contract Labor Outside Contractors 310 Outside Services - Other Outside Contractors 313 Professional Services Outside Contractors 320 Paving Hot Patch Paving Contractor 406 Outside Consultants Outside Contractors 410 Rentals Equipment & truck rentals 414 Property Damage - Vehicle Cost to repair damage to vehicles 415 Office Supplies Supplies used in offices 420 P Card - Other Purchase card purchases 438 Moving & Transportation Services Used for towing and recovery services 477 Travel & Expenses Employee T&E 478 Meals & Entertainment Employee T&E 479 Personal Auto Expenses Employee T&E 480 Other Employee Expenses Employee T&E 481 Entertainment - Non A/P Employee T&E 485 Telecommunications - Telephone Phone expenses 501 Meals & Entertainment Employee T&E 589 Sales and Use Taxes-Accrued-AP Sales tax on contractor costs and materials615 Transportation-Parts & Accessories-A/P Vehicle parts purchased 7 16 Pension 401 K Match Burden Employee labor burden 7 17 Other Post Empl Benefits (OPEBSs) Burden Employee labor burden 718 Benefits Burden Employee labor burden 7 19 Payroll Taxes Burden Employee labor burden 720 Incentive Compensation Burden Employee labor burden 72 1 Paid Absence Burden Employee labor burden 722 Vacation Burden Employee labor burden 723 Gainsharing Non-Management Employee labor burden 733 Gainsharing Non-Management Employee labor burden 749 Equipment Maintenance Maintenance on equipment 750 Misc Gen Office Accounting transfers

1
APPENDIX 11 (A)
REQUIRED OPERATING PERIOD INSURANCE
Annual election to be made by LIPA
Insurance to be procured for LIPA – The following table identifies the insurance which shall be procured by the Service Provider for LIPA. Consistent with the terms, conditions and limitations of this Agreement, the Service Provider and ServCo will be included as an additional named insured and provided a waiver of subrogation.
Policy Type Limits Deductible
Excess General Liability including automobile liability and employer's liability
$300,000,000 each occurrence/agg
$3,000,000 SIR or as directed by LIPA
Nuclear Electric $630,000/weekly 12 WEEKS
Property (All Risk) $500,000,000 each
occurrence
Excess: $1.5m each occ for PD or as directed by LIPA; replacement cost coverage; distribution
assets only
Railroad Protective $2,000,000/$6,000,000 $0
US Property Terrorism follows property program follows property program

2
APPENDIX 11 (B)
Required Coverage for Service Provider – Separately, and not part of the LIPA insurance package procured under Appendix 10(A), the Service Provider shall procure and maintain in effect during the Term the insurance coverage set forth below. The Service Provider and ServCo shall be the named insured under such policies.
Policy Type Limits
(dedicated to the OSA Scope)
Deductible
LIPA – Additional Insured/waiver of
subrogation
Workers Compensation
In compliance with the jurisdiction where the
work is performed
$500,000 maximum self insured retention
(SIR)
Alternate Employer/Yes
Fiduciary Liability $60,000,000 aggregate
limit Not to exceed
$500,000 as available
Business Travel Accident
up to 6 times salary and a cap of $4,000,000 is
acceptable
None No/Yes
The above program is to be dedicated to the activities of ServCo and the Service Provider employees in relation to their activities exclusively for and on behalf of LIPA. The program may be a part of a corporate program provided that the terms, conditions and limits above remain in place (except for claims arising from the course of work for LIPA) and are fully assignable to any successor service provider.

APPENDIX 12
LIPA TERMINATION FEE AMOUNTS
Contract Year of Termination Date Amount
2014 7,000,000
2015 6,500,000
2016 6,000,000
2017 5,000,000
2018 4,000,000
2019 2,500,000
2020 0
2021 0
2022 0
2023 0

APPENDIX 13
Major Storm Performance Metric
The Service Provider will be deemed to have failed the Major Storm Performance Metric under Section 8.4(C) of the Agreement if, commencing in the third Contract Year of the Term, the Service Provider, in the then-current Contract Year and any one of the preceding two (2) Contract Years, fails to achieve at least 410 points out of a maximum of 1000 points as calculated pursuant to the modified version, as agreed upon by LIPA and the Service Provider in the letter agreement dated as of the date of the Agreement, of the NYPSC Emergency Performance Measures issued on April 24, 2013 in “CASE 13-E-0140—Proceeding on Motion of the Commission to Consider Utility Emergency Performance Metrics”. LIPA and the Service Provider may further adjust the minimum points threshold and calculation standards set forth or referenced in this paragraph by mutual agreement without satisfying any further requirements.
Minimum Performance Level Metric
The Service Provider will be deemed to have failed the Minimum Performance Level Metric under Section 8.4(C) of the Agreement if (i) commencing in the third Contract Year of the Term, a majority of the Performance Metrics listed in Table 3 in Appendix 9 to the Agreement (as in effect at the time of determination – currently 7 out of 13) as benchmarked by an established peer panel utilized by the Service Provider and LIPA are below the Third Quartile in the then-current Contract Year and any one of the preceding two (2) Contract Years or (ii) the JD Power Customer Satisfaction Survey (Residential) is in the Fourth Quartile for four (4) consecutive Contract Years.

APPENDIX 14 LIPA Marks
Trademark Serial/Registration Number
Federal or State Registration
Current Status of Trademark
3404585
Federal
Status: Registered on April 1, 2008 Next Filing: Combined Section 8/15 due between April 1, 2013 and April 1, 2014
3404572
Federal
Status: Registered on April 1, 2008 Next Filing: Combined Section 8/15 due between April 1, 2013 and April 1, 2014
LIPAedge
3671418
Federal
Status: Registered on August 25, 2009 Next Filing: Combined Section 8/15 due between August 25, 2014 and August 25, 2015

LIPA
2329492
Federal
Status: Registered on March 14, 2000 Combined 8/15 filed on: March 2, 2006 (granted May 24, 2006) Combined 8/9 filed on: August 20, 2009 (granted September 3, 2009) Next Filing: Second ten-year renewal due between March 14, 2019 and March 14, 2020
The Power of Change S17446 NYS Expires 3/30/11 The Power of Commitment S17889 NYS Expires 4/19/12
More Choice...Better Service S19509 NYS Expires 2/13/16 Energywise S17445 NYS Expires 3/30/11
LIPA S16316 (renewal S20709)
NYS Expires 10/27/18
LIPAedge S18343 NYS Expires 4/16/13

Service Provider Marks
Trademark Serial/Registration Number
Federal or State Registration
Current Status of Trademark
Being prepared
Being prepared