Mike Johnsen, FMCSA, sponsor Doug Lee, Volpe Center, PI Garrett Hagemann, Economist Kent Hymel,...
11
The Cost of Truck Crashes: Delay and Environmental Costs Mike Johnsen, FMCSA, sponsor Doug Lee, Volpe Center, PI Garrett Hagemann, Economist Kent Hymel, Economist Adam Klauber, Environmental Engr George Noel, Environmental Engr David Pace, Economist Catherine Taylor, Economist
-
Upload
philip-webb -
Category
Documents
-
view
214 -
download
1
Transcript of Mike Johnsen, FMCSA, sponsor Doug Lee, Volpe Center, PI Garrett Hagemann, Economist Kent Hymel,...

The Cost of Truck Crashes:Delay and Environmental Costs
Mike Johnsen, FMCSA, sponsorDoug Lee, Volpe Center, PIGarrett Hagemann, EconomistKent Hymel, EconomistAdam Klauber, Environmental EngrGeorge Noel, Environmental EngrDavid Pace, EconomistCatherine Taylor, Economist

• Fatalities• Medical Costs• Property Damage• Emergency Services• Delay• Emissions• (Hazardous Materials)
Crash Cost Components
2

3CMV
• where Di = delay for crash type i
• and Fi = relative frequency of type i
Fundamental Delay Equation
1/24/2011
average delay across all volumes is NOT = delay from the average volume

4CMV
• Volume– functional class– time of day– day of week
• Duration– severity (fatality, all)
Delay Factors
1/23/2011
Urban Interstates and Expressways
0 5 10 15 20 25hour
0
0.01
0.02
0.03
0.04
0.05
0.06
0.07
0.08

5CMV
• Queuing Delay on the facility (microsimulation modeling)– capacity
• closure
– volume– other road type characteristics– diversion rules
• Network (diversion) delay (deterministic queueing model)– road type
• detour
– speed• speed limits• congestion
Delay Components
1/23/2011
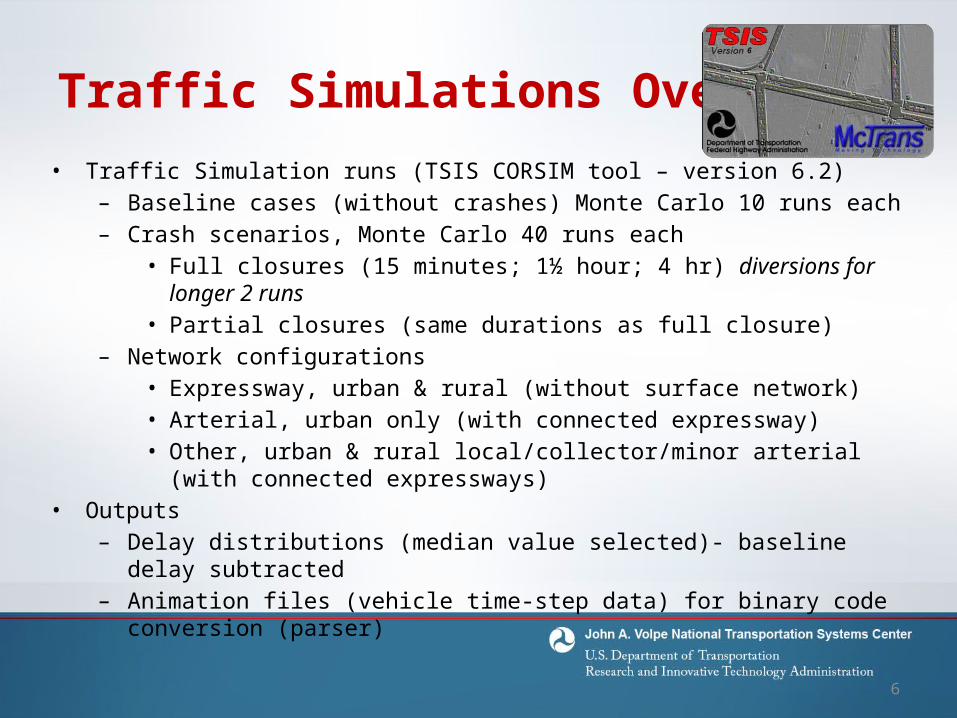
Traffic Simulations Overview• Traffic Simulation runs (TSIS CORSIM tool – version 6.2)
– Baseline cases (without crashes) Monte Carlo 10 runs each– Crash scenarios, Monte Carlo 40 runs each
• Full closures (15 minutes; 1½ hour; 4 hr) diversions for longer 2 runs• Partial closures (same durations as full closure)
– Network configurations• Expressway, urban & rural (without surface network)• Arterial, urban only (with connected expressway)• Other, urban & rural local/collector/minor arterial (with connected expressways)
• Outputs– Delay distributions (median value selected)- baseline delay subtracted– Animation files (vehicle time-step data) for binary code conversion (parser)
6

Field CMV Crash Delay Data• All States contacted for crash data – Kentucky and Pennsylvania contributed
statewide CMV crash closure duration and location data
Attribute Kentucky Pennsylvania
Location Road mile marker Latitude/longitude
Duration Discreet value of lane closure 7 range values for incident (e.g. 0-30 min.)
Severity Fatal, Injury, Property Damage Only (PDO)
Fatal, Injury, PDO
Truck type No data Yes
Urban/rural distinction As defined by Kentucky State Highway Patrol
As defined by PennDOT
Vehicle configuration 4 truck types,2 bus types
7 truck types,2 bus types
Other relevant data Hazmat presence, other involved vehicles
# injuries/fatalities, Hazmat presence
7

Traffic Simulation Details• Variable ranges
– Volumes- 50-6,000 vehicles per hour – Lane number range- 2-6 bi-directional (HPMS data)– Speeds- 30-65mph (HPMS data)– Fleet composition- 4-20% trucks (HPMS data)– Link- 0.25-4 miles (segment length contains all queues) – Node- various including signalized intersections (e.g. urban
arterials)– Non-involved direction traffic
• Rubber necking factor for interstates only• Other (urban and rural) rotating blockage on partial
closure
8

Parsing of TSIS-CORSIM Binary Files• Parsing Application Developed to
Translate Binary Output– Time Step Data Files (TSD) -
Individual Vehicle data
• Parse TSIS-CORSIM binary files– Utilize for the TRAFVU component
for visualizing the simulation• Contains second-by second
data• Contains aggregated
information for each time interval assigned
9

Vehicle Emissions Simulation Overview• Emissions Methodology
– Parsing of TSIS-CORSIM binary files• Utilize Parser Application developed by Volpe Center• Parser reads CORSIM animation & calculates vehicle specific power (VSP)• VSP calculated for each link and separated by vehicle type
– Motor Vehicle Emission Simulator (MOVES) 2010a• Parser application creates and output table using MOVES Operating Mode
Distribution feature for Project Level Scenario• Operating Mode Distribution utilizes drive cycle across each link
– Emissions analysis • Incident minus Baseline to estimate the emissions impacts
10

11CMV
• Road Type (functional class, urban/rural)• Fatality• Truck Type
Very Preliminary Delay and Emissions Results
1/23/2011
ALL Fatal Injury PDO
Vehicle Delay (hrs) 1,805 9,292 2,236 1,531
Value of Time $ 21,893 $ 112,715 $ 27,120 $ 18,574
Emissions and Fuel
Costs $ 6,190 $ 31,871 $ 7,668 $ 5,252
Total Cost $ 28,083 $ 144,585 $ 34,788 $ 23,825
Urban Interstates/Expressways