MIDTOWN DISTRICT Midtown... · characteristics of the residents influence health. ... Although the...
81
MIDTOWN DISTRICT Health Impact Assessment Report SLHI 2013
Transcript of MIDTOWN DISTRICT Midtown... · characteristics of the residents influence health. ... Although the...
MIDTOWN DISTRICTHealth Impact Assessment ReportSLHI 2013

This page was left blank intentionally
AcknowledgementsThis assessment and set of recommendations for the Midtown district is submitted by a multidisciplinary health team, convened by St. Luke’s Health Initiatives (SLHI), as part of Reinvent PHX. Funded by the U.S. Department of Housing and Urban Development, Reinvent PHX is a partnership between the city of Phoenix, Arizona State University, and SLHI to develop a long-range sustainability plan for the neighborhoods along the light rail.
The scope of SLHI and the health team’s work is to gather information from “underserved, particularly non-English speaking, residents in each district.” From information gathered from residents, along with other primary and secondary data, the health team produced this “health impact assessment of Midtown’s existing built-environment conditions” with a focus on “healthy food and recreation access, walking and bicycling safety, and exposure to excessive heat.” After assessing the current conditions, the health team recommends the attached “intervention strategies focused on improving public health.”
The Reinvent PHX health team includes the following members: Dean Brennan, FAICP; Mariana del Hierro; Dr. Ernesto Fonseca, The Elemental Group, LLC; Dr. Pam Goslar, Dignity Health; C.J. Eisenbarth Hager, SLHI; Dr. Debarati “Mimi” Majumdar Narayan, Catalyze Research and Consulting, LLC; Stephen Reichardt, Arizona State University; and Kim Steele, The Elemental Group, LLC.
The health team wishes to thank the following individuals who were helpful in producing this report: Wendoly Abrego, The Elemental Group, LLC; Joel Carrasco, city of Phoenix; Katherine Coles, city of Phoenix; DoLuis Cruz, The Elemental Group, LLC; Gabriel Díaz, The Elemental Group, LLC; Jon Ford, SLHI; Stephanie Gallegos, SLHI; Fátima García, The Elemental Group, LLC; Karla Grijalva, The Elemental Group, LLC; Dr. Mark Hager, Arizona State University; Lysistrata “Lyssa” Hall, city of Phoenix; John Harlow; Oscar Huerta, The Elemental Group, LLC; Lisa Huggins-Hubbard, city of Phoenix; Lora Martens, The Elemental Group, LLC; Amanda Mollindo; Eva Morales, The Elemental Group, LLC; Abe Moreno, St. Joseph’s Hospital & Medical Center; Adelina Musina, Fellowship Towers Senior Housing Property; Vivek Narayan, Catalyze Research and Consulting, LLC; Suzanne Pfister, SLHI; Roy Pringle, SLHI; Curt Upton, city of Phoenix; and Jacob Zonn.
SLHI’s mission is to inform, connect and support efforts to improve the health of individuals and communities in Arizona. SLHI seeks to be a catalyst for community health.

This page was left blank intentionally
Reinvent PHX | i
Table of ContentsHealth Assessment Report 1
Midtown District and Its Residents 3
Midtown Health Assets 9
Community-Identified Health Assets 9
Other Community Assets 11
Community-Identified Potential Health Assets 11
Access to Healthy Food 13
Healthy Food Options in Midtown 14
Community-Identified Barriers to Healthy Food 16
Access to Recreation 19
Monterey Park 20
Safe Streets and Public Spaces 23
Community-Identified Street Concerns 25
Injury Analysisiv 27
Street Audits and Epidemiological Observations 29
Dealing with the Heat 36
Health Strategy Report 39
Healthy Food Strategies 41
Strategy One: Strengthen the existing retail food environment in the Midtown district 41
Strategy Two: Create new healthy food outlets in the Midtown district 44
Tools for Implementation of Food Strategies 49
Recreation Strategies 51
Strategy One: Enhance existing recreation facility within the Midtown district 51
Strategy Two: Create additional recreation facilities and opportunities for physical activity within the Midtown district 53
Strategy Three: Improve and enhance the physical environment to encourage residents to walk or bicycle in the Midtown district 55
Tools for Implementation of Recreation Strategies 55
Midtown District
Safe Streets and Public Places Strategies 57
Strategy One: Implement infrastructure improvements to create safe streets and public places in Midtown 57
Strategy Two: Implement programs that support safe streets and public places in Midtown 62
Strategy Three: Increase the quality, access and safety for transit users in Midtown 63
Tools to Implement Safe Streets and Public places 64
References 65
Appendix 1: Issue Brief on Built Environment and Health 71
Appendix 2: Community Workshop Report 83
Appendix 3: Streets Report 145
Appendix 4: Community Outreach Report 165
Appendix 5: Street and Park Audits 177
Appendix 6: Additional Maps 255
Reinvent PHX | iii
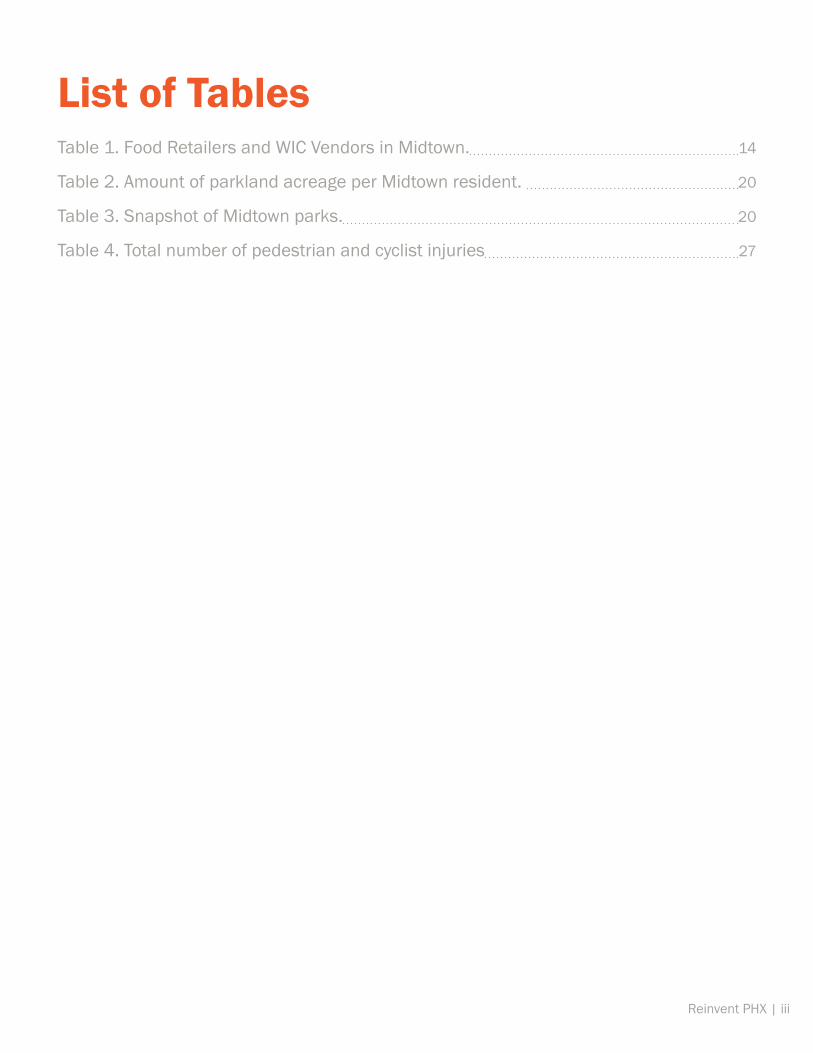
List of TablesTable 1. Food Retailers and WIC Vendors in Midtown. 14
Table 2. Amount of parkland acreage per Midtown resident. 20
Table 3. Snapshot of Midtown parks. 20
Table 4. Total number of pedestrian and cyclist injuries 27
Midtown District
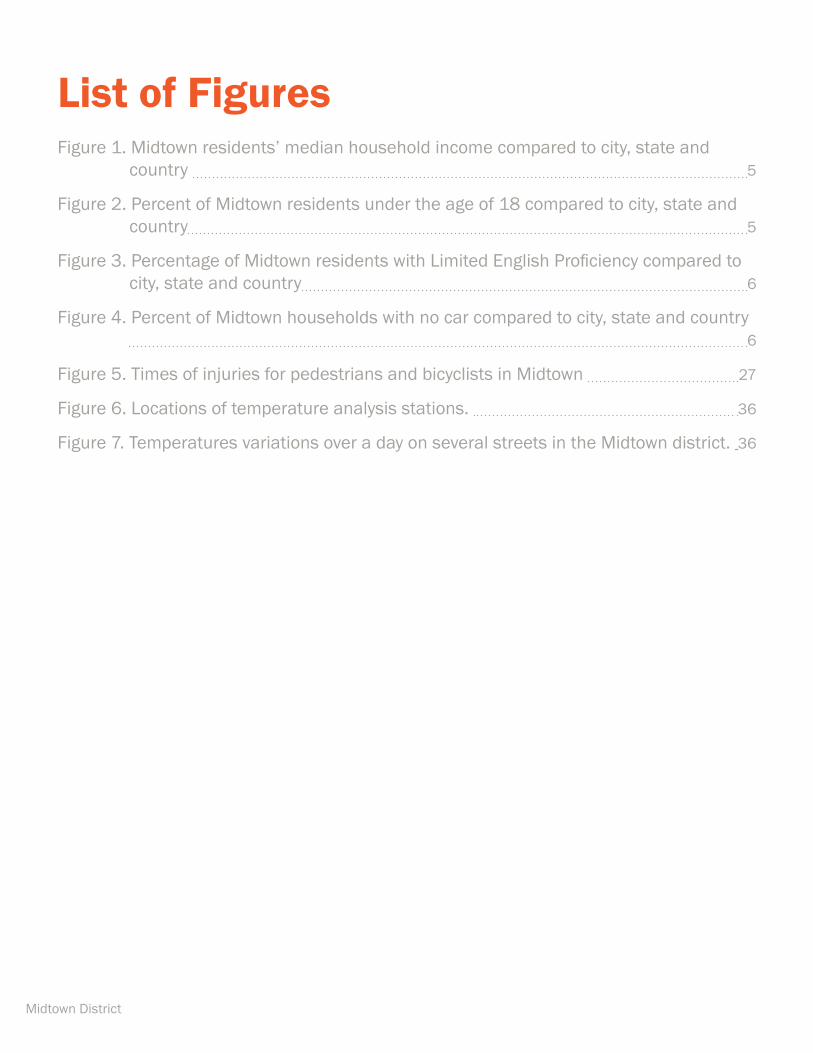
List of FiguresFigure 1. Midtown residents’ median household income compared to city, state and
country 5
Figure 2. Percent of Midtown residents under the age of 18 compared to city, state and country 5
Figure 3. Percentage of Midtown residents with Limited English Proficiency compared to city, state and country 6
Figure 4. Percent of Midtown households with no car compared to city, state and country 6
Figure 5. Times of injuries for pedestrians and bicyclists in Midtown 27
Figure 6. Locations of temperature analysis stations. 36
Figure 7. Temperatures variations over a day on several streets in the Midtown district. 36
Reinvent PHX | v
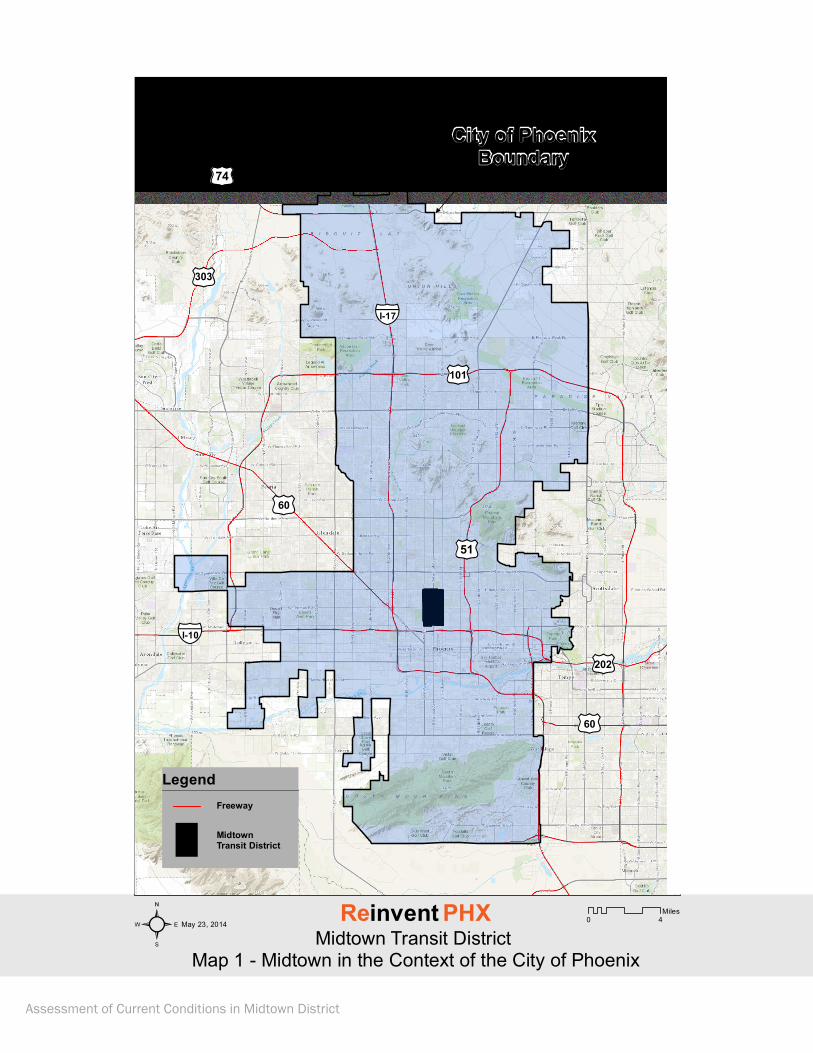
List of MapsMap 1 Midtown in the Context of City of Phoenix 4
Map 2 Community-Identified Assets 9
Map 3 Community Assets 10
Map 4 Health Food Accessibility 15
Map 5 Food Outlets 17
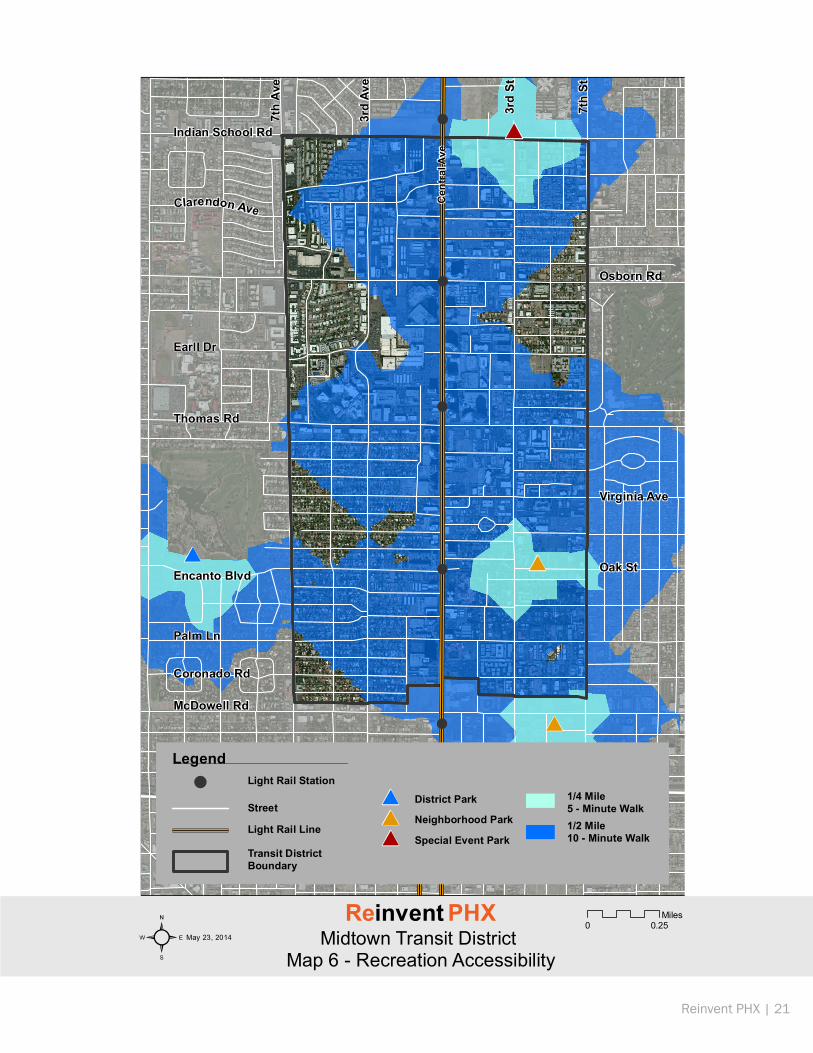
Map 6 Recreation Accessibility 21
Map 7 Community-Identified Liabilities 24
Map 8 Pedestrian and Cyclist Injuries 26
Map 9 Community-Identified Pedestrian and Bicycle Corridors 28
Map 10 Community Street Audits 30
Map 11 Corner Store Assistance Program Opportunity Sites 43
Map 12 Temporary Food Retailer Opportunity Sites 45
Map 13 Supermarket or Corner Store Opportunity Sites 48
Map 14 New and Temporary Park Opportunity Sites 52
Map 15 Complete Streets Opportunity Sites 58
Map 16 Site-Specific Recommended Street Improvements 61

Assessment of Current Conditions in Midtown District
Reinvent PHX | 1
Health Assessment Report

Assessment of Current Conditions in Midtown District
This page was left blank intentionally
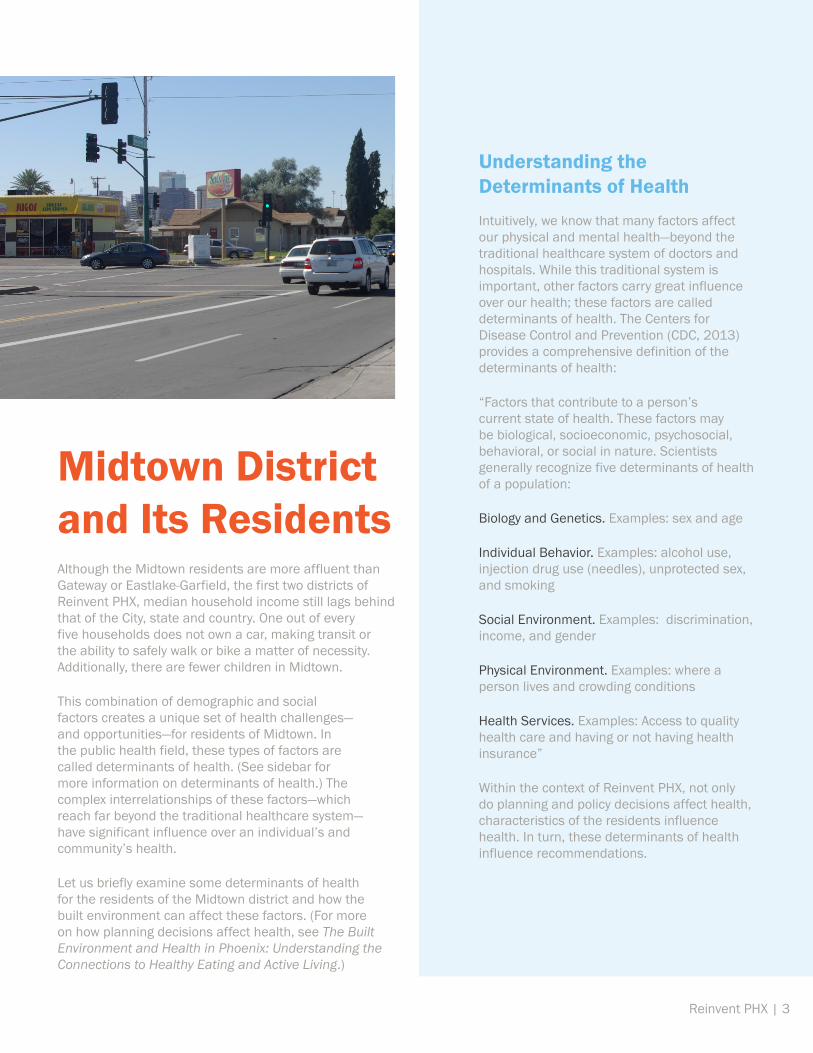
Understanding the Determinants of Health Intuitively, we know that many factors affect our physical and mental health—beyond the traditional healthcare system of doctors and hospitals. While this traditional system is important, other factors carry great influence over our health; these factors are called determinants of health. The Centers for Disease Control and Prevention (CDC, 2013) provides a comprehensive definition of the determinants of health:
“Factors that contribute to a person’s current state of health. These factors may be biological, socioeconomic, psychosocial, behavioral, or social in nature. Scientists generally recognize five determinants of health of a population:
Biology and Genetics. Examples: sex and age
Individual Behavior. Examples: alcohol use, injection drug use (needles), unprotected sex, and smoking
Social Environment. Examples: discrimination, income, and gender
Physical Environment. Examples: where a person lives and crowding conditions
Health Services. Examples: Access to quality health care and having or not having health insurance”
Within the context of Reinvent PHX, not only do planning and policy decisions affect health, characteristics of the residents influence health. In turn, these determinants of health influence recommendations.
Reinvent PHX | 3
Midtown District and Its ResidentsAlthough the Midtown residents are more affluent than Gateway or Eastlake-Garfield, the first two districts of Reinvent PHX, median household income still lags behind that of the City, state and country. One out of every five households does not own a car, making transit or the ability to safely walk or bike a matter of necessity. Additionally, there are fewer children in Midtown.
This combination of demographic and social factors creates a unique set of health challenges—and opportunities—for residents of Midtown. In the public health field, these types of factors are called determinants of health. (See sidebar for more information on determinants of health.) The complex interrelationships of these factors—which reach far beyond the traditional healthcare system—have significant influence over an individual’s and community’s health.
Let us briefly examine some determinants of health for the residents of the Midtown district and how the built environment can affect these factors. (For more on how planning decisions affect health, see The Built Environment and Health in Phoenix: Understanding the Connections to Healthy Eating and Active Living.)
£¢303
§̈¦I-10
£¢51
§̈¦I-17
£¢74
0 4Miles
Freeway
MidtownTransit District
² May 23, 2014
Midtown Transit District Map 1 - Midtown in the Context of the City of Phoenix
Reinvent PHX
Legend
£¢101
£¢202
£¢60
£¢60
City of PhoenixBoundary
Assessment of Current Conditions in Midtown District
14%
28%26%
24%
Midtown Phoenix Arizona U.S.
Perc
enta
ge o
f Chi
ldre
n
$31,791
$48,800 $50,200$52,762
Midtown Phoenix Arizona U.S.
Med
ian
Hous
ehol
d In
com
e
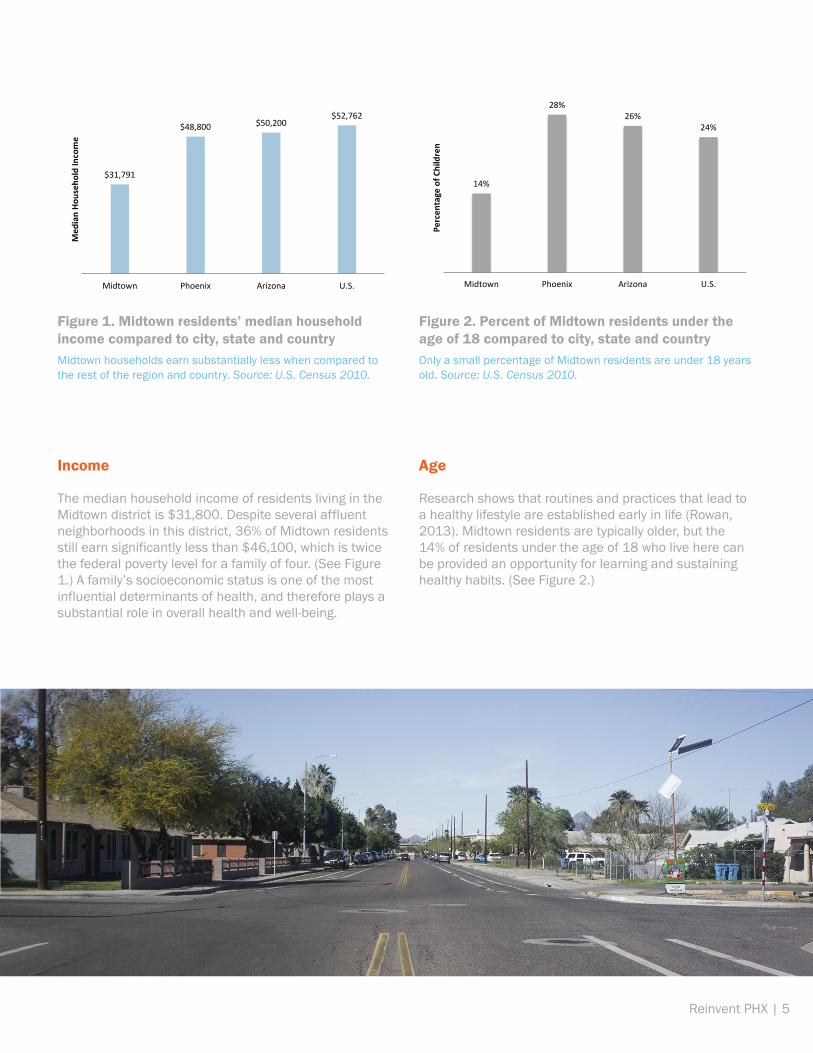
Figure 2. Percent of Midtown residents under the age of 18 compared to city, state and countryOnly a small percentage of Midtown residents are under 18 years old. Source: U.S. Census 2010.
Figure 1. Midtown residents’ median household income compared to city, state and country Midtown households earn substantially less when compared to the rest of the region and country. Source: U.S. Census 2010.
Reinvent PHX | 5
Income
The median household income of residents living in the Midtown district is $31,800. Despite several affluent neighborhoods in this district, 36% of Midtown residents still earn significantly less than $46,100, which is twice the federal poverty level for a family of four. (See Figure 1.) A family’s socioeconomic status is one of the most influential determinants of health, and therefore plays a substantial role in overall health and well-being.
Age
Research shows that routines and practices that lead to a healthy lifestyle are established early in life (Rowan, 2013). Midtown residents are typically older, but the 14% of residents under the age of 18 who live here can be provided an opportunity for learning and sustaining healthy habits. (See Figure 2.)
25%
14%
9%
6%
Midtown Phoenix Arizona U.S.
Perc
enta
ge o
f Hom
e Sp
ansi
h Sp
eake
rs
with
Lim
ited
Engl
ish
Prof
icie
ncy
21%
9%7%
9%
Midtown Phoenix Arizona U.S.
Perc
enta
ge o
f Hou
seho
lds w
ith N
o Ve
hicl
es
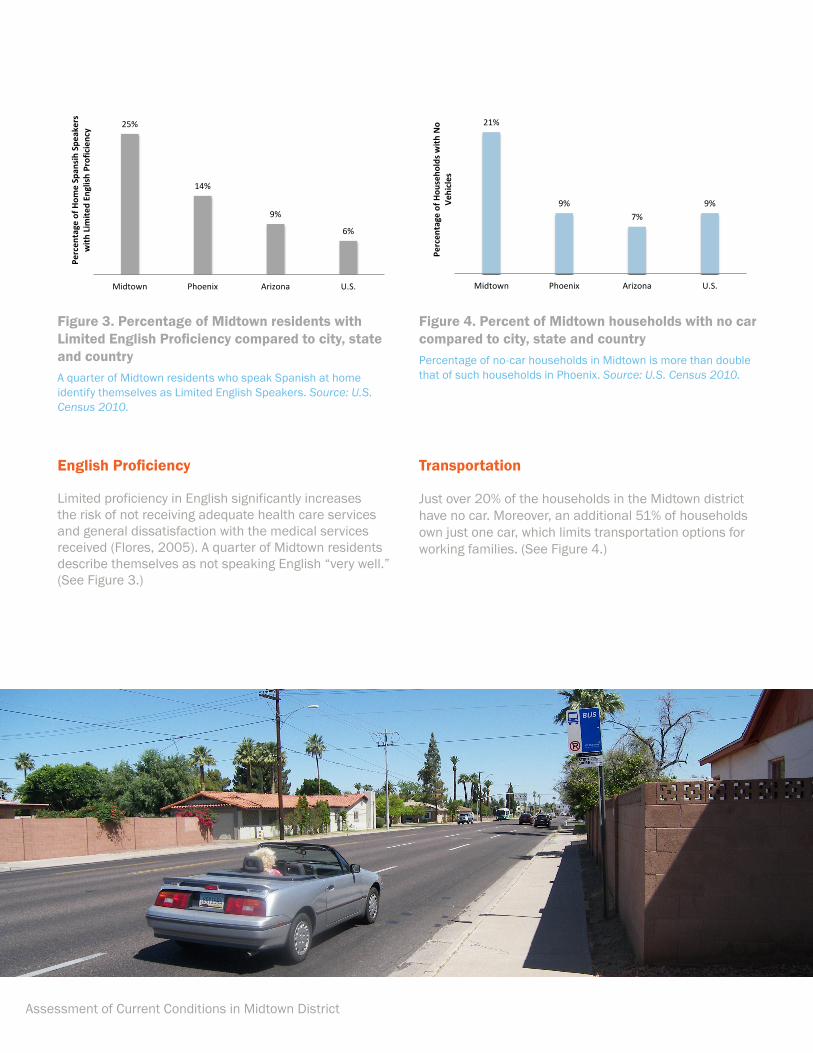
Figure 3. Percentage of Midtown residents with Limited English Proficiency compared to city, state and countryA quarter of Midtown residents who speak Spanish at home identify themselves as Limited English Speakers. Source: U.S. Census 2010.
Figure 4. Percent of Midtown households with no car compared to city, state and countryPercentage of no-car households in Midtown is more than double that of such households in Phoenix. Source: U.S. Census 2010.
Assessment of Current Conditions in Midtown District
English Proficiency
Limited proficiency in English significantly increases the risk of not receiving adequate health care services and general dissatisfaction with the medical services received (Flores, 2005). A quarter of Midtown residents describe themselves as not speaking English “very well.” (See Figure 3.)
Transportation
Just over 20% of the households in the Midtown district have no car. Moreover, an additional 51% of households own just one car, which limits transportation options for working families. (See Figure 4.)
Midtown Community Workshop To better understand issues related to healthy foods, active living, public transportation and neighborhood safety, St. Luke’s Health Initiatives hosted three community workshops with residents from Midtown. Fifty-eight residents attended these meetings. Forty of those attendees live in Fellowship Towers, which offers federally subsidized housing to older citizens. To accommodate the district’s diversity, two of the workshops were conducted and facilitated in both English and Spanish.
Residents participated in small group discussions. Using a large aerial map of the district and surrounding areas, residents used icons to identify healthy eating, active living and transportation assets and liabilities. Residents also developed recommendations. These ideas represent their needs and visions for the future within the framework of a realistic assessment of their community.
Information gathered from the workshops is referenced throughout this report. A full workshop report, including a description of methodology, is located in the appendix.
Reinvent PHX | 7
Housing and Transportation Costs
For most households, housing and transportation are the two largest budget items. From a public policy perspective, housing and transportation costs combined should consume no more than 45% of a family’s income (Center for Neighborhood Technology, n.d.). On average, a household in Midtown spends over 49% of its income on housing and transportation costs combined, with 27% going to housing costs and 22% to transportation (Center for Neighborhood Technology, 2012).
Existing Health Conditions
Between 2009 and 2011, Midtown residents had 2,058 hospitalizations due to cancer, diabetes, heart disease, stroke, asthma or some combination of these chronic diseases. Heart disease was the most frequently cited, with 82% of those hospitalized were, at least in part, due to this disease. According to the Centers for Disease Control and Prevention (CDC) (2009), Latinos are particularly at-risk for these conditions.
Currently, hospital charges are the only method allowing comparison of financial burdens related to hospital care; however, these charges not represent either costs of care or revenue received by the hospitals. Insurance companies pay based on negotiated contracts, Medicare and Medicaid pay according to a significantly reduced reimbursement rate, and hospitals typically have policies that allow low-income patients to received reduced charge or free care.
Indian School Rd
Osborn Rd
Thomas Rd
Earll Dr
Encanto Blvd
Palm Ln
Coronado Rd
McDowell Rd
Oak St
Virginia Ave
7th
Ave
3rd
Ave
Cen
tral
Ave
7th
St
3rd
St
Clarendon Ave
0 0.25Miles
Light Rail Station
Light Rail Line
Street
Transit District Boundary
!
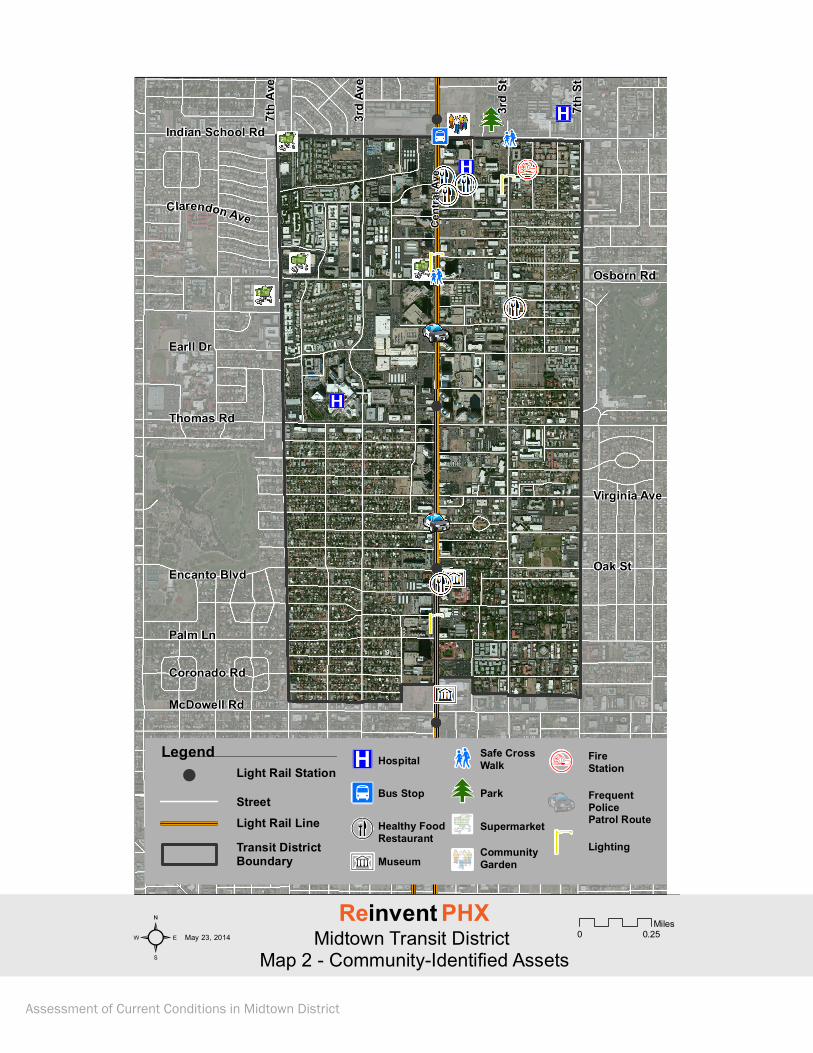
² May 23, 2014 Midtown Transit District Map 2 - Community-Identified Assets
Reinvent PHX
Legend
Bus Stop
Community Garden
Fire Station
Healthy FoodRestaurant
Supermarket
Safe Cross Walk
Frequent Police Patrol Route
Park
J MuseumLighting
Hospital
UU
®v m2
ú
V
Assessment of Current Conditions in Midtown District
Reinvent PHX | 9
Asset Description Health Determinant Affected by Asset
Light Rail Workshop participants singled out light rail as an asset for its ease of travel and role in transforming Central Avenue. The street is now perceived to be safe and clean with ample lighting and an appropriate level of police presence.
Individual Behavior; Physical Environment
Supermarkets Most participants identified access to Safeway and Bashas’ (both located at 7th Avenue and Osborn Road) as assets. People also shopped for groceries at Fresh & Easy Neighborhood Market (7th Avenue and Indian School Road), Walgreens (Central Avenue and Osborn Road) and CVS (7th Street and Indian School Road).
Individual Behavior; Physical Environment
Steele Indian School Park (outside of Midtown district)
Residents valued this park, which borders Midtown at the northeast corner of Central Avenue and Indian School Road, as a place to walk, attend events and watch parades.
Individual Behavior; Physical Environment
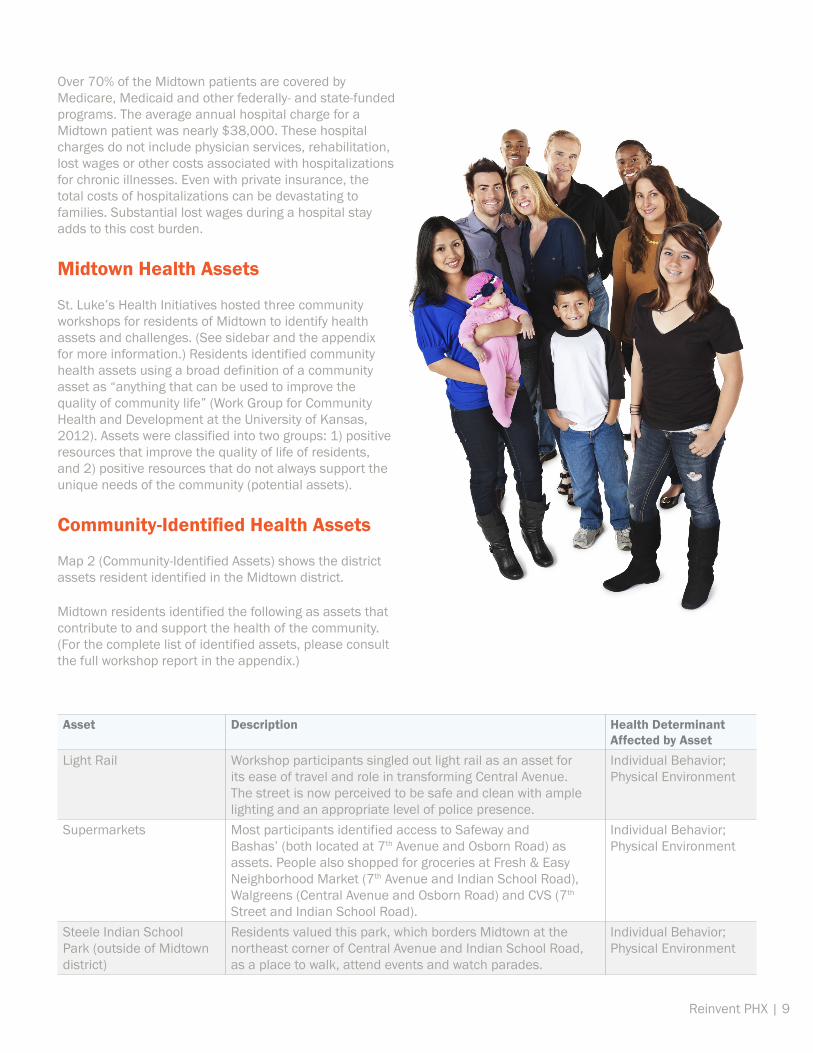
Over 70% of the Midtown patients are covered by Medicare, Medicaid and other federally- and state-funded programs. The average annual hospital charge for a Midtown patient was nearly $38,000. These hospital charges do not include physician services, rehabilitation, lost wages or other costs associated with hospitalizations for chronic illnesses. Even with private insurance, the total costs of hospitalizations can be devastating to families. Substantial lost wages during a hospital stay adds to this cost burden.
Midtown Health Assets
St. Luke’s Health Initiatives hosted three community workshops for residents of Midtown to identify health assets and challenges. (See sidebar and the appendix for more information.) Residents identified community health assets using a broad definition of a community asset as “anything that can be used to improve the quality of community life” (Work Group for Community Health and Development at the University of Kansas, 2012). Assets were classified into two groups: 1) positive resources that improve the quality of life of residents, and 2) positive resources that do not always support the unique needs of the community (potential assets).
Community-Identified Health Assets
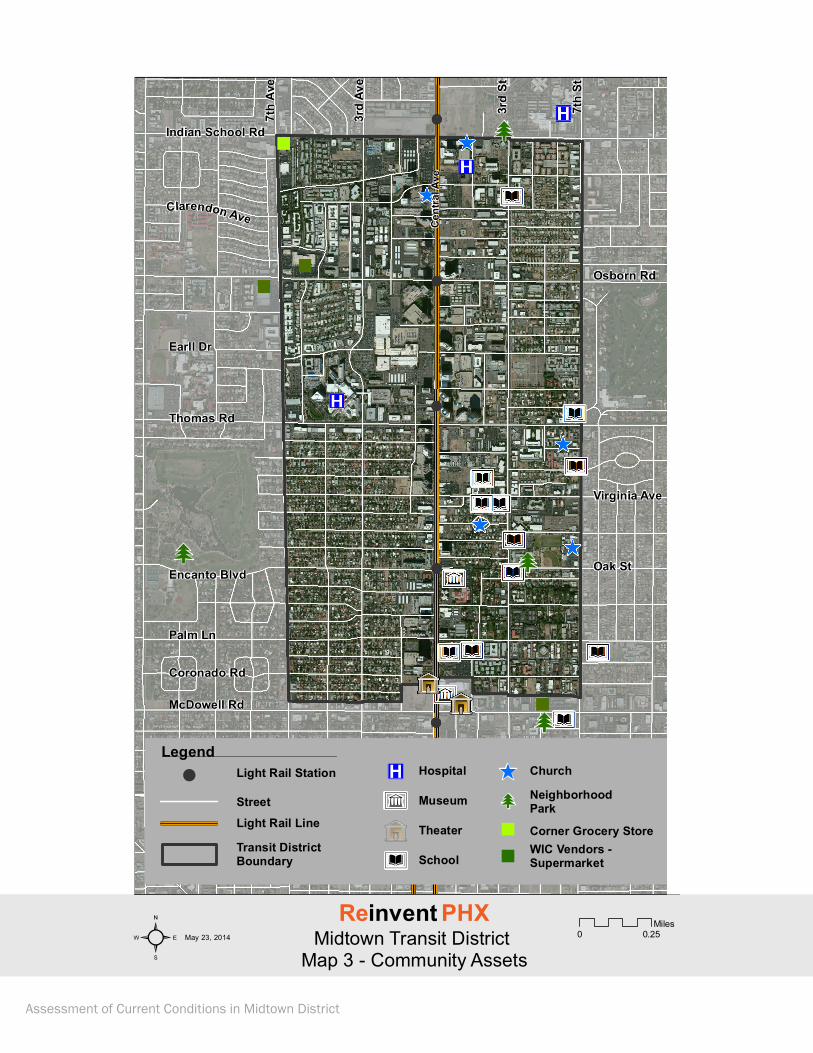
Map 2 (Community-Identified Assets) shows the district assets resident identified in the Midtown district.
Midtown residents identified the following as assets that contribute to and support the health of the community. (For the complete list of identified assets, please consult the full workshop report in the appendix.)
2
2
2
2
2Indian School Rd
Osborn Rd
Thomas Rd
Earll Dr
Encanto Blvd
Palm Ln
Coronado Rd
McDowell Rd
Oak St
Virginia Ave
7th
Ave
3rd
Ave
Cen
tral
Ave
7th
St
3rd
St
Clarendon Ave
0 0.25Miles
Light Rail Station
Light Rail Line
Street
Transit District Boundary
!
² May 23, 2014 Midtown Transit District Map 3 - Community Assets
Reinvent PHX
LegendChurch
Museum
School
Hospital
A
Neighborhood Park
Theater
^®v
J 2Corner Grocery StoreWIC Vendors -Supermarket
"
"
Assessment of Current Conditions in Midtown District
Key Issues about Midtown and Its Residents• Although Midtown is a more affluent community, many residents face issues that can be a challenge to staying
healthy. These issues include: lower incomes, age, language acquisition, existing health conditions, poor diet and low rate of car ownership.
• A number of assets that contribute to the health of residents include Steele Indian School Park, Grand Canal (located outside the Midtown district) public transportation, traffic calming, supermarkets, community centers and schools.
• Residents suggested improvement to several would-be assets; these latent assets include Grand Canal, new speed bumps, new supermarket(s), and access to school grounds after hours.
Reinvent PHX | 11
Other Community Assets
The Reinvent PHX health team identified several other assets that support the health of the community, including St. Joseph’s Hospital and Medical Center (7th Avenue and Thomas Road) and Phoenix Fire Station 9 (7th Street and Indian School Road). (See Map 3 Community Assets.)
Community-Identified Potential Health Assets
Residents identified the following resources as potential health assets, because they do not always support the needs of the Midtown district. While these resources have potential, their current form or location does not meet resident needs or expectations.
Potential Asset Description Health Determinant that Can Be Affected by This Asset
Transit Stops Adding public bathrooms, drinking fountains, misters and additional benches and recycling/garbage bins at light rail stations and bus stops would improve these common gathering places. Residents also requested that charging stations be reinstalled at light rail stations.ii Several participants stated that buses stop too far from the curb, making boarding difficult for people using walkers.
Individual Behavior; Physical Environment
Traffic Calming People appreciated residential speed bumps that slowed traffic, and advocated their installation on 3rd Street and Indianola Avenue.
Physical Environment

Assessment of Current Conditions in Midtown District
This page was left blank intentionally
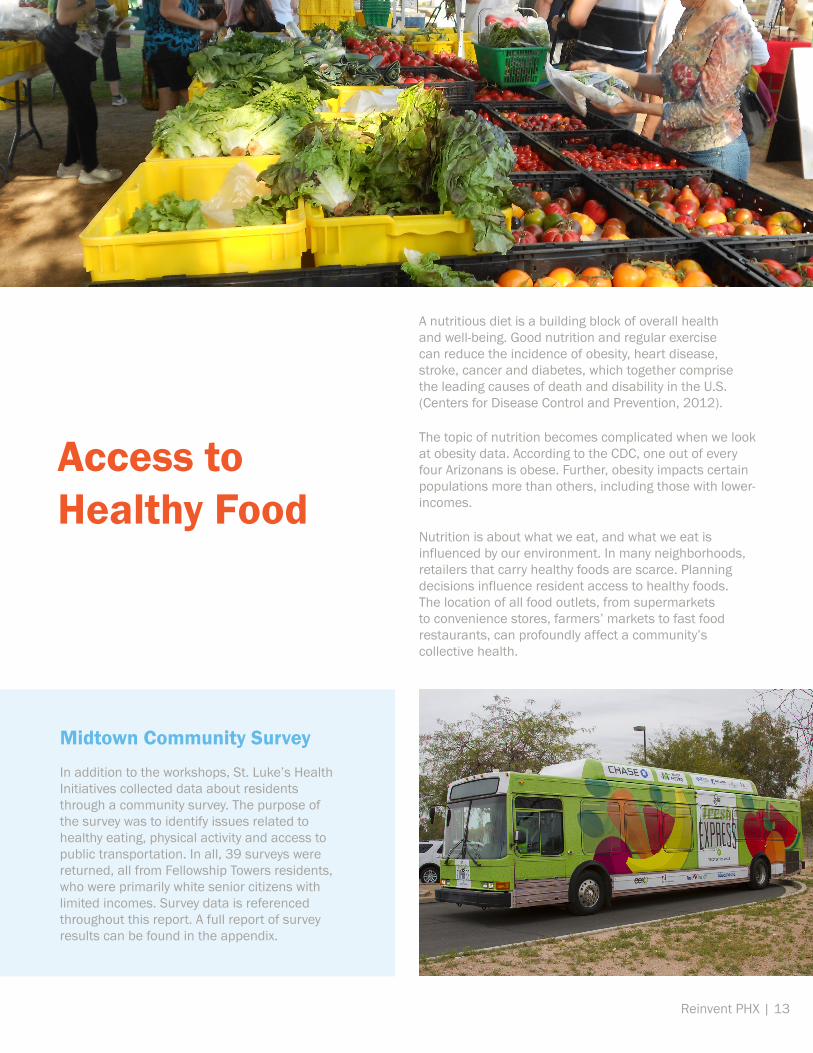
Midtown Community Survey In addition to the workshops, St. Luke’s Health Initiatives collected data about residents through a community survey. The purpose of the survey was to identify issues related to healthy eating, physical activity and access to public transportation. In all, 39 surveys were returned, all from Fellowship Towers residents, who were primarily white senior citizens with limited incomes. Survey data is referenced throughout this report. A full report of survey results can be found in the appendix.
Reinvent PHX | 13
Access to Healthy Food
A nutritious diet is a building block of overall health and well-being. Good nutrition and regular exercise can reduce the incidence of obesity, heart disease, stroke, cancer and diabetes, which together comprise the leading causes of death and disability in the U.S. (Centers for Disease Control and Prevention, 2012).
The topic of nutrition becomes complicated when we look at obesity data. According to the CDC, one out of every four Arizonans is obese. Further, obesity impacts certain populations more than others, including those with lower-incomes.
Nutrition is about what we eat, and what we eat is influenced by our environment. In many neighborhoods, retailers that carry healthy foods are scarce. Planning decisions influence resident access to healthy foods. The location of all food outlets, from supermarkets to convenience stores, farmers’ markets to fast food restaurants, can profoundly affect a community’s collective health.
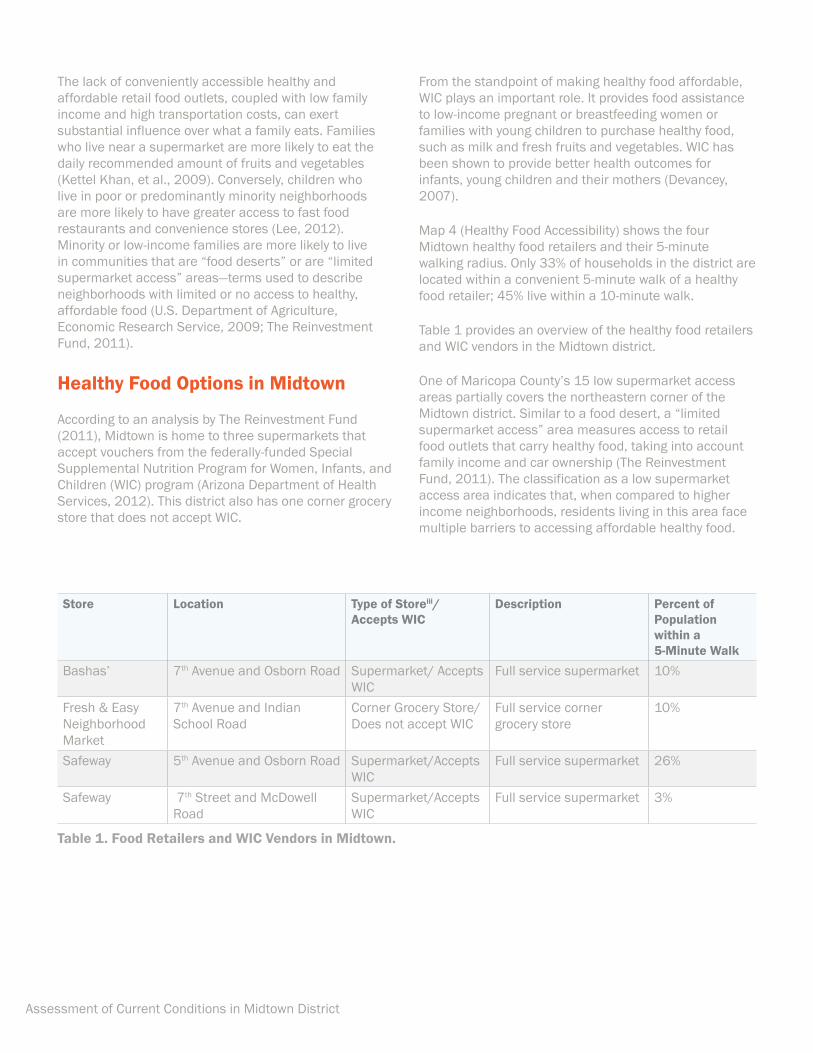
Table 1. Food Retailers and WIC Vendors in Midtown.
Assessment of Current Conditions in Midtown District
The lack of conveniently accessible healthy and affordable retail food outlets, coupled with low family income and high transportation costs, can exert substantial influence over what a family eats. Families who live near a supermarket are more likely to eat the daily recommended amount of fruits and vegetables (Kettel Khan, et al., 2009). Conversely, children who live in poor or predominantly minority neighborhoods are more likely to have greater access to fast food restaurants and convenience stores (Lee, 2012). Minority or low-income families are more likely to live in communities that are “food deserts” or are “limited supermarket access” areas—terms used to describe neighborhoods with limited or no access to healthy, affordable food (U.S. Department of Agriculture, Economic Research Service, 2009; The Reinvestment Fund, 2011).
Healthy Food Options in Midtown
According to an analysis by The Reinvestment Fund (2011), Midtown is home to three supermarkets that accept vouchers from the federally-funded Special Supplemental Nutrition Program for Women, Infants, and Children (WIC) program (Arizona Department of Health Services, 2012). This district also has one corner grocery store that does not accept WIC.
From the standpoint of making healthy food affordable, WIC plays an important role. It provides food assistance to low-income pregnant or breastfeeding women or families with young children to purchase healthy food, such as milk and fresh fruits and vegetables. WIC has been shown to provide better health outcomes for infants, young children and their mothers (Devancey, 2007).
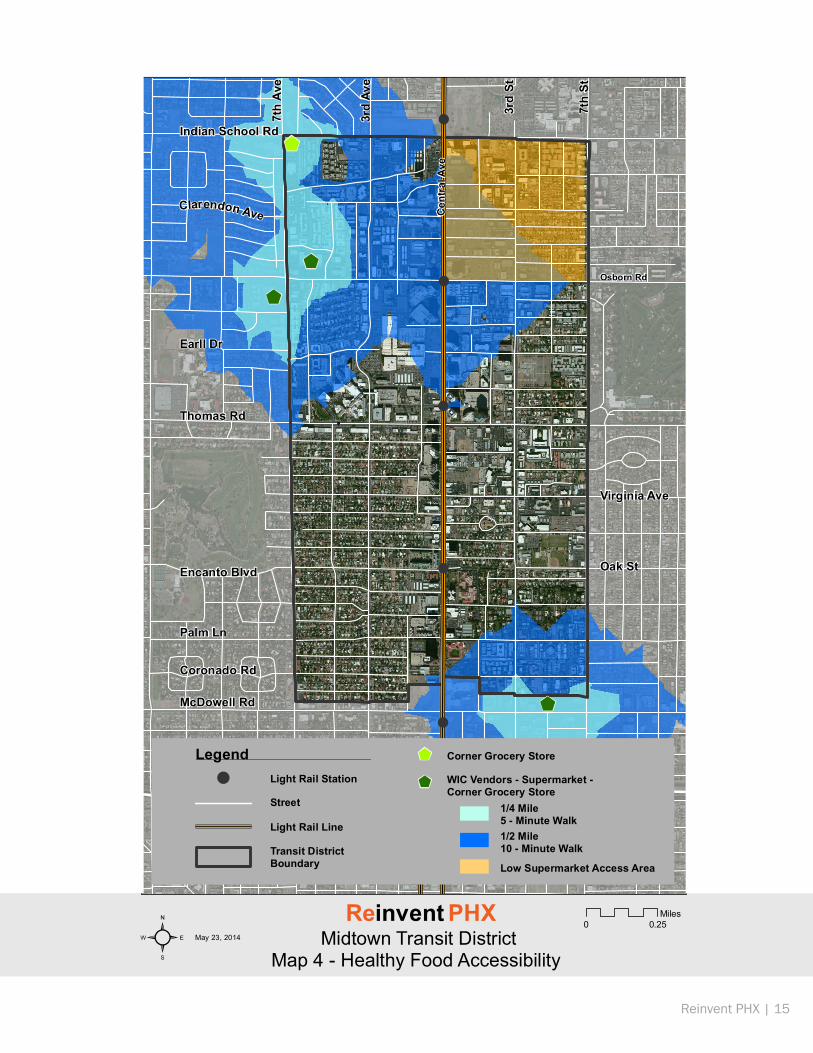
Map 4 (Healthy Food Accessibility) shows the four Midtown healthy food retailers and their 5-minute walking radius. Only 33% of households in the district are located within a convenient 5-minute walk of a healthy food retailer; 45% live within a 10-minute walk.
Table 1 provides an overview of the healthy food retailers and WIC vendors in the Midtown district.
One of Maricopa County’s 15 low supermarket access areas partially covers the northeastern corner of the Midtown district. Similar to a food desert, a “limited supermarket access” area measures access to retail food outlets that carry healthy food, taking into account family income and car ownership (The Reinvestment Fund, 2011). The classification as a low supermarket access area indicates that, when compared to higher income neighborhoods, residents living in this area face multiple barriers to accessing affordable healthy food.
Store Location Type of Storeiii/Accepts WIC
Description Percent of Population within a 5-Minute Walk
Bashas’ 7th Avenue and Osborn Road Supermarket/ Accepts WIC
Full service supermarket 10%
Fresh & Easy Neighborhood Market
7th Avenue and Indian School Road
Corner Grocery Store/Does not accept WIC
Full service corner grocery store
10%
Safeway 5th Avenue and Osborn Road Supermarket/Accepts WIC
Full service supermarket 26%
Safeway 7th Street and McDowell Road
Supermarket/Accepts WIC
Full service supermarket 3%
!
!
!
!
!
!
$
$
$
$Indian School Rd
Osborn Rd
Thomas Rd
Earll Dr
Encanto Blvd
Palm Ln
Coronado Rd
McDowell Rd
Oak St
Virginia Ave
7th
Ave
3rd
Ave
Cen
tral
Ave
7th
St
3rd
St
Clarendon Ave
Light Rail Station
Light Rail Line
Street
Transit District Boundary
!
² May 23, 2014 Midtown Transit District Map 4 - Healthy Food Accessibility
Reinvent PHX
Legend Corner Grocery Store
WIC Vendors - Supermarket - Corner Grocery Store
1/2 Mile 10 - Minute Walk
$
$
0 0.25Miles
1/4 Mile 5 - Minute Walk
Low Supermarket Access Area
Reinvent PHX | 15
Assessment of Current Conditions in Midtown District
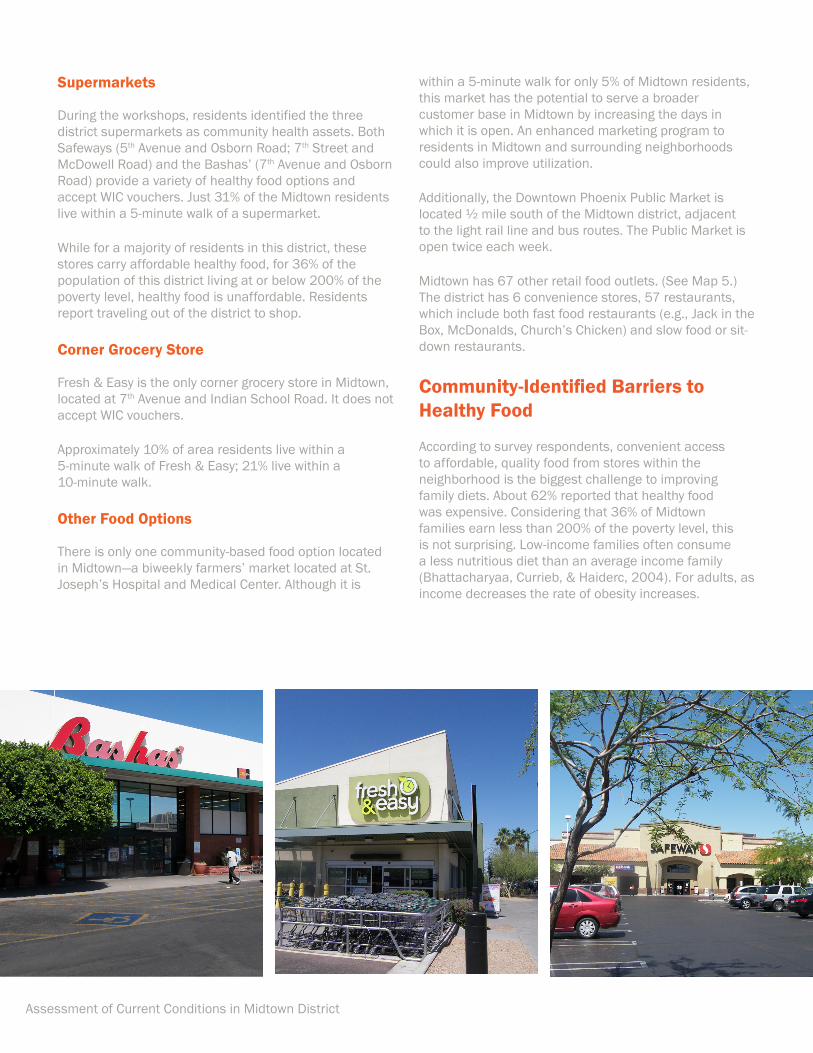
Supermarkets
During the workshops, residents identified the three district supermarkets as community health assets. Both Safeways (5th Avenue and Osborn Road; 7th Street and McDowell Road) and the Bashas’ (7th Avenue and Osborn Road) provide a variety of healthy food options and accept WIC vouchers. Just 31% of the Midtown residents live within a 5-minute walk of a supermarket.
While for a majority of residents in this district, these stores carry affordable healthy food, for 36% of the population of this district living at or below 200% of the poverty level, healthy food is unaffordable. Residents report traveling out of the district to shop.
Corner Grocery Store
Fresh & Easy is the only corner grocery store in Midtown, located at 7th Avenue and Indian School Road. It does not accept WIC vouchers.
Approximately 10% of area residents live within a 5-minute walk of Fresh & Easy; 21% live within a 10-minute walk.
Other Food Options
There is only one community-based food option located in Midtown—a biweekly farmers’ market located at St. Joseph’s Hospital and Medical Center. Although it is
within a 5-minute walk for only 5% of Midtown residents, this market has the potential to serve a broader customer base in Midtown by increasing the days in which it is open. An enhanced marketing program to residents in Midtown and surrounding neighborhoods could also improve utilization.
Additionally, the Downtown Phoenix Public Market is located ½ mile south of the Midtown district, adjacent to the light rail line and bus routes. The Public Market is open twice each week.
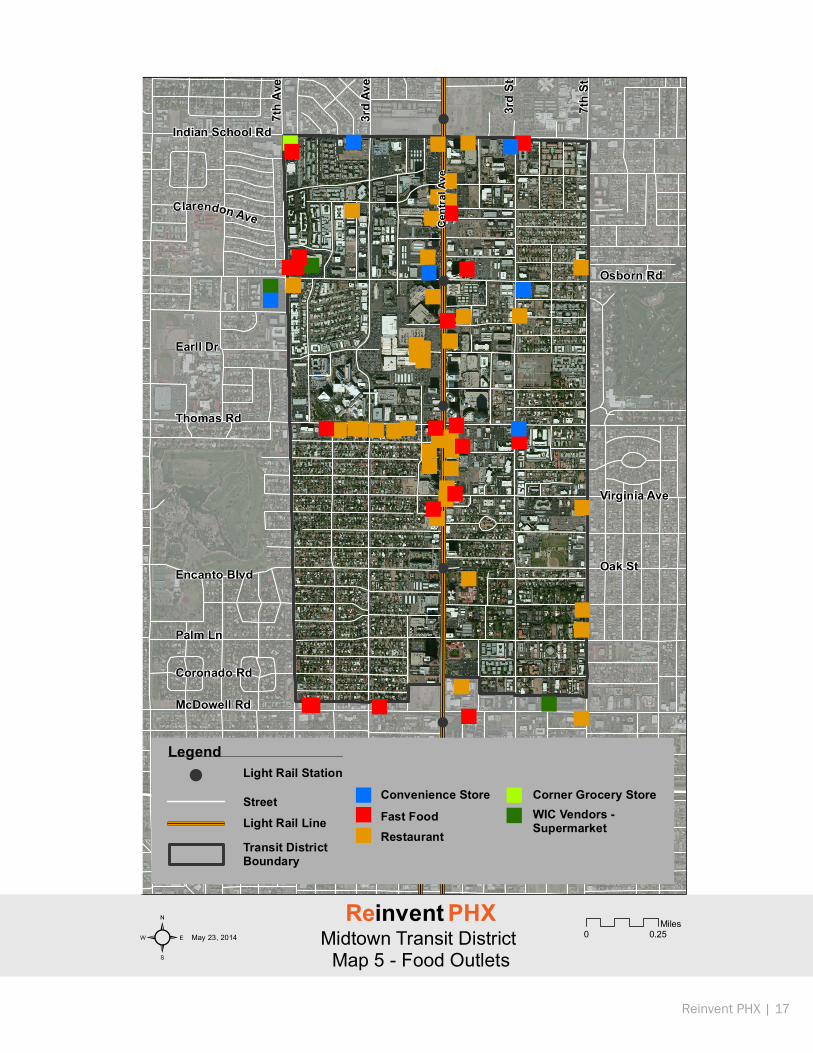
Midtown has 67 other retail food outlets. (See Map 5.) The district has 6 convenience stores, 57 restaurants, which include both fast food restaurants (e.g., Jack in the Box, McDonalds, Church’s Chicken) and slow food or sit-down restaurants.
Community-Identified Barriers to Healthy Food
According to survey respondents, convenient access to affordable, quality food from stores within the neighborhood is the biggest challenge to improving family diets. About 62% reported that healthy food was expensive. Considering that 36% of Midtown families earn less than 200% of the poverty level, this is not surprising. Low-income families often consume a less nutritious diet than an average income family (Bhattacharyaa, Currieb, & Haiderc, 2004). For adults, as income decreases the rate of obesity increases.
!
!
!
!
!
!
""
"
"
"
"
"
"
""
"
"""""
"""""
""" ""
"
""""
"
""
""
"
""
"""
"
""
"
""""
""
"" "
""
"
""""
"
"" ""
"
"
Indian School Rd
Osborn Rd
Thomas Rd
Earll Dr
Encanto Blvd
Palm Ln
Coronado Rd
McDowell Rd
Oak St
Virginia Ave
7th
Ave
3rd
Ave
Cen
tral
Ave
7th
St
3rd
St
Clarendon Ave
0 0.25Miles
Light Rail Station
Light Rail Line
Street
Transit District Boundary
!
² May 23, 2014 Midtown Transit District Map 5 - Food Outlets
Reinvent PHX
Legend
Convenience Store
Fast FoodRestaurant
Corner Grocery StoreWIC Vendors -Supermarket
"""
""
Reinvent PHX | 17
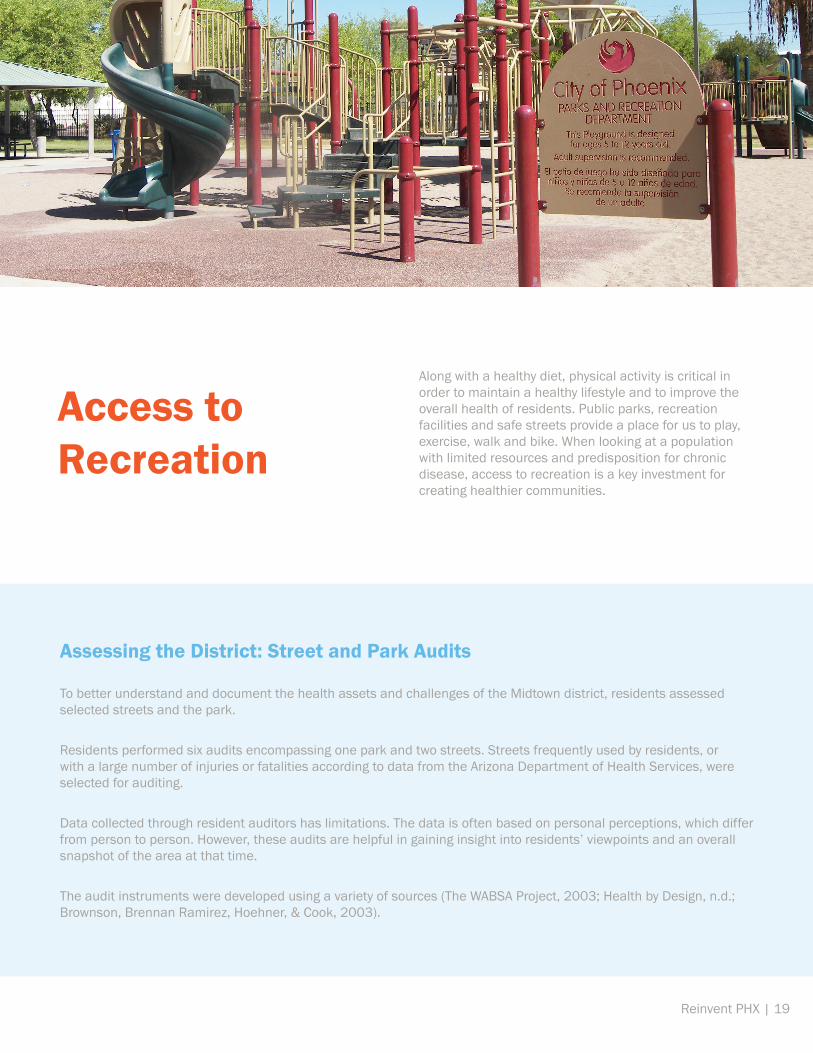
Assessing the District: Street and Park Audits
To better understand and document the health assets and challenges of the Midtown district, residents assessed selected streets and the park.
Residents performed six audits encompassing one park and two streets. Streets frequently used by residents, or with a large number of injuries or fatalities according to data from the Arizona Department of Health Services, were selected for auditing.
Data collected through resident auditors has limitations. The data is often based on personal perceptions, which differ from person to person. However, these audits are helpful in gaining insight into residents’ viewpoints and an overall snapshot of the area at that time.
The audit instruments were developed using a variety of sources (The WABSA Project, 2003; Health by Design, n.d.; Brownson, Brennan Ramirez, Hoehner, & Cook, 2003).
Key Issues about Healthy Food in Midtown• The district has three WIC vendors with
31% of district residents living within a 5-minute walk of these retailers. An additional corner grocery store carrying a sizeable selection of healthy foods is located in Midtown, but does not access WIC.
• The northeast quadrant of Midtown is considered a low supermarket access area.
• There is only one community-based healthy food option—a biweekly farmers’ market.
Assessment of Current Conditions in Midtown District
Distance to an affordable supermarket is also a concern. Almost 50% of the residents mentioned that the lack of supermarkets in close proximity dramatically limits their capacity to access quality fresh food. Research supports that distance to a supermarket affects healthy food consumption (Leadership for Healthy Communities, 2012).
Sixty percent of survey respondents reported doing their grocery shopping by car. Eighty percent reported doing all or some of their grocery shopping at supermarkets. Only 15% of respondents reported doing some of their grocery shopping at small venues, such as street vendors, fruit and vegetable stores or ethnic markets.
Assessing the District: Street and Park Audits
To better understand and document the health assets and challenges of the Midtown district, residents assessed selected streets and the park.
Residents performed six audits encompassing one park and two streets. Streets frequently used by residents, or with a large number of injuries or fatalities according to data from the Arizona Department of Health Services, were selected for auditing.
Data collected through resident auditors has limitations. The data is often based on personal perceptions, which differ from person to person. However, these audits are helpful in gaining insight into residents’ viewpoints and an overall snapshot of the area at that time.
The audit instruments were developed using a variety of sources (The WABSA Project, 2003; Health by Design, n.d.; Brownson, Brennan Ramirez, Hoehner, & Cook, 2003).
Reinvent PHX | 19
Access to Recreation
Along with a healthy diet, physical activity is critical in order to maintain a healthy lifestyle and to improve the overall health of residents. Public parks, recreation facilities and safe streets provide a place for us to play, exercise, walk and bike. When looking at a population with limited resources and predisposition for chronic disease, access to recreation is a key investment for creating healthier communities.
Land Used for Parks
Park Acres per Person
Midtown District
0.68% 0.00103
City of Phoenix 1.35% 0.00315
Park Acres Percent of Residents within a 5-Minute Walk
Monterey Park 8.78 7%
Table 3. Snapshot of Midtown parks.
Table 2. Amount of parkland acreage per Midtown resident. Midtown residents have about half the parkland acres per person than City residents as a whole.
Assessment of Current Conditions in Midtown District
Parks play an important role in promoting health. People who live closer to a park exercise more (Babey, Brown, & Hastert, 2005; Cohen, McKenzie, & al, 2007). Parks provide a place to be physically active, which can help decrease obesity and related chronic conditions. Residents who do not have access to parks often go without exercise. This is particularly true for low-income families who may be unable to afford other exercise options, such as a gym membership (The Trust for Public Lands, 2006).
Safety is a critical consideration in the usage of parks (Babey, Brown, & Hastert, 2005). Parents who believe their neighborhood is unsafe are less likely to encourage their children to walk to schools and parks or to play outdoors (Miles, 2008). This extends to communities that have a higher degree of “physical disorder” or blight, such as litter, graffiti and lack of residential maintenance. Not surprisingly, parents will keep children indoors rather than risk their personal safety.
Reluctance to visit parks, in the face of perceived safety threats, extends to adults as well. Individuals who perceive a park to be safe are six to seven times more likely to be frequent users of that park, and adults are up to 13 times more likely to use such a park specifically for exercise (Wood, et al., 2012). Without adults modeling regular exercise, children are unlikely to develop lifelong healthy habits (Surgeon General, 2012). Going outside to bike or walk to the neighborhood park is an unfamiliar routine for children and adults who lack a safe setting to do so.
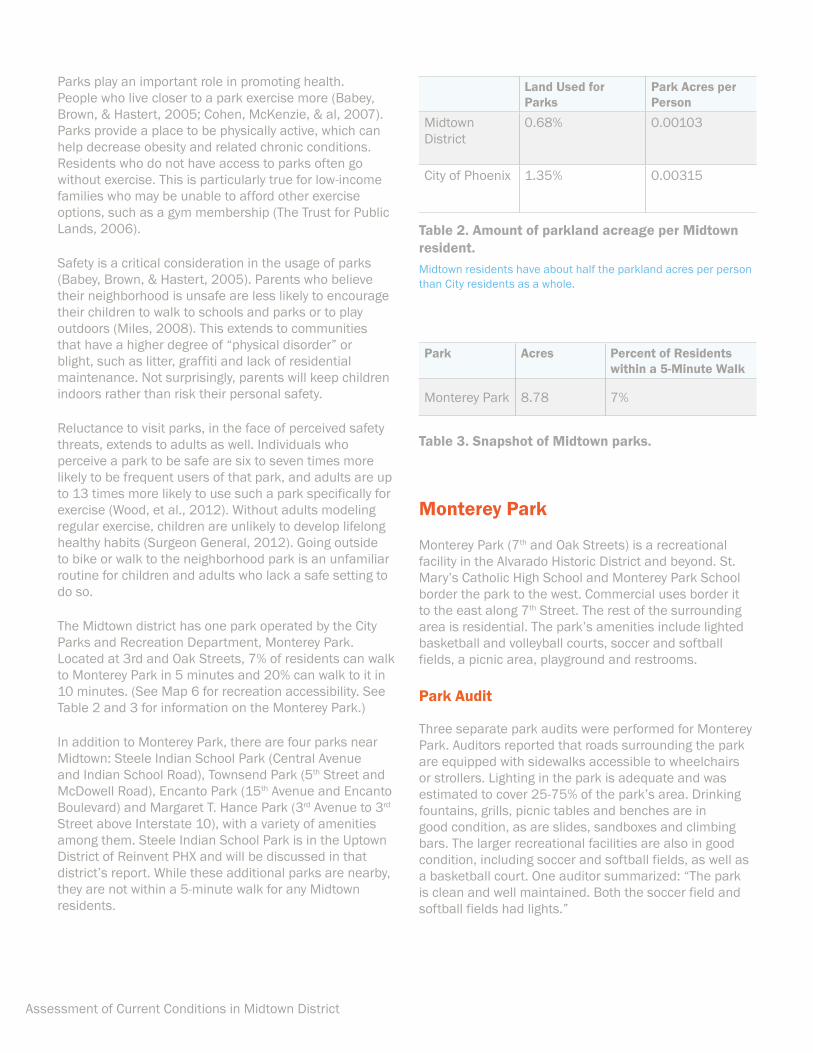
The Midtown district has one park operated by the City Parks and Recreation Department, Monterey Park. Located at 3rd and Oak Streets, 7% of residents can walk to Monterey Park in 5 minutes and 20% can walk to it in 10 minutes. (See Map 6 for recreation accessibility. See Table 2 and 3 for information on the Monterey Park.)
In addition to Monterey Park, there are four parks near Midtown: Steele Indian School Park (Central Avenue and Indian School Road), Townsend Park (5th Street and McDowell Road), Encanto Park (15th Avenue and Encanto Boulevard) and Margaret T. Hance Park (3rd Avenue to 3rd Street above Interstate 10), with a variety of amenities among them. Steele Indian School Park is in the Uptown District of Reinvent PHX and will be discussed in that district’s report. While these additional parks are nearby, they are not within a 5-minute walk for any Midtown residents.
Monterey Park
Monterey Park (7th and Oak Streets) is a recreational facility in the Alvarado Historic District and beyond. St. Mary’s Catholic High School and Monterey Park School border the park to the west. Commercial uses border it to the east along 7th Street. The rest of the surrounding area is residential. The park’s amenities include lighted basketball and volleyball courts, soccer and softball fields, a picnic area, playground and restrooms.
Park Audit
Three separate park audits were performed for Monterey Park. Auditors reported that roads surrounding the park are equipped with sidewalks accessible to wheelchairs or strollers. Lighting in the park is adequate and was estimated to cover 25-75% of the park’s area. Drinking fountains, grills, picnic tables and benches are in good condition, as are slides, sandboxes and climbing bars. The larger recreational facilities are also in good condition, including soccer and softball fields, as well as a basketball court. One auditor summarized: “The park is clean and well maintained. Both the soccer field and softball fields had lights.”
!
!
!
!
!
!
#
#
#
#
#Indian School Rd
Osborn Rd
Thomas Rd
Earll Dr
Encanto Blvd
Palm Ln
Coronado Rd
McDowell Rd
Oak St
Virginia Ave
7th
Ave
3rd
Ave
Cen
tral
Ave
7th
St
3rd
St
Clarendon Ave
Light Rail Station
Light Rail Line
Street
Transit District Boundary
!
² May 23, 2014 Midtown Transit District Map 6 - Recreation Accessibility
Reinvent PHX
Legend
1/2 Mile 10 - Minute Walk
# District Park
Neighborhood Park
Special Event Park#
0 0.25Miles
#1/4 Mile 5 - Minute Walk
Reinvent PHX | 21
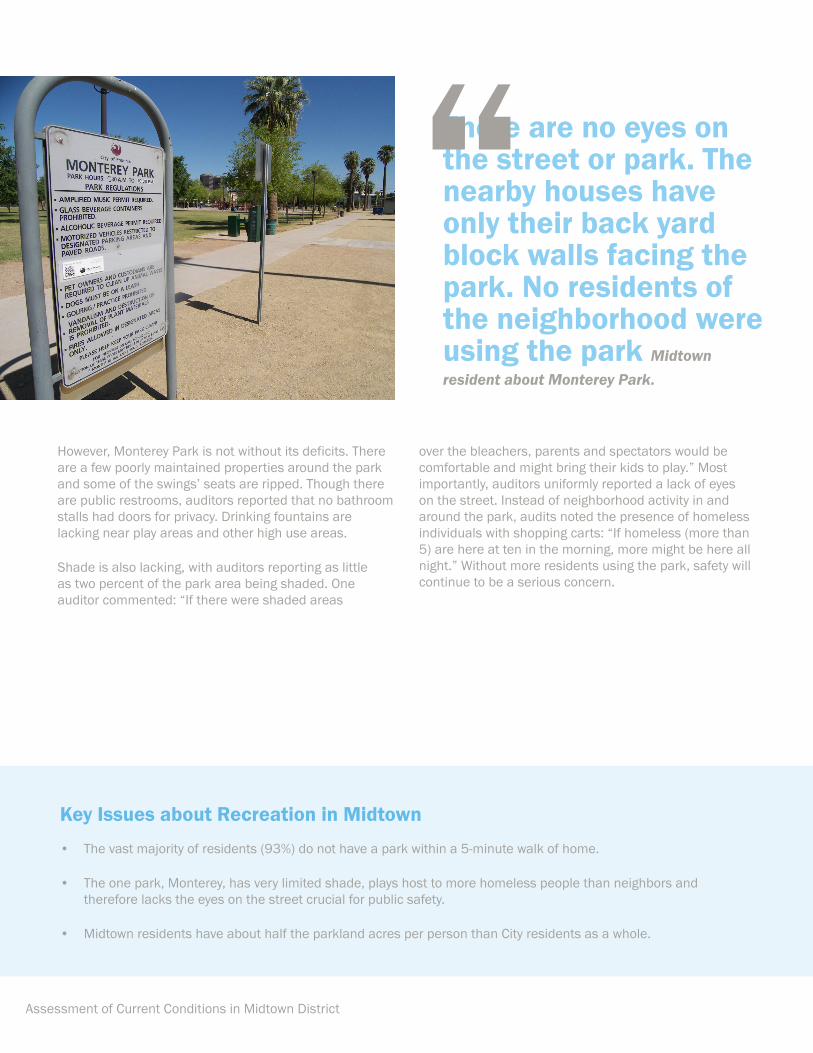
There are no eyes on the street or park. The nearby houses have only their back yard block walls facing the park. No residents of the neighborhood were using the park Midtown resident about Monterey Park.
“
Key Issues about Recreation in Midtown• The vast majority of residents (93%) do not have a park within a 5-minute walk of home.
• The one park, Monterey, has very limited shade, plays host to more homeless people than neighbors and therefore lacks the eyes on the street crucial for public safety.
• Midtown residents have about half the parkland acres per person than City residents as a whole.
Assessment of Current Conditions in Midtown District
However, Monterey Park is not without its deficits. There are a few poorly maintained properties around the park and some of the swings’ seats are ripped. Though there are public restrooms, auditors reported that no bathroom stalls had doors for privacy. Drinking fountains are lacking near play areas and other high use areas.
Shade is also lacking, with auditors reporting as little as two percent of the park area being shaded. One auditor commented: “If there were shaded areas
over the bleachers, parents and spectators would be comfortable and might bring their kids to play.” Most importantly, auditors uniformly reported a lack of eyes on the street. Instead of neighborhood activity in and around the park, audits noted the presence of homeless individuals with shopping carts: “If homeless (more than 5) are here at ten in the morning, more might be here all night.” Without more residents using the park, safety will continue to be a serious concern.
Reinvent PHX | 23
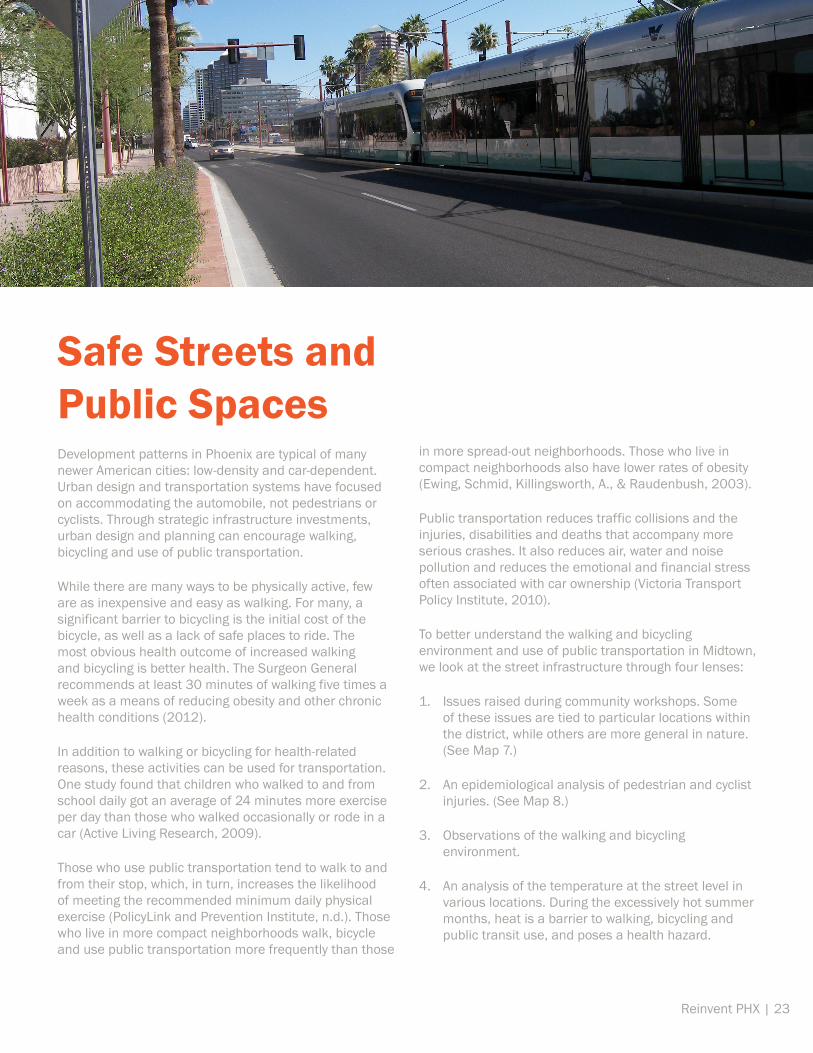
Safe Streets and Public SpacesDevelopment patterns in Phoenix are typical of many newer American cities: low-density and car-dependent. Urban design and transportation systems have focused on accommodating the automobile, not pedestrians or cyclists. Through strategic infrastructure investments, urban design and planning can encourage walking, bicycling and use of public transportation.
While there are many ways to be physically active, few are as inexpensive and easy as walking. For many, a significant barrier to bicycling is the initial cost of the bicycle, as well as a lack of safe places to ride. The most obvious health outcome of increased walking and bicycling is better health. The Surgeon General recommends at least 30 minutes of walking five times a week as a means of reducing obesity and other chronic health conditions (2012).
In addition to walking or bicycling for health-related reasons, these activities can be used for transportation. One study found that children who walked to and from school daily got an average of 24 minutes more exercise per day than those who walked occasionally or rode in a car (Active Living Research, 2009).
Those who use public transportation tend to walk to and from their stop, which, in turn, increases the likelihood of meeting the recommended minimum daily physical exercise (PolicyLink and Prevention Institute, n.d.). Those who live in more compact neighborhoods walk, bicycle and use public transportation more frequently than those
in more spread-out neighborhoods. Those who live in compact neighborhoods also have lower rates of obesity (Ewing, Schmid, Killingsworth, A., & Raudenbush, 2003).
Public transportation reduces traffic collisions and the injuries, disabilities and deaths that accompany more serious crashes. It also reduces air, water and noise pollution and reduces the emotional and financial stress often associated with car ownership (Victoria Transport Policy Institute, 2010).
To better understand the walking and bicycling environment and use of public transportation in Midtown, we look at the street infrastructure through four lenses:
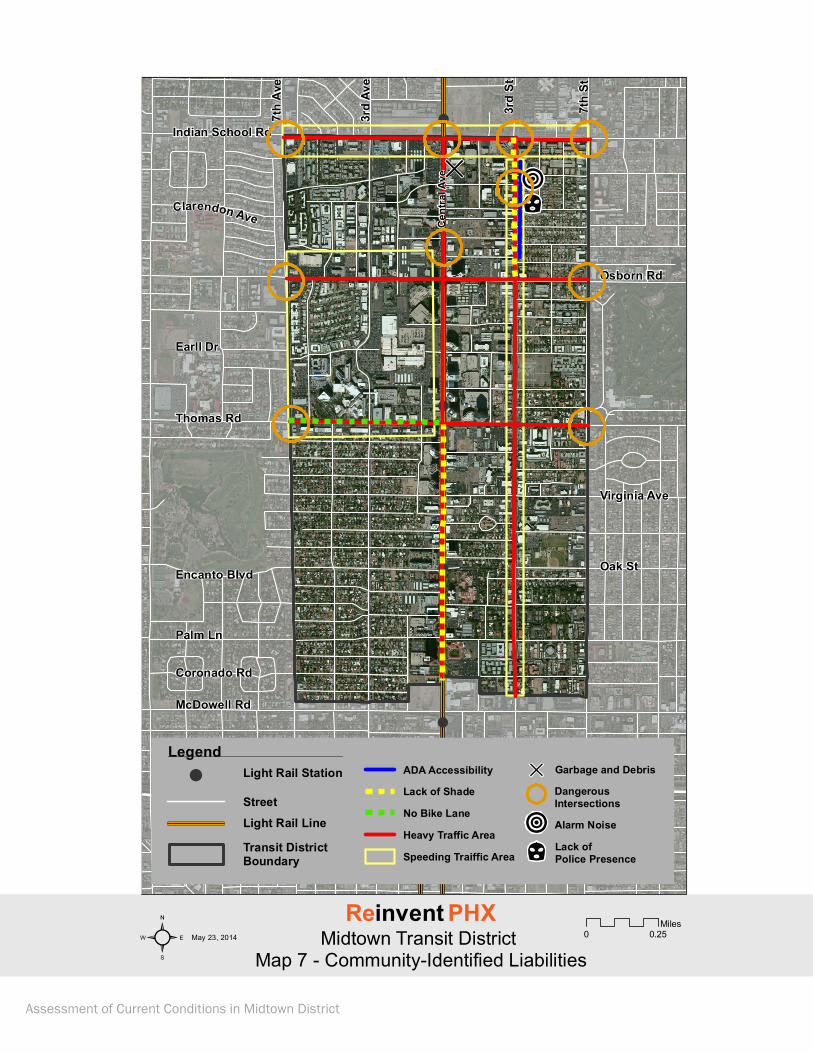
1. Issues raised during community workshops. Some of these issues are tied to particular locations within the district, while others are more general in nature. (See Map 7.)
2. An epidemiological analysis of pedestrian and cyclist injuries. (See Map 8.)
3. Observations of the walking and bicycling environment.
4. An analysis of the temperature at the street level in various locations. During the excessively hot summer months, heat is a barrier to walking, bicycling and public transit use, and poses a health hazard.
!
!
!
!
!
!
V%
Indian School Rd
Osborn Rd
Thomas Rd
Earll Dr
Encanto Blvd
Palm Ln
Coronado Rd
McDowell Rd
Oak St
Virginia Ave
7th
Ave
3rd
Ave
Cen
tral
Ave
7th
St
3rd
St
Clarendon Ave
0 0.25Miles
Light Rail Station
Light Rail Line
Street
Transit District Boundary
!
² May 23, 2014 Midtown Transit District Map 7 - Community-Identified Liabilities
Reinvent PHX
Legend
D
ADA Accessibility
Lack of Shade
Heavy Traffic Area
Speeding Traiffic Area
D Garbage and Debris
Alarm Noise
Lack of Police Presence
No Bike Lane V%
Dangerous Intersections
Assessment of Current Conditions in Midtown District
Reinvent PHX | 25
Community-Identified Street Concerns
Workshop participants walk to access bus and light rail stops, the park and for basic errands. While walking is a routine activity for residents, aspects of the current built and social environment limit walking altogether.
Workshop participants identified a number of issues that affect feeling safe and comfortable walking or taking public transportation in their neighborhood. (See Map 7 Community Identified Liabilities.)
Land Use
Certain land uses and commercial activities can be disruptive or socially uncomfortable for those who want to walk, bike or take transit. Liquor stores, vacant lots and abandoned buildings are types of land uses that affect how residents interact with health assets and how they go about their daily lives.
In particular, workshop participants voiced their concerns about homeless people at Central Avenue and Osborn Road and around Carl T. Hayden VA Medical Center (Indian School Road and 7th Street). Workshop participants also identified vacant lots and abandoned buildings throughout the district as significant problems creating a sense of danger that inhibits walkers. The community is eager to transform these vacant lots and ill-maintained buildings in ways that will meet the community’s essential needs and deter current uses.
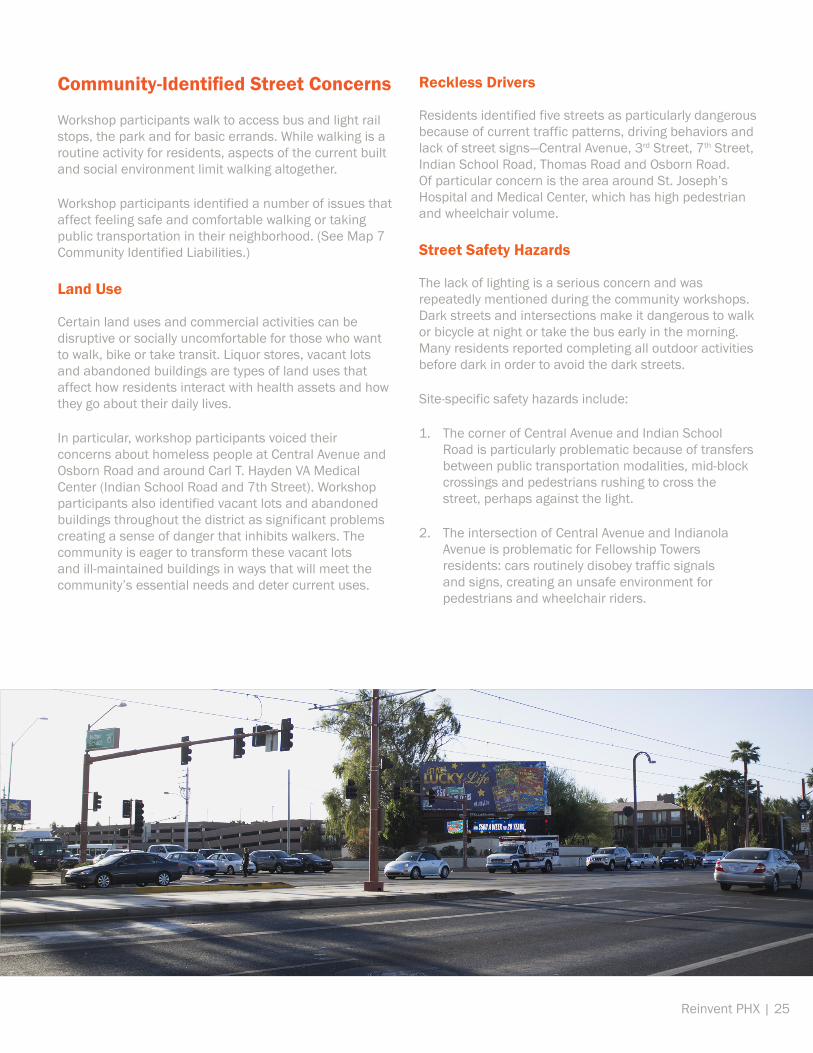
Reckless Drivers
Residents identified five streets as particularly dangerous because of current traffic patterns, driving behaviors and lack of street signs—Central Avenue, 3rd Street, 7th Street, Indian School Road, Thomas Road and Osborn Road. Of particular concern is the area around St. Joseph’s Hospital and Medical Center, which has high pedestrian and wheelchair volume.
Street Safety Hazards
The lack of lighting is a serious concern and was repeatedly mentioned during the community workshops. Dark streets and intersections make it dangerous to walk or bicycle at night or take the bus early in the morning. Many residents reported completing all outdoor activities before dark in order to avoid the dark streets.
Site-specific safety hazards include:
1. The corner of Central Avenue and Indian School Road is particularly problematic because of transfers between public transportation modalities, mid-block crossings and pedestrians rushing to cross the street, perhaps against the light.
2. The intersection of Central Avenue and Indianola Avenue is problematic for Fellowship Towers residents: cars routinely disobey traffic signals and signs, creating an unsafe environment for pedestrians and wheelchair riders.
!
!
!
!
!
!
#0#0
#0#0
#0
#0
#0
#0
#0
#0#0 #0
#0#0
#0
#0#0#0
#0#0
#0
#0
#0
#0
#0
#0 #0
!.
!.!.
!.!.
!.
!.!.
!.!.!. !.!.
!.!.
!.
!.!.!.!. !.!.!. !.
!.
!.!.!.!.!. !.
!.!. !.
!. !.!.
!.
!.!.!.!.!.
#0#0
#0
#0 #0
#0
#0#0
#0#0
#0#0#0#0
#0
#0#0 #0#0
#0#0#0#0#0#0 #0#0 #0
#0 #0
#0 #0#0
#0#0#0#0#0
#0#0#0 #0#0#0
#0#0
#0#0#0 #0#0#0#0#0#0#0#0#0
#0
#0
#0
#0#0
#0
#0
#0
#0
#0 #0
#0Indian School Rd
Osborn Rd
Thomas Rd
Earll Dr
Encanto Blvd
Palm Ln
Coronado Rd
McDowell Rd
Oak St
Virginia Ave
7th
Ave
3rd
Ave
Cen
tral
Ave
7th
St
3rd
St
Clarendon Ave
Light Rail Station
Light Rail LineStreet
Transit District Boundary
!
² May 23, 2014 Midtown Transit District Map 8 - Pedestrian and Cyclist Injuries
Reinvent PHX
LegendPedestrain - Traffic
Pedestrian - Non-Traffic
Bicycle
Pedestrian - Act of Violence#0
!.
#0#0
0 0.25Miles
Assessment of Current Conditions in Midtown District
Bicycle Pedestrian - Traffic
Pedestrian - Other
Pedestrian - Violence Total
No Injury 2 1 0 0 3Possible Injury 14 14 0 0 28
Minor Injury 19 19 0 0 38
Serious Injury 1 5 0 0 6
Fatal Injury 0 3 0 1 4
Trauma 7 17 12 26 62
Total 43 59 12 27 141
01
8
67
10
8
0
2
0
9
11
8
1211
3
0 0 01
32
10
4
2
0
2
0 0
4
7
Num
ber o
f Inj
urie
s
Bicycle Pedestrian - Traffic Pedestrian - Nontraffic Pedestrian - Violence
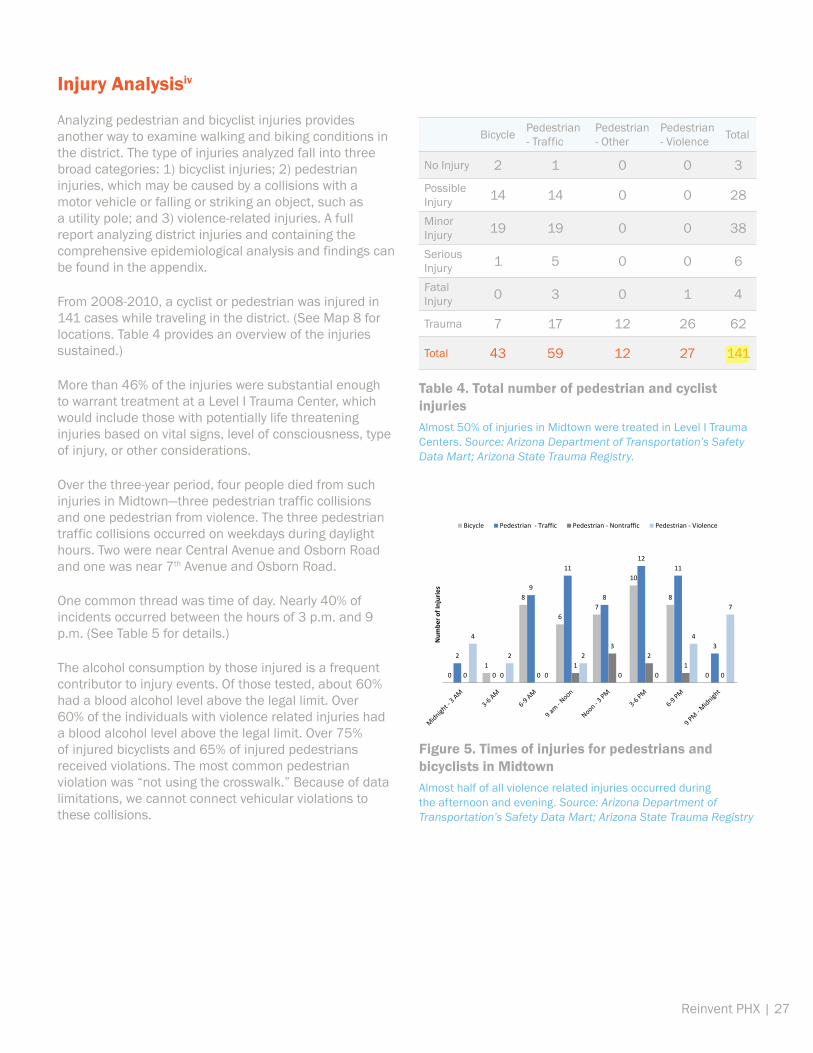
Table 4. Total number of pedestrian and cyclist injuriesAlmost 50% of injuries in Midtown were treated in Level I Trauma Centers. Source: Arizona Department of Transportation’s Safety Data Mart; Arizona State Trauma Registry.
Figure 5. Times of injuries for pedestrians and bicyclists in Midtown Almost half of all violence related injuries occurred during the afternoon and evening. Source: Arizona Department of Transportation’s Safety Data Mart; Arizona State Trauma Registry
Reinvent PHX | 27
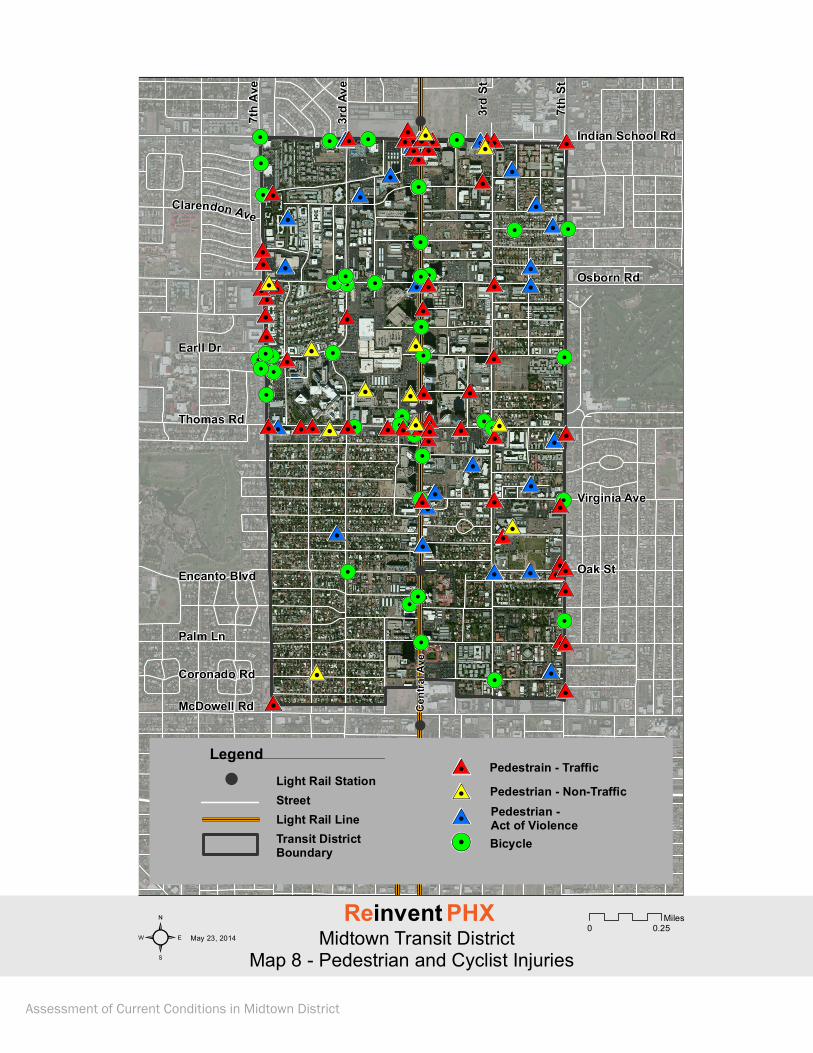
Injury Analysisiv
Analyzing pedestrian and bicyclist injuries provides another way to examine walking and biking conditions in the district. The type of injuries analyzed fall into three broad categories: 1) bicyclist injuries; 2) pedestrian injuries, which may be caused by a collisions with a motor vehicle or falling or striking an object, such as a utility pole; and 3) violence-related injuries. A full report analyzing district injuries and containing the comprehensive epidemiological analysis and findings can be found in the appendix.
From 2008-2010, a cyclist or pedestrian was injured in 141 cases while traveling in the district. (See Map 8 for locations. Table 4 provides an overview of the injuries sustained.)
More than 46% of the injuries were substantial enough to warrant treatment at a Level I Trauma Center, which would include those with potentially life threatening injuries based on vital signs, level of consciousness, type of injury, or other considerations.
Over the three-year period, four people died from such injuries in Midtown—three pedestrian traffic collisions and one pedestrian from violence. The three pedestrian traffic collisions occurred on weekdays during daylight hours. Two were near Central Avenue and Osborn Road and one was near 7th Avenue and Osborn Road.
One common thread was time of day. Nearly 40% of incidents occurred between the hours of 3 p.m. and 9 p.m. (See Table 5 for details.)
The alcohol consumption by those injured is a frequent contributor to injury events. Of those tested, about 60% had a blood alcohol level above the legal limit. Over 60% of the individuals with violence related injuries had a blood alcohol level above the legal limit. Over 75% of injured bicyclists and 65% of injured pedestrians received violations. The most common pedestrian violation was “not using the crosswalk.” Because of data limitations, we cannot connect vehicular violations to these collisions.
063415
Highlight
!
!
!
!
!
!
Indian School Rd
Osborn Rd
Thomas Rd
Earll Dr
Encanto Blvd
Palm Ln
Coronado Rd
McDowell Rd
Oak St
Virginia Ave
7th
Ave
3rd
Ave
Cen
tral
Ave
7th
St
3rd
St
Clarendon Ave
0 0.25Miles
Light Rail Station
Light Rail Line
Street
Transit District Boundary
!
² May 23, 2014
Midtown Transit District Map 9 - Community-Identified Pedestrian And Bicycle Corridors
Reinvent PHX
Legend Number of Residents Walkingthe Corridor a Minimumof Once/Week
Number of Residents Bicyclingthe Corridor a Minimumof Once/Week
123
123
Assessment of Current Conditions in Midtown District
Reinvent PHX | 29
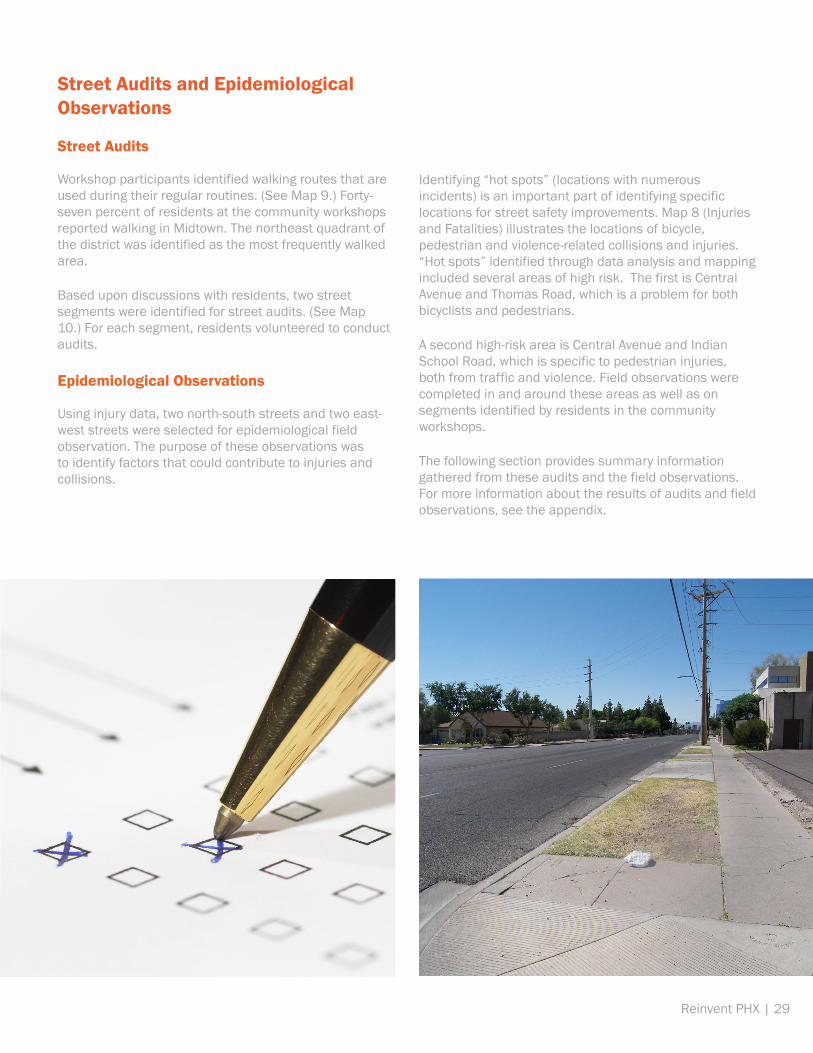
Street Audits and Epidemiological Observations
Street Audits
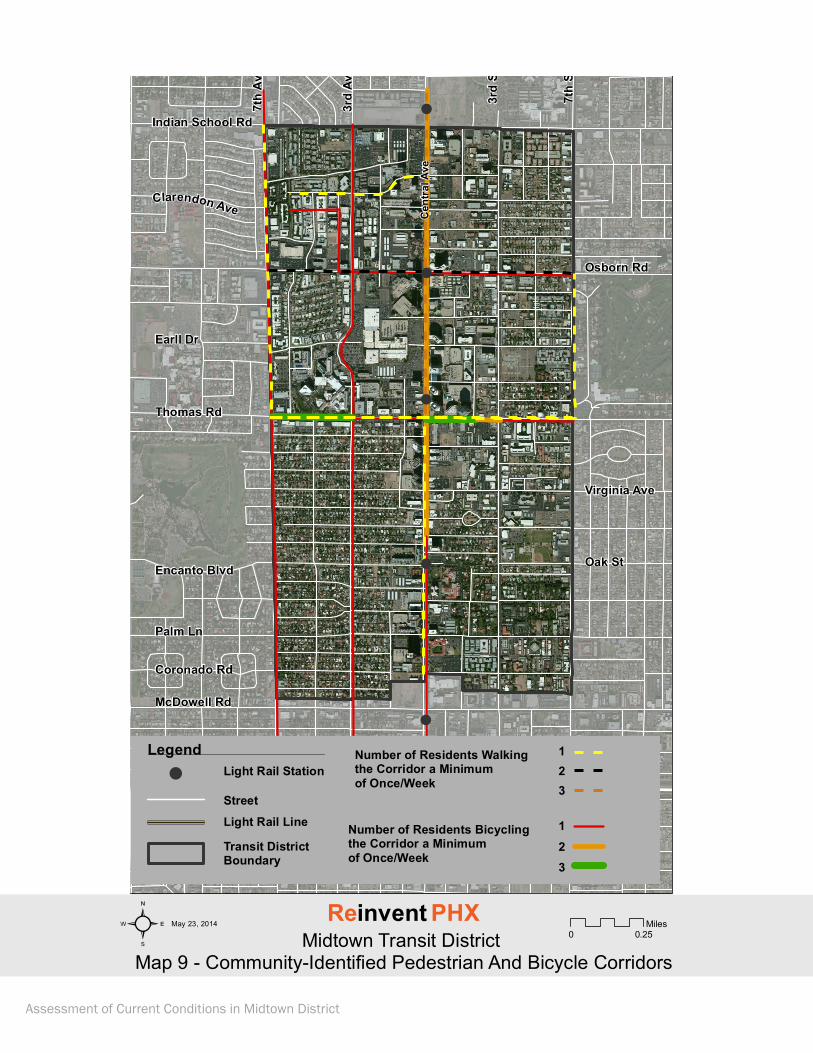
Workshop participants identified walking routes that are used during their regular routines. (See Map 9.) Forty-seven percent of residents at the community workshops reported walking in Midtown. The northeast quadrant of the district was identified as the most frequently walked area.
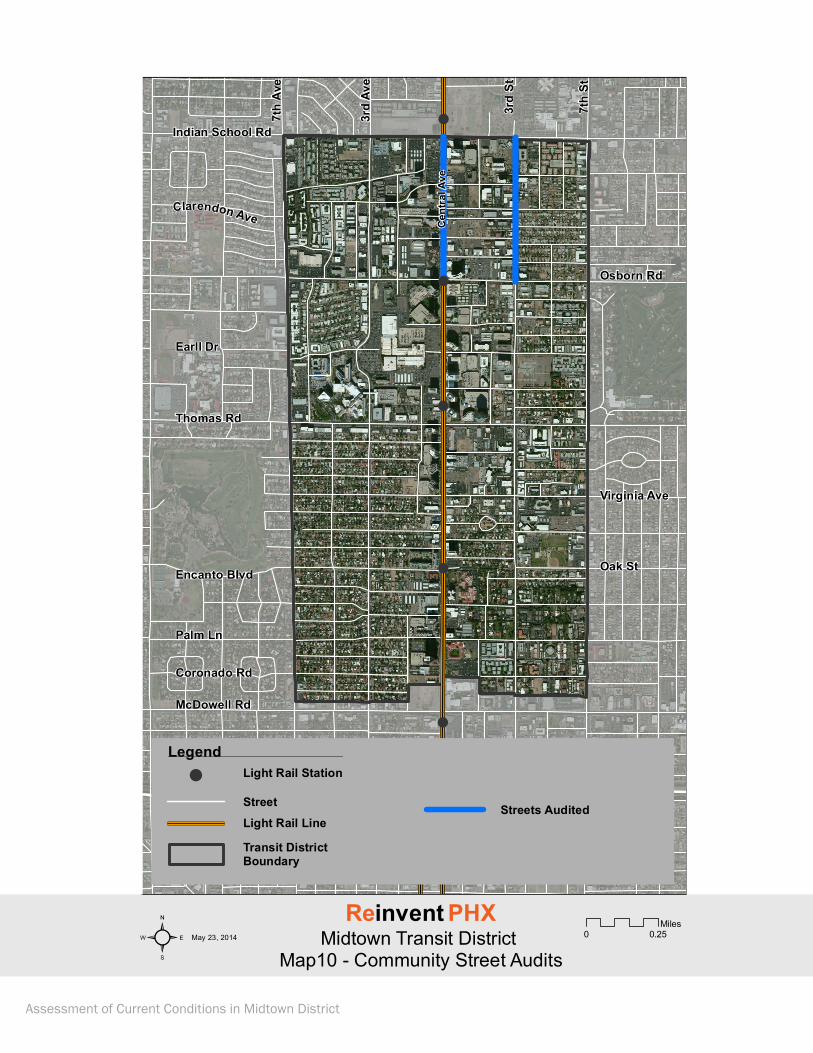
Based upon discussions with residents, two street segments were identified for street audits. (See Map 10.) For each segment, residents volunteered to conduct audits.
Epidemiological Observations
Using injury data, two north-south streets and two east-west streets were selected for epidemiological field observation. The purpose of these observations was to identify factors that could contribute to injuries and collisions.
Identifying “hot spots” (locations with numerous incidents) is an important part of identifying specific locations for street safety improvements. Map 8 (Injuries and Fatalities) illustrates the locations of bicycle, pedestrian and violence-related collisions and injuries. “Hot spots” identified through data analysis and mapping included several areas of high risk. The first is Central Avenue and Thomas Road, which is a problem for both bicyclists and pedestrians.
A second high-risk area is Central Avenue and Indian School Road, which is specific to pedestrian injuries, both from traffic and violence. Field observations were completed in and around these areas as well as on segments identified by residents in the community workshops.
The following section provides summary information gathered from these audits and the field observations. For more information about the results of audits and field observations, see the appendix.
!
!
!
!
!
!
Indian School Rd
Osborn Rd
Thomas Rd
Earll Dr
Encanto Blvd
Palm Ln
Coronado Rd
McDowell Rd
Oak St
Virginia Ave
7th
Ave
3rd
Ave
Cen
tral
Ave
7th
St
3rd
St
Clarendon Ave
0 0.25Miles
Light Rail Station
Light Rail Line
Street
Transit District Boundary
!
² May 23, 2014 Midtown Transit District Map10 - Community Street Audits
Reinvent PHX
Legend
Streets Audited
Assessment of Current Conditions in Midtown District
Reinvent PHX | 31
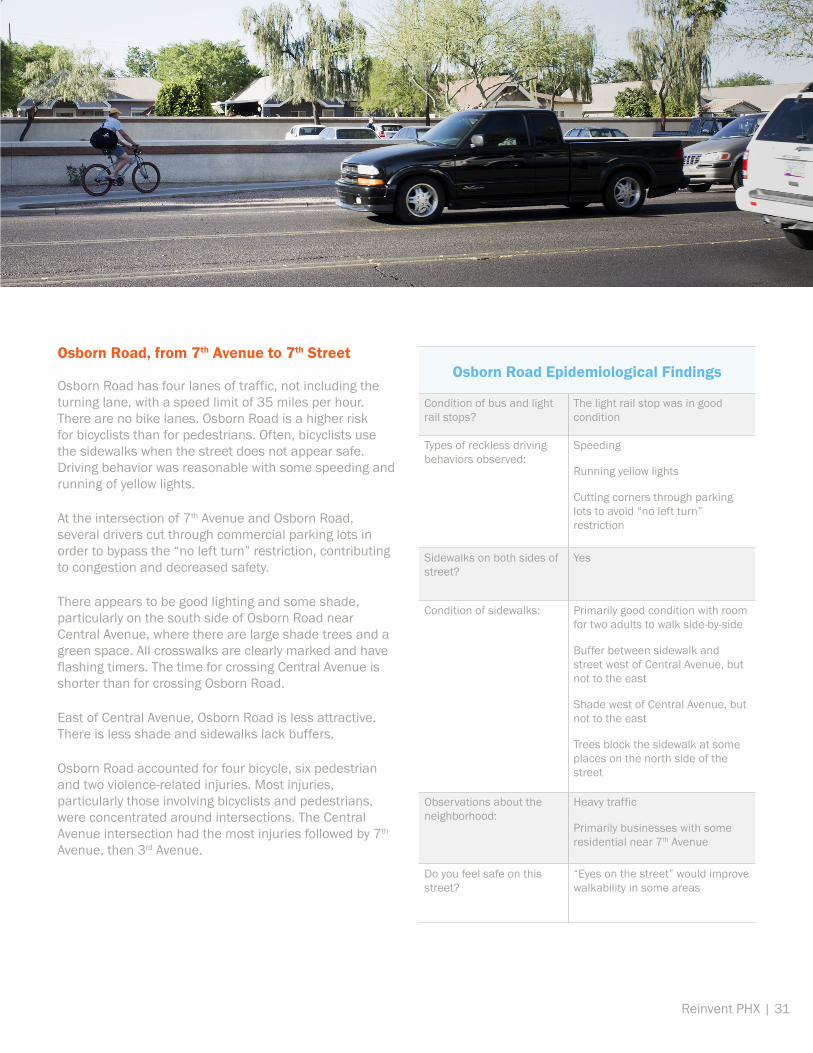
Osborn Road, from 7th Avenue to 7th Street
Osborn Road has four lanes of traffic, not including the turning lane, with a speed limit of 35 miles per hour. There are no bike lanes. Osborn Road is a higher risk for bicyclists than for pedestrians. Often, bicyclists use the sidewalks when the street does not appear safe. Driving behavior was reasonable with some speeding and running of yellow lights.
At the intersection of 7th Avenue and Osborn Road, several drivers cut through commercial parking lots in order to bypass the “no left turn” restriction, contributing to congestion and decreased safety.
There appears to be good lighting and some shade, particularly on the south side of Osborn Road near Central Avenue, where there are large shade trees and a green space. All crosswalks are clearly marked and have flashing timers. The time for crossing Central Avenue is shorter than for crossing Osborn Road.
East of Central Avenue, Osborn Road is less attractive. There is less shade and sidewalks lack buffers.
Osborn Road accounted for four bicycle, six pedestrian and two violence-related injuries. Most injuries, particularly those involving bicyclists and pedestrians, were concentrated around intersections. The Central Avenue intersection had the most injuries followed by 7th Avenue, then 3rd Avenue.
Osborn Road Epidemiological Findings
Condition of bus and light rail stops?
The light rail stop was in good condition
Types of reckless driving behaviors observed:
Speeding
Running yellow lights
Cutting corners through parking lots to avoid “no left turn” restriction
Sidewalks on both sides of street?
Yes
Condition of sidewalks: Primarily good condition with room for two adults to walk side-by-side
Buffer between sidewalk and street west of Central Avenue, but not to the east
Shade west of Central Avenue, but not to the east
Trees block the sidewalk at some places on the north side of the street
Observations about the neighborhood:
Heavy traffic
Primarily businesses with some residential near 7th Avenue
Do you feel safe on this street?
“Eyes on the street” would improve walkability in some areas
Assessment of Current Conditions in Midtown District
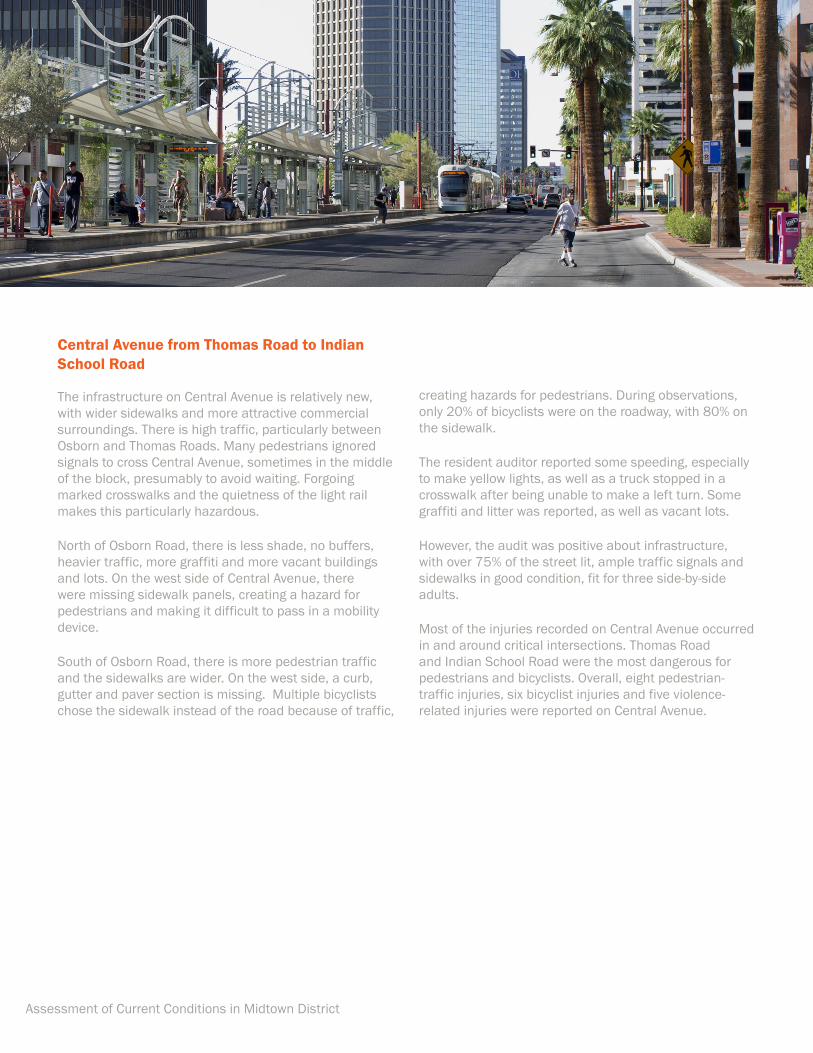
Central Avenue from Thomas Road to Indian School Road
The infrastructure on Central Avenue is relatively new, with wider sidewalks and more attractive commercial surroundings. There is high traffic, particularly between Osborn and Thomas Roads. Many pedestrians ignored signals to cross Central Avenue, sometimes in the middle of the block, presumably to avoid waiting. Forgoing marked crosswalks and the quietness of the light rail makes this particularly hazardous.
North of Osborn Road, there is less shade, no buffers, heavier traffic, more graffiti and more vacant buildings and lots. On the west side of Central Avenue, there were missing sidewalk panels, creating a hazard for pedestrians and making it difficult to pass in a mobility device.
South of Osborn Road, there is more pedestrian traffic and the sidewalks are wider. On the west side, a curb, gutter and paver section is missing. Multiple bicyclists chose the sidewalk instead of the road because of traffic,
creating hazards for pedestrians. During observations, only 20% of bicyclists were on the roadway, with 80% on the sidewalk.
The resident auditor reported some speeding, especially to make yellow lights, as well as a truck stopped in a crosswalk after being unable to make a left turn. Some graffiti and litter was reported, as well as vacant lots.
However, the audit was positive about infrastructure, with over 75% of the street lit, ample traffic signals and sidewalks in good condition, fit for three side-by-side adults.
Most of the injuries recorded on Central Avenue occurred in and around critical intersections. Thomas Road and Indian School Road were the most dangerous for pedestrians and bicyclists. Overall, eight pedestrian-traffic injuries, six bicyclist injuries and five violence-related injuries were reported on Central Avenue.
Reinvent PHX | 33
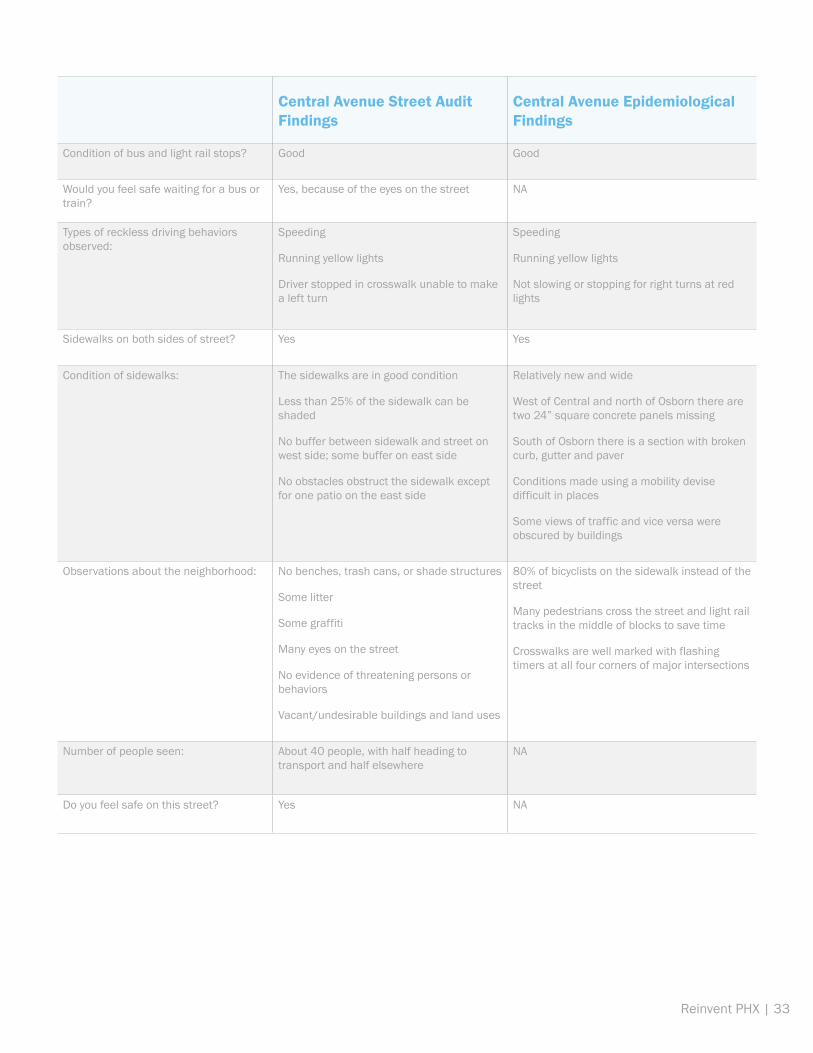
Central Avenue Street Audit Findings
Central Avenue Epidemiological Findings
Condition of bus and light rail stops? Good Good
Would you feel safe waiting for a bus or train?
Yes, because of the eyes on the street NA
Types of reckless driving behaviors observed:
Speeding
Running yellow lights
Driver stopped in crosswalk unable to make a left turn
Speeding
Running yellow lights
Not slowing or stopping for right turns at red lights
Sidewalks on both sides of street? Yes Yes
Condition of sidewalks: The sidewalks are in good condition
Less than 25% of the sidewalk can be shaded
No buffer between sidewalk and street on west side; some buffer on east side
No obstacles obstruct the sidewalk except for one patio on the east side
Relatively new and wide
West of Central and north of Osborn there are two 24” square concrete panels missing
South of Osborn there is a section with broken curb, gutter and paver
Conditions made using a mobility devise difficult in places
Some views of traffic and vice versa were obscured by buildings
Observations about the neighborhood: No benches, trash cans, or shade structures
Some litter
Some graffiti
Many eyes on the street
No evidence of threatening persons or behaviors
Vacant/undesirable buildings and land uses
80% of bicyclists on the sidewalk instead of the street
Many pedestrians cross the street and light rail tracks in the middle of blocks to save time
Crosswalks are well marked with flashing timers at all four corners of major intersections
Number of people seen: About 40 people, with half heading to transport and half elsewhere
NA
Do you feel safe on this street? Yes NA
Assessment of Current Conditions in Midtown District
Thomas Road from 7th Avenue to 3rd Street
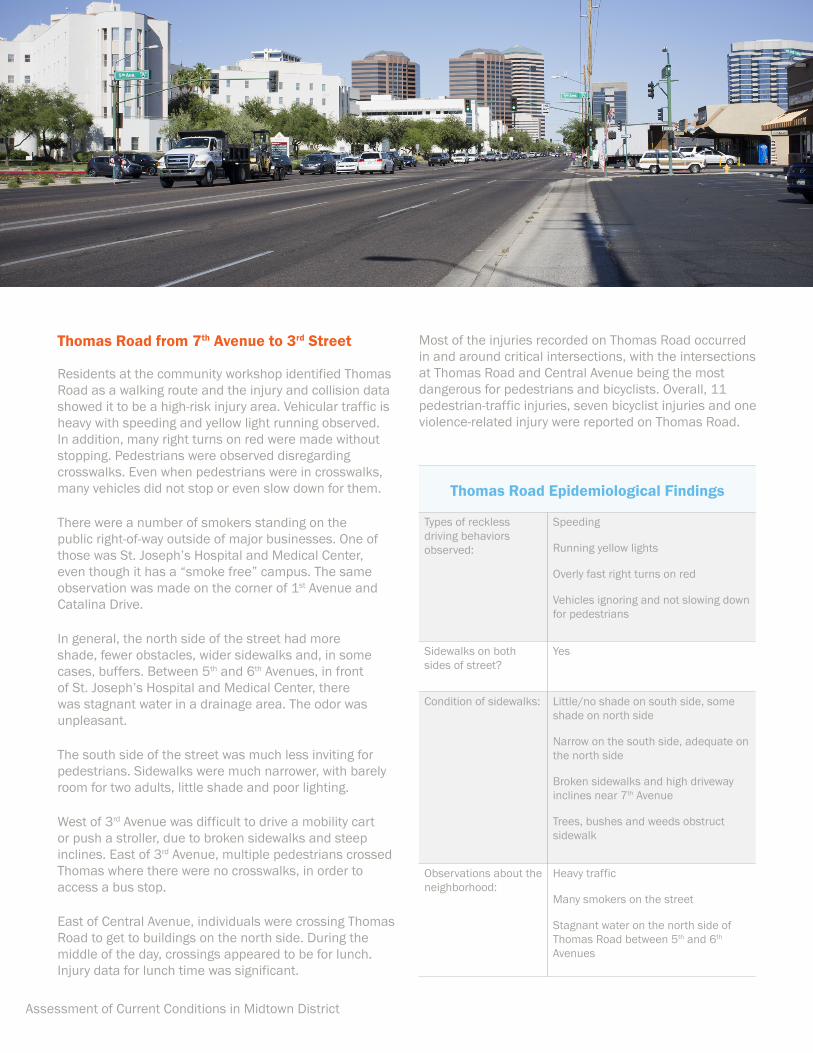
Residents at the community workshop identified Thomas Road as a walking route and the injury and collision data showed it to be a high-risk injury area. Vehicular traffic is heavy with speeding and yellow light running observed. In addition, many right turns on red were made without stopping. Pedestrians were observed disregarding crosswalks. Even when pedestrians were in crosswalks, many vehicles did not stop or even slow down for them.
There were a number of smokers standing on the public right-of-way outside of major businesses. One of those was St. Joseph’s Hospital and Medical Center, even though it has a “smoke free” campus. The same observation was made on the corner of 1st Avenue and Catalina Drive.
In general, the north side of the street had more shade, fewer obstacles, wider sidewalks and, in some cases, buffers. Between 5th and 6th Avenues, in front of St. Joseph’s Hospital and Medical Center, there was stagnant water in a drainage area. The odor was unpleasant.
The south side of the street was much less inviting for pedestrians. Sidewalks were much narrower, with barely room for two adults, little shade and poor lighting.
West of 3rd Avenue was difficult to drive a mobility cart or push a stroller, due to broken sidewalks and steep inclines. East of 3rd Avenue, multiple pedestrians crossed Thomas where there were no crosswalks, in order to access a bus stop.
East of Central Avenue, individuals were crossing Thomas Road to get to buildings on the north side. During the middle of the day, crossings appeared to be for lunch. Injury data for lunch time was significant.
Most of the injuries recorded on Thomas Road occurred in and around critical intersections, with the intersections at Thomas Road and Central Avenue being the most dangerous for pedestrians and bicyclists. Overall, 11 pedestrian-traffic injuries, seven bicyclist injuries and one violence-related injury were reported on Thomas Road.
Thomas Road Epidemiological Findings
Types of reckless driving behaviors observed:
Speeding
Running yellow lights
Overly fast right turns on red
Vehicles ignoring and not slowing down for pedestrians
Sidewalks on both sides of street?
Yes
Condition of sidewalks: Little/no shade on south side, some shade on north side
Narrow on the south side, adequate on the north side
Broken sidewalks and high driveway inclines near 7th Avenue
Trees, bushes and weeds obstruct sidewalk
Observations about the neighborhood:
Heavy traffic
Many smokers on the street
Stagnant water on the north side of Thomas Road between 5th and 6th Avenues

Reinvent PHX | 35
3rd Street, from Osborn to Indian School Roads
Residents identified 3rd Street as an area of concern and the data shows four injuries. One bicycle and two pedestrian traffic injuries occurred near Indian School Road, the fourth injury to a pedestrian occurring near Osborn Road.
The road is well travelled. In fact, according to residents, it has become increasingly congested after the light rail slowed traffic on Central Avenue. There are no
traffic signals, stop signs or crosswalks in this segment. However, sidewalks are in good condition with no blockages.
Although there were no “eyes on the street,” lighting was described as good, with some litter and graffiti present. The pedestrian walk signal button at Indian School was painted over. Residents also complained that bicyclists and skateboarders used the sidewalks, forcing pedestrians into the street.
3rd Street Audit Findings 3rd Street Epidemiological Findings
Types of reckless driving behaviors observed:
Speeding NA
Sidewalks on both sides of street? Yes YesCondition of sidewalks: Good condition
Less than 25% of the sidewalk can be shaded
Wide enough for two side-by-side adults
Limited buffer between sidewalk and street and only on one side
No obstacles on sidewalk
Walk signal at Indian School Road is painted over
Lighting is good
Observations about the neighborhood:
Better than 75% of the street can be lit
Some litter an graffiti
Some vacant buildings and lots
Some poorly maintained properties
Lack of eyes on the street
There are no crosswalks or places for pedestrians to cross the street in the segment
No “eyes on the street”
Bicyclists and skateboarders on sidewalks sometimes crowd pedestrians into the street
There are no stop signs, traffic signals or crosswalks in this segment
Some litter and graffiti present
Number of people seen: 15 NADo you feel safe on this street? Yes, but only on one side NA
70.00
80.00
90.00
100.00
110.00
120.00
130.00
7:15
AM
7:45
AM
8:15
AM
8:45
AM
9:15
AM
9:45
AM
10:1
5 AM
10:4
5 AM
11:1
5 AM
11:4
5 AM
12:1
5 PM
12:4
5 PM
1:15
PM
1:45
PM
2:15
PM
2:45
PM
3:15
PM
3:45
PM
4:15
PM
Degr
ees F
ahre
nhei
t
Osborn North Osborn South
Thomas North Thomas South Bus Stop
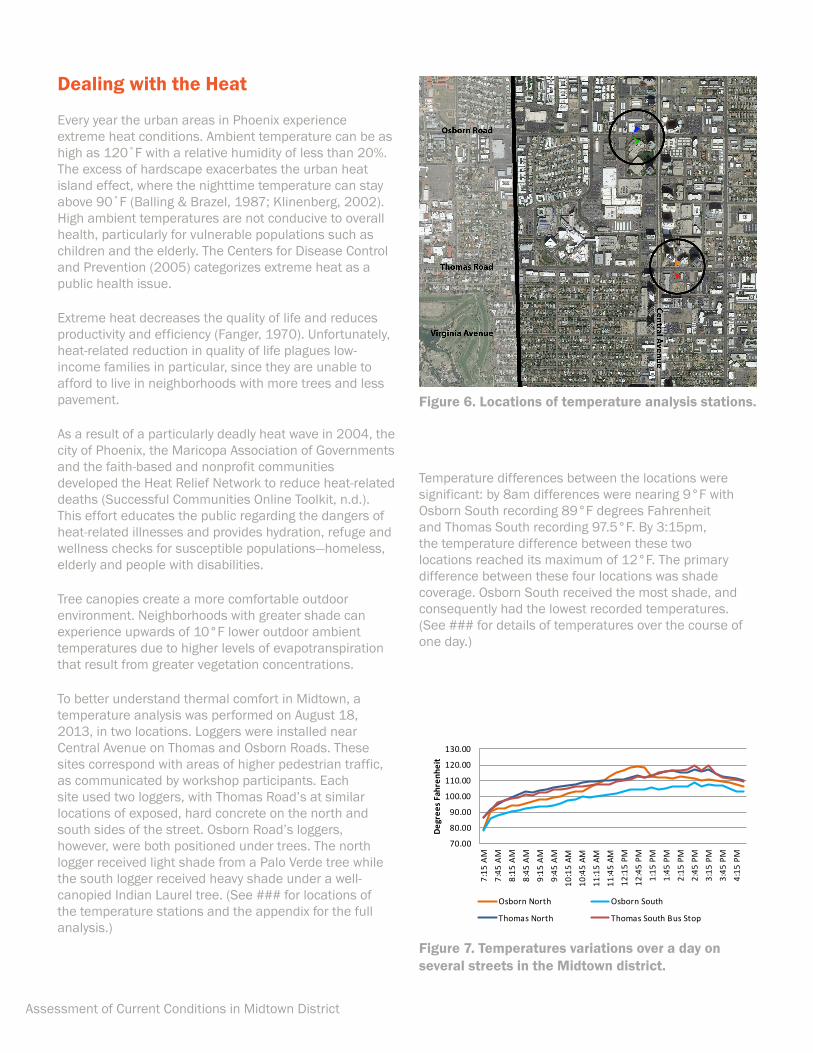
Figure 6. Locations of temperature analysis stations.
Figure 7. Temperatures variations over a day on several streets in the Midtown district.
Assessment of Current Conditions in Midtown District
Dealing with the Heat
Every year the urban areas in Phoenix experience extreme heat conditions. Ambient temperature can be as high as 120˚F with a relative humidity of less than 20%. The excess of hardscape exacerbates the urban heat island effect, where the nighttime temperature can stay above 90˚F (Balling & Brazel, 1987; Klinenberg, 2002). High ambient temperatures are not conducive to overall health, particularly for vulnerable populations such as children and the elderly. The Centers for Disease Control and Prevention (2005) categorizes extreme heat as a public health issue.
Extreme heat decreases the quality of life and reduces productivity and efficiency (Fanger, 1970). Unfortunately, heat-related reduction in quality of life plagues low-income families in particular, since they are unable to afford to live in neighborhoods with more trees and less pavement.
As a result of a particularly deadly heat wave in 2004, the city of Phoenix, the Maricopa Association of Governments and the faith-based and nonprofit communities developed the Heat Relief Network to reduce heat-related deaths (Successful Communities Online Toolkit, n.d.). This effort educates the public regarding the dangers of heat-related illnesses and provides hydration, refuge and wellness checks for susceptible populations—homeless, elderly and people with disabilities.
Tree canopies create a more comfortable outdoor environment. Neighborhoods with greater shade can experience upwards of 10°F lower outdoor ambient temperatures due to higher levels of evapotranspiration that result from greater vegetation concentrations.
To better understand thermal comfort in Midtown, a temperature analysis was performed on August 18, 2013, in two locations. Loggers were installed near Central Avenue on Thomas and Osborn Roads. These sites correspond with areas of higher pedestrian traffic, as communicated by workshop participants. Each site used two loggers, with Thomas Road’s at similar locations of exposed, hard concrete on the north and south sides of the street. Osborn Road’s loggers, however, were both positioned under trees. The north logger received light shade from a Palo Verde tree while the south logger received heavy shade under a well-canopied Indian Laurel tree. (See ### for locations of the temperature stations and the appendix for the full analysis.)
Temperature differences between the locations were significant: by 8am differences were nearing 9°F with Osborn South recording 89°F degrees Fahrenheit and Thomas South recording 97.5°F. By 3:15pm, the temperature difference between these two locations reached its maximum of 12°F. The primary difference between these four locations was shade coverage. Osborn South received the most shade, and consequently had the lowest recorded temperatures. (See ### for details of temperatures over the course of one day.)

Reinvent PHX | 37
Temperatures in Midtown are relatively predictable. The lack of vegetation, high asphalt and concrete density, and lack of tree canopy and water contribute to high temperatures. The temperature difference between Thomas Road’s loggers and the well-shaded Osborn South logger illustrates the impact of shade in creating a more comfortable environment for residents.
Clearly, vegetation can play an important role in making the environment cooler for residents.

Strategy Report for the Midtown District
Reinvent PHX | 39
Health Strategy Report

Strategy Report for the Midtown District
This page was left blank intentionally
Reinvent PHX | 41
Healthy Food Strategies
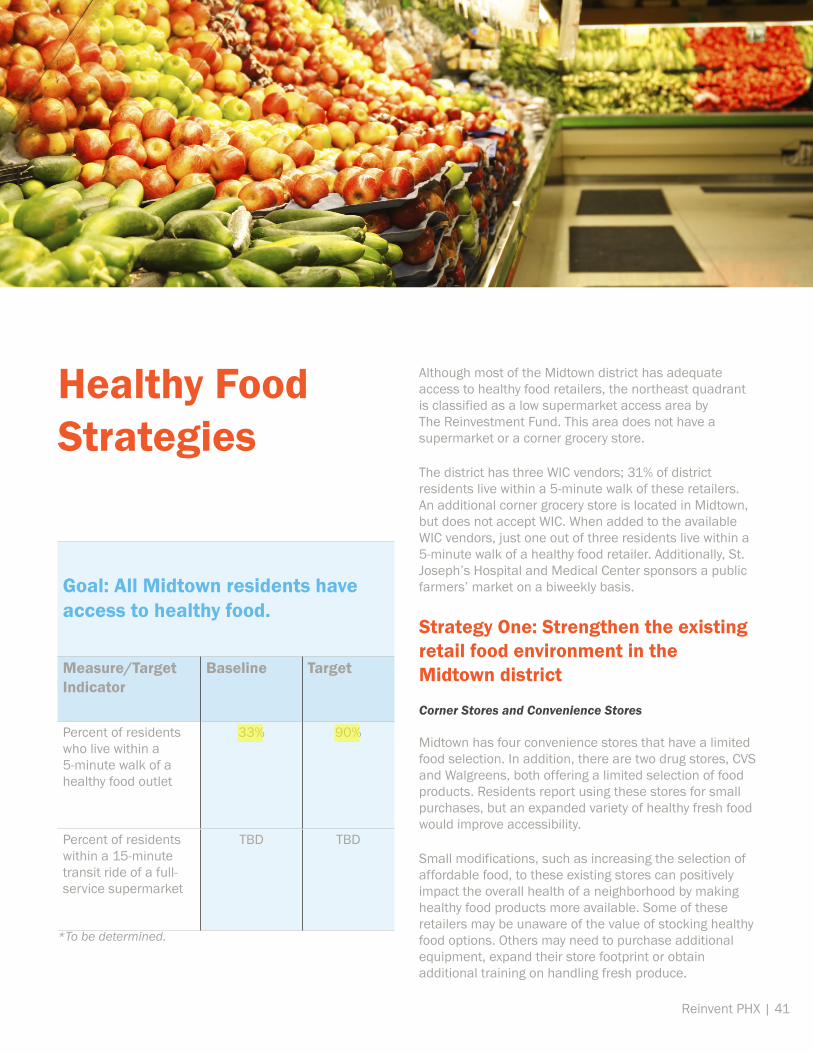
Although most of the Midtown district has adequate access to healthy food retailers, the northeast quadrant is classified as a low supermarket access area by The Reinvestment Fund. This area does not have a supermarket or a corner grocery store.
The district has three WIC vendors; 31% of district residents live within a 5-minute walk of these retailers. An additional corner grocery store is located in Midtown, but does not accept WIC. When added to the available WIC vendors, just one out of three residents live within a 5-minute walk of a healthy food retailer. Additionally, St. Joseph’s Hospital and Medical Center sponsors a public farmers’ market on a biweekly basis.
Strategy One: Strengthen the existing retail food environment in the Midtown district
Corner Stores and Convenience Stores
Midtown has four convenience stores that have a limited food selection. In addition, there are two drug stores, CVS and Walgreens, both offering a limited selection of food products. Residents report using these stores for small purchases, but an expanded variety of healthy fresh food would improve accessibility.
Small modifications, such as increasing the selection of affordable food, to these existing stores can positively impact the overall health of a neighborhood by making healthy food products more available. Some of these retailers may be unaware of the value of stocking healthy food options. Others may need to purchase additional equipment, expand their store footprint or obtain additional training on handling fresh produce.
Goal: All Midtown residents have access to healthy food.
Measure/Target Indicator
Baseline Target
Percent of residents who live within a 5-minute walk of a healthy food outlet
33% 90%
Percent of residents within a 15-minute transit ride of a full-service supermarket
TBD TBD
*To be determined.
063415
Highlight
063415
Highlight
Tools to Implement Strategy OneA brief description of each tool appears at the end of the Healthy Food Strategies section.
• Community Reinvestment Act
• Healthy Food Financing Initiative
• New Markets Tax Credit Program
• Special Supplemental Nutrition Program for Women, Infants and Children (WIC)
• Supplemental Nutrition Assistance Program (SNAP)
Strategy Report for the Midtown District
Other communities have launched financing and marketing programs to promote the conversion of convenience stores into corner stores that provide a wider array of healthy offerings. Low-interest loans, technical assistance on handling produce, community organizing to identify preferred produce offerings, food tastings, cooking demonstrations and additional signage are examples of incentives. Baldwin Park, CA, Louisville, KY and Seattle are among the cities that have launched successful programs to increase healthy offerings at corner stores.v The CDC supports this strategy in reducing obesity (Kettel Khan, et al., 2009).
The Walgreens corporate arm has committed to adding additional space for fresh food in at least 1,000 of its stores nationwide (Walgreens, 2011). Efforts should be made to include the Midtown Walgreens in this targeted group.
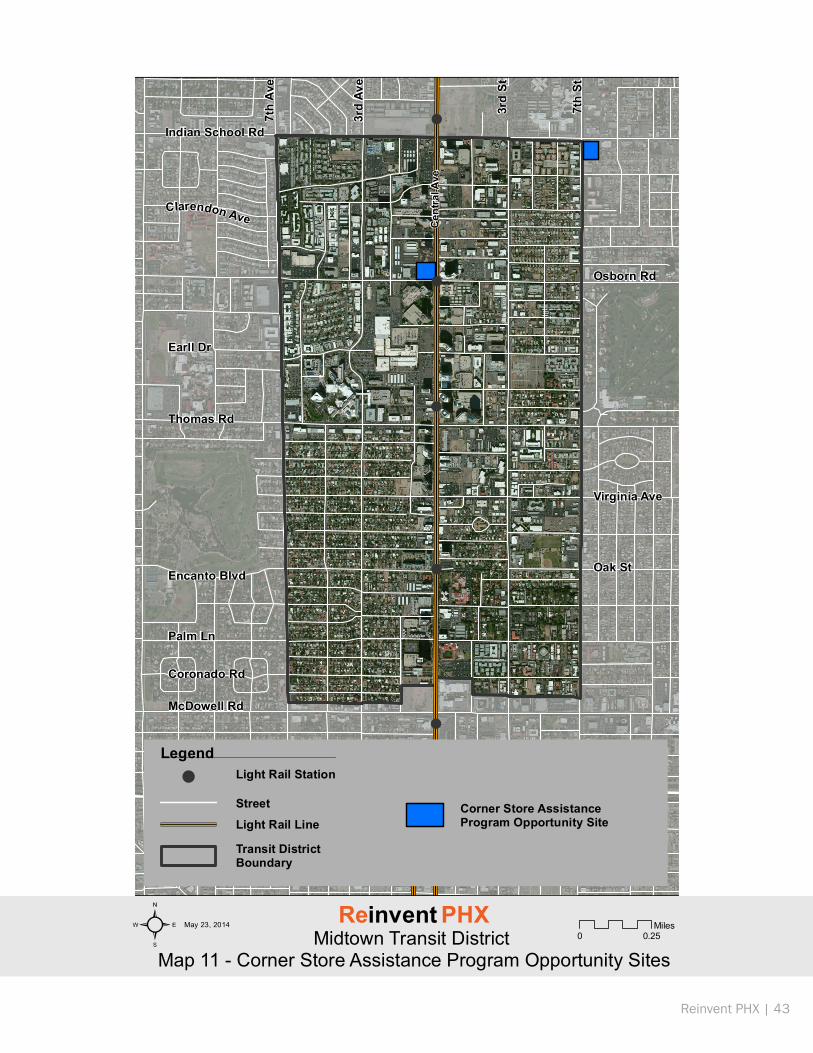
Map 11 depicts the current Midtown stores that should be targeted for this type of program.
WIC Vendors
WIC is an impactful food assistance program that should be used to strengthen the existing retail food environment in Midtown. WIC provides assistance to low-income pregnant or breastfeeding women or families with young children to purchase healthy food, such as milk, fresh fruits and vegetables. Stores that currently accept WIC should be supported to expand healthy food options through programs like the one described previously, and existing healthy food retailers should be encouraged to join this program and other federal food assistance programs.
To increase healthy options for all residents, other food retailers should be recruited to participate in the WIC program. One such opportunity may be the Fresh & Easy located at 7th Avenue and Indian School Road.
Farmers’ Markets
St. Joseph’s Hospital and Medical Center sponsors a public farmers’ market that is held every other Friday year round. This market could serve a broader customer base in Midtown with expansion to a weekly market with potentially multiple days each week. Because affordability is a critical issue for those with lower incomes, this market should also accept national food assistance programs, like WIC. An enhanced marketing program to residents in Midtown and surrounding neighborhoods should be part of this expansion of services.
Recommended Policies
1. Develop a Corner Store Assistance Program to encourage existing convenience stores to seek funding for offering healthier options. As a condition of this program, require participating corner stores to accept WIC and other food assistance programs like the federal Supplemental Nutrition Assistance Program (SNAP).
2. Partner with entities that receive New Markets Tax Credits to fund equipment upgrades for existing food retailers. Encourage these entities to target existing Midtown retailers. Require participating corner stores to accept WIC and other food assistance programs like SNAP.
3. Partner with the Arizona Department of Health Services to recruit additional WIC vendors in Midtown, in particular the Fresh & Easy Neighborhood Market.
4. Partner with St. Joseph’s Hospital and Medical Center to expand its farmers’ market to a weekly schedule with the potential for multiple days of operation during the week. Partner with ADHS to provide this farmers’ market with the equipment that allows vendors to accept federal food assistance programs like WIC and SNAP. Expand the customer base by initiating an enhanced marketing program.
!
!
!
!
!
!
Indian School Rd
Osborn Rd
Thomas Rd
Earll Dr
Encanto Blvd
Palm Ln
Coronado Rd
McDowell Rd
Oak St
Virginia Ave
7th
Ave
3rd
Ave
Cen
tral
Ave
7th
St
3rd
St
Clarendon Ave
0 0.25Miles
Light Rail Station
Light Rail Line
Street
Transit District Boundary
!
² May 23, 2014
Midtown Transit District Map 11 - Corner Store Assistance Program Opportunity Sites
Reinvent PHX
Legend
Corner Store Assistance Program Opportunity Site
Reinvent PHX | 43
Tools to Implement Strategy TwoA brief description of each tool appears at the end of the Healthy Food Strategies section.
• Community Development Block Grant
• Community Food Projects Competitive Grants Program
• Community Reinvestment Act
• Farmers Market Promotion Program
• Healthy Food Financing Initiative
• New Markets Tax Credit Program
Strategy Report for the Midtown District
Strategy Two: Create new healthy food outlets in the Midtown district
New healthy food options can assume different forms, from community-based gardening initiatives to the development of a supermarket. Regardless of how this is accomplished, the goal is the same: to increase the quantity of affordable healthy food available within the district.
Community Gardens and Urban Agriculture
In recent years, Phoenix has taken successful steps to support community gardens. In 2012, the City adopted a community garden policy that has clear requirements, including property maintenance.vi Phoenix also has excellent examples of community gardens. Maryvale on the Move, a multi-year project funded by the Robert Wood Johnson Foundation, has been successful in establishing gardens in Maryvale. Tigermountain Foundation in South Phoenix has started community gardens along with job training for landscapers. Produce from Tigermountain’s gardens is distributed among residents and food banks. In partnership with residents of the Grant Park neighborhood, Phoenix Revitalization Corporation developed a community garden that has been successful in providing culturally-appropriate produce for low-income residents.
Although few Midtown residents expressed an interest in participating in community gardening, there is a growing interest among the broader population. Having a dedicated place for gardening is important for many residents; 81% of survey respondents said they did not have a space for a garden at their home or growing food where they live is not permitted. Vacant parcels available throughout the district, particularly those north of Thomas Road, could be used on an interim basis for community gardens or urban agriculture. In addition, the owners of multi-family communities could be contacted regarding the potential to set aside an area in their property that residents could access for growing their own food. For example, a portion of the Fellowship Towers lawn could be used for a garden for property residents or neighborhood residents. Besides growing food, this would provide an opportunity to encourage social interaction.
In addition to access to land, water can be cost prohibitive for some residents or for larger scale urban agriculture. The water meter hookup fee, monthly sewer fee and the ongoing cost of water from the city of Phoenix can limit opportunities to establish community gardens.
The other Phoenix examples of successful community gardening have two other commonalities that should be taken into account in Midtown. First, there is a strong lead organization that is trusted by area residents. This organization typically has a strong focus on overall health and wellness. Second, while a backbone organization manages the garden, residents provide the vision. Successful community gardens are resident-driven.
Temporary Food Retailers
Temporary food retailers can take a number of different forms, such as mobile grocery stores, fresh produce stands, community supported agriculture drop-off sites and farmers’ markets. By providing a space for healthy food retailers to sell within the community on a regular basis, residents could reduce or completely replace trips by car to the supermarket and decrease dependency on unhealthy food sold at convenience stores or the fast food restaurants that are common in their community. Map 12 depicts recommended sites for temporary food retailers.
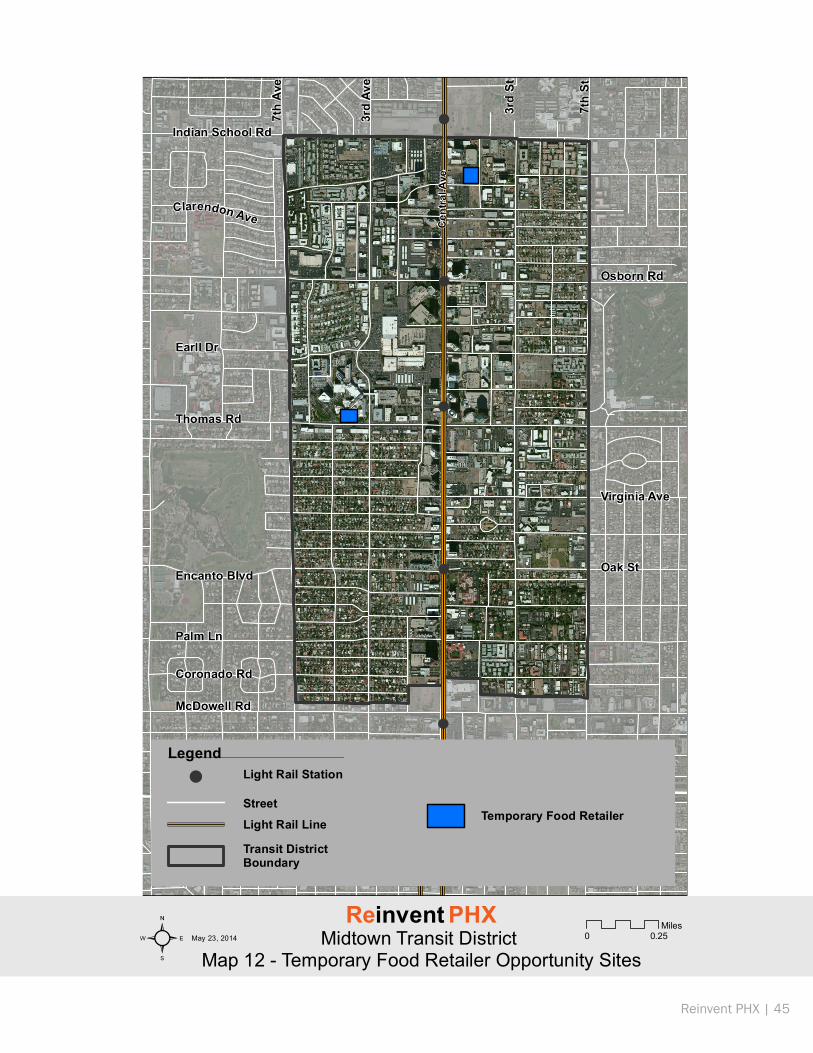
!
!
!
!
!
!
Indian School Rd
Osborn Rd
Thomas Rd
Earll Dr
Encanto Blvd
Palm Ln
Coronado Rd
McDowell Rd
Oak St
Virginia Ave
7th
Ave
3rd
Ave
Cen
tral
Ave
7th
St
3rd
St
Clarendon Ave
0 0.25Miles
Light Rail Station
Light Rail Line
Street
Transit District Boundary
!
² May 23, 2014 Midtown Transit District Map 12 - Temporary Food Retailer Opportunity Sites
Reinvent PHX
Legend
Temporary Food Retailer
Reinvent PHX | 45
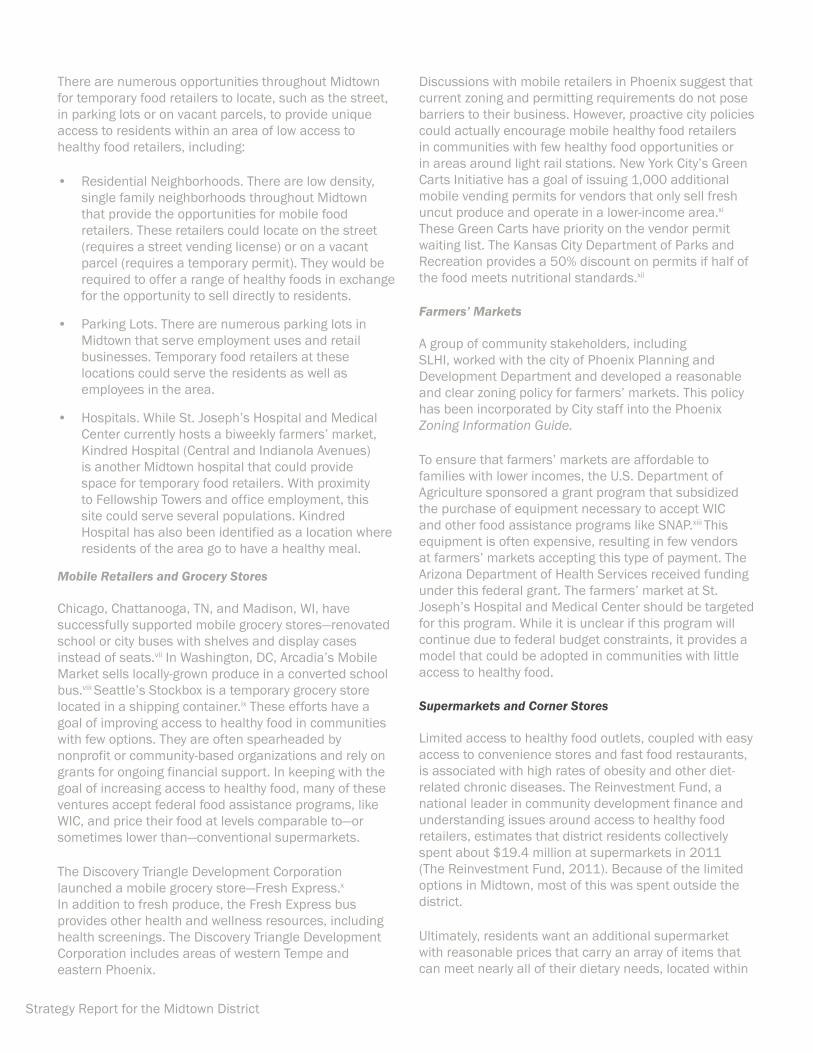
Strategy Report for the Midtown District
There are numerous opportunities throughout Midtown for temporary food retailers to locate, such as the street, in parking lots or on vacant parcels, to provide unique access to residents within an area of low access to healthy food retailers, including:
• Residential Neighborhoods. There are low density, single family neighborhoods throughout Midtown that provide the opportunities for mobile food retailers. These retailers could locate on the street (requires a street vending license) or on a vacant parcel (requires a temporary permit). They would be required to offer a range of healthy foods in exchange for the opportunity to sell directly to residents.
• Parking Lots. There are numerous parking lots in Midtown that serve employment uses and retail businesses. Temporary food retailers at these locations could serve the residents as well as employees in the area.
• Hospitals. While St. Joseph’s Hospital and Medical Center currently hosts a biweekly farmers’ market, Kindred Hospital (Central and Indianola Avenues) is another Midtown hospital that could provide space for temporary food retailers. With proximity to Fellowship Towers and office employment, this site could serve several populations. Kindred Hospital has also been identified as a location where residents of the area go to have a healthy meal.
Mobile Retailers and Grocery Stores
Chicago, Chattanooga, TN, and Madison, WI, have successfully supported mobile grocery stores—renovated school or city buses with shelves and display cases instead of seats.vii In Washington, DC, Arcadia’s Mobile Market sells locally-grown produce in a converted school bus.viii Seattle’s Stockbox is a temporary grocery store located in a shipping container.ix These efforts have a goal of improving access to healthy food in communities with few options. They are often spearheaded by nonprofit or community-based organizations and rely on grants for ongoing financial support. In keeping with the goal of increasing access to healthy food, many of these ventures accept federal food assistance programs, like WIC, and price their food at levels comparable to—or sometimes lower than—conventional supermarkets.
The Discovery Triangle Development Corporation launched a mobile grocery store—Fresh Express.x
In addition to fresh produce, the Fresh Express bus provides other health and wellness resources, including health screenings. The Discovery Triangle Development Corporation includes areas of western Tempe and eastern Phoenix.
Discussions with mobile retailers in Phoenix suggest that current zoning and permitting requirements do not pose barriers to their business. However, proactive city policies could actually encourage mobile healthy food retailers in communities with few healthy food opportunities or in areas around light rail stations. New York City’s Green Carts Initiative has a goal of issuing 1,000 additional mobile vending permits for vendors that only sell fresh uncut produce and operate in a lower-income area.xi
These Green Carts have priority on the vendor permit waiting list. The Kansas City Department of Parks and Recreation provides a 50% discount on permits if half of the food meets nutritional standards.xii
Farmers’ Markets
A group of community stakeholders, including SLHI, worked with the city of Phoenix Planning and Development Department and developed a reasonable and clear zoning policy for farmers’ markets. This policy has been incorporated by City staff into the Phoenix Zoning Information Guide.
To ensure that farmers’ markets are affordable to families with lower incomes, the U.S. Department of Agriculture sponsored a grant program that subsidized the purchase of equipment necessary to accept WIC and other food assistance programs like SNAP.xiii This equipment is often expensive, resulting in few vendors at farmers’ markets accepting this type of payment. The Arizona Department of Health Services received funding under this federal grant. The farmers’ market at St. Joseph’s Hospital and Medical Center should be targeted for this program. While it is unclear if this program will continue due to federal budget constraints, it provides a model that could be adopted in communities with little access to healthy food.
Supermarkets and Corner Stores
Limited access to healthy food outlets, coupled with easy access to convenience stores and fast food restaurants, is associated with high rates of obesity and other diet-related chronic diseases. The Reinvestment Fund, a national leader in community development finance and understanding issues around access to healthy food retailers, estimates that district residents collectively spent about $19.4 million at supermarkets in 2011 (The Reinvestment Fund, 2011). Because of the limited options in Midtown, most of this was spent outside the district.
Ultimately, residents want an additional supermarket with reasonable prices that carry an array of items that can meet nearly all of their dietary needs, located within
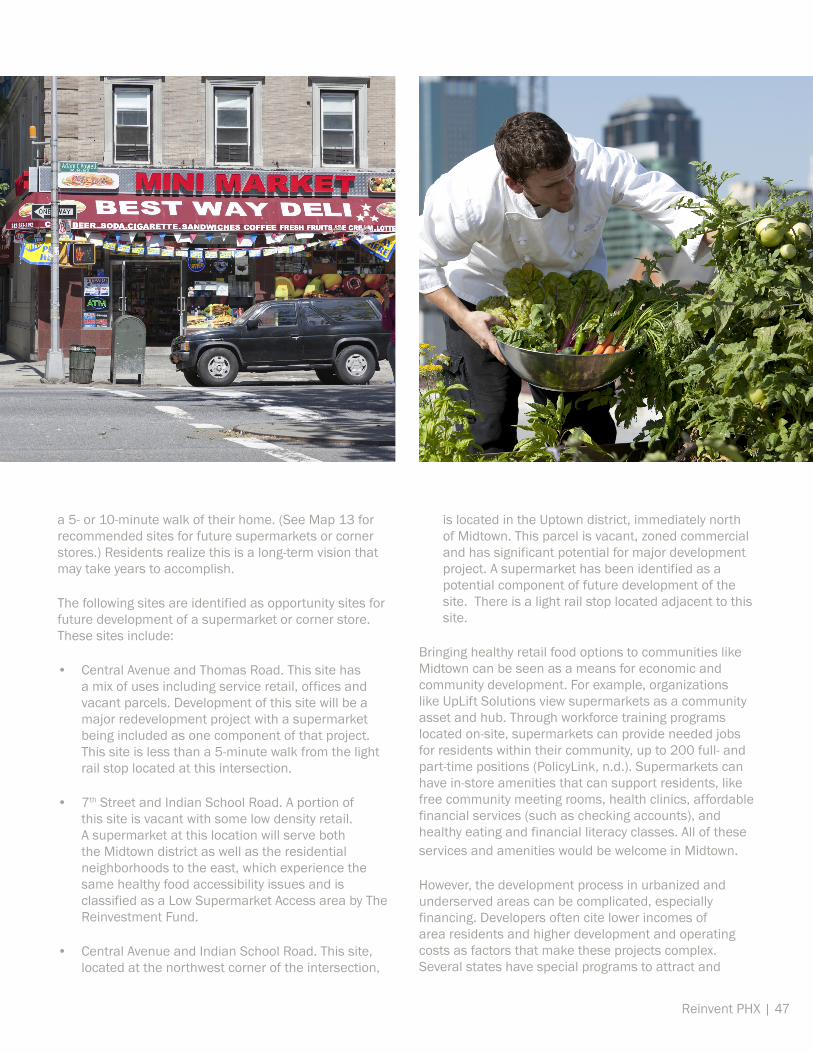
Reinvent PHX | 47
a 5- or 10-minute walk of their home. (See Map 13 for recommended sites for future supermarkets or corner stores.) Residents realize this is a long-term vision that may take years to accomplish.
The following sites are identified as opportunity sites for future development of a supermarket or corner store. These sites include:
• Central Avenue and Thomas Road. This site has a mix of uses including service retail, offices and vacant parcels. Development of this site will be a major redevelopment project with a supermarket being included as one component of that project. This site is less than a 5-minute walk from the light rail stop located at this intersection.
• 7th Street and Indian School Road. A portion of this site is vacant with some low density retail. A supermarket at this location will serve both the Midtown district as well as the residential neighborhoods to the east, which experience the same healthy food accessibility issues and is classified as a Low Supermarket Access area by The Reinvestment Fund.
• Central Avenue and Indian School Road. This site, located at the northwest corner of the intersection,
is located in the Uptown district, immediately north of Midtown. This parcel is vacant, zoned commercial and has significant potential for major development project. A supermarket has been identified as a potential component of future development of the site. There is a light rail stop located adjacent to this site.
Bringing healthy retail food options to communities like Midtown can be seen as a means for economic and community development. For example, organizations like UpLift Solutions view supermarkets as a community asset and hub. Through workforce training programs located on-site, supermarkets can provide needed jobs for residents within their community, up to 200 full- and part-time positions (PolicyLink, n.d.). Supermarkets can have in-store amenities that can support residents, like free community meeting rooms, health clinics, affordable financial services (such as checking accounts), and healthy eating and financial literacy classes. All of these services and amenities would be welcome in Midtown.
However, the development process in urbanized and underserved areas can be complicated, especially financing. Developers often cite lower incomes of area residents and higher development and operating costs as factors that make these projects complex. Several states have special programs to attract and
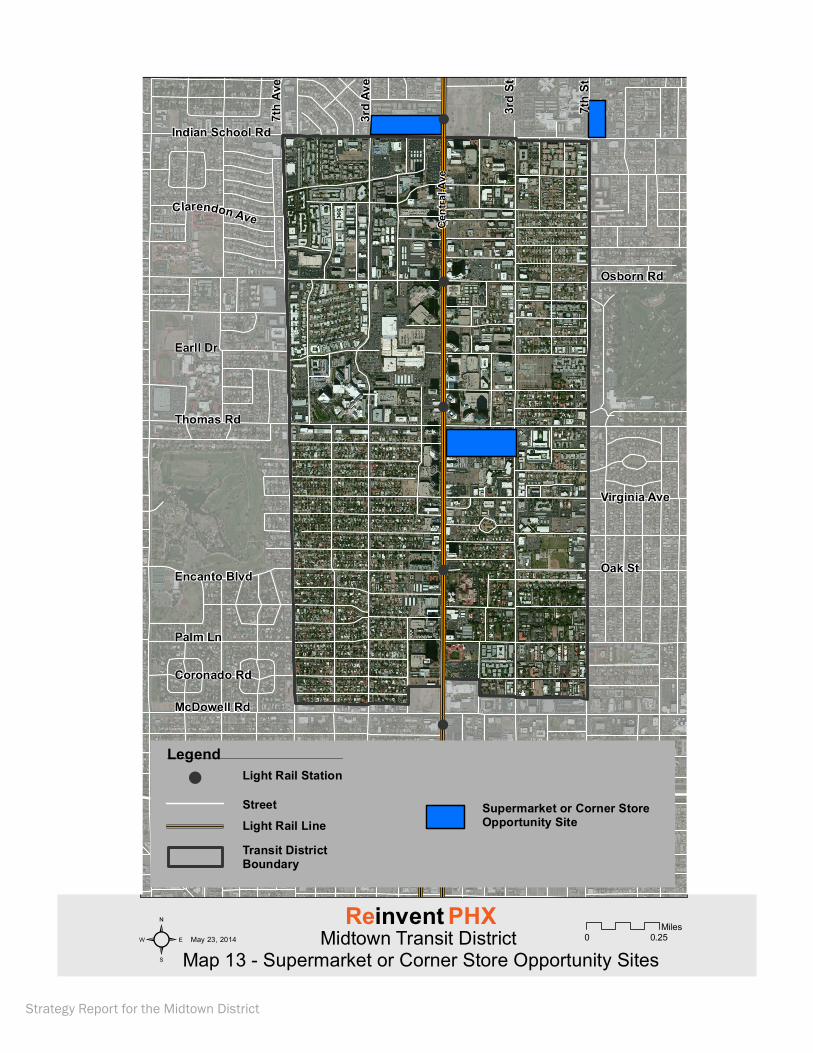
!
!
!
!
!
!
Indian School Rd
Osborn Rd
Thomas Rd
Earll Dr
Encanto Blvd
Palm Ln
Coronado Rd
McDowell Rd
Oak St
Virginia Ave
7th
Ave
3rd
Ave
Cen
tral
Ave
7th
St
3rd
St
Clarendon Ave
0 0.25Miles
Light Rail Station
Light Rail Line
Street
Transit District Boundary
!
² May 23, 2014 Midtown Transit District Map 13 - Supermarket or Corner Store Opportunity Sites
Reinvent PHX
Legend
Supermarket or Corner Store Opportunity Site
Strategy Report for the Midtown District
Reinvent PHX | 49
launch supermarkets in communities like Midtown. These programs are often funded through state or philanthropic funding or a mix of sources. For in-fill development, many communities rely on tax incentives to attract a supermarket, most notably tax increment financing, a tool that is not available in Arizona. Any supermarket attracted to communities like Midtown will be a unique blend of private and public funds from a variety of sources and incentives provided by the state or community.
Pennsylvania’s Fresh Food Financing Initiative has helped develop supermarkets and other fresh food outlets in 78 underserved urban and rural areas, creating or retaining 4,860 jobs while increasing access to healthy food for nearly 500,000 residents (PolicyLink & The Food Trust, 2010). This Initiative was initially funded with $30 million of state funding, but was able to attract an additional $120 million in low-interest financing from private sources. The California FreshWorks fund is a public-private partnership loan fund that raised $264 million to invest in bringing supermarkets and other forms of healthy food retailers to underserved communities, of which approximately $45 million is from private investors including Dignity Health.xiv The CDC (n.d.) highlights various financing policies that have been initiated to strengthen financing options for healthy food retailers.
Cities can also provide incentives to attract supermarkets to a particular area. These incentives can take many forms, including: flexibility with zoning and development regulations; waiving fees, such as permit and impact; discounted city-owned land; site preparation assistance; property tax abatement; and investment in transportation infrastructure, such as street or sidewalk improvements.xv
Recommended Policies
1. Develop the necessary partnerships to promote community gardening in Midtown, including partners to provide gardening technical assistance, tools and necessary land.
2. In collaboration with partners and PHX Renews, develop a streamlined process to identify and use city-owned land for community gardens or urban agriculture.
3. Encourage urban agriculture by considering incentives such as a special water rate category, removal of sewer fees and reduced water meter hookup fees for urban agriculture water users.
4. Develop incentives to encourage temporary healthy
food retailers in Midtown. Prioritize the use of vacant lots for this purpose. Reduce fees and application waiting time to target these areas. Partner with the existing PHX Renews initiative.
5. As additional farmers’ markets open in Midtown, work with Arizona Department of Health Services and the Maricopa County Department of Health to purchase equipment that allows these markets to accept WIC and other food assistance programs.
6. Develop public-private partnerships using the tools listed for this strategy to attract a new supermarket in the Midtown district. As a condition of the partnership, require the new supermarket to accept WIC and other food assistance programs including SNAP.
Tools for Implementation of Food Strategies
Community Development Block Grant
This program can be used to fund park amenities, playgrounds, neighborhood streetscapes, landscaping, and other physical improvements in a neighborhood. Eligible applicants include neighborhood associations or other nonprofit organizations in partnership with a city of Phoenix department.
Community Food Projects Competitive Grants Program
Community Food Projects are designed to increase food security by bringing the whole food system together to assess strengths, establish linkages, and create systems that improve the self-reliance of community members over their food needs. Projects funded by this grant include: expanding access to healthy and local foods in a low-income, high-unemployment area by employing teens to develop community gardens and market their produce; establishing a county-wide operation of community kitchens for micro-enterprise development with low-income participation and leadership; and improving access to healthy foods through a variety of methods, including supermarket development, promoting local produce, a community kitchen and educational programs.
Community Reinvestment Act
The federal Community Reinvestment Act (CRA) encourages banks to invest in lower income communities. The Act requires financial institutions, like
Strategy Report for the Midtown District
banks and credit unions, to provide loans in communities where they have branches. Before CRA, many banks would provide checking and saving services, but not loans, in lower income communities or communities of color. CRA requires financial institutions to proactively assess community needs and develop financial products for communities where it has branches. Partly due to CRA requirements, banks are now more active in providing financing for the development or expansion of businesses in low-income communities, often with favorable rates.
Farmers Market Promotion Program
The Farmers Market Promotions Program offers grants to help improve and expand domestic farmers’ markets, roadside stands, community-supported agriculture programs, agritourism activities, and other direct producer-to-consumer market opportunities. Agricultural cooperatives, producer networks, producer associations, local governments, nonprofit organizations, public benefit corporations, economic development corporations, regional farmers’ market authorities, and tribal governments are among those eligible to apply.
Healthy Food Financing Initiative
The Healthy Food Financing Initiative can help finance new or improve existing stores that sell healthy food. The Initiative is a set of federal programs that support projects to increase access to healthy, affordable food in communities that currently lack these options. Federal grants, loans and tax credits provide incentives to expand the availability of nutritious food, including developing and equipping small retailers and corner stores.
New Markets Tax Credit
The New Markets Tax Credit program can assist certain community development organizations in developing community assets like healthy food retailers in lower income communities. It is a federal program that focuses on attracting business and real estate investment into lower income neighborhoods and communities. In exchange for a federal tax credit, individuals or
corporations make an investment in a community-based organization that has a primary mission of serving the community and has accountability to area residents. As of 2012, Phoenix has six community development entities.
Supplemental Nutrition Assistance Program (SNAP)
Formerly known as food stamps, SNAP is a federal program that provides financial assistance for low-income people to purchase food. The amount of SNAP benefits a household gets depends on the household’s size and income.
WIC Program
The Special Supplemental Nutrition Program for Women, Infants and Children (WIC) is a program administered by the Arizona Department of Health Services that provides vouchers to purchase certain healthy foods, such as milk, whole wheat bread, eggs, fresh fruits and vegetables. WIC assistance targets low-income pregnant, postpartum and breastfeeding women, infants and children up to age five. Not all food retailers accept WIC vouchers. Retailers that accept WIC must agree to carry a certain variety of healthy food.
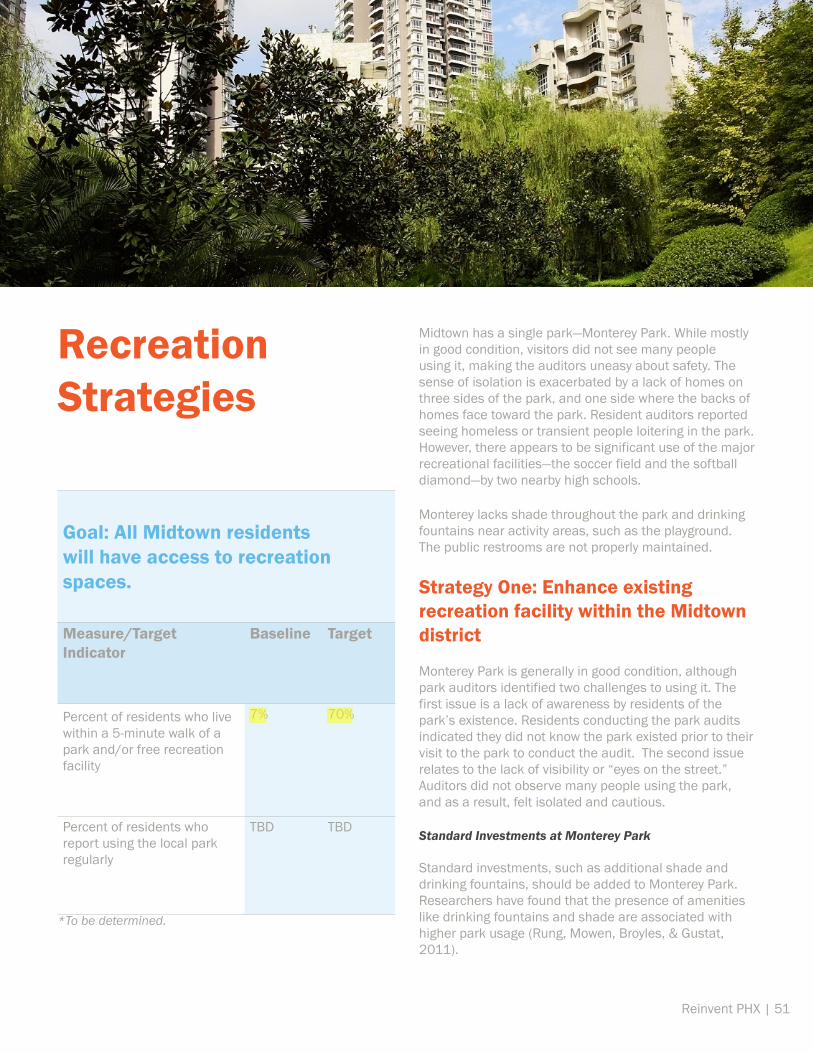
Reinvent PHX | 51
Recreation Strategies
Goal: All Midtown residents will have access to recreation spaces.
Measure/Target Indicator
Baseline Target
Percent of residents who live within a 5-minute walk of a park and/or free recreation facility
7% 70%
Percent of residents who report using the local park regularly
TBD TBD
*To be determined.
Midtown has a single park—Monterey Park. While mostly in good condition, visitors did not see many people using it, making the auditors uneasy about safety. The sense of isolation is exacerbated by a lack of homes on three sides of the park, and one side where the backs of homes face toward the park. Resident auditors reported seeing homeless or transient people loitering in the park. However, there appears to be significant use of the major recreational facilities—the soccer field and the softball diamond—by two nearby high schools.
Monterey lacks shade throughout the park and drinking fountains near activity areas, such as the playground. The public restrooms are not properly maintained.
Strategy One: Enhance existing recreation facility within the Midtown district
Monterey Park is generally in good condition, although park auditors identified two challenges to using it. The first issue is a lack of awareness by residents of the park’s existence. Residents conducting the park audits indicated they did not know the park existed prior to their visit to the park to conduct the audit. The second issue relates to the lack of visibility or “eyes on the street.” Auditors did not observe many people using the park, and as a result, felt isolated and cautious.
Standard Investments at Monterey Park
Standard investments, such as additional shade and drinking fountains, should be added to Monterey Park. Researchers have found that the presence of amenities like drinking fountains and shade are associated with higher park usage (Rung, Mowen, Broyles, & Gustat, 2011).
063415
Highlight
063415
Highlight
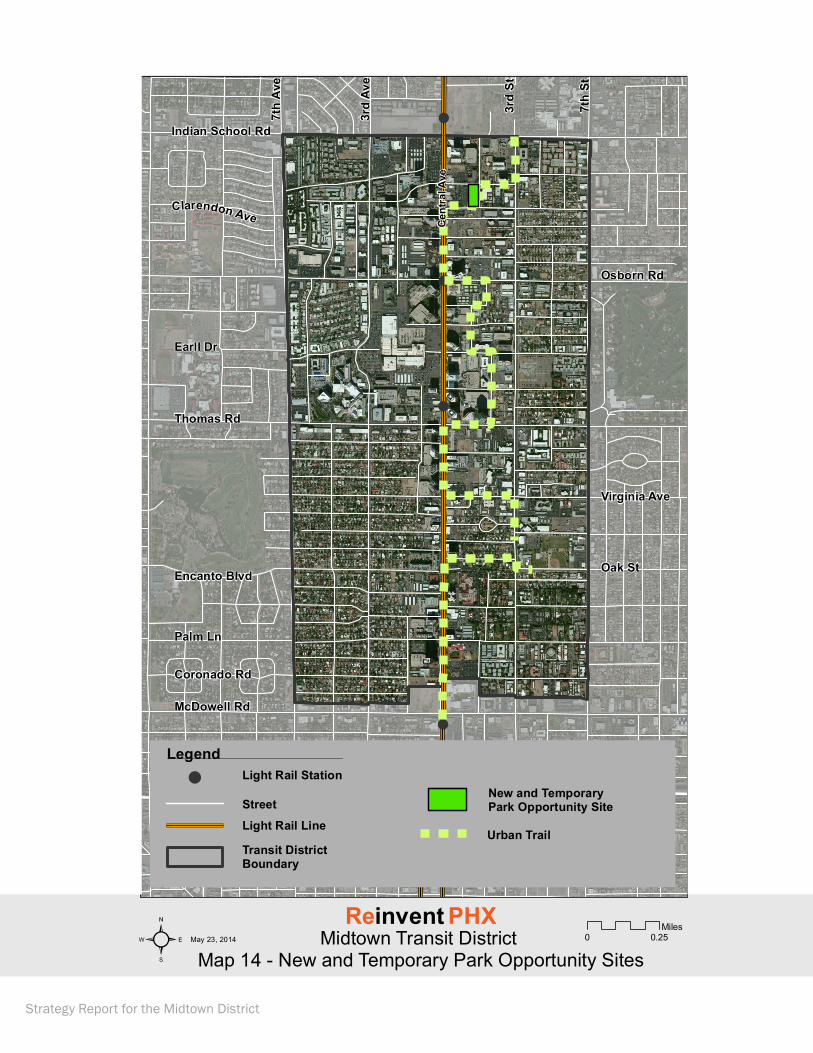
!
!
!
!
!
!
Indian School Rd
Osborn Rd
Thomas Rd
Earll Dr
Encanto Blvd
Palm Ln
Coronado Rd
McDowell Rd
Oak St
Virginia Ave
7th
Ave
3rd
Ave
Cen
tral
Ave
7th
St
3rd
St
Clarendon Ave
0 0.25Miles
Light Rail Station
Light Rail Line
Street
Transit District Boundary
!
² May 23, 2014 Midtown Transit District Map 14 - New and Temporary Park Opportunity Sites
Reinvent PHX
Legend
New and Temporary Park Opportunity Site
Urban Trail
Strategy Report for the Midtown District
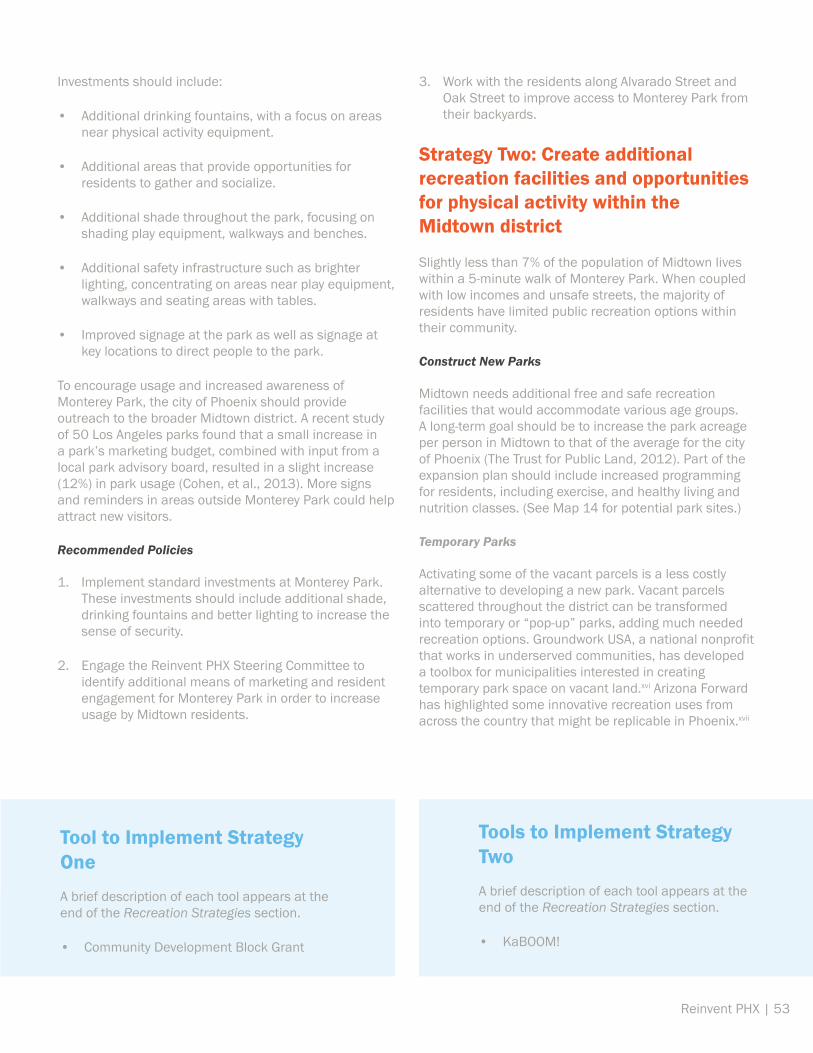
Tool to Implement Strategy OneA brief description of each tool appears at the end of the Recreation Strategies section.
• Community Development Block Grant
Tools to Implement Strategy TwoA brief description of each tool appears at the end of the Recreation Strategies section.
• KaBOOM!
Reinvent PHX | 53
Investments should include:
• Additional drinking fountains, with a focus on areas near physical activity equipment.
• Additional areas that provide opportunities for residents to gather and socialize.
• Additional shade throughout the park, focusing on shading play equipment, walkways and benches.
• Additional safety infrastructure such as brighter lighting, concentrating on areas near play equipment, walkways and seating areas with tables.
• Improved signage at the park as well as signage at key locations to direct people to the park.
To encourage usage and increased awareness of Monterey Park, the city of Phoenix should provide outreach to the broader Midtown district. A recent study of 50 Los Angeles parks found that a small increase in a park’s marketing budget, combined with input from a local park advisory board, resulted in a slight increase (12%) in park usage (Cohen, et al., 2013). More signs and reminders in areas outside Monterey Park could help attract new visitors.
Recommended Policies
1. Implement standard investments at Monterey Park. These investments should include additional shade, drinking fountains and better lighting to increase the sense of security.
2. Engage the Reinvent PHX Steering Committee to identify additional means of marketing and resident engagement for Monterey Park in order to increase usage by Midtown residents.
3. Work with the residents along Alvarado Street and Oak Street to improve access to Monterey Park from their backyards.
Strategy Two: Create additional recreation facilities and opportunities for physical activity within the Midtown district
Slightly less than 7% of the population of Midtown lives within a 5-minute walk of Monterey Park. When coupled with low incomes and unsafe streets, the majority of residents have limited public recreation options within their community.
Construct New Parks
Midtown needs additional free and safe recreation facilities that would accommodate various age groups. A long-term goal should be to increase the park acreage per person in Midtown to that of the average for the city of Phoenix (The Trust for Public Land, 2012). Part of the expansion plan should include increased programming for residents, including exercise, and healthy living and nutrition classes. (See Map 14 for potential park sites.)
Temporary Parks
Activating some of the vacant parcels is a less costly alternative to developing a new park. Vacant parcels scattered throughout the district can be transformed into temporary or “pop-up” parks, adding much needed recreation options. Groundwork USA, a national nonprofit that works in underserved communities, has developed a toolbox for municipalities interested in creating temporary park space on vacant land.xvi Arizona Forward has highlighted some innovative recreation uses from across the country that might be replicable in Phoenix.xvii
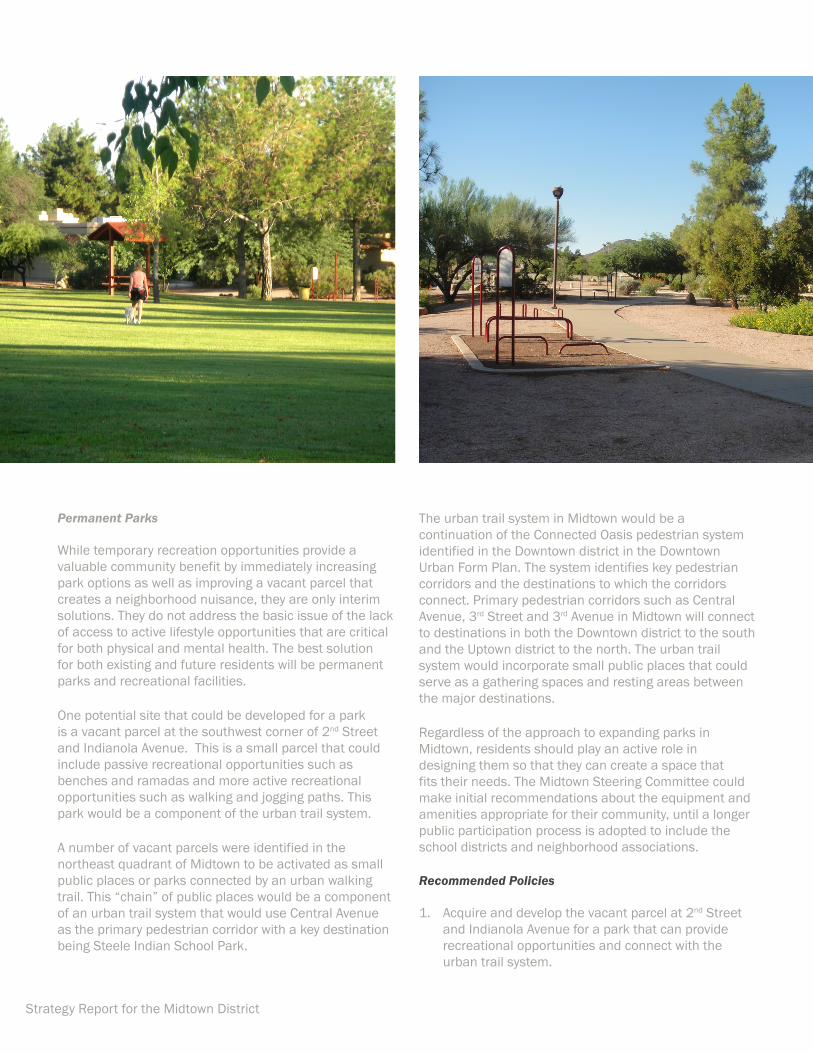
Strategy Report for the Midtown District
Permanent Parks
While temporary recreation opportunities provide a valuable community benefit by immediately increasing park options as well as improving a vacant parcel that creates a neighborhood nuisance, they are only interim solutions. They do not address the basic issue of the lack of access to active lifestyle opportunities that are critical for both physical and mental health. The best solution for both existing and future residents will be permanent parks and recreational facilities.
One potential site that could be developed for a park is a vacant parcel at the southwest corner of 2nd Street and Indianola Avenue. This is a small parcel that could include passive recreational opportunities such as benches and ramadas and more active recreational opportunities such as walking and jogging paths. This park would be a component of the urban trail system.
A number of vacant parcels were identified in the northeast quadrant of Midtown to be activated as small public places or parks connected by an urban walking trail. This “chain” of public places would be a component of an urban trail system that would use Central Avenue as the primary pedestrian corridor with a key destination being Steele Indian School Park.
The urban trail system in Midtown would be a continuation of the Connected Oasis pedestrian system identified in the Downtown district in the Downtown Urban Form Plan. The system identifies key pedestrian corridors and the destinations to which the corridors connect. Primary pedestrian corridors such as Central Avenue, 3rd Street and 3rd Avenue in Midtown will connect to destinations in both the Downtown district to the south and the Uptown district to the north. The urban trail system would incorporate small public places that could serve as a gathering spaces and resting areas between the major destinations.
Regardless of the approach to expanding parks in Midtown, residents should play an active role in designing them so that they can create a space that fits their needs. The Midtown Steering Committee could make initial recommendations about the equipment and amenities appropriate for their community, until a longer public participation process is adopted to include the school districts and neighborhood associations.
Recommended Policies
1. Acquire and develop the vacant parcel at 2nd Street and Indianola Avenue for a park that can provide recreational opportunities and connect with the urban trail system.
Tools to Implement Strategy ThreeA brief description of each tool appears at the end of the Recreation Strategies section.
• Community Development Block Grant
• Surface Transportation Program
Reinvent PHX | 55
2. Expand the PHX Renews initiative to activate vacant parcels within Midtown for recreation purposes, specifically those parcels identified as components of the urban trail system.
3. Expand park and recreation opportunities for Midtown residents and ensure those opportunities are provided within a 10-minute walk of homes, schools and businesses in order to encourage more physically and socially active lifestyles.
Strategy Three: Improve and enhance the physical environment to encourage residents to walk or bicycle in the Midtown district
Recreation and street infrastructure are closely linked on several fronts. With well-designed streets, residents would walk or bike to recreation facilities or a neighborhood park. The street itself can be a platform for recreation or active transportation by foot or bike. Moreover, walking and biking on neighborhood streets are simple and inexpensive ways to stay physically active.
Residents who live in the northern part of Midtown view Indian School Road a barrier to accessing Steele Indian School Park. Much like the successful Safe Routes to School concept, Safe Routes to Recreation would increase safety infrastructure along key pedestrian and cyclist routes to recreation facilities. The addition or maintenance of sidewalks, bike lanes, crosswalks, drinking fountains, shade and lighting along these key routes would encourage walking and biking to these destinations.
Recommended Policy
1. Ensure that the Safe Routes to Recreation design elements are applied to a 10-minute walking radius around Monterey Park and new parks, as well as routes to parks outside the district that serve residents, such as Steele Indian School Park.
Tools for Implementation of Recreation Strategies
Community Development Block Grant
This program can be used to fund park amenities, playgrounds, neighborhood streetscapes, landscaping, and other physical improvements in a neighborhood. Eligible applicants include neighborhood associations or other nonprofit organizations in partnership with a city of Phoenix department.
KaBOOM!
This organization is a national nonprofit that offers a limited amount of funding toward playground equipment and uses the construction of playgrounds as a community building exercise. KaBOOM! also matches nonprofits and municipal organizations with funding partners.
Surface Transportation Program—Transportation Alternatives
This program is a street funding opportunity that helps expand transportation choices and enhance transportation through transportation enhancement activities, including pedestrian and bicycle infrastructure and safety programs, landscaping beautification, historic preservation and environmental mitigation.

Strategy Report for the Midtown District
This page was left blank intentionally
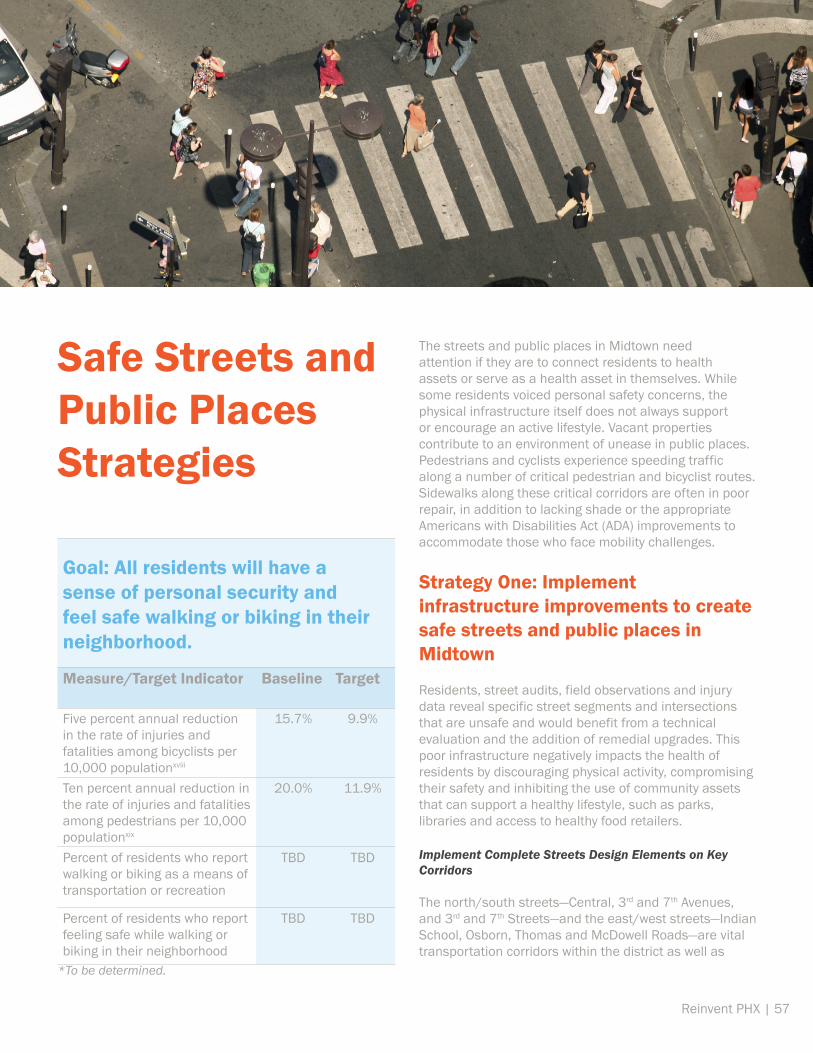
Reinvent PHX | 57
Safe Streets and Public Places Strategies
The streets and public places in Midtown need attention if they are to connect residents to health assets or serve as a health asset in themselves. While some residents voiced personal safety concerns, the physical infrastructure itself does not always support or encourage an active lifestyle. Vacant properties contribute to an environment of unease in public places. Pedestrians and cyclists experience speeding traffic along a number of critical pedestrian and bicyclist routes. Sidewalks along these critical corridors are often in poor repair, in addition to lacking shade or the appropriate Americans with Disabilities Act (ADA) improvements to accommodate those who face mobility challenges.
Strategy One: Implement infrastructure improvements to create safe streets and public places in Midtown
Residents, street audits, field observations and injury data reveal specific street segments and intersections that are unsafe and would benefit from a technical evaluation and the addition of remedial upgrades. This poor infrastructure negatively impacts the health of residents by discouraging physical activity, compromising their safety and inhibiting the use of community assets that can support a healthy lifestyle, such as parks, libraries and access to healthy food retailers.
Implement Complete Streets Design Elements on Key Corridors
The north/south streets—Central, 3rd and 7th Avenues, and 3rd and 7th Streets—and the east/west streets—Indian School, Osborn, Thomas and McDowell Roads—are vital transportation corridors within the district as well as
Goal: All residents will have a sense of personal security and feel safe walking or biking in their neighborhood.
Measure/Target Indicator Baseline Target
Five percent annual reduction in the rate of injuries and fatalities among bicyclists per 10,000 populationxviii
15.7% 9.9%
Ten percent annual reduction in the rate of injuries and fatalities among pedestrians per 10,000 populationxix
20.0% 11.9%
Percent of residents who report walking or biking as a means of transportation or recreation
TBD TBD
Percent of residents who report feeling safe while walking or biking in their neighborhood
TBD TBD
*To be determined.
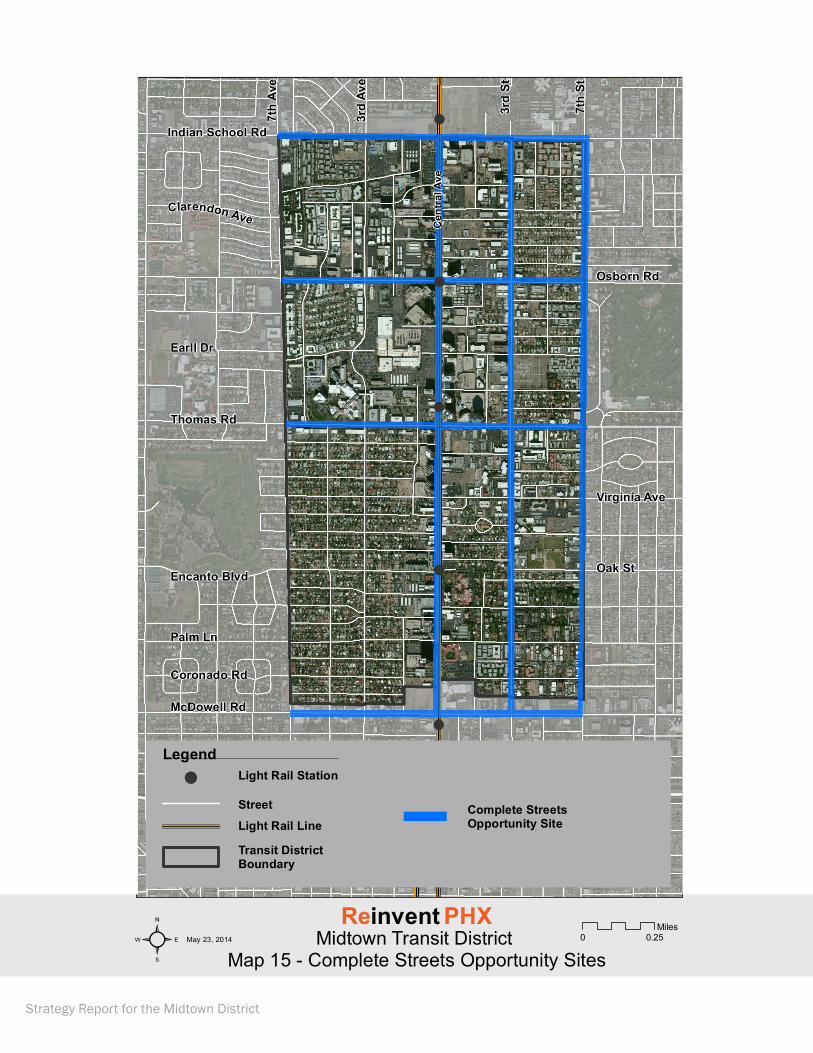
!
!
!
!
!
!
Indian School Rd
Osborn Rd
Thomas Rd
Earll Dr
Encanto Blvd
Palm Ln
Coronado Rd
McDowell Rd
Oak St
Virginia Ave
7th
Ave
3rd
Ave
Cen
tral
Ave
7th
St
3rd
St
Clarendon Ave
0 0.25Miles
Light Rail Station
Light Rail Line
Street
Transit District Boundary
!
² May 23, 2014 Midtown Transit District Map 15 - Complete Streets Opportunity Sites
Reinvent PHX
Legend
Complete Streets Opportunity Site
Strategy Report for the Midtown District
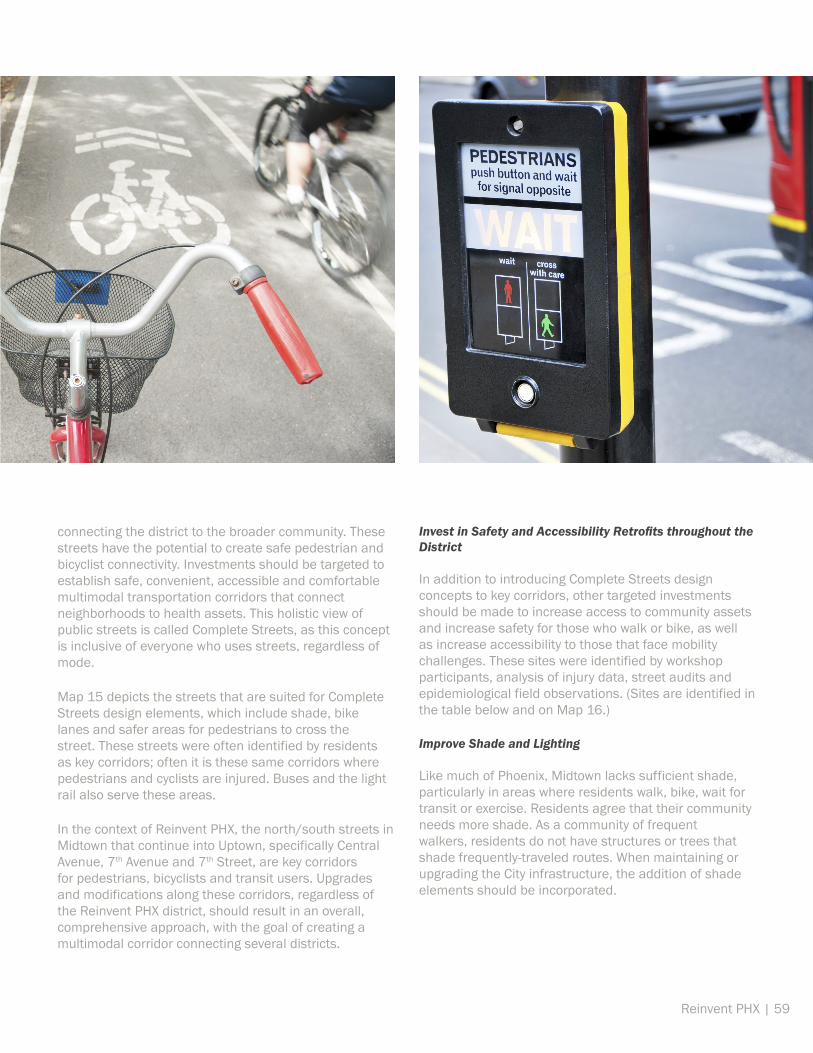
Reinvent PHX | 59
connecting the district to the broader community. These streets have the potential to create safe pedestrian and bicyclist connectivity. Investments should be targeted to establish safe, convenient, accessible and comfortable multimodal transportation corridors that connect neighborhoods to health assets. This holistic view of public streets is called Complete Streets, as this concept is inclusive of everyone who uses streets, regardless of mode.
Map 15 depicts the streets that are suited for Complete Streets design elements, which include shade, bike lanes and safer areas for pedestrians to cross the street. These streets were often identified by residents as key corridors; often it is these same corridors where pedestrians and cyclists are injured. Buses and the light rail also serve these areas.
In the context of Reinvent PHX, the north/south streets in Midtown that continue into Uptown, specifically Central Avenue, 7th Avenue and 7th Street, are key corridors for pedestrians, bicyclists and transit users. Upgrades and modifications along these corridors, regardless of the Reinvent PHX district, should result in an overall, comprehensive approach, with the goal of creating a multimodal corridor connecting several districts.
Invest in Safety and Accessibility Retrofits throughout the District
In addition to introducing Complete Streets design concepts to key corridors, other targeted investments should be made to increase access to community assets and increase safety for those who walk or bike, as well as increase accessibility to those that face mobility challenges. These sites were identified by workshop participants, analysis of injury data, street audits and epidemiological field observations. (Sites are identified in the table below and on Map 16.)
Improve Shade and Lighting
Like much of Phoenix, Midtown lacks sufficient shade, particularly in areas where residents walk, bike, wait for transit or exercise. Residents agree that their community needs more shade. As a community of frequent walkers, residents do not have structures or trees that shade frequently-traveled routes. When maintaining or upgrading the City infrastructure, the addition of shade elements should be incorporated.
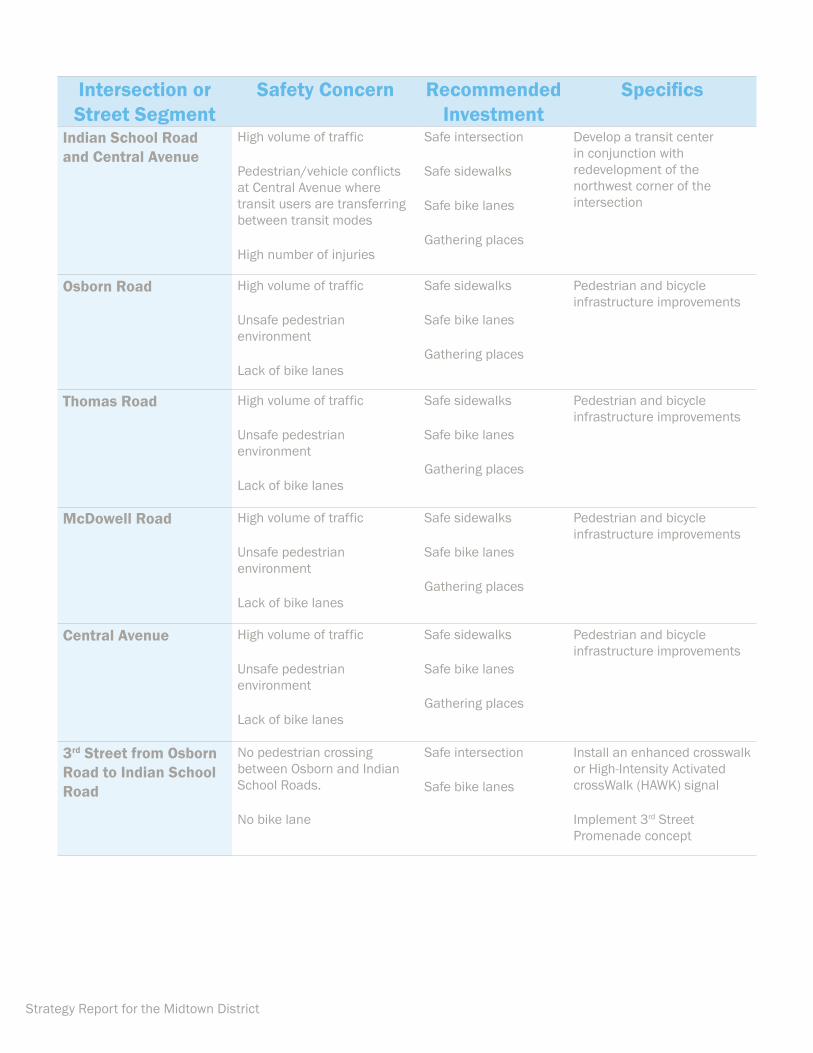
Strategy Report for the Midtown District
Intersection or Street Segment
Safety Concern Recommended Investment
Specifics
Indian School Road and Central Avenue
High volume of traffic
Pedestrian/vehicle conflicts at Central Avenue where transit users are transferring between transit modes
High number of injuries
Safe intersection
Safe sidewalks
Safe bike lanes
Gathering places
Develop a transit center in conjunction with redevelopment of the northwest corner of the intersection
Osborn Road High volume of traffic
Unsafe pedestrian environment
Lack of bike lanes
Safe sidewalks
Safe bike lanes
Gathering places
Pedestrian and bicycle infrastructure improvements
Thomas Road High volume of traffic
Unsafe pedestrian environment
Lack of bike lanes
Safe sidewalks
Safe bike lanes
Gathering places
Pedestrian and bicycle infrastructure improvements
McDowell Road High volume of traffic
Unsafe pedestrian environment
Lack of bike lanes
Safe sidewalks
Safe bike lanes
Gathering places
Pedestrian and bicycle infrastructure improvements
Central Avenue High volume of traffic
Unsafe pedestrian environment
Lack of bike lanes
Safe sidewalks
Safe bike lanes
Gathering places
Pedestrian and bicycle infrastructure improvements
3rd Street from Osborn Road to Indian School Road
No pedestrian crossing between Osborn and Indian School Roads.
No bike lane
Safe intersection
Safe bike lanes
Install an enhanced crosswalk or High-Intensity Activated crossWalk (HAWK) signal
Implement 3rd Street Promenade concept
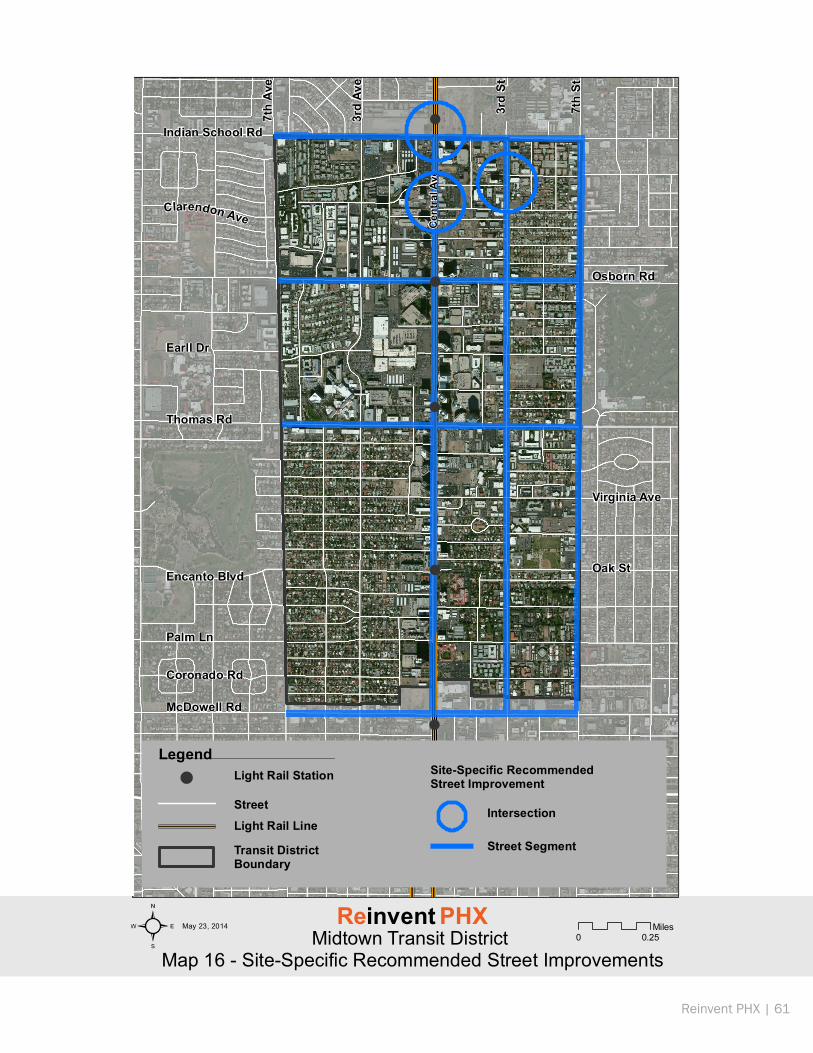
!
!
!
!
!
!
Indian School Rd
Osborn Rd
Thomas Rd
Earll Dr
Encanto Blvd
Palm Ln
Coronado Rd
McDowell Rd
Oak St
Virginia Ave
7th
Ave
3rd
Ave
Cen
tral
Ave
7th
St
3rd
St
Clarendon Ave
0 0.25Miles
Light Rail Station
Light Rail Line
Street
Transit District Boundary
!
² May 23, 2014
Midtown Transit District Map 16 - Site-Specific Recommended Street Improvements
Reinvent PHX
LegendSite-Specific Recommended Street Improvement
Intersection
Street Segment
Reinvent PHX | 61
Tools to Implement Strategy OneA brief description of each tool is at the end of the Safe Streets and Public Spaces section.
• Capital Improvement Program
• Community Development Block Grant
• New Freedom Program
• Partnership for a Healthier America
Strategy Report for the Midtown District
While a number of existing resources promote planting and caring for trees, residents may be unaware of those resources. Additionally, residents with a tight budget may be unable to afford the additional cost of regular watering—a necessity in Phoenix. One example of a volunteer group that supports urban trees is TreePeople.xx In addition to general education and tree planting events, volunteers provide care for trees, including watering and maintenance. The Phoenix Shade and Tree Master Plan provides more examples of how other cities have supported and expanded their urban forests.xxi
When asked about street lighting, residents regularly identified the lack of lighting as a major issue. Adding more lighting, in addition to ensuring that existing lighting is well-maintained, should be a priority throughout the district.
Recommended Policies
1. Prioritize the key corridors for Complete Streets upgrades, ensuring they are convenient, accessible, comfortable and safe for pedestrians, bicyclists and transit users. (See Map 15 for locations.)
2. In addition to the common design elements of Complete Streets, invest in safety and accessibility retrofits in the following areas. (See Map 16 for locations.)
3. Ensure that the Safe Routes to School design elements are applied to a 10-minute walking radius around Monterey Elementary, St. Mary’s High School and several charter schools located in Midtown.
4. Match residents with existing no- and low-cost tree resources, including those sponsored by the City, Arizona Public Service Company and Salt River Project. Develop partnerships to assist low-income residents with ongoing maintenance and watering assistance.
Strategy Two: Implement programs that support safe streets and public places in Midtown
A lack of community cohesion and the presence of vacant lots and abandoned buildings create additional barriers for walking and biking in this community.
Community Organizing and Engagement
One step in creating a safer and more cohesive community—and implementing many of the strategies in this document—is providing an organized outlet for residents to identify community concerns and advocate for change at the neighborhood level, such as neighborhood associations. These resident-led groups are often incubators for actions like Block Watch programs or walking groups that increase community safety as well as improve community and individual health. They also provide a platform for residents to collectively advocate for change in their community and seek city funding for community development projects through Block Watch grants.
Residents in some neighborhoods of the Midtown district rely on neighborhood associations as a means for policy change and advocacy. The city of Phoenix has an existing infrastructure through which to engage neighborhood groups—the Neighborhood Services Department (NSD). NSD has staff that act as a liaison between neighborhood groups and the city government. NSD also has education programs, like Neighborhood College and the Good Neighbor Program that can increase the ability of residents to identify and carry through with solutions to community-identified challenges.
While the Midtown district has strong neighborhood associations in the Willo, Alvarado, and Arts District North neighborhoods, residents of other areas in Midtown are not well represented. NSD should assist with creating a new neighborhood association or assist existing neighborhood associations to better engage these residents.
Tools to Implement Strategy Two
A brief description of each tool is at the end of the Safe Streets and Public Spaces section.
• Community Development Block Grant
• Hospital Community Benefit Requirement
• Neighborhood Association
• Partnership for a Healthier America
Reinvent PHX | 63
At a national level, the Robert Wood Johnson Foundation’s Healthy Kids Healthy Communities initiative focuses on changing public policy to reduce childhood obesity through local advocacy efforts. The Foundation’s grantees have documented many of their strategies to advocate for change in the built environment, including access to healthy food and parks.xxii These strategies can be helpful to Midtown residents.
Activate Vacant Properties
The abundance of vacant buildings and land contributes to criminal activities and detracts from the appearance of the district. Vacant buildings are not maintained and vacant parcels are frequently covered with weeds and garbage. Vacant buildings, if not secure, can become sites for illegal activities, exacerbating safety problems and perceptions. In 2012, the city of Phoenix initiated PHX Renews, which brings temporary public uses to vacant land. When coupled with the lack of healthy food and recreation space, PHX Renews could address several of the community’s most pressing problems by using these sites for the purposes of increasing access to healthy food and recreation. Strategies for pop-up parks and agriculture or gardening are discussed in the previous sections. Until those strategies can be implemented, trash and debris should be removed from these sites.
Midtown Injury Reduction Coalition
St. Joseph’s Hospital and Medical Center is a Level I trauma center that is located within and serves the Midtown community. In order to maintain this status, trauma centers must respond to and develop interventions around injuries that are treated on a
regular basis. Through street audits, field observations and injury analysis completed for the Existing Conditions Report, there is a more comprehensive understanding of the types of traffic-related injuries that occur in Midtown.
Developing a district-level coalition--built around responding to place-based injury data--can lead to appropriate and preventative responses to ongoing injury problems. Activities that could be supported include distribution of bicycle safety equipment, pedestrian safety education and organizing walking clubs. When paired with environmental changes to the streets, this coalition could be a powerful mechanism for targeted public education efforts.
Recommended Policies
1. Work with residents in neighborhoods without a neighborhood association to form a new neighborhood association.
2. Use the PHX Renews Initiative to activate vacant lots within the Midtown district for uses such as community gardens, pop-up parks and other types of public places.
3. Create a coalition of residents, law enforcement, fire department, the Street Transportation Department, and St. Joseph’s Hospital & Medical Center to develop strategies to reduce traffic-related injuries.
Strategy Three: Increase the quality, access and safety for transit users in Midtown
Many Midtown residents rely on the bus and light rail systems as a means of transportation. Rider infrastructure should be improved throughout the district. When a bus shelter is provided, the shade is inadequate during hot months. The bus shelters are often have litter and some are without necessary upgrades to meet ADA standards. Some stops have little more than a Valley Metro sign. Shade, seating, lighting and better maintenance are needed at all bus stops.
New York City places a priority in getting transit riders safely from the street environment to the transit-rider environment in order to make using the transit system easier and more convenient. Its Safe Routes to Transit program focuses on improving safety and relieving congestion at transit stops as well as improving sidewalks, crosswalks and the overall walking environment around transit stops.xxiii
Strategy Report for the Midtown District
Recommended Policies
1. Develop and execute a Safe Routes to Transit program.
2. Design a bus shelter that provides adequate shade, seating and an information kiosk that provides riders with bus schedule information.
3. Work with the Midtown Steering Committee and neighborhood representatives to address ADA issues throughout the district to enhance access to bus shelters as well as encourage residents to use public transit.
Tools to Implement Safe Streets and Public places
Capital Improvement Program
The Phoenix Capital Improvement Program (CIP) provides a roadmap for expenditure of city funds to construct public infrastructure, such as streets improvements, land acquisition to expand the park system and the construction of new police stations. The CIP prioritizes projects and outlines potential funding sources for five-year time increments and is updated on an annual basis. The Program goes through a public hearing process where residents can weigh in on various priorities.
Community Development Block Grant (CDBG)
CDBG grants can be used to fund park amenities, playgrounds, neighborhood streetscaping, landscaping, and other physical improvements in a neighborhood. Eligible applicants include neighborhood associations or other nonprofit organizations in partnership with a city of Phoenix department.
Partnership for a Healthier America
This project is a partnership with the Blue Cross Blue Shield Association and provides funding to get kids and communities out and active by creating Play Streets—roads closed to traffic and open to the community to encourage physical activity.
Neighborhood Association
The City of Providence, RI (n.d.) describes a neighborhood association as “a group of residents who meet regularly to accomplish specific goals in their neighborhood. The association may include homeowners, renters, business owners, school faculty or staff, church officials and members of nonprofit organizations. Depending on the goals of the group, meetings may be held twice a year, once a quarter or every month. Neighborhood associations help identify challenges and concerns, support change and improvement efforts, help resolve conflicts, provide volunteers for community initiatives, represent the neighborhood as a whole to elected officials and find resources to make the neighborhood a better place to live. Before forming a neighborhood association, it is important to define or understand the goals of the proposed neighborhood association.” In other Phoenix neighborhoods, the Neighborhood Services Department has been instrumental in starting or strengthening neighborhood associations, especially when a proactive staff person is assigned.
Hospital Community Benefit Requirement
All non-profit hospitals must dedicate funding to addressing the health needs of the communities they serve. In order to retain a nonprofit status, these hospitals must understand the health needs of area residents and develop a plan for meeting these needs. Depending upon the needs of the community it serves, a nonprofit hospital can fund prevention or education programs, like nutrition and exercise classes or a farmers’ market. Some hospitals have chosen to make investments in community development and broad programs, like affordable housing and job training.
New Freedom Program
This federal program seeks to reduce barriers to transportation and expand the transportation options available to those with disabilities, beyond ADA requirements.
Tools to Implement Strategy Three
A brief description of each tool is at the end of the Safe Streets and Public Spaces section.
• Capital Improvement Program
• Community Development Block Grant
Reinvent PHX | 65
ReferencesActive Living Research. (2009). Walking and Biking to School, Physical Activity and Health Outcomes.
Agency for Healthcare Research and Quallity. (2010). Emergency Department Visits and Inpatient Stays Involving Dog Bites, 2008. Retrieved December 27, 2012, from http://www.hcup-us.ahrq.gov/reports/statbriefs/sb101.pdf
Arizona Department of Health Services. (2010, March). Deaths from Exposure to Excessive Natural Heat. Retrieved December 17, 2012, from http://www.azdhs.gov/plan/report/heat/heat09.pdf
Arizona Department of Health Services. (2011, December 11). The Obesity Epidemic. Retrieved December 17, 2012, from http://www.azdhs.gov/phs/bnp/nupao/documents/ObesityInArizona_121611.pdf
Arizona Department of Health Services. (2012, July). Arizona WIC Program Authorized Vendors. Retrieved September 26, 2012, from http://www.azdhs.gov/azwic/documents/vendors/WICVendorList.pdf
Arizona Department of Health Services. (n.d.). The Burden of Cardiovascular Disease in Arizona. Retrieved December 17, 2012, from http://www.azdhs.gov/azcvd/documents/pdf/az-burden-of-cardiovascular-disease.pdf
Arizona Diabetes Coalition. (2008). Arizona Diabetes Strategic Plan, 2008-2013. Retrieved December 4, 2012, from Arizona Department of Health Services: http://www.azdhs.gov/azdiabetes/documents/pdf/az-diabetes-strategic-plan_2008-2013.pdf
Arizona Health Survey. (2011, October). Healthy Eating and Active Living of Adults and Young Children in Arizona. Retrieved January 15, 2013, from http://www.arizonahealthsurvey.org/wp-content/uploads/2011/10/ahs-2010-heal-oct11.pdf
Babey, S., Brown, E., & Hastert, T. (2005, December). Retrieved October 4, 2012, from Access to Safe Parks Helps Increase Physical Activity among Teenagers: http://www.healthpolicy.ucla.edu/pubs/Publication.aspx?pubID=159
Balling, R., & Brazel, S. (1987). Time and Space Characteristics of the Phoenix Urban Heat Island. Journal of the Arizona-Nevada Academy of Science, 75.
Bhattacharyaa, J., Currieb, J., & Haiderc, S. (2004). Poverty, Food Insecurity, and Nutritional Outcomes in Children and Adults. Journal of Health economics, 23, 839-862.
Broad Leib, E. (2013). All (Food) Politics is Local: Increasing Food Access Through Local Government Action. Harvard Law & Policy Review, 7, 321-341.
Brownson, R., Brennan Ramirez, L., Hoehner, C., & Cook, R. (2003). Analytic Audit Tool. Retrieved October 15, 2012, from Active Living Research: http://www.activelivingresearch.org/node/10616
Center for Neighborhood Technology. (n.d.). H+T Affordability Index. Retrieved January 25, 2013, from http://htaindex.cnt.org/map/
Centers for Disease Control and Prevention. (n.d.). State Initiatives Supporting Healthier Food Retail: An Overview of the National Landscape. Retrieved from Centers for Disease Control and Prevention: http://www.cdc.gov/obesity/downloads/healthier_food_retail.pdf
References
Centers for Disease Control and Prevention. (2005). Heat-Related Motality - Arizona, 1993-2002 and United States, 1979-2002. Retrieved October 1, 2012, from Morbidity and Mortality Weekly Report: http://www.cdc.gov/mmwr/preview/mmwrhtml/mm5425a2.htm
Centers for Disease Control and Prevention. (2009). Differences in Prevelance of Obesity among Black, While and Hispanic Adults, U.S. 2006-2008. Retrieved December 19, 2012, from Morbidity and Mortality Weekly Report: http://www.cdc.gov/mmwr/preview/mmwrhtml/mm5827a2.htm
Centers for Disease Control and Prevention. (2012). Adult Obesity facts. Retrieved October 9, 2012, from http://www.cdc.gov/obesity/data/adult.html
Centers for Disease Control and Prevention. (2012). Health Effects of Limited Access to Healthy Food: Obesity, Chronic Disease and Poor Nutrition. Retrieved December 5, 2012, from http://www.cdc.gov/healthyplaces/healthtopics/healthyfood/obesity.htm
Centers for Medicare and Medicaid Services. (2007). Top 31 Elective Inpatient Hospital DRGs, 2006 Data. Retrieved January 25, 2013, from http://www.cms.gov/Research-Statistics-Data-and-Systems/Research/HealthCareConInit/Hospital.html
Cheng, E., Chen, A., & Cunningham, W. (2007, November). Primary Lanuage and Receipt of Recommended Health Care among Hispanics in the U.S. Journal of General Internal Medicine, 22(Suppl 2), 283-288.
City of Phoenix. (2010). Tree and Shade Master Plan. Retrieved June 13, 2013, from http://phoenix.gov/webcms/groups/internet/@inter/@dept/@parks/documents/web_content/071957.pdf
City of Phoenix Police Department. (2012). Uniform Crime Reporting Violent Crimes, Calendar Year 2012. Retrieved from City of Phoenix Police Department: http://phoenix.gov/webcms/groups/internet/@inter/@dept/@police/documents/web_content/099359.pdf
City of Providence, Mayor’s Office of Neighborhood Services. (n.d.). Neighborhood Association Tool Kit. Retrieved from City of Providence: http://www.providenceri.com/efile/101
Cohen, D., Han, B., Derose, K., Williamson, S., Marsh, T., & McKenzie, T. (2013, November). Physical Activity in Parks: A Randomized Controlled Trial Using Community Engagement. American Journal of Preventive Medicine, 45(5), 590-597. doi:10.1016/j.amepre.2013.06.015
Cohen, D., McKenzie, T., Sehgal, A., Williamson, S., Golinelli, D., & Lurie, N. (2007, March). Contribution of Public Parks to Physical Activity. American Journal of Public Health. 97(3), 509-514. doi: 10.2105/AJPH.2005.072447
County Health Rankings. (n.d.). Data and Methods, Our Approach. Retrieved Feburary 12, 2013, from http://www.countyhealthrankings.org/our-approach
Devancey, B. (2007). WIC Turns 35: Program Effectiveness and Future Directions. Retrieved December 7, 2012, from http://www.earlychildhoodrc.org/events/presentations/devaney.pdf
Ewing, R., Schmid, T., Killingsworth, R., A., Z., & Raudenbush, S. (2003). Relationship between Urban Sprawl and Physical Activity, Obesity and Morbidity. American Journal of Health Promotion, 18(1), 47-57.
Fanger, P. (1970). Thermal Comfort, Analysis and Applications in Environmental Engineering. Lyngby, Denmark: McGraw-Hill Book Company.
Fish, J., Ettner, S., Ang, A., & Brown, A. (2010, November). Association of Perceived Neighborhood Safety on Body Mass Index. American Journal of Public Health, 100(11), 2296-2303.
Reinvent PHX | 67
Flores, G. A.-K. (2005, July/Aug). Limited English Proficiency, Primary Language Spoken at Home, and Disparities in Children’s Health and Healthcare: How Language Barriers are Measured. Public Health Reports, 120(4), 418-430.
Frank, L., Andresen, M., & Schmid, T. (2004). Obesity Relationships with Community Design, Physical Activity and Time Spent in Cars. American Journal of Preventative Medicine, 27(2), 84-96.
Halfon, N., Larson, K., & Slusser, W. (2012). Associations between Obesity and Comorbid Mental Health, Developmental and Physical Health Conditions in a Nationally Representative Sample of US CHildren Aged 10 to 17. Academic Pediatrics.
Hamilton, B., & Erickson, C. (2012, Summer). Urban Heat Island and Social Work: Opportunties for Intervention. Advances in Social Work, 13(2), 420-430.
Han, J., Merrit, R., & Olmstead, N. (2005). The Burden of Cardiovascular Disease in Arizona.
Harlan, S., Brazel, A., Prashad, L., Stefanov, W., & Larsen, L. (2006). Neighborhood Microclimates and Vulnerability to Heat Stress. Social Science and Medicine(63), 2847-2863.
Health by Design. (n.d.). How Walkable Is Your Neighborhood? Retrieved October 15, 2012, from http://www.healthbydesignonline.org/documents/WalkabilitySurvey_HbD.pdf
Hodges, E.A. (2003). A primer on early childhood obesity and parental influence. Pediatric Nursing. 29(1):13-16.
Jenerette, G., Harlan, S., & Stefanov, W. (2011). Ecosystem Services and Urban Heat Riskscape Moderation: Water, Green Spaces, and Social Inequality in Phoenix, USA. Ecological Applications, 21(7), 2637–2651.
Jernigan, D., Sparks, M., Yang, E., & Schwartz, R. (2013). Using Public Health and Community Partnerships to Reduce Density of Alcohol Outlets. Preventing Chronic Disease. doi:10.5888/pcd10.120090
Kettel Khan, L., Sobush, K., Keener, D., Goodman, K., Lowry, A., Kakietek, J., & Zaro, S. (2009, July 24). Recommended Community Strategies and Measurements to Prevent Obesity in the United States. Retrieved October 9, 2012, from Morbidity and Mortality Weekly Report: http://www.cdc.gov/mmwr/preview/mmwrhtml/rr5807a1.htm
Klinenberg, E. (2002). Heat Wave: A Social Autopsy of Disaster in Chicago. Chicago: The University of Chicago Press.
Leadership for Healthy Communities. (2011). A Guide for Local and State Leaders Working to Create Helahty Communities and Prevent Childhood Obesity. Retrieved October 11, 2012, from Leadership for Healthy Communities: http://www.leadershipforhealthycommunities.org/images/stories/LHC_Action_Strategies_Toolkit_100222[1].pdf
Leadership for Healthy Communities. (2012, Feburary). Marking the Connection: Linking Policies that Prevent Hunger and Childhood Obesity. Retrieved Dedcemer 17, 2012, from http://www.leadershipforhealthycommunities.org/images/stories/lhc_hunger_obesity_02.14.12.pdf
Lee, H. (2012, April). The Role of Local Food Availability in Explaining Obesity Rish among Young School-Aged Children. Social Science and Medicine, 74(8), 1193-1203.
Miles, R. (2008). Neighborhood Disorder, Perceived Safety and Readiness to Encourage Use of Local Playgrounds. American Journall of Preventitive Medicine, 34, 275-281. doi:10.1016/j.amepre.2008.01.007
Morency, P., Gauvin, L., Plante, C., Fournier, M., & Morency, C. (2012, June). Neighborhood Social Inequalities in Road Traffic Injuries: The Influence of Traffic Volume and Road Design. American Journal of Public Health, 102(6), 1112-1119.
References
Phoenix Police Department. (2012). Crime Statistics and Maps. Retrieved from City of Phoenix: http://phoenix.gov/webcms/groups/internet/@inter/@dept/@police/documents/web_content/099359.pdf
PolicyLink. (n.d.). Access to Healthy Food. Retrieved from http://www.policylink.org/site/c.lkIXLbMNJrE/b.7634003/k.519E/Access_to_Healthy_Food.htm
PolicyLink & The Food Trust. (2010). The Grocery Gap. Retrieved from http://www.policylink.org/atf/cf/%7B97C6D565-BB43-406D-A6D5-ECA3BBF35AF0%7D/FINALGroceryGap.pdf
PolicyLink and Prevention Institute. (n.d.). The Transportation Prescription: Bold New Ideas for Healthy, Equitable Transportation Reform in America.
Rosenheck, R. (2008, November). Fast food consumption and increased caloric intake: a systematic review of a trajectory towards weight gain and obesity risk. Obesity Reviews, 9(6), 535-547. doi:10.1111/j.1467-789X.2008.00477.x
Rung, A., Mowen, A., Broyles, S., & Gustat, J. (2011). The Role of Park Conditions and Features on Park Visitation. Journal of Physical Activity and Health, 8(Suppl 2), S178 -S187.
Saelens, B., Salis, J., Black, J., & Chen, D. (2003). Neighborhood Based Differences in Physical Activity. American Journal of Public Health(93), 1552-1558.
Shay, E., Spoon, S., & Khattak, A. (2003). Walkable Environments and Walking Activity. Retrieved December 14, 2012, from http://www.stc.utk.edu/STCresearch/completed/PDFs/walkfinal.pdf
Stockbox Neighborhood Grocery. (n.d.). Retrieved from Stockbox Neighborhood Grocery: http://stockboxgrocers.com/about/
Successful Communities Online Toolkit. (n.d.). Phoenix, Arizona Heat Relief Network. Retrieved January 3, 2013, from http://scotie.sonoraninstitute.org/component/content/article/168-phoenix-az-heat-relief-network.html
Surgeon General of the United States. (2012). Overweight and Obesity: What You Can Do. Retrieved October 9, 2012, from http://www.surgeongeneral.gov/library/calls/obesity/fact_whatcanyoudo.html
Taggart, M., Chaney, M., & Meaney, D. (n.d.). Vacant Land Inventory for Urban Agriculture. Retrieved from Cleveland-Cuyahoga Food Policy Coalition: http://cccfoodpolicy.org/sites/default/files/resources/Vacant%20Land%20Inventory%20for%20Urban%20Agriculture%20-%20Report%20for%20Urban%20Land%20Ecology%20Conference.pdf
The Reinvestment Fund. (2011). Limited Supermarket Access (LSA) Status, as of 2011.
The Trust for Public Lands. (2006). Retrieved October 4, 2012, from The Health Benefits of Parks: http://www.eastshorepark.org/HealthBenefitsReport_FINAL_010307.pdf
The Trust for Public Land. (2012). City Park Facts. Retrieved June 13, 2013, from http://cloud.tpl.org/pubs/ccpe-cityparkfacts-2012.pdf
The WABSA Project. (2003, October 29). Assessing and Improving Your Community’s Walkability and Bikeability. Retrieved October 12, 2012, from http://www.unc.edu/~jemery/WABSA/documents/wabsa%20guidebook%2003-1029.pdf
Transportation Alternatives. (2011). Play Streets: Best Practices. Retrieved from http://transalt.org/files/news/reports/2011/PlayStreets_BestPractices.pdf
Reinvent PHX | 69
Transportation Research Board; Institute of Medicine of the National Academies. (2005). Does the Built Environment Influence Physical Activity? Examining the Evidence. Retrieved January 8, 2013, from Transportation Research Board of the National Academies: http://onlinepubs.trb.org/onlinepubs/sr/sr282.pdf
U.S. Census Bureau. (2010). Summary File 1.
U.S. Department of Agriculture, Economic Research Service. (2009). Access to Affordable and Nutricious Food: Measuring and Understanding Food Deserts and their Consequences, Report to Congress. Report to Congress. Retrieved October 11, 2012, from http://www.ers.usda.gov/media/242675/ap036_1_.pdf
U.S. Department of Health and Human Services. (n.d.). Social Determanents of Health. Retrieved March 1, 2013, from Healthy People 2020: http://www.healthypeople.gov/2020/topicsobjectives2020/overview.aspx?topicid=39
U.S. Department of Housing and Urban Development. (n.d.). Affordable Housing. Retrieved January 25, 2013, from http://portal.hud.gov/hudportal/HUD?src=/program_offices/comm_planning/affordablehousing
Vartanian, L. S. (2007, April). Effects of Soft Drink Consumption on Nutrition and Health: A Systematic Review and Meta-Analysis. American Journal of Public Health, 97(4), 667-675. doi:10.2105/AJPH.2005.083782
Victoria Transport Policy Institute. (2010). Retrieved October 4, 2012, from Evaluating Public Transportation Health Benefits: http://www.apta.com/resources/reportsandpublications/Documents/APTA_Health_Benefits_Litman.pdf
Walgreens. (2011) Walgreens Commits to Converting or Opening at Least 1,000 Food Oasis Stores Over the Next Five Years. [Press Release]. Retrieved from http://news.walgreens.com/article_print.cfm?article_id=5451]
Weiss, C., Purciel, M., Bader, M., Quinn, J., Lovasi, G., Neckerman, K., & R. A. (2011). Reconsidering Access: Park Facilities and Neighborhood Disamenities in New York City. Journal of Urban Health, 88(2), 297-309.
Whyte, W. H. (1980). The Social Life of Small Urban Spaces. New York: Project for Public Spaces.
Work Group for Community Health and Development at the University of Kansas. (2012). The Community Toolbox. Retrieved September 26, 2012, from http://ctb.ku.edu/
Endnotes
i. Workshop participants asserted that there had been a charging station at the Indian School Light Rail stop, but the station had been removed.
ii. Categories of stores are based upon site visits by the health team. The definitions of the types of stores are drawn from The Reinvestment Fund (2011) and Examining the Impact of Food Deserts on Public Health in Detroit (Mari Gallagher Research & Consulting Group, 2007).
iii. The methodology used to identify restaurants, including fast food and “sit down” restaurants, included a Google search, followed by a windshield survey. Like much of the food environment, this is a snapshot in time meant to provide context rather than exact details about the restaurants.
iv. All traffic related injury data were from either the Arizona Department of Transportation’s Safety Data Mart or the Arizona Department of Health Services State Trauma Registry and were matched resulting in an unduplicated count.
v. For more information about these programs, go to http://www.healthykidshealthycommunities.org/node/675.
References
vi. The city of Phoenix’s Community Garden Policy Guidelines can be found at: http://phoenix.gov/webcms/groups/internet/@inter/@dept/@dsd/documents/web_content/pdd_pz_pdf_00348.pdf.
vii. More information about programs in these communities, go to http://www.freshmoves.org/, http://chattanoogamobilemarket.org/, and http://www.marketonwheels.com/index.html respectively.
viii. Information can be found at http://arcadiafood.org/programs/mobile-market.
ix. Information can be found at http://stockboxgrocers.com/about/.
x. Information on the Discovery Triangle and Fresh Express can be found at http://www.discoverytriangle.org/fresh-express/.
xi. More information on the Green Cart Initiative can be found at: http://www.nyc.gov/html/doh/html/diseases/green-carts.shtml.
xii. The policy can be found at http://www.kcmo.org/idc/groups/parksandrec/documents/parksrecreation/012710.pdf.
xiii. More information about this program can be found at http://content.govdelivery.com/bulletins/gd/USDAOC-78ddc5.
xiv. More information about this program can be found at http://www.cafreshworks.com/Index.html.
xv. A brief description of development incentives can be found at http://www.policylink.org/site/c.lkIXLbMNJrE/b.7677419/k.C869/Policy.htm.
xvi. Groundwork’s toolbox can be found at http://research.ncl.ac.uk/engscc/assets/pdf/toolkit.pdf.
xvii. Information can be found at http://www.arizonaforward.org/pdf/ASU_SGSUP_Placemaking_and_Community_Building_Project.pdf.
xviii. Injury and fatality rates were calculated by computing an average annual number of injuries and fatalities based on the available years of data from the sources—three years for City Collision data and five years for the Arizona State Trauma Registry data. The rate was calculated as follows: (Average number of injuries and fatalities)/(Total population for district) x 10,000
xix. Injury and fatality rates were calculated by computing an average annual number of injuries and fatalities based on the available years of data from the sources—three years for City Collision data and five years for the Arizona State Trauma Registry data. The rate was calculated as follows: (Average number of injuries and fatalities)/(Total population for district) x 10,000
xx. Information on TreePeople can be found at http://www.treepeople.org/.
xxi. The City of Phoenix Tree and Shade Master Plan is at http://phoenix.gov/webcms/groups/internet/@inter/@dept/@parks/documents/web_content/071957.pdf.
xxii. An advocacy resource guide for grantees can be found at http://www.healthykidshealthycommunities.org/sites/default/files/ALBD%20Advocacy%20Resource%20Guide%20May%202010-updated%20Aug%202010_0.pdf.
xxiii. For more information about Safe Routes to Transit, go to http://www.nyc.gov/html/dot/html/pedestrians/safertstransit.shtml.