Middlesex University Research...
16
Middlesex University Research Repository An open access repository of Middlesex University research http://eprints.mdx.ac.uk Tirunagari, Santosh and Poh, Norman and Wells, Kevin and Bober, Miroslaw and Gorden, Isky and Windridge, David (2017) Movement correction in DCE-MRI through windowed and reconstruction dynamic mode decomposition. Machine Vision and Applications, 28 (3-4). pp. 393-407. ISSN 0932-8092 http://dx.doi.org/10.1007/s00138-017-0835-5 Published version (with publisher's formatting) Available from Middlesex University’s Research Repository at http://eprints.mdx.ac.uk/22092/ Copyright: Middlesex University Research Repository makes the University’s research available electronically. Copyright and moral rights to this thesis/research project are retained by the author and/or other copyright owners. The work is supplied on the understanding that any use for commercial gain is strictly forbidden. A copy may be downloaded for personal, non-commercial, research or study without prior permission and without charge. Any use of the thesis/research project for private study or research must be properly acknowledged with reference to the work’s full bibliographic details. This thesis/research project may not be reproduced in any format or medium, or extensive quotations taken from it, or its content changed in any way, without first obtaining permission in writing from the copyright holder(s). If you believe that any material held in the repository infringes copyright law, please contact the Repository Team at Middlesex University via the following email address: [email protected] The item will be removed from the repository while any claim is being investigated.
Transcript of Middlesex University Research...

Middlesex University Research Repository
An open access repository of
Middlesex University research
http://eprints.mdx.ac.uk
Tirunagari, Santosh and Poh, Norman and Wells, Kevin and Bober,Miroslaw and Gorden, Isky and Windridge, David (2017) Movement
correction in DCE-MRI through windowed and reconstruction dynamicmode decomposition. Machine Vision and Applications, 28 (3-4). pp.
393-407. ISSN 0932-8092
http://dx.doi.org/10.1007/s00138-017-0835-5
Published version (with publisher's formatting)
Available from Middlesex University’s Research Repository athttp://eprints.mdx.ac.uk/22092/
Copyright:
Middlesex University Research Repository makes the University’s research available electronically.
Copyright and moral rights to this thesis/research project are retained by the author and/or other copyright owners. The work is supplied on the understanding that any use for commercial gain is strictly forbidden. A copy may be downloaded for personal, non-commercial, research or study without prior permission and without charge. Any use of the thesis/research project for private study or research must be properly acknowledged withreference to the work’s full bibliographic details.
This thesis/research project may not be reproduced in any format or medium, or extensive quotations taken from it, or its content changed in any way, without first obtaining permissionin writing from the copyright holder(s).
If you believe that any material held in the repository infringes copyright law, please contact the Repository Team at Middlesex University via the following email address:
The item will be removed from the repository while any claim is being investigated.

Machine Vision and ApplicationsDOI 10.1007/s00138-017-0835-5
ORIGINAL PAPER
Movement correction in DCE-MRI through windowed andreconstruction dynamic mode decomposition
Santosh Tirunagari1,2 · Norman Poh1 · Kevin Wells2 · Miroslaw Bober2 ·Isky Gorden3 · David Windridge4
Received: 26 May 2016 / Revised: 2 January 2017 / Accepted: 14 March 2017© The Author(s) 2017. This article is an open access publication
Abstract Images of the kidneys using dynamic contrast-enhancedmagnetic resonance renography (DCE-MRR) con-tains unwanted complex organ motion due to respiration.This gives rise to motion artefacts that hinder the clini-cal assessment of kidney function. However, due to therapid change in contrast agent within the DCE-MR imagesequence, commonly used intensity-based image registra-tion techniques are likely to fail. While semi-automatedapproaches involving human experts are a possible alterna-tive, they pose significant drawbacks including inter-observervariability, and the bottleneck introduced through manual
Santosh Tirunagari and Norman Poh have benefited from the MedicalResearch Council (MRC) funded project ‘Modelling the Progressionof Chronic Kidney Disease’ under the grant number R/M023281/1.
Electronic supplementary material The online version of thisarticle (doi:10.1007/s00138-017-0835-5) contains supplementarymaterial, which is available to authorized users.
B Santosh [email protected]
Norman [email protected]
Kevin [email protected]
Miroslaw [email protected]
1 Department of Computer Science, University of Surrey,Guildford, Surrey GU2 7XH, UK
2 Center for Vision, Speech and Signal Processing (CVSSP),University of Surrey, Guildford, Surrey GU2 7XH, UK
3 University College London (UCL) Institute of Child Health,30 Guildford Street, London WCIN 1EH, UK
4 Department of Computer Science, Middlesex University,The Burroughs, Hendon, London NW4 4BT, UK
inspection of the multiplicity of images produced during aDCE-MRR study. To address this issue, we present a novelautomated, registration-free movement correction approachbased on windowed and reconstruction variants of dynamicmode decomposition (WR-DMD). Our proposed method isvalidated on ten different healthy volunteers’ kidney DCE-MRI data sets. The results, using block-matching-blockevaluation on the image sequence produced by WR-DMD,show the elimination of 99% of mean motion magnitudewhen compared to the original data sets, thereby demon-strating the viability of automaticmovement correction usingWR-DMD.
Keywords DMD · W-DMD · R-DMD · WR-DMD ·DCE-MRI · Movement correction
1 Introduction
Dynamic contrast-enhanced magnetic resonance imaging(DCE-MRI) renography is a promising technique for func-tional assessment of the kidney because it avoids the needfor ionising radiation. In order to obtain useful diagnos-tic/prognostic information, the dynamic change of pixelintensities as contrast agent flows through the metabolicregion within the kidney must be quantified in terms of func-tion such as blood flow, filtration rate or functional volume.However, absolute quantification inside the kidney is oftenobfuscated by complex patient movements, arising due torespiration, pulsation and involuntary movements as shownin Fig. 1 (top) (the corresponding dynamic sequence can beviewed at https://youtu.be/TWq34TFGNcU). These move-ments induce pixel displacements in and around the kidneyregion, leading to motion artefacts (intensity fluctuations) inthe time–intensity curves produced from a fixed region of
123

S. Tirunagari et al.
interest (ROI) placed within the kidney. Such motion arte-facts can affect the assessment of the kidney function.
In order to correct for such motion, many rigid and non-rigid image registration techniques have been proposed inthe literature [13,37] for providing well-aligned featuresacross the image sequence. However, developing a regis-tration technique specific to DCE-MRI data is challengingdue to the rapid change of contrast agent within the DCE-MRI sequence. Traditional registration techniques are likelyto fail with DCE-MRI data as similar voxels in the sequencemay have variable local intensities at each sampling time.Therefore, the algorithm has to be independent of the con-trast changes within the kidney.
Senneville et al.’s [29] work assumes that the kidney is arigid body, and its shape does not change during theMRI dataacquisition. For registration purposes in Senneville’s work,a human expert selects a reference image from the imagesequence. The expert then manually delineates the kidneyregion of interest (ROI), thus forming the ‘template’. Usingthis template, the registration of the kidneys is conductedacross the DCE-MRI sequence using contrast invariant sim-ilarity matching. Other methods that require human inputare reported in [6,15,21,36]. Although these approaches arepotentially effective, a major issue is the need for humanintervention for delineating the kidney region. Other issuesare reproducibility and the intrinsic bottleneck associatedwith the speed of processing that automation could address.
On the other hand, approaches based on matrix decom-position such as principle component analysis (PCA), inde-pendent component analysis (ICA) and robust PCA (RPCA)have also been proposed as a preprocessing step prior toimage registration. Progressive principal component regis-tration (PPCR) introduced by Melbourne et al. [17,18] isa PCA-based approach that iteratively removes misalign-ment from the DCE-MRI sequence while using a standardregistration algorithm such as fluid registration [5]. Theauthor’s main assumption in this work is that PCA cap-tures contrast changes or intensity fluctuations in the firstfew principal components and motion in the last principalcomponents (when sorted according to their proportion ofvariance explained through the cumulative sum of eigenval-ues). However, using PCA formotion compensation dependspurely upon the nature of the motion, i.e. for example, peri-odic motion of free breathing can appear in the first fewprincipal components along with contrast changes.
In order to deal robustly with various breathing proto-cols, robust data decomposition registration (RDDR) [9] wasintroduced. RDDR uses robust principal component analy-sis (RPCA) [4] coupled with a registration algorithm basedon residual complexity minimisation [20]. RPCA decom-poses the DCE-MRI data into a series of low-rank andsparse components separating motion components from thecontrast enhanced. The intensity fluctuations which remain
unchanged are then registered. The explicit separation ofsparse components provide RPCA a greater degree of robust-ness when compared to a regular PCA-based approach.The ICA-based approach has also been used to decomposeDCE-MRI data prior to registration in free breathing cardiacMRI [35]. In all of the aforementioned approaches, the mainobjective is to remove motion elements from the DCE-MRItime series while utilising image registration methods.
Spatio-temporal ICA (STICA) [10,30] is one methodthat does not use any kind of registration procedure in itsapproach. According to STICA’s assumptions, free breath-ing, which induces the movement artefacts, is regarded asone of the independent processes, i.e. different regions inDCE-MRI that respond differently with respect to the con-trast agent are assumed to be spatially independent, and areassumed to be temporally independent of each other [10].Quantitative assessment in [10] using ROI analysis showsvirtually no movement in either the first independent compo-nent or the second. The third independent component showsthe movement artefacts. Limitations of this approach caninclude finding an optimal filter that can maximise the statis-tical independence of the these DCE signals over space andtime simultaneously.
1.1 Motivation: dynamic mode decomposition (DMD)
DMD was originally introduced in the area of computa-tional fluid dynamics (CFD) [28], specifically for analysingthe sequential image data generated by nonlinear complexfluid flows [25–27,34]. TheDMDdecomposes a given imagesequence into several images, called dynamic modes. Thesemodes essentially capture different large-scale to small-scale structures (sparse components) including a backgroundstructure (low-rank model) [7]. DMD has gained signifi-cant applications in various fields [2,3,16], including fordetecting spoof samples from facial authentication video datasets [33] and for detecting spoofed finger-vein images [31].The advantage of this method is its ability to identify regionsof dominant motion in an image sequence in a completelydata-drivenmanner without relying on any prior assumptionsabout the patterns of behaviour within the data. Therefore, itis thus potentially well-suited to analyse a wide variation ofblood flow and filtration patterns seen in renography pathol-ogy.
1.2 Comparison with decomposition-based methods
The assumptions of our approach are borrowed from PCCRand RDDR methods. Similar to STICA our proposed WR-DMD technique is also an image registration-free approach.Comparisons with the aforementioned decomposition-basedmethods are made in Table 1.
123

Movement correction in DCE-MRI through windowed and reconstruction dynamic mode decomposition
Table 1 Comparison of proposed methods with other movement correction approaches that are based on matrix decomposition methods
References Method Matrix Factorisation Registration Assumptions Demerits/merits
Melbourne etal. [17,18]
Progressiveprincipalcomponentregistration(PPCR)
PCA Multi-resolutionFFD [19]
Contrast changes capturedin the first few principalcomponents and motionin the last principalcomponents
Limitations in handlingperiodic motion of freebreathing. Computationallyexpensive for usingregistration algorithm
Hamy et al. [9] Robust datadecompositionregistration(RDDR)
RPCA Residualcomplexity min-imisation [20]
Sparse componentsseparate motioncomponents from thecontrast-enhancedimages
Computationally expensive.Nevertheless robust tovarious breathing protocols
Kiani et al. [10] Online—STICA ICA None Different regions inDCE-MRI responddifferently, over the timeare assumed to beindependent
Computationally expensivefor optimising filters thatcan maximise the statisticalindependence
Proposed method WR-DMD DMD None Sparse componentsseparate motioncomponents from thecontrast-enhancedimages. Contrastchanges captured in themost significantdynamic modes andmotion in the leastsignificant
W-DMD disentanglesperiodic free breathing.DMD separates motioncomponents in leastsignificant modes. R-DMDreconstructs perfectlyaligned sequence with themost significant modes.Computationallyinexpensive
1.3 Our approach
Our approach is a two-step process (Fig. 2), where at firstthe DCE-MRI sequence is processed through window-DMDmethod [31] to compensate for the pseudo-periodic breathingmotion (the importance of running W-DMD as a first stepprocess is shown in Sect. 4.4). The windowed version ofDMD method (here, W = 3) runs over three consecutiveimages (since motion is periodic for every three images asevaluated in Sect. 4.2) in an overlapping fashion as shown inFig. 3.
The output of DMD at each window produces two imagesnamely W-DMD component-1 (C1) revealing the low-rankimage and W-DMD component-2 (C2) revealing the sparsecomponent. At this stage of our approach, we discardthe sparse components, i.e. W-DMD(C2)’s to compensatethe pseudo-periodic free breathing motion from the DCE-MRI sequence. Second, we proceed with giving W-DMDcomponent-1’s as an input to standard DMD algorithm,which decomposes the W-DMD(C1) sequence into severalimages called dynamic modes (see, Fig. 8). The dynamiccontrast changes are captured in the most significant modes,and motion components are captured in the least significantmodes.Using the first three significantDMDmodes, the orig-inal sequence is then reconstructed via R-DMDmethod. Ourresult in Fig. 1 (bottom) shows that the motion artefacts are
compensated in an exemplar 4D dynamic medical imagingapplication.
1.4 Contributions
Our implementation is novel in the sense that it useswindowed-DMD on dynamic image sequences for the firsttime to compensate for motion artefacts by producing low-rank images as W-DMD component-1. Even though thelow-rank and sparse representations of an image sequencehave been reported for DMD [7,12], the method that we pro-pose here is essentially different. In [7], the authors exploitthe low-rank and sparse representation within each frame.Specifically, low rank revealing the background and sparsepresenting the foreground of that particular frame. Recently,in [12] DMD with a multi-resolution approach (MR-DMD)decomposed video streams intomulti-time scale features andobjects. TheMR-DMDapproach is similar to that of applyingstandard DMD technique at several resolutions after discard-ing the slow varying modes (background modes or the mostsignificant modes). In other words, the MR-DMD approachruns the standard DMD algorithm over a sequence of imagesto produce several dynamic modes. Later, the most signif-icant modes (background modes) are discarded; therefore,DMD is run using the least significant modes. This processis continued at several time resolutions allowing an imagesequence to be separated for objects moving at different
123

S. Tirunagari et al.
Fig. 1 (Top) 5 frames at time = {30,50,74,82,100}s selected from aDCE-MRI sequence of a healthy volunteer. The yellow and red ref-erence lines show the alignment of the kidney and liver regions. Thefirst image shows the peak stage of contrast agent inside the kidneyregion. The regions of kidney and liver clearly depict the translation ofmovements in the vertical direction, arising due to the patient move-
ments. (Bottom) The yellow and red reference lines clearly showingthe proper alignment of the kidney and liver regions after processingwithWR-DMD. The video-based results can be viewed at https://youtu.be/TWq34TFGNcU and https://youtu.be/UT7f4ch4H-I (colour figureonline)
rates against the slowly varying background. This approach,therefore, allows for multiple target tracking and detection.In contrast, the proposed W-DMD method runs standardDMD over a window of consecutive images; thus produc-ing low-rank and sparse modes at each window of the imagesequence, respectively, giving rise to W-DMD component-1 and component-2. The original DMD method introducedin [28] extracts modes from a sequence of images and inter-prets modes in the image space, whereas our reconstructionvariant of the method (R-DMD) re-projects the DMDmodesback into original image sequence, thereby stabilising thecomplex movements. Therefore, our contributions in thisstudy are in (i) introducing the WR-DMD framework forthe first time to reconstruct movement corrected, alignedimages sequence. (ii) Validating our technique usingmedicaldata with applications to DCE-MRI; and (iii) improving theunderstanding of the application through WR-DMD frame-work.
1.5 Organisation of the paper
The remainder of this paper is organised as follows: in Sect. 2,we consider the theory for WR-DMD. Sect. 3 presents 10different data sets used in this study. In Sect. 4, we present ourexperiments and results, and finally, conclusions are drawnin Sect. 5.
2 Methodology
In this section,we present ourmethodological pipelinewhichconsists of W-DMD and reconstruction-based DMD. Theoverall process framework is shown in Fig. 2 and discussedin Sect. 1.3.
2.1 Dynamic mode decomposition (DMD)
Let xr be the r th dynamic image frame in a DCE-MRIsequence, whose size is m × n. This image frame xr isconverted to mn × 1 column vector, resulting in the con-struction of a data matrix X of size mn × N for N imageframes.
X = [x1, x2, x3, . . . , xN ] =⎛⎜⎝
x11 x12 . . . x1N...
......
...
xmn1 xmn
2 . . . xmnN
⎞⎟⎠ . (1)
The images in the DCE-MRI data are collected overregularly spaced time intervals, and hence, each pair of con-secutive images are correlated. It can be justified that amapping A exists between them forming a span of krylovsubspace [11,22,23]:
123
Movement correction in DCE-MRI through windowed and reconstruction dynamic mode decomposition
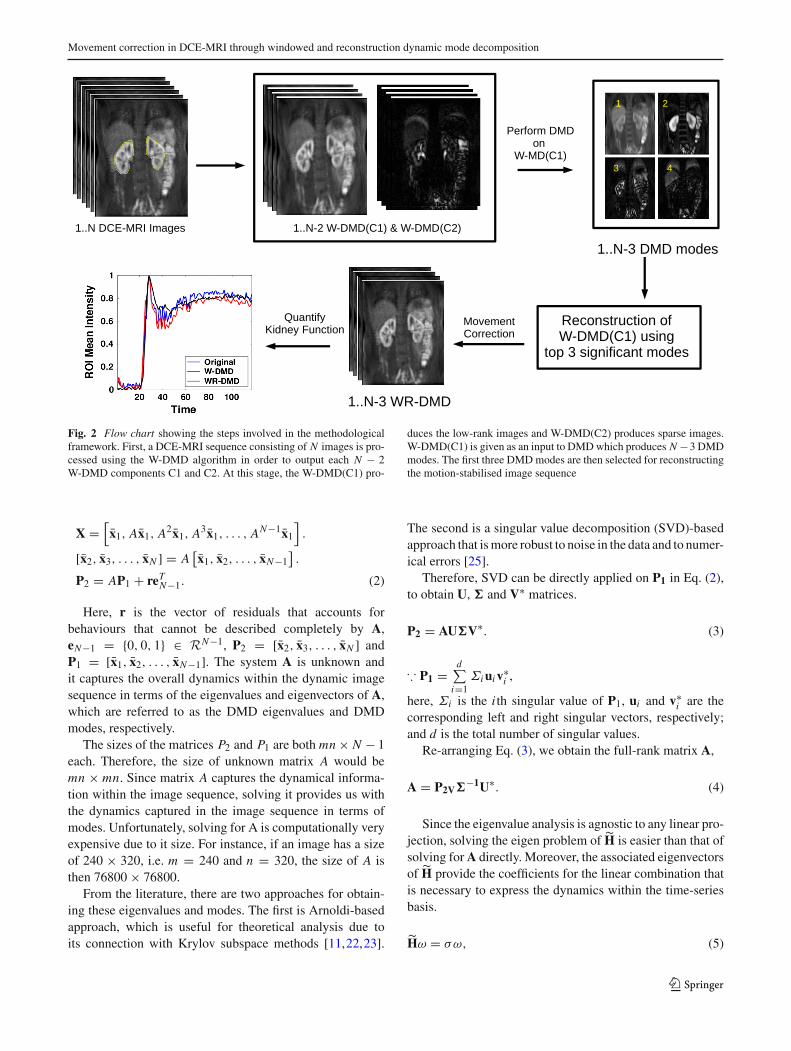
Fig. 2 Flow chart showing the steps involved in the methodologicalframework. First, a DCE-MRI sequence consisting of N images is pro-cessed using the W-DMD algorithm in order to output each N − 2W-DMD components C1 and C2. At this stage, the W-DMD(C1) pro-
duces the low-rank images and W-DMD(C2) produces sparse images.W-DMD(C1) is given as an input to DMDwhich produces N −3 DMDmodes. The first three DMDmodes are then selected for reconstructingthe motion-stabilised image sequence
X =[x1, Ax1, A2x1, A3x1, . . . , AN−1x1
].
[x2, x3, . . . , xN ] = A[x1, x2, . . . , xN−1
].
P2 = AP1 + reTN−1. (2)
Here, r is the vector of residuals that accounts forbehaviours that cannot be described completely by A,eN−1 = {0, 0, 1} ∈ RN−1, P2 = [x2, x3, . . . , xN ] andP1 = [x1, x2, . . . , xN−1]. The system A is unknown andit captures the overall dynamics within the dynamic imagesequence in terms of the eigenvalues and eigenvectors of A,which are referred to as the DMD eigenvalues and DMDmodes, respectively.
The sizes of the matrices P2 and P1 are both mn × N − 1each. Therefore, the size of unknown matrix A would bemn × mn. Since matrix A captures the dynamical informa-tion within the image sequence, solving it provides us withthe dynamics captured in the image sequence in terms ofmodes. Unfortunately, solving for A is computationally veryexpensive due to it size. For instance, if an image has a sizeof 240 × 320, i.e. m = 240 and n = 320, the size of A isthen 76800 × 76800.
From the literature, there are two approaches for obtain-ing these eigenvalues and modes. The first is Arnoldi-basedapproach, which is useful for theoretical analysis due toits connection with Krylov subspace methods [11,22,23].
The second is a singular value decomposition (SVD)-basedapproach that ismore robust to noise in the data and to numer-ical errors [25].
Therefore, SVD can be directly applied on P1 in Eq. (2),to obtain U, � and V∗ matrices.
P2 = AU�V∗. (3)
∵ P1 =d∑
i=1Σiuiv∗
i ,
here, Σi is the i th singular value of P1, ui and v∗i are the
corresponding left and right singular vectors, respectively;and d is the total number of singular values.
Re-arranging Eq. (3), we obtain the full-rank matrix A,
A = P2V�−1U∗. (4)
Since the eigenvalue analysis is agnostic to any linear pro-jection, solving the eigen problem of H is easier than that ofsolving forA directly. Moreover, the associated eigenvectorsof H provide the coefficients for the linear combination thatis necessary to express the dynamics within the time-seriesbasis.
Hω = σω, (5)
123

S. Tirunagari et al.
where ω are the eigenvectors and σ a diagonal matrix con-taining the corresponding eigenvalues of H matrix. Theeigenvalues of H approximate some of the eigenvalues ofthe full system A [8], and we then have:
AU ≈ UH,
AU ≈ Uωσω−1,
A(Uω) ≈ (Uω)σ.
(6)
Therefore, H is determined on the subspace spanned by theorthogonal singular basis vectors U obtained via P1,
H = U∗(A)U,
H = U∗ (P2V�−1U∗)U,
(7)
which can be rewritten as:
H = U∗P2V�−1. (8)
Here, U∗ ∈ C(N−1)×mn and V ∈ C
(N−1)×(N−1) are theconjugate transpose of U and V∗, respectively; and �−1 ∈C
(N−1)×(N−1) denotes the inverse of the singular values �.By replacing � = Uω in Eq. (6), i.e. A(�) ≈ (�)σ , weobtain the dynamic modes �. ∵ U = P2V�−1; therefore,we have:
� = P2V�−1ω (9)
The complex eigenvalues σ contain growth/decay ratesand frequencies of the corresponding DMD modes [26,27].If σ j are the diagonal elements of σ from Eq. (5), the tem-poral behaviour of the DMD modes is then formed viaVandermonde matrix V , which raises its column vector tothe appropriate power. V( f ) with (N − 1) × ( f + 1) ele-ments will be defined as follows:
V( f ) =
⎛⎜⎜⎜⎜⎝
1 σ 11 σ 2
1 ... σf1
1 σ 12 σ 2
2 ... σf2
......
......
...
1 σ 1N−1 σ 2
N−1 ... σfN−1
⎞⎟⎟⎟⎟⎠
, (10)
V(N ) is a standard Vandermonde matrix for reconstructionbut if f > N , this is used for forecasting. DMD modes withfrequencies μ j is defined by:
μ j = ln(σ j )
δt, (11)
where δt is the lag between the images. The real part of μ j
regulates the growth or decay of the DMD modes, while theimaginary part of μ j drives oscillations in the DMD modes.
2.2 Ordering dynamic modes
In order to select the most significant dynamic modes, themethod suggested in [7,12] is to calculate the logarithmicvalues of the diag(σ ). The frequencies which are near ori-gin are themost significantmodes. The otherwaywe proposehere is by calculating the phase-angles for the complex eigen-values.
The absolute value for the phase-angles are calculatedand modes with unique phase-angles are selected. Doingthis will remove one of the conjugate pairs in the dynamicmodes. These conjugate modes have same phase-angles butwith different signs and look and capture similar infor-mation [24]. After discarding one of the conjugate pairs,the dynamic modes are then sorted in ascending order oftheir phase-angles. The resultant dynamic modes are thussorted according to their significance. In this study, we haveconsidered the first three significant dynamic modes whenreconstructing the original sequence.
2.3 Reconstruction from DMD modes (R-DMD)
The novel reconstruction DMD aims at reconstructing theimage sequence from the dynamic modes. This can beachieved in a least squares solution.
∥∥∥� − P2V�−1ω
∥∥∥ (12)
Therefore, the reconstruction of the original image sequencecan be formulated as follows:
P2 = �ω−1�V−1 (13)
Since the contrast changes are captured in the most signif-icant modes and motion components in the least significantones, it is desirable to discard the least significant modes.The crux of making this work is to select the K modes thatare contributing to the contrast changes, and not the motionchanges.
The original sequence is thus constructed using first k sig-nificant modes along with their corresponding eigenvectorsfrom H . The algorithmic details of our approach is describedin Algorithm 1.
P2 = �{1..k}ω−1{1..k}�V−1 (14)
2.4 Windowed-DMD (W-DMD)
The Windowed version of DMD method runs DMD over awindow of consecutive images in a sequence in an overlap-ping fashion. The output of DMD at each window producesW − 1 dynamic modes where W is the length of the win-dow. To compensate the periodic free breathing from the
123

Movement correction in DCE-MRI through windowed and reconstruction dynamic mode decomposition
Fig. 3 Methodological pipeline showing the working mechanism ofW-DMD. DMD runs over the window containing first three imagesin the sequence, obtaining two dynamic modes. The first dynamicmode ‘c1’ capturing the low-rank image across the window and sec-ond dynamic mode c2 capturing the sparse representation. The nextstep exclude the first image and consider images {2, 3, 4}, followedby {3, 4, 5} and {4, 5, 6} producing c1 and c2 components. Finally, allof the c1s and c2s across all the windows are concatenated to obtainW-DMD component-1 (W-DMD (C1)) andW-DMD component-2 (W-DMD (C2))
DCE-MRI sequence in this study, we consider W = 3. Forinstance, running DMD on the window containing the firstthree images in the sequence, we obtain two dynamic modes(in general for N images, we get N − 1 DMD modes [33]).The first dynamic mode ‘c1’ captures the low-rank imageacross the window and the second dynamic mode ‘c2’ cap-tures the sparse representation, which essentially containmotion artefacts pertaining to periodic free breathing. In thenext step, we exclude the first image and consider images{2, 3, 4}, followed by {3, 4, 5} and {4, 5, 6} and so on asshown in Fig. 3. Finally, we concatenate all of the c1s acrossall the windows to obtain W-DMD component-1 (W-DMD(C1)), and similarly, concatenation of the c2s produce W-DMD component-2 (W-DMD (C2)) [31]).
Algorithm 1 WR-DMDInput: Sequence of images in DCE-MRI data P = [p1, p2, p3, . . . , pN ]Output:Movement corrected sequence ˆC12 = [c4, c5, c6, . . . , cN ]
1: for { i = 1 to n − w − 1 } #w = 32: S = [pi , pi+1, pi+2]3: [WDMD(C1)(i),WDMD(C2)(i)] = get-WDMD(S)4: endfor5: C11 ← [c1, c2, c3, . . . , cN−1] # C1 represents W-DMD component-1.6: C12 ← [c2, c3, c4, . . . , cN ]7: [U S V ] ← SVD(C1, ‘econ
′)8: H ← (U∗C12VΣ−1)9: [ω σ ] ← eig(H) # ω and σ are the eigenvectors and eigenvalues.10: λ j ← sort(angle(σ j j ) >= 0) # sort ω correspondingly
11: Ψ ← abs(P2VΣ−1ω) # Calculate dynamic modes12: ˆC12 ← (Ψ ω−1ΣV−1) # reconstruction
2.5 Comparisons with DMD and MR-DMD
Dynamic mode decomposition (DMD), in computer vision,has been introduced for robustly separating video frames intoa background model and foreground components [7]. TheDMD method has been applied on a data matrix contain-ing image sequence from a surveillance video. The DMDeigenvalue frequencies near the origin are interpreted asbackground (slow varying modes) portions of the givenimage sequence, and the frequencies bounded away fromthe origin are their sparse counterparts (fast varying modes).Specifically, the parts in image sequence that do not changein time have an associated frequency ‖μ j‖ ≈ 0, which cor-responds to background.
DMD with a multi-resolution [12] approach decomposesan image sequence intomulti-time scale features and objects.The MR-DMD approach is similar to that of applying stan-dard DMD technique at several resolutions on fast varyingdynamicmodes after discarding the backgroundmodes or theslow varying modes. Thereby allowing an image sequence tobe separated into objects moving at different rates against theslowly varying background, thus allowing for multiple tar-get tracking and detection. MR-DMDmethod has efficientlydemonstrated, shifting El Nino from ocean temperaturedata.
The MR-DMD framework implicitly has a windowingarchitecture since it implements the standard DMD on thewindows of fast varying modes iteratively. In contrast, ourproposed method is essentially different. Our proposed W-DMD method runs standard DMD over an overlapping win-dow of consecutive images producing low-rank and sparsemodes at each window of the image sequence. The consecu-tive set of low-rank images forms the W-DMD component-1(C1), whereasW-DMD component-2 (C2) reveals the sparsecomponents. The pseudo-periodic free breathing motionfrom the DCE-MRI sequence is thus compensated by dis-carding the sparse components, i.e. W-DMD(C2).
Later, this W-DMD (C1) is given as an input to standardDMD algorithm to produce set of most significant modes(slow varying) capturing the contrast changes, and leastsignificant modes (fast varying modes) capturing motioncomponents. Using the first three significant DMD modes,the original sequence is then reconstructed via our R-DMDmethod. Thus, utilising the pipeline ofW-DMD and R-DMDwe introduce WR-DMD for the first time to carry out move-ment correction in medical image sequences in a manner thatis both extremely efficient and completely data driven.
3 Data set
The data sets obtained were from 10 healthy volunteers’ asshown in Fig. 4 acquired after injection of 0.05 mmol/kg
123
S. Tirunagari et al.
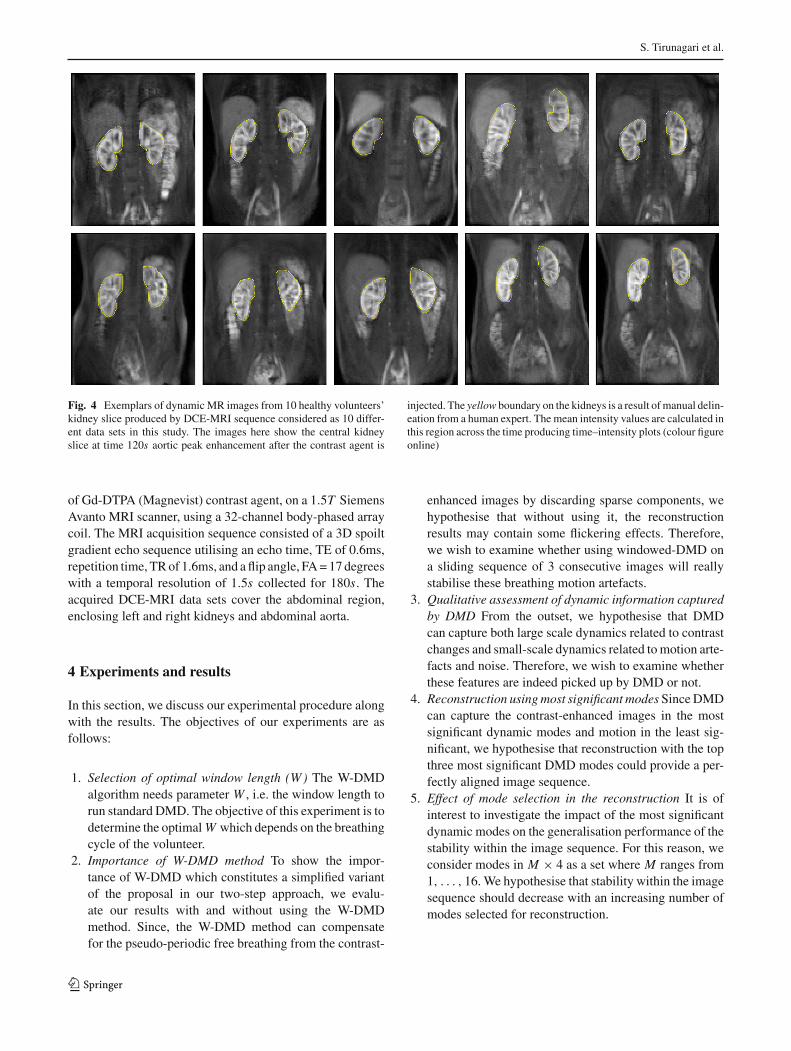
Fig. 4 Exemplars of dynamic MR images from 10 healthy volunteers’kidney slice produced by DCE-MRI sequence considered as 10 differ-ent data sets in this study. The images here show the central kidneyslice at time 120s aortic peak enhancement after the contrast agent is
injected. The yellow boundary on the kidneys is a result ofmanual delin-eation from a human expert. The mean intensity values are calculated inthis region across the time producing time–intensity plots (colour figureonline)
of Gd-DTPA (Magnevist) contrast agent, on a 1.5T SiemensAvanto MRI scanner, using a 32-channel body-phased arraycoil. The MRI acquisition sequence consisted of a 3D spoiltgradient echo sequence utilising an echo time, TE of 0.6ms,repetition time, TRof 1.6ms, and aflip angle, FA=17degreeswith a temporal resolution of 1.5s collected for 180s. Theacquired DCE-MRI data sets cover the abdominal region,enclosing left and right kidneys and abdominal aorta.
4 Experiments and results
In this section, we discuss our experimental procedure alongwith the results. The objectives of our experiments are asfollows:
1. Selection of optimal window length (W) The W-DMDalgorithm needs parameter W , i.e. the window length torun standard DMD. The objective of this experiment is todetermine the optimalW which depends on the breathingcycle of the volunteer.
2. Importance of W-DMD method To show the impor-tance of W-DMD which constitutes a simplified variantof the proposal in our two-step approach, we evalu-ate our results with and without using the W-DMDmethod. Since, the W-DMD method can compensatefor the pseudo-periodic free breathing from the contrast-
enhanced images by discarding sparse components, wehypothesise that without using it, the reconstructionresults may contain some flickering effects. Therefore,we wish to examine whether using windowed-DMD ona sliding sequence of 3 consecutive images will reallystabilise these breathing motion artefacts.
3. Qualitative assessment of dynamic information capturedby DMD From the outset, we hypothesise that DMDcan capture both large scale dynamics related to contrastchanges and small-scale dynamics related tomotion arte-facts and noise. Therefore, we wish to examine whetherthese features are indeed picked up by DMD or not.
4. Reconstruction usingmost significant modes SinceDMDcan capture the contrast-enhanced images in the mostsignificant dynamic modes and motion in the least sig-nificant, we hypothesise that reconstruction with the topthree most significant DMD modes could provide a per-fectly aligned image sequence.
5. Effect of mode selection in the reconstruction It is ofinterest to investigate the impact of the most significantdynamic modes on the generalisation performance of thestability within the image sequence. For this reason, weconsider modes in M × 4 as a set where M ranges from1, . . . , 16.We hypothesise that stability within the imagesequence should decrease with an increasing number ofmodes selected for reconstruction.
123
Movement correction in DCE-MRI through windowed and reconstruction dynamic mode decomposition
6. Comparison with other registration methodsWe wish toexamine the performance strength of our approach bycomparing with two registration methods from the liter-ature.
4.1 Evaluation
The evaluation of our experiments is based on two perspec-tives.
1. From the clinical perspective, we would like to exam-ine the feasibility of using our approach as a means forremoving respiratory motion artefacts from the dynamicimage sequence containing dramatic regional changes inintensity due to contrast agent flow affecting the qualityof the resulting time–intensity curves used for analy-sis. The curves are produced by calculating the meanintensity of the target ROI in an image, which in thiscase is based on the kidney. ROI analysis using time–intensity curves containing respiratory motion artefactsmay affect subsequent compartmental model fitting, asthe motion may also obscure subtle time–intensity fea-tures. Therefore, we have considered the smoothness ofthe time–intensity curve as a surrogate metric for qualityof motion compensation. The smoother this curve is, thebetter the performance.
2. From the signal processing and computer vision per-spective, we would like to examine the strength ofour approach by calculating the mean motion magni-tude across the DCE-MRI sequence. Since, the respi-ratory motion represents an obfuscating issue withinthe dynamic image sequence, it distracts attention awayfrom, and potentiallymasks, areas thatmay exhibit subtlepathology within the image. For this purpose, we eval-uate the motion between two consecutive images overthe entirely reconstructed dynamic sequence in order tocharacterise the amount of motion as an indication of thestability of the dynamic sequence. This criteria is evalu-ated using amethod called block-matching-blockmotionestimation [1]. A well-reconstructed dynamic sequenceshould have a smaller overall global mean.
4.2 Selection of optimal W (window length)
In order to determine optimal W , we would like to seewhether there exists any periodicity in the motion. For thispurpose, we calculate the motion amongst the images in thesequencewith respect to thefirst image using block-matchingalgorithm. This algorithm estimates the motion between twoimages using ‘blocks’ of pixels, i.e. by matching the block ofpixels in image K to a block of pixels in image K ′ bymovingthe block of pixels over a search region. The block subdi-vides the image K in block sizes [height width] and Overlap
Frames
Mo
tio
n m
agn
itu
de
0
5
10
15
20
25
30
35
40
45
0 20 40 60 80 100 120
0 5 100
5
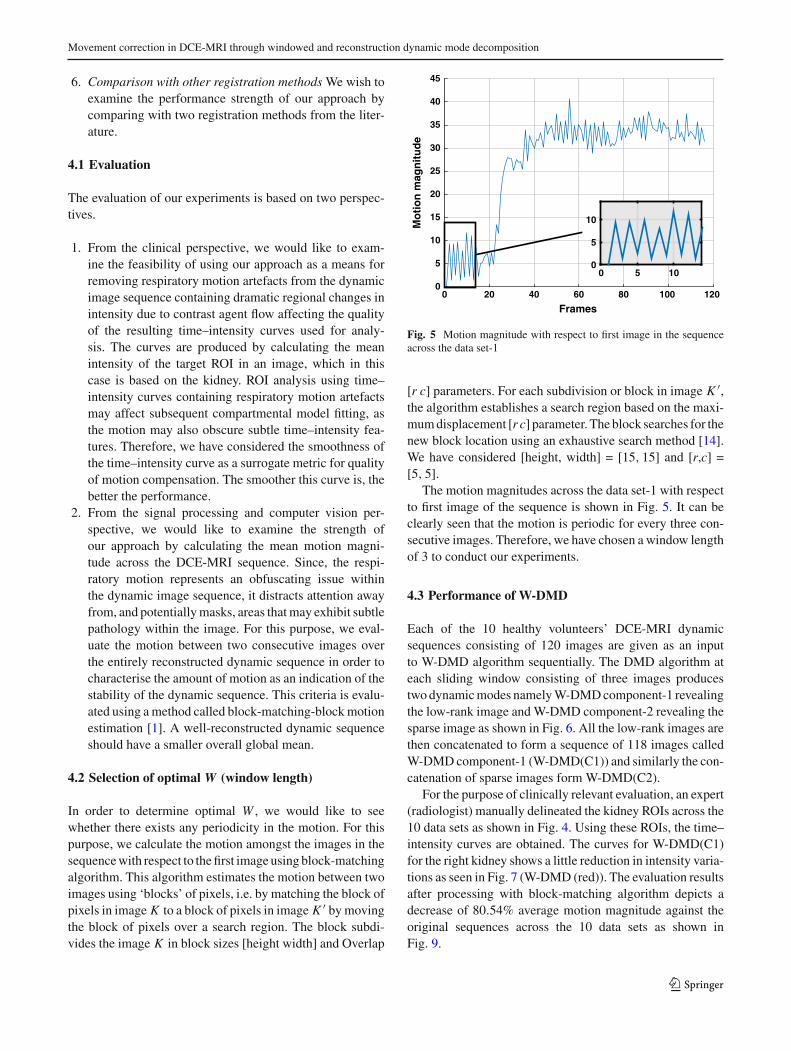
10
Fig. 5 Motion magnitude with respect to first image in the sequenceacross the data set-1
[r c] parameters. For each subdivision or block in image K ′,the algorithm establishes a search region based on the maxi-mumdisplacement [r c] parameter. The block searches for thenew block location using an exhaustive search method [14].We have considered [height, width] = [15, 15] and [r,c] =[5, 5].
The motion magnitudes across the data set-1 with respectto first image of the sequence is shown in Fig. 5. It can beclearly seen that the motion is periodic for every three con-secutive images. Therefore, we have chosen a window lengthof 3 to conduct our experiments.
4.3 Performance of W-DMD
Each of the 10 healthy volunteers’ DCE-MRI dynamicsequences consisting of 120 images are given as an inputto W-DMD algorithm sequentially. The DMD algorithm ateach sliding window consisting of three images producestwodynamicmodes namelyW-DMDcomponent-1 revealingthe low-rank image andW-DMD component-2 revealing thesparse image as shown in Fig. 6. All the low-rank images arethen concatenated to form a sequence of 118 images calledW-DMDcomponent-1 (W-DMD(C1)) and similarly the con-catenation of sparse images form W-DMD(C2).
For the purpose of clinically relevant evaluation, an expert(radiologist) manually delineated the kidney ROIs across the10 data sets as shown in Fig. 4. Using these ROIs, the time–intensity curves are obtained. The curves for W-DMD(C1)for the right kidney shows a little reduction in intensity varia-tions as seen in Fig. 7 (W-DMD (red)). The evaluation resultsafter processing with block-matching algorithm depicts adecrease of 80.54% average motion magnitude against theoriginal sequences across the 10 data sets as shown inFig. 9.
123

S. Tirunagari et al.
Fig. 6 (Top) five images from data set-1’s W-DMD(C1) at time = {30,50,74,82,100}s showing the low-rank images. The first image shows thepeak stage of contrast agent inside the kidney region. (Bottom) Corresponding images from the W-DMD(C2) showing their sparse representation
Time
RO
I Mea
n In
ten
sity
0
0.2
0.4
0.6
0.8
1
OriginalW-DMDWR-DMDR-DMD
Time
RO
I Mea
n In
ten
sity
0
0.2
0.4
0.6
0.8
1
OriginalW-DMDWR-DMDR-DMD
Time
RO
I Mea
n In
ten
sity
0
0.2
0.4
0.6
0.8
1
OriginalW-DMDWR-DMDR-DMD
Time
RO
I Mea
n In
ten
sity
0
0.2
0.4
0.6
0.8
1
OriginalW-DMDWR-DMDR-DMD
Time
RO
I Mea
n In
ten
sity
0
0.2
0.4
0.6
0.8
1
OriginalW-DMDWR-DMDR-DMD
Time
RO
I Mea
n In
ten
sity
0
0.2
0.4
0.6
0.8
1
OriginalW-DMDWR-DMDR-DMD
Time
RO
I Mea
n In
ten
sity
0
0.2
0.4
0.6
0.8
1
OriginalW-DMDWR-DMDR-DMD
Time
RO
I Mea
n In
ten
sity
0
0.2
0.4
0.6
0.8
1
OriginalW-DMDWR-DMDR-DMD
Time
RO
I Mea
n In
ten
sity
0
0.2
0.4
0.6
0.8
1
OriginalW-DMDWR-DMDR-DMD
Time
20 40 60 80 100 20 40 60 80 100 20 40 60 80 100 20 40 60 80 100 20 40 60 80 100
20 40 60 80 100 20 40 60 80 100 20 40 60 80 100 20 40 60 80 100 20 40 60 80 100
RO
I Mea
n In
ten
sity
0
0.2
0.4
0.6
0.8
1
OriginalW-DMDWR-DMDR-DMD
Fig. 7 Time–intensity curves across 10 data sets (sequentially from left to right)
4.4 Importance of W-DMD
In order to examine the strength of W-DMD, we directlyinput each of the ten healthy volunteers’ DCE-MRI dynamicsequences to the standard DMD algorithm. Using the topthree most significant modes, the original sequence is recon-structed using our R-DMD method. The results in Fig. 9show greater motion magnitude when compared to resultsobtained through W-DMD on the data sets {1, 4, 9, 10}. Thetime–intensity plots in Fig. 7 from data sets {2, 3, 5, 6, 7, 9}reveal a greater amount of fluctuations from the graphs pro-duced by the R-DMD method even though the results of
their mean motion magnitude are lower when compared toW-DMD method. This proves our hypothesis that althoughexcluding theW-DMDstep stabilises themotion globally, theperiodic free breathing would still remain locally. Therefore,discarding the sparse components, i.e. W-DMD(C2) elim-inates periodic free breathing from the contrast-enhancedimages.
4.5 Qualitative assessment of DMD
In the next step, the W-DMD(C1) containing the low-rankimages are then given as an input to DMD algorithm produc-
123

Movement correction in DCE-MRI through windowed and reconstruction dynamic mode decomposition
Fig. 8 (Top) The top six most significant DMD modes on W-DMD(C1) from data set-1. (Bottom) bottom six least significant DMD modes onW-DMD(C1)
ing 117 dynamic modes. The first mode reveals the low-rankmodel across all the images and the remaining 116 modescapture the sparse representations. The contrast changes arecaptured in the most significant modes, in particular, mode-2capturing kidney region and mode-3 and 4, spleen and theliver regions, respectively, as shown in Fig. 8 (top) for dataset-1.
Noise and residuals including the motion components arecaptured in the least significant modes [Fig. 8 (bottom)].
4.6 Reconstruction using most significant modes
Thefirst threemodes are selected for the reconstruction of theW-DMD(C1) sequence of images, discarding the rest of the113 modes. The reconstructed W-DMD(C1) using the WR-DMD algorithm produces a very promising and stable imagesequence compensating for all the complex movements. Thequalitative results obtained from the WR-DMD (black) inFig. 7 show smoother curves in the time–intensity plotswhen compared to the original sequence and W-DMD(C1)sequence. Complete complexmovement artefacts arising dueto respiration, pulsation and involuntary movements are allcompensated through theWR-DMD reconstructed images asshown in Fig. 9. A decrease of 99% average motion magni-tude can be seen against the original sequences across the 10data sets.
4.7 Effect of mode selection in the reconstruction
Since reconstruction needs to operatewith significantmodes,it is of interest to find out the minimum number of modesrequired. We hypothesise that a greater number of modesshould result in less stable performance; however, at the same
time, we would like to know the minimum number of modesthat are required to reconstruct the original sequence. Con-sequently, we select the windows of the first {4, 8, . . . 64}images.We can consider atmost 64modes because onemem-ber of each conjugate pairs of the DMD mode is redundant.Consequently, we are left with 61–62 modes. The results inFig. 10 reveal that as the number ofmodes increases, themeanmotionmagnitude also increases, consistentwith our hypoth-esis that a greater number of modes results in increasedmotion variance (methodologically, we would expect theoptimal number of DMD modes to be data dependent).
4.8 Comparison with other registration methods
In order to compare our approach with registration-basedmethods, we should follow a gold standard approach thatis manually delineating the target region and performingthe rigid registration, which requires a human expert andis inconvenient. Nevertheless, to obtain a fair comparison, ahuman expert manually delineated the area around the rightkidney region. Therefore, we have selected only this part ofthe delineated region for the registration and not the wholeimage.We have opted to use intensity-basedmethods such asAffine and translation registration methods for our compari-son, since thesemethods are less sensitive to contrast change,and their implementation is freely available.
Evaluating the performance of our approach onDCE-MRIdata is difficult due to the lack of the prior knowledge oncontrast change and the motion.
One way of evaluating the performance is to calculate thetotal variation score given by the estimate of the standarddeviation of the consecutive m time–intensity data pointst[i] ∀i ∈ {1, . . . ,m}. Smaller values indicate smoother time
123
S. Tirunagari et al.
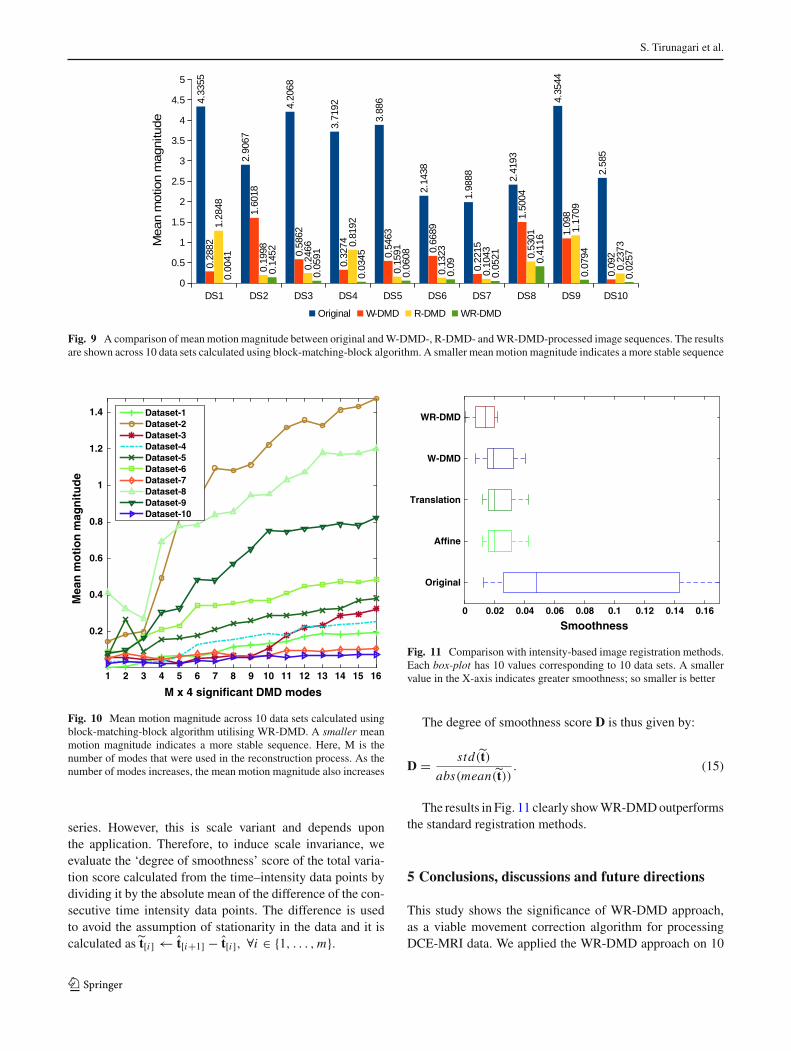
Fig. 9 A comparison of meanmotion magnitude between original andW-DMD-, R-DMD- andWR-DMD-processed image sequences. The resultsare shown across 10 data sets calculated using block-matching-block algorithm. A smaller mean motion magnitude indicates a more stable sequence
M x 4 significant DMD modes
1 2 3 4 5 6 7 8 9 10 11 12 13 14 15 16
Mea
n m
oti
on
mag
nit
ud
e
0.2
0.4
0.6
0.8
1
1.2
1.4 Dataset-1Dataset-2Dataset-3Dataset-4Dataset-5Dataset-6Dataset-7Dataset-8Dataset-9Dataset-10
Fig. 10 Mean motion magnitude across 10 data sets calculated usingblock-matching-block algorithm utilising WR-DMD. A smaller meanmotion magnitude indicates a more stable sequence. Here, M is thenumber of modes that were used in the reconstruction process. As thenumber of modes increases, the mean motion magnitude also increases
series. However, this is scale variant and depends uponthe application. Therefore, to induce scale invariance, weevaluate the ‘degree of smoothness’ score of the total varia-tion score calculated from the time–intensity data points bydividing it by the absolute mean of the difference of the con-secutive time intensity data points. The difference is usedto avoid the assumption of stationarity in the data and it iscalculated as t[i] ← t[i+1] − t[i], ∀i ∈ {1, . . . ,m}.
Smoothness0 0.02 0.04 0.06 0.08 0.1 0.12 0.14 0.16
Original
Affine
Translation
W-DMD
WR-DMD
Fig. 11 Comparison with intensity-based image registration methods.Each box-plot has 10 values corresponding to 10 data sets. A smallervalue in the X-axis indicates greater smoothness; so smaller is better
The degree of smoothness score D is thus given by:
D = std (t)
abs(mean(t)). (15)
The results in Fig. 11 clearly showWR-DMDoutperformsthe standard registration methods.
5 Conclusions, discussions and future directions
This study shows the significance of WR-DMD approach,as a viable movement correction algorithm for processingDCE-MRI data. We applied the WR-DMD approach on 10
123

Movement correction in DCE-MRI through windowed and reconstruction dynamic mode decomposition
data sets of DCE-MRI data collected from healthy volun-teers. Theproposed algorithmhas very low timecomplexity1.In addition, compared to existing methods, e.g. RDDR &STICA, it has the advantage of requiring no parameter tun-ing.W-DMDcan extract low-rank and sparse representationswithin an image sequence. The motion artefacts for periodicfree breathing are captured in the sparse components. Thelow-rank W-DMD component-1 is then given as an input tothe standard DMD algorithm producing dynamic modes. Wefound that the contrast changes are captured in the most sig-nificant dynamic modes and motion in the least significantones. The original sequence is then reconstructed utilisingthe top three most significant dynamic modes using R-DMD.The results demonstrate that the proposedWR-DMDmethodis a promising approach for correcting respiratory or similarmotions in complex dynamic medical image sequences con-taining significant temporal intensity changes due to contrastagent uptake or other comparable mechanisms.
The major point of discussion would be in answeringwhether the WR-DMD framework be sufficiently robustwhen it comes to scanning patients who tend to be moresusceptible to motion artefacts? From the clinical point ofview, this can only be answered with a conjecture as we haveno patient data but we would argue ‘yes’ [29]. This questionprovides a good opportunity to recognise that both volunteersand patients will be susceptible to motion. From computervision and signal processing point of view, W-DMD, in thisstudy has been demonstrated for removing pseudo-periodicbreathing motion. It is always necessary to check whetherthere exists any pseudo-periodic breathing in the data set.For this purpose, motion amongst the images in the sequencewith respect to the first image should be calculated usingblock-matching algorithm as discussed in Sect. 4.2. Later,the number of images for which themotion is periodic shouldbe determined. For example, in Sect. 4.2 we show that themotion was periodic for every three images in our data sets,and hence, we setW=3 as a parameter inW-DMD to conductour experiments. Similarly if the periodicity in the motion isobserved for ‘n’ images for a patient/ healthy volunteer, espe-cially children, who tend to be more susceptible to motionartefacts, we conjecture thatmaking thewindow length adap-tive to ‘n’ might be sufficient to tackle the pseudo-periodicmotion.
The adaptive version of the W-DMD forms our futurework. In addition to that, DMD, in this study, also has demon-strated to extract dominating regions of causally-connectedintensity fluctuations. In this context, perfusion inside thekidney region is the most dominating region with the inten-sity fluctuations due to the injection of contrast agent. DMD
1 That is, image sequence containing 120 frames each of size 120×104takes about 3–5s to compute on a desktop computer with 8GB of RAMmemory running Intel(R) Core(TM) i5-4590 CPU @ 3.30GHz.
was thus able to naturally capture the kidney region as mode-2 followed by liver and spleen in the other modes. Therefore,in our future work we would like to perform segmentationof the kidney region of interest for automatically quantify-ing the kidney function. Finally, we would like to explorethe possibility of using our proposed methodology in auto-matically correcting for the movements in ‘coloured’ [32]aerial images which are captured of the same terrain but ondifferent days.
Acknowledgements The funding for this work has been provided bythe Department of Computer Science and the Centre for Vision, Speechand Signal Processing (CVSSP)—University of Surrey. ‘I.G’ wouldlike to express gratitude towards Kidney Research, UK, for funding theDCE-MRI data acquisition as part of a reproducibility study. ‘S.T’ and‘N.P’ have benefited from theMedical ResearchCouncil (MRC) fundedproject ‘Modelling the Progression of Chronic Kidney Disease’ underthe grant number R/M023281/1. The details of the project are availableat www.modellingCKD.org. ‘D.W’ acknowledges the financial supportfrom the Horizon 2020 European Research project ‘DREAMS4CARS’(#731593).
Open Access This article is distributed under the terms of the CreativeCommons Attribution 4.0 International License (http://creativecommons.org/licenses/by/4.0/), which permits unrestricted use, distribution,and reproduction in any medium, provided you give appropriate creditto the original author(s) and the source, provide a link to the CreativeCommons license, and indicate if changes were made.
References
1. Barjatya, A.: Block matching algorithms for motion estimation.IEEE Trans. Evolut. Comput. 8(3), 225–239 (2004)
2. Berger, E., Sastuba, M., Vogt, D., Jung, B., Amor, H.B.: Dynamicmode decomposition for perturbation estimation in human robotinteraction. In: The 23rd IEEE International Symposium on Robotand Human Interactive Communication, pp. 593–600 (2014).doi:10.1109/ROMAN.2014.6926317
3. Brunton, B.W., Johnson, L.A., Ojemann, J.G., Kutz, J.N.: Extract-ing spatial–temporal coherent patterns in large-scale neural record-ings using dynamic mode decomposition. J. Neurosci. Methods258, 1–15 (2016)
4. Candès, E.J., Li,X.,Ma,Y.,Wright, J.: Robust principal componentanalysis? J. ACM (JACM) 58(3), 11 (2011)
5. Crum, W., Tanner, C., Hawkes, D.: Anisotropic multi-scale fluidregistration: evaluation in magnetic resonance breast imaging.Phys. Med. Biol. 50(21), 5153 (2005)
6. Gerig, G., Kikinis, R., Kuoni,W., von Schulthess, G.K., Kübler, O.:Semiautomated roi analysis in dynamic MR studies. Part I: imageanalysis tools for automatic correction of organ displacements. J.Comput. Assist. Tomogr. 15(5), 725–732 (1991)
7. Grosek, J., Kutz, J.N.: Dynamic mode decomposition for real-time background/foreground separation in video. arXiv preprintarXiv:1404.7592 (2014)
8. Grosek, J., Kutz, J.N.: Dynamic mode decomposition forreal-time background/foreground separation in video. CoRRarXiv:abs/1404.7592 (2014)
9. Hamy, V., Dikaios, N., Punwani, S., Melbourne, A., Latifolto-jar, A., Makanyanga, J., Chouhan, M., Helbren, E., Menys, A.,Taylor, S., et al.: Respiratory motion correction in dynamic mri
123

S. Tirunagari et al.
using robust data decomposition registration-application to dce-mri. Med. Image Anal. 18(2), 301–313 (2014)
10. Kiani, S., Gordon, I., Windridge, D., Wells, K.: On-line spatio-temporal independent component analysis for motion correction inrenal dce-mri. In: Nuclear Science Symposium andMedical Imag-ing Conference (NSS/MIC), 2012 IEEE, pp. 2910–2915. IEEE(2012)
11. Krylov, A.: On the numerical solution of the equation by whichin technical questions frequencies of small oscillations of materialsystems are determined. Izvestija AN SSSR (News of Academy ofSciences of the USSR), Otdel. mat. i estest. nauk 7(4), 491–539(1931)
12. Kutz, J.N., Fu, X., Brunton, S.L.: Multiresolution dynamic modedecomposition. SIAM J. Appl. Dyn. Syst. 15(2), 713–735 (2016)
13. Lee, V.S., Rusinek, H., Noz, M.E., Lee, P., Raghavan, M., Kramer,E.L.: Dynamic three-dimensional mr renography for the measure-ment of single kidney function: Initial experience 1. Radiology227(1), 289–294 (2003)
14. Li, R., Zeng, B., Liou, M.L.: A new three-step search algorithm forblockmotion estimation. IEEETrans.Circuits Syst.VideoTechnol.4(4), 438–442 (1994)
15. Maintz, J.A., Viergever, M.A.: A survey of medical image regis-tration. Med. Image Anal. 2(1), 1–36 (1998)
16. Mann, J., Kutz, J.N.: Dynamic mode decomposition for financialtrading strategies. Quant. Finance 16(11), 1643–1655 (2016)
17. Melbourne, A., Atkinson, D., White, M., Collins, D., Leach, M.,Hawkes,D.: Registration of dynamic contrast-enhancedMRI usinga progressive principal component registration (ppcr). Phys. Med.Biol. 52(17), 5147 (2007)
18. Melbourne, A., Hipwell, J., Modat, M., Mertzanidou, T., Huis-man, H., Ourselin, S., Hawkes, D.: The effect of motion correctionon pharmacokinetic parameter estimation in dynamic-contrast-enhanced mri. Phys. Med. Biol. 56(24), 7693 (2011)
19. Modat, M., Ridgway, G.R., Taylor, Z.A., Lehmann, M., Barnes, J.,Hawkes, D.J., Fox, N.C., Ourselin, S.: Fast free-form deformationusing graphics processing units. Comput. Methods Progr. Biomed.98(3), 278–284 (2010)
20. Myronenko, A., Song, X.: Intensity-based image registrationby minimizing residual complexity. IEEE Trans. Med. Imaging29(11), 1882–1891 (2010)
21. Rogelj, P., Zoellner, F.G., Kovacic, S., Lundervold, A.: Motioncorrection of contrast-enhanced mri time series of kidney. In: Pro-ceedings of the 16th International Electrotechnical and ComputerScience Conference (ERK 2007), Portoroz, Slovenia, pp. 191–194.Citeseer (2007)
22. Ruhe, A.: Rational krylov sequence methods for eigenvalue com-putation. Linear Algebra Appl. 58, 391–405 (1984)
23. Saad, Y.: Krylov subspace methods for solving large unsymmetriclinear systems. Math. Comput. 37(155), 105–126 (1981)
24. Sayadi, T., Schmid, P.,Nichols, J.,Moin, P.:Dynamicmode decom-position of controlled h-and k-type transitions. Annual ResearchBriefs (Center for Turbulence Research, 2013) p. 189 (2013)
25. Schmid, P., Li, L., Juniper, M., Pust, O.: Applications of thedynamic mode decomposition. Theor. Comput. Fluid Dyn. 25(1–4), 249–259 (2011)
26. Schmid, P.J.: Dynamic mode decomposition of numerical andexperimental data. J. Fluid Mech. 656, 5–28 (2010)
27. Schmid, P.J., Meyer, K.E., Pust, O.: Dynamic mode decompositionand proper orthogonal decomposition of flow in a lid-driven cylin-drical cavity. In: 8th International Symposium on Particle ImageVelocimetry, pp. 25–28 (2009)
28. Schmid, P.J., Sesterhenn, J.L.: Dynamic mode decomposition ofnumerical and experimental data. In Bull. Amer. Phys. Soc., 61stAPS meeting, San Antonio p. 208 (2008)
29. de Senneville, B.D., Mendichovszky, I.A., Roujol, S., Gordon,I., Moonen, C., Grenier, N.: Improvement of MRI-functional
measurement with automatic movement correction in native andtransplanted kidneys. J. Magn. Reson. Imaging 28(4), 970–978(2008)
30. Stone, J., Porrill, J., Porter, N., Wilkinson, I.: Spatiotemporalindependent component analysis of event-related fmri data usingskewed probability density functions. NeuroImage 15(2), 407–421(2002)
31. Tirunagari, S., Poh, N., Bober, M., Windridge, D.: Windowed dmdas a microtexture descriptor for finger vein counter-spoofing inbiometrics. In: Information Forensics and Security (WIFS), 2015IEEE International Workshop on. IEEE (2015)
32. Tirunagari, S., Poh, N., Bober, M., Windridge, D.: Can dmd obtaina scene background in color? In: Image, Vision and Computing(ICIVC), International Conference on, pp. 46–50. IEEE (2016)
33. Tirunagari, S., Poh, N., Windridge, D., Iorliam, A., Suki, N., Ho,A.T.: Detection of face spoofing using visual dynamics. IEEETrans. Inf. Forensics Secur. 10(4), 762–777 (2015)
34. Tirunagari, S., Vuorinen, V., Kaario, O., Larmi, M.: Analysis ofproper orthogonal decomposition and dynamic mode decomposi-tion on les of subsonic jets. CSI J. Comput. 1, 20–26 (2012)
35. Wollny,G., Kellman, P., Santos,A., Ledesma-Carbayo,M.J.: Auto-matic motion compensation of free breathing acquired myocardialperfusion data by using independent component analysis. Med.Image Anal. 16(5), 1015–1028 (2012)
36. Zikic, D., Sourbron, S., Feng, X., Michaely, H.J., Khamene, A.,Navab, N.: Automatic alignment of renal DCE-MRI image seriesfor improvement of quantitative tracer kinetic studies. In: MedicalImaging, (pp. 691432–691432). International Society for Opticsand Photonics (2008)
37. Zöllner, F.G., Sance, R., Rogelj, P., Ledesma-Carbayo, M.J.,Rørvik, J., Santos, A., Lundervold, A.: Assessment of 3D DCE-MRI of the kidneys using non-rigid image registration and seg-mentation of voxel time courses. Comput. Med. Imaging Gr. 33(3),171–181 (2009)
SantoshTirunagari isResearchFellow in Computer Scienceat University of Surrey. Hisresearch interests centre on thefields of probabilistic machinelearning, statistical signal pro-cessing and computer vision,with a former research interestin computational fluid dynamics.He obtained his PhD in computerScience from the University ofSurrey in the year 2017. He haspublished more than 25 peer-reviewed publications and wonthe best research potential and
the best presentation awards (PhDCompConf 2015, IEEE ICIVC2016).He was also a session chair at IEEE SSCI held at Athens, in 2016. Heis a member of IEEE as well as a member of IEEE SPS and IEEE CIS.
123

Movement correction in DCE-MRI through windowed and reconstruction dynamic mode decomposition
Norman Poh is a Senior Lec-turer in the Department of Com-puter Science. He received thePh.D. degree in computer sci-ence in 2006 from the SwissFederal Institute of TechnologyLausanne (EPFL), Switzerland.His work focuses on advanc-ing pattern recognition tech-niques with applications to bio-metrics, healthcare analytics, andbig data. In these areas, he haspublished more than 100 publi-cations, won five award-winningpapers (AVBPA05, ICB09, HSI
2010, ICPR2010 andPatternRecognition Journal 2006) andResearcherof the Year 2011 Award, University of Surrey. He was awarded twopersonal research grants from the Swiss National Science Foundation(Young Prospective Researcher Fellowship and Advanced ResearcherFellowships). He is the PI of the MRC-funded “Modelling CKD pro-gression” (www.modellingCKD.org). He is a member of IEEE andIAPR, an IEEE Certified Biometrics Professional and trainer, and amember of the Education Committee of the IEEE Biometric Council.
Kevin Wells is Reader in Med-ical Imaging at the Centre forVision Speech & Signal Process-ing at the University of Surrey.Prior to his current academicposition at Surrey, he previouslyworked at the Institute of CancerResearch/Royal Marsden Hos-pital, University College Lon-don and University of Bath. Hisresearch interests revolve aroundimage analysis and simulation,and novel imaging technologies,with particular interests in res-piratory motion modelling and
mammography, funded from CancerResearchUK, RC-UK, variouscharitable and industrial partners. He has over 140 publications, withhis work being recognised via an IET Innovations award (2012), SPIECum Laude (2010) and SPIE Honorable Mention (2015) awards. Heis a member of the Institute of Physics, a Chartered Physicist and aChartered Engineer.
Miroslaw Bober is a professorof Video Processing at the Uni-versity of Surrey, U.K. In 2011he co-foundedVisualAtomsLtd,a start-up specializing in VisualSearch Technologies. Between1997 and 2011 he headed Mit-subishi Electric Corporate R&DCenter Europe (MERCE-UK).Prof. Bober received the MScand PhD degrees from Univer-sity of Surrey, in 1991 and 1995,respectively. His research inter-ests include various aspects ofcomputer vision and machine
intelligence, with recent focus on image/video database retrieval anddatamining.He has been actively involved in the development ofMPEG
standards for over 20 years, chairing the MPEG-7, CDVS and CVDAgroups. Dr. Bober is an inventor of over 70 patents and several of hisinventions are deployed in consumer and professional products. Hispublication record includes over 80 refereed publications, includingthree books and book chapters.
Dr. Isky Gorden is a Con-sultant Radiologist and NuclearMedicine Physician with specialinterest in paediatric imaging.His focus has been on researchinto renal disease especially inchildren with a prenatal diagno-sis of hydronephrosis. He is cur-rently an Emeritus Professor ofPaediatric Radiography at Uni-versity College London, GreatOrmond Street Institute of ChildHealth.
David Windridge is Reader inComputer Science at MiddlesexUniversity and heads the uni-versity’s Data Science group.His research interests centre onthe fields of machine learn-ing, cognitive systems and com-puter vision, with a formerresearch interest in astrophysics(he obtained his Ph.D. in Cos-mology at the University of Bris-tol UK). He has authored andplayed a leading role on a numberof large-scale machine learningprojects in academic and indus-
trial research settings (including the EPSRC ACASVA and EUDIPLECS projects). He has also won a number of interdisciplinaryresearch grants in areas such as psychological modelling and proteomicclassification. He is a Visiting Professor at Trento University, Italy, anda visiting Senior Researcher at the University of Surrey (he was previ-ously a Senior Research Fellow within the Centre for Vision, Speechand Signal Processing). He has authored more than 80 peer-reviewedpublications.
123