Windowed Cross Correlation Sweep to Extract Ultrasonic ...
4
GeoConvention 2020 1 Windowed Cross Correlation Sweep to Extract Ultrasonic Waveforms from Noisy Data for Laboratory Velocities Christopher G. Nixon Douglas R. Schmitt 1 University of Alberta Purdue University Summary Ultrasonic laboratory wave speed measurements were performed on shocked peak ring samples under confining pressure. Waveforms recovered from the samples were problematic with noise saturation in early recording times and low pressure as well as faint S-arrivals at later times. Here, a cross-correlation sweep workflow is presented as an alternative to first-break picking for resolving faint P- and S-wave arrivals in high pressure laboratory tests. Background The Chicxulub impact basin contains the only confirmed intact peak ring on earth and has been the focus of extensive geophysical investigation. Previous examples of imaging methods used include magnetic (Pilkington and Hildebrand, 2000), magnetotelluric (Unsworth et al., 2002), gravity (Hildebrand et al., 1998), and seismic (Gulick et al., 2013; Morgan et al., 2011). A mission to scientifically drill the peak ring (Gulick et al., 2017) demonstrated low in-situ seismic velocities in the crystalline target rock (Lofi et al., 2018; Nixon et al., 2017) and subsequent petrophysical investigations of core recovered from hole M0077A confirmed the anomalously low wave speeds observed (Christeson et al., 2018). Experimental Method and Results Half-round core 135r2 from IODP hole M0077A (Gulick, 2017) was cored to 25.4 mm diameter (Error! Reference source not found.A). Calibrated aluminum endcaps with P and S transducers were placed on each end of the sample (Figure 1C) and clamped in place with an impermeable jacket (Figure 1B). The sample was placed in an oil bath pressure vessel with P and S signals individually pulsed and recorded isothermally at increasing pressures from 3 to 200 MPa. This was then repeated in reverse from 200 to 3 MPa. Further experimental details for these measurements may be found in Cholach et al. (2005). An example of the suite of S-wave waveforms acquired during the measurement (Fig. 2A) illustrates issues encountered with a highly reverberatory noise train at early times. This noise is introduced by inductive RF coupling between the wires connected to the transmitting and receiving piezo-electric ceramics as they pass close together within the pressure fittings. Clear 1 Formerly at University of Alberta Figure 1. A) Peak ring melt core sample used in experiment. B) Core shown with impermeable jacket, endcaps, and transducers attached. C) Simple model depicting sample dimensions.
Transcript of Windowed Cross Correlation Sweep to Extract Ultrasonic ...

GeoConvention 2020 1
Windowed Cross Correlation Sweep to Extract Ultrasonic Waveforms from Noisy Data for Laboratory Velocities Christopher G. Nixon Douglas R. Schmitt1
University of Alberta Purdue University
Summary
Ultrasonic laboratory wave speed measurements were performed on shocked peak ring samples under confining pressure. Waveforms recovered from the samples were problematic with noise saturation in early recording times and low pressure as well as faint S-arrivals at later times. Here, a cross-correlation sweep workflow is presented as an alternative to first-break picking for resolving faint P- and S-wave arrivals in high pressure laboratory tests.
Background
The Chicxulub impact basin contains the only confirmed intact peak ring on earth and has been the focus of extensive geophysical investigation. Previous examples of imaging methods used include magnetic (Pilkington and Hildebrand, 2000), magnetotelluric (Unsworth et al., 2002), gravity (Hildebrand et al., 1998), and seismic (Gulick et al., 2013; Morgan et al., 2011). A mission to scientifically drill the peak ring (Gulick et al., 2017) demonstrated low in-situ seismic velocities in the crystalline target rock (Lofi et al., 2018; Nixon et al., 2017) and subsequent petrophysical investigations of core recovered from hole M0077A confirmed the anomalously low wave speeds observed (Christeson et al., 2018).
Experimental Method and Results
Half-round core 135r2 from IODP hole M0077A (Gulick, 2017) was cored to 25.4 mm diameter (Error! Reference source not found.A). Calibrated aluminum endcaps with P and S transducers were placed on each end of the sample (Figure 1C) and clamped in place with an impermeable jacket (Figure 1B). The sample was placed in an oil bath pressure vessel with P and S signals individually pulsed and recorded isothermally at increasing pressures from 3 to 200 MPa. This was then repeated in reverse from 200 to 3 MPa. Further experimental details for these measurements may be found in Cholach et al. (2005).
An example of the suite of S-wave waveforms acquired during the measurement (Fig. 2A) illustrates issues encountered with a highly reverberatory noise train at early times. This noise is introduced by inductive RF coupling between the wires connected to the transmitting and receiving piezo-electric ceramics as they pass close together within the pressure fittings. Clear
1 Formerly at University of Alberta
Figure 1. A) Peak ring melt core sample used in experiment. B) Core shown with impermeable jacket, endcaps, and transducers attached. C) Simple model depicting sample dimensions.
GeoConvention 2020 2
shear wave arrivals may be seen at high pressures due to a combination of lower sample attenuation and enhanced mechanical coupling between the sample and endcaps.
Velocity Analysis Workflow
Our goal is to attempt to isolate the actual arrivals from the noise as much as possible. A procedure that employs strategic windowing and cross-correlation was developed with the following steps:
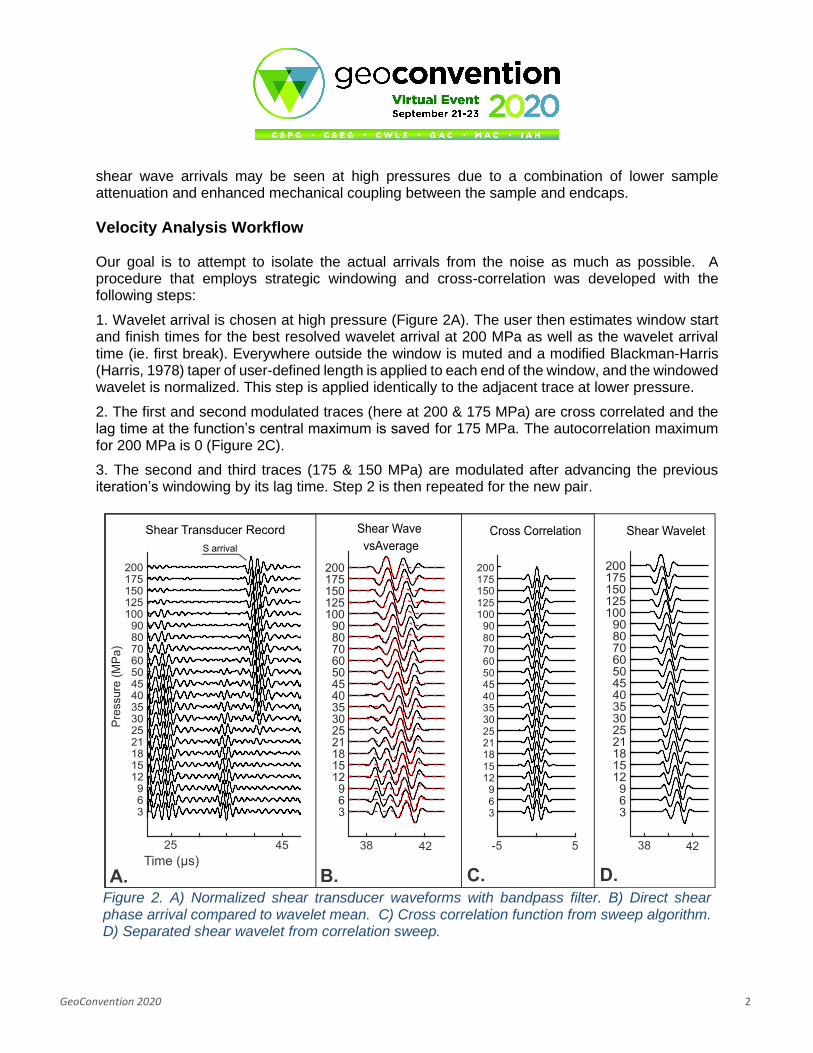
1. Wavelet arrival is chosen at high pressure (Figure 2A). The user then estimates window startand finish times for the best resolved wavelet arrival at 200 MPa as well as the wavelet arrivaltime (ie. first break). Everywhere outside the window is muted and a modified Blackman-Harris(Harris, 1978) taper of user-defined length is applied to each end of the window, and the windowedwavelet is normalized. This step is applied identically to the adjacent trace at lower pressure.
2. The first and second modulated traces (here at 200 & 175 MPa) are cross correlated and thelag time at the function’s central maximum is saved for 175 MPa. The autocorrelation maximumfor 200 MPa is 0 (Figure 2C).
3. The second and third traces (175 & 150 MPa) are modulated after advancing the previousiteration’s windowing by its lag time. Step 2 is then repeated for the new pair.
Figure 2. A) Normalized shear transducer waveforms with bandpass filter. B) Direct shear phase arrival compared to wavelet mean. C) Cross correlation function from sweep algorithm. D) Separated shear wavelet from correlation sweep.
arrival
GeoConvention 2020 3
4. Repeat step 2 & 3 for every adjacent pair.
5. The waveform within the windowed “sweep” (Figure 2D) is averaged (Figure 3). The averageis then plotted with respect to cumulative lag time against the raw traces (Figure 2B).
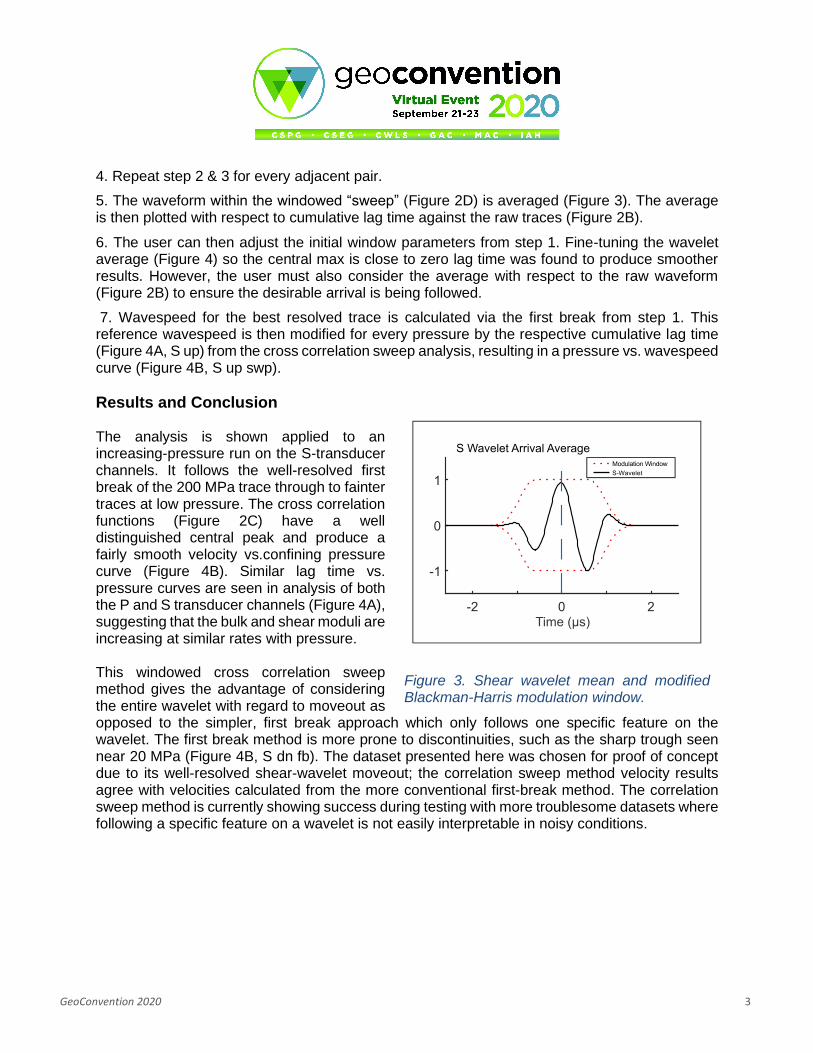
6. The user can then adjust the initial window parameters from step 1. Fine-tuning the waveletaverage (Figure 4) so the central max is close to zero lag time was found to produce smootherresults. However, the user must also consider the average with respect to the raw waveform(Figure 2B) to ensure the desirable arrival is being followed.
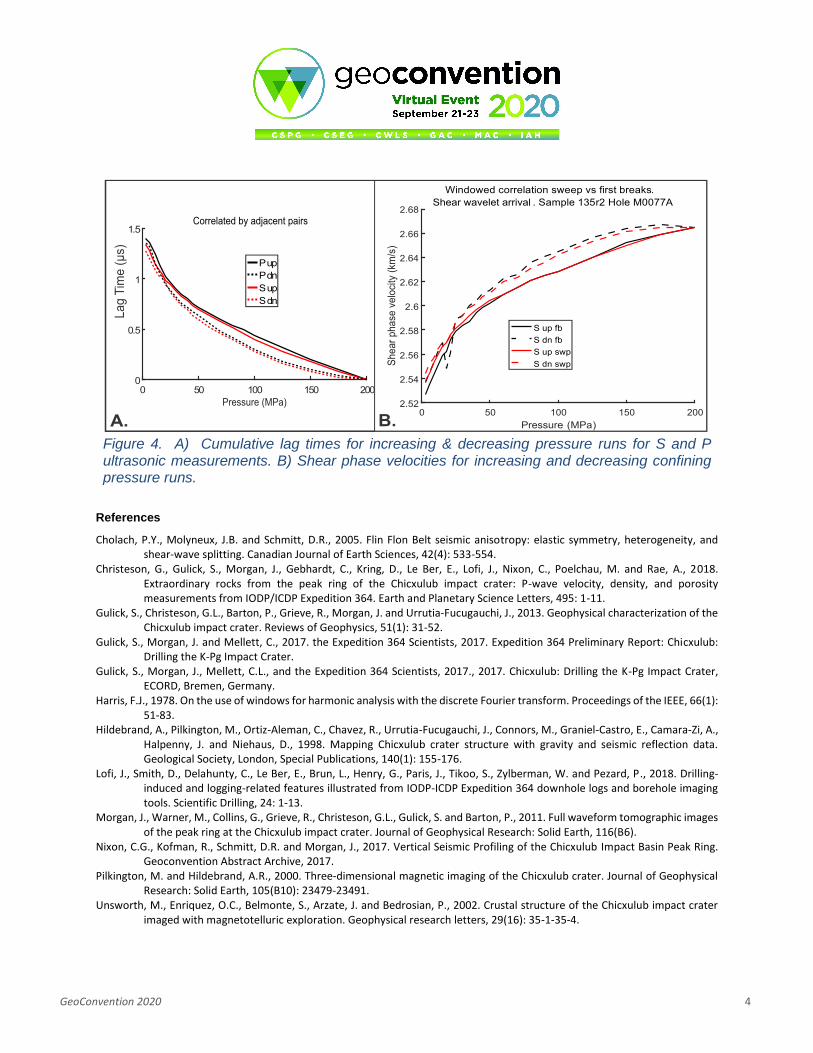
7. Wavespeed for the best resolved trace is calculated via the first break from step 1. Thisreference wavespeed is then modified for every pressure by the respective cumulative lag time(Figure 4A, S up) from the cross correlation sweep analysis, resulting in a pressure vs. wavespeedcurve (Figure 4B, S up swp).
Results and Conclusion
The analysis is shown applied to an increasing-pressure run on the S-transducer channels. It follows the well-resolved first break of the 200 MPa trace through to fainter traces at low pressure. The cross correlation functions (Figure 2C) have a well distinguished central peak and produce a fairly smooth velocity vs.confining pressure curve (Figure 4B). Similar lag time vs. pressure curves are seen in analysis of both the P and S transducer channels (Figure 4A), suggesting that the bulk and shear moduli are increasing at similar rates with pressure.
This windowed cross correlation sweep method gives the advantage of considering the entire wavelet with regard to moveout as opposed to the simpler, first break approach which only follows one specific feature on the wavelet. The first break method is more prone to discontinuities, such as the sharp trough seen near 20 MPa (Figure 4B, S dn fb). The dataset presented here was chosen for proof of concept due to its well-resolved shear-wavelet moveout; the correlation sweep method velocity results agree with velocities calculated from the more conventional first-break method. The correlation sweep method is currently showing success during testing with more troublesome datasets where following a specific feature on a wavelet is not easily interpretable in noisy conditions.
Figure 3. Shear wavelet mean and modified Blackman-Harris modulation window.
odulation indow
avelet
GeoConvention 2020 4
References
Cholach, P.Y., Molyneux, J.B. and Schmitt, D.R., 2005. Flin Flon Belt seismic anisotropy: elastic symmetry, heterogeneity, and shear-wave splitting. Canadian Journal of Earth Sciences, 42(4): 533-554.
Christeson, G., Gulick, S., Morgan, J., Gebhardt, C., Kring, D., Le Ber, E., Lofi, J., Nixon, C., Poelchau, M. and Rae, A., 2018. Extraordinary rocks from the peak ring of the Chicxulub impact crater: P-wave velocity, density, and porosity measurements from IODP/ICDP Expedition 364. Earth and Planetary Science Letters, 495: 1-11.
Gulick, S., Christeson, G.L., Barton, P., Grieve, R., Morgan, J. and Urrutia‐Fucugauchi, J., 2013. Geophysical characterization of the Chicxulub impact crater. Reviews of Geophysics, 51(1): 31-52.
Gulick, S., Morgan, J. and Mellett, C., 2017. the Expedition 364 Scientists, 2017. Expedition 364 Preliminary Report: Chicxulub: Drilling the K-Pg Impact Crater.
Gulick, S., Morgan, J., Mellett, C.L., and the Expedition 364 Scientists, 2017., 2017. Chicxulub: Drilling the K-Pg Impact Crater, ECORD, Bremen, Germany.
Harris, F.J., 1978. On the use of windows for harmonic analysis with the discrete Fourier transform. Proceedings of the IEEE, 66(1): 51-83.
Hildebrand, A., Pilkington, M., Ortiz-Aleman, C., Chavez, R., Urrutia-Fucugauchi, J., Connors, M., Graniel-Castro, E., Camara-Zi, A., Halpenny, J. and Niehaus, D., 1998. Mapping Chicxulub crater structure with gravity and seismic reflection data. Geological Society, London, Special Publications, 140(1): 155-176.
Lofi, J., Smith, D., Delahunty, C., Le Ber, E., Brun, L., Henry, G., Paris, J., Tikoo, S., Zylberman, W. and Pezard, P., 2018. Drilling-induced and logging-related features illustrated from IODP-ICDP Expedition 364 downhole logs and borehole imaging tools. Scientific Drilling, 24: 1-13.
Morgan, J., Warner, M., Collins, G., Grieve, R., Christeson, G.L., Gulick, S. and Barton, P., 2011. Full waveform tomographic images of the peak ring at the Chicxulub impact crater. Journal of Geophysical Research: Solid Earth, 116(B6).
Nixon, C.G., Kofman, R., Schmitt, D.R. and Morgan, J., 2017. Vertical Seismic Profiling of the Chicxulub Impact Basin Peak Ring. Geoconvention Abstract Archive, 2017.
Pilkington, M. and Hildebrand, A.R., 2000. Three‐dimensional magnetic imaging of the Chicxulub crater. Journal of Geophysical Research: Solid Earth, 105(B10): 23479-23491.
Unsworth, M., Enriquez, O.C., Belmonte, S., Arzate, J. and Bedrosian, P., 2002. Crustal structure of the Chicxulub impact crater imaged with magnetotelluric exploration. Geophysical research letters, 29(16): 35-1-35-4.
Figure 4. A) Cumulative lag times for increasing & decreasing pressure runs for S and P ultrasonic measurements. B) Shear phase velocities for increasing and decreasing confining pressure runs.
ressure ( a
indowed correlation sweep vs first rea s
hear wavelet arrival ample r ole
up f
dn f
up swp
dn swp
up
dn
up
dn