
MICROTOTAL ANALYSIS SYSTEM FOR ENZYMATIC DRUG METABOLISM ...
148
The Pennsylvania State University The Graduate School Department of Engineering Science and Mechanics MICROTOTAL ANALYSIS SYSTEM FOR ENZYMATIC DRUG METABOLISM AND ANALYSIS A Thesis in Engineering Science and Mechanics by Daniel J. Hayes Submitted in Partial Fulfillment of the Requirements for the Degree of Doctor of Philosophy May 2004
Transcript of MICROTOTAL ANALYSIS SYSTEM FOR ENZYMATIC DRUG METABOLISM ...

The Pennsylvania State University
The Graduate School
Department of Engineering Science and Mechanics
MICROTOTAL ANALYSIS SYSTEM FOR ENZYMATIC DRUG
METABOLISM AND ANALYSIS
A Thesis in
Engineering Science and Mechanics
by
Daniel J. Hayes
Submitted in Partial Fulfillment of the Requirements
for the Degree of
Doctor of Philosophy
May 2004

ii
The thesis of Daniel J. Hayes was reviewed and approved* by the following:
Stephen J. Fonash Kunkle Chair of Engineering Thesis Advisor Chair of Committee
Sabih Hayek Distinguished Professor Emeritus of Engineering Mechanics
Osama O. Awadelkarim Professor of Engineering Science and Mechanics
Gregory S. Mc Carty Research Assistant
Seong H. Kim Assistant Professor of Chemical Engineering
Judith A. Todd Breneman Chair of Engineering Science and Mechanics Head of the Department of Engineering Science and Mechanics
*Signatures are on file in the Graduate School

iii
ABSTRACT
The goal of this thesis was to develop a laser based, matrix free, desorption and
ionization mass spectrometry technique in a microscale array format that would have
immediate application for drug and drug metabolite studies. This study also had a
broader overriding goal contributing to the body of knowledge of cell patterning and
microfluidic systems on a chip research. The research explored novel cell patterning
techniques and biochemical sensing devices utilizing organic and inorganic low
temperature deposited thin films. Specifically, this research sought to fabricate a
microscale, cell based, device for drug metabolism testing using novel deposited thin
films. This device was designed to identify and quantify drugs and associated metabolite
products.
A system utilizing liver derived microsomes and photocatalyzed PEG hydrogels
can be used to pattern functional cytochrome p450 enzymes in situ, in PDMS
microfluidic devices. This microfluidics system can then be used to biotransform drug
molecules by enzymatic reaction. The metabolism products of the reaction can be
identified and quantified by direct LDI-MS from the surface of chip.
This study has shown the feasibility of conducting drug metabolism reactions and
high speed LDI-MS analysis in a high throughput, PDMS chip based format. LDI-MS is
a sensitive and rapid screening method which can analyze compounds in seconds
compared to minutes for the state of the art electrospray ionization techniques. A
microscale based system offers the advantages of the reduction of: costly sample
consumption, waste by products and cross contamination issues. This technology

iv
coupled to a low cost, high speed, parallel device array platform can make a near term
impact on the drug discovery industry by providing high content data on drug behavior
and structure at early stages of the drug development cycle.
v
TABLE OF CONTENTS
LIST OF FIGURES .....................................................................................................viii
LIST OF TABLES.......................................................................................................xi
ACKNOWLEDGEMENTS.........................................................................................xii
Chapter 1 Introduction ................................................................................................1
1.1 Objective........................................................................................................3 1.1 Scope of Work ...............................................................................................4 1.2 Development of the Subject............................................................................6
Chapter 2 Current Theories, Research and Methods for Cell and Cell Component Patterning and Mass Spectrometry .......................................................................8
2.1 Background of Cell Patterning Techniques....................................................8 2.2 Pattern Formation In Vivo...............................................................................9 2.3 In Vitro Cell Patterning...................................................................................12 2.4 Recent Experimental Methods and Results ....................................................14 2.5 Modern Mass Spectrometry Techniques and Small Molecule Analysis ........21 2.6 Device design and performance requirements for a cell based microscale
drug metabolite analysis system....................................................................26
Chapter 3 Deposited Thin Films for Cell, Cell Component and Protein Patterning...27
3.1 Materials and experimental procedures ..........................................................30 3.1.1 Thin film deposition techniques and pattern formation .......................30
3.1.1.1 Electron cyclotron resonance plasma enhanced chemical vapor deposition..............................................................................30
3.1.1.2 Evaporation and GLAD .............................................................34 3.1.1.3 Formation of PEG hydrogel thin films.......................................35 3.1.1.4 Thin film annealing ....................................................................38 3.1.1.5 Silicide formation.......................................................................39 3.1.1.6 Photolithography and liftoff .......................................................40
3.1.2 Methods of characterizing deposited thin films and analysis of experiments ............................................................................................42 3.1.2.1 Solution contact angle determination........................................42 3.1.2.2 Microscopy.................................................................................42 3.1.2.3 X-ray photoelectron spectroscopy (XPS)...................................43
3.1.3 Cell culture methods.............................................................................44 3.1.3.1 Cell Culture ................................................................................44 3.1.3.2 Cell organelles............................................................................45 3.1.3.3 Cell and cell organelle fixation and staining ..............................45

vi
3.1.3.4 Thin film stability study .............................................................46 3.1.3.5 Flow cell apparatus and protocol ...............................................46
3.2 Results and discussion ....................................................................................48 3.2.1 DI water contact angle determination...................................................48 3.2.2 Flow cell studies ...................................................................................48 3.2.3 Thin film stability in SBF and annealing study....................................51 3.2.4 Static patterning experiments ...............................................................53 3.2.1 Hepatocyte and Microsome viability and stability in PEG Hydrogel ..63
3.3 Conclusions.....................................................................................................65
Chapter 4 Microfluidics Device Fabrication and Use.................................................67
4.1 PDMS properties ............................................................................................67 4.2 Materials and methods....................................................................................68
4.2.1 Soft lithography and mold fabrication..................................................68 4.2.2 Oxygen plasma treatment and sealing..................................................71 4.2.3 Microfluidics pumping .........................................................................73
4.2.3.1 Electrokinetic pumping power supply and control ....................76 4.2.3.2 Hydrodynamic pumping and control..........................................76
4.2.4 Fluid flow analysis ...............................................................................77 4.2.5 Microfluidic design ..............................................................................78
4.3 Results and discussion ....................................................................................79 4.4 Conclusions.....................................................................................................81
Chapter 5 Matrix-less Laser Desorption and Ionization for Drug Metabolism Studies...................................................................................................................84
5.1 Introduction.....................................................................................................85 5.2 Materials and Methods ...................................................................................87
5.2.1 Thin film deposition techniques ...........................................................87 5.2.2 Mass spectrometry techniques and devices..........................................88 5.2.3 Drug metabolism protocol ....................................................................90 5.2.4 Surface Chemistry Modification ..........................................................92
5.3 Results and Discussions..................................................................................92 5.4 Conclusions.....................................................................................................101
Chapter 6 Microscale, Cell Based Biosensor for High Throughput, In Vitro Drug Metabolism ...........................................................................................................104
6.1 Materials and Methods ...................................................................................105 6.1.1 Chemicals .............................................................................................105 6.1.2 Chip Fabrication ...................................................................................106 6.1.3 Chip Operation .....................................................................................109 6.1.4 On chip enzymatic drug metabolism reaction protocol........................111 6.1.5 Mass Spectrometry Conditions.............................................................113
6.2 Results and discussion ....................................................................................113
vii
6.3 Conclusions.....................................................................................................120
Chapter 7 Conclusions and Recommendations for Future Research..........................123
7.1 Summary of Results........................................................................................123 7.1.1 Cell and cell component patterning......................................................123 7.1.2 LDI-MS for drug metabolite identification and quantization...............125 7.1.3 Microscale, cell based biosensor for high throughput in vitro drug
metabolism .............................................................................................126 7.2 Conclusions.....................................................................................................127 7.3 Recommendations for Future Research..........................................................129
Bibliography ................................................................................................................130

viii
LIST OF FIGURES
Fig. 2-1: Granule cells migrating along radial glial cells.............................................11
Fig. 2-2: Two dimensional view of liver sinusoids and cell distribution.....................11
Fig. 2-3: LRM55 cells growing on micron scale pillars ..............................................16
Fig. 2-4: Fluorescent images of the cytoskeletal elements in LRM55 cells growing on (a) planar surface, (b) an interface between planar and pillar surface, and (c) on pillars..........................................................................................................16
Fig. 2-5: Hepatocytes adhering preferentially to deposited columnar/void silicon .....17
Fig. 2-6: Cells in constrained geometries (dots) undergo apoptosis much more frequently than those on large areas .....................................................................18
Figure 2-7: Fibroblast adhesion to RGD peptides bound to the surface with differing length alkanethiol chains .......................................................................19
Fig. 2-8: Schematic of operation of a Micromass orthogonal ESI source ...................23
Fig. 2-9: Schematic of MALDI process.......................................................................24
Fig. 3-1: Schematic of ECR PECVD deposition chamber ..........................................32
Fig. 3-2: Edge on SEM of 20 mtorr deposited columnar-void silicon material, the scale bar is 100nm. ...............................................................................................33
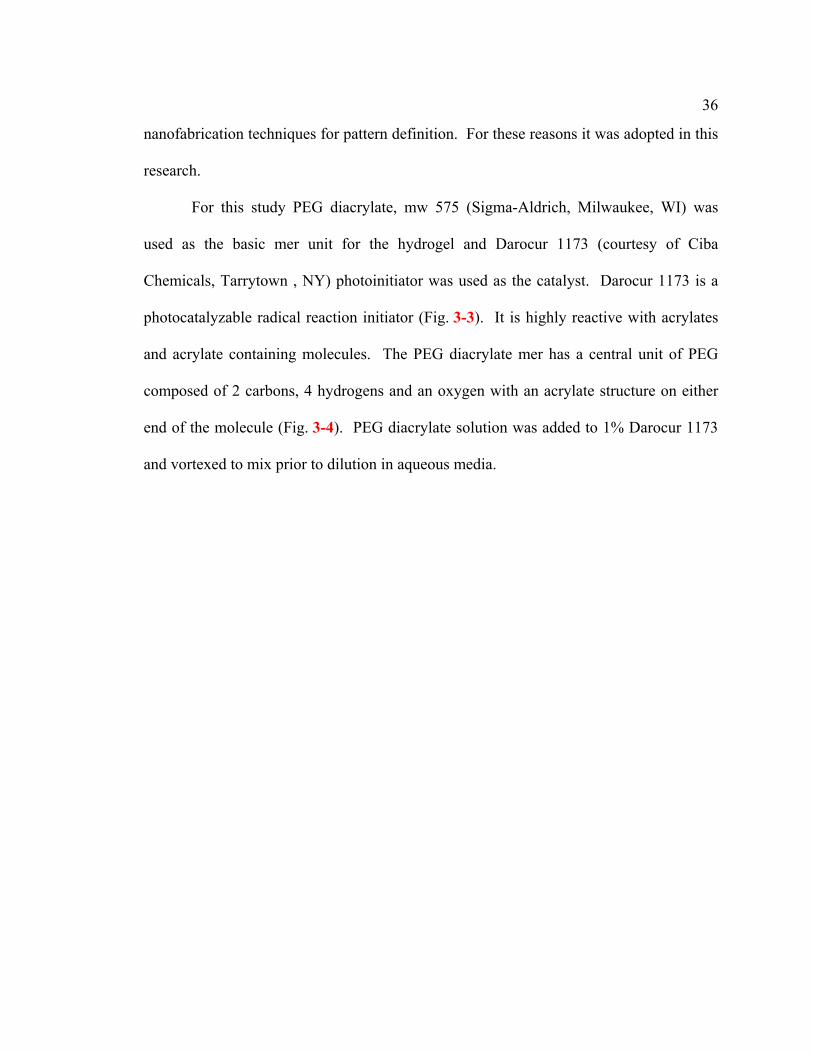
Fig. 3-3: Photo catalyzed radical formation.................................................................37
Fig. 3-4: Photocatalyzed diacrylate structure...............................................................38
Fig. 3-5: Diagram of thin film lift off process flow.....................................................41
Fig. 3-6: Schematic of flow cell device .......................................................................47
Fig. 3-7: Etch rate of annealed 10 mtorr columnar/void silicon in cellular media ......52
Fig. 3-8: Hepatocyte cells selectively adhered to 10 mtorr columnar/void silicon, the picture was taken after 1.5 hours of culture. The size of the porous silicon pad 1mm in diameter the area surrounding the circle is native corning 1737 glass. The scale bar id 100 microns. ....................................................................54

ix
Fig. 3-9: Hepatocyte cells selectively adhered to concentric circles of 10 mtorr columnar/void silicon, the picture was taken after 1.5 hours of culture. The scale bar is 200 microns........................................................................................55
Fig. 3-10: Percentage of cells adhered to columnar Si with respect to time in culture. The percentage of cells associated with columnar Si only: (A) time = 0, (C) time =1 hour, (E) time = 2 hours. The percentage of cells which are associated with both columnar Si and the underlying glass substrate: (B) time = 0, (D) time = 1 hour, (F) time = 2 hours............................................................56
Fig. 3-11: Low magnification FESEM image of columnar/void Si circle pattern area displaying preferential adhesion of hepatocytes to the circle Si regions. The scale bar is 100 microns. ...............................................................................57
Fig. 3-12: Hepatocyte on columnar/void Si grid pattern displaying rounded morphology. This cell is probably in the early stages of apoptosis. The scale bar is 2 microns.....................................................................................................58
Fig. 3-13: Hepatocyte cells adhered preferentially to columnar/void Si immediately after initial patterning. .....................................................................59
Fig. 3-14: A Hepatocyte initially adhered to the glass substrate displaying indications of migration toward the columnar/void Si surface.............................60
Fig. 3-15: SEM of Hepatocyte after two hours in culture, displaying migration toward other columnar Si features. .......................................................................61
Fig. 3-16: Hepatocyte adhered to glass, the cell has a very rounded morphology probably associated with apoptosis. The scale bar is 3 microns..........................62
3-17: Microsomes in 15% PEG hydrogel, after 3 hours in culture. The lipid layers appear intact and have not leached out significantly. ...........................................65
Fig. 4-1: Scheme for PDMS molding for microfluidics ..............................................70
Fig. 4-2: Graphic representation of electroosmotic and electrophoretic force, the channel in this picture is oxygenated PDMS having significant negative charge on the surface. ...........................................................................................74
Fig. 4-3: Microfluidic test-bed layout for drug metabolite sensing device..................78
Fig. 5-1: Micromass Q-TOF ion path and optics diagram...........................................89
Fig. 5-2: The chemical structure of dextromethorphan ...............................................90
Fig. 5-3: Chemical structure of verapamil ...................................................................91
x
Fig. 5-4: Sulphadimethoxine chemical structure .........................................................91
Fig. 5-5: Mass spectrum of sulphadimethoxine, the expected M+H mass is 311.3 ....94
Fig. 5-6: Mass spectra of dextromethorphan at time 0. Target mass peak can be scene at 272.2 m/z.................................................................................................95
Fig. 5-7: Mass spectra of dextromethorphan after 30 minutes of microsomal incubation, in addition to the parent peak at 272.2 m/z, a demethylated peak is clearly resolved at 258.2 m/z. ...........................................................................96
Fig. 5-8: Mass spectra of verapamil metabolism at T=30 minutes, parent compound can be seen at 455 m/z and demethylated compound at 441m/z. .......97
Fig. 5-9: Enlargement of the verapamil metabolite spectra T=30 min. The sodium and potassium adducts can be seen at 477.057 m/z and approximately 495 m/z respectively. The isotopic peaks of the compounds can also resolved at this scale................................................................................................................98
Fig. 5-10: Comparative spectra from deposited columnar/void film displays high noise signal in the low molecular weight region occluding drug molecule signal.....................................................................................................................100
Fig. 6-1: Schematic of the reaction region of the microfluidics device.......................107
Fig. 6-2: Schematic of the micro drug metabolite analysis device. .............................109
Fig. 6-3:The bright areas are agglomerations of the DiCl3 stained microsomes. The microsomes have been encapsulated in a 15% PEG diacrylate hydrogel. The scale bar is 100 µm........................................................................................114
Fig. 6-4: A comparison the response of 100 µm verapamil and 100 µm norverapamil control experiment in microfluidic system.....................................116
Fig. 6-5: Verapamil spectra from micro drug metabolite system utilizing PEG diacrylate hydrogel encapsulated microsomes. A very small metabolite peak may be seen in this spectra. ..................................................................................117
Fig. 6-6: LDI-MS results from the micro drug metabolite system using the non-encapsulated microsome protocol. A significant demethylated verapamil peak was detected. ...............................................................................................118
Fig. 6-7: Enlargement of the LDI-MS spectra from the non-encapsulated microsome assay, after recalibration and smoothing............................................119

xi
LIST OF TABLES
Tab. 3-1: Results of flow cell adhesion studies ...........................................................49

xii
ACKNOWLEDGEMENTS
I would like to give thanks to Matt Henry, Amy Brunner, and Rose Deter for the
assistance they provided in conducting the many experiments involved with cell adhesion
and microfluidic device design. I would like to thank Dr. Arthur D. Jones of the
Pennsylvania State University for his patient explanations of mass spectrometry
phenomena and interpreting the results of the mass spectrometry experiments. To Joseph
Cuiffi, I owe a great debt for all his help and support in every facet of this project. I
would like to extend thanks to the members of my committee for all of their efforts and
the insightful critiques of my experimental design and conclusions. Lastly, I would like
to offer a special thanks to Dr. Stephen J. Fonash for his wisdom, charity and patience in
his support of this work and his guidance in all aspects of my professional development.

Chapter 1
Introduction
The behaviors of mammalian cells are greatly influenced by their local
environmental conditions and stressors. Effective control over these micro and nanoscale
environments is critical for effective tissue engineering, artificial organ design or
fabrication of cell based sensing systems. A significant aspect of this environment is the
topology, cell and protein distributions encountered.
Cell and protein patterning is the ability to control the spatial distribution,
behavior and properties of living cells or proteins. Broadly speaking, cell patterning
techniques may be classified in two types of methodology. The first being topographical
patterning, which uses patterns, texturing or shapes in the substrate material to influence
cell adhesion and behavior. The second method is physiochemical patterning, which
makes uses of patterns of chemicals which influence adhesion or exert electrical or
physical force on a cell. The specific methods of creating these patterns are myriad and
the literature is rich with studies describing different techniques [1] [3] [4] [16] [
21].
The majority of these studies are seeking to replicate in vivo phenomena in vitro
or are seeking to understand the complex interactions that lead to growth, expansion and
differentiation of cell populations.
The first cell patterning studies were conducted in the 1960’s using topographical
patterning techniques, the success was limited but indicated the possibility of modifying

2
cell behavior through the controlling the local microscale environment [1]. Later studies
further explored topographical patterning and cell behavior and led to the development of
tissue culture treated plastics which present roughened, amine containing surfaces that
promote cell adhesion.
During the period from 1980-2003, several academic and industrial groups
developed cell based assays for common research and clinical diagnostic tests. These
assays make use of macroscale cell patterns defined by molded plastic features.
Significant efforts have been made to automate these tests making use of complicated
robotics, fluid handling devices and precise confocal optics for analysis [5]. This work
led to development of the first biological, micro total analysis systems (µTAS) during the
1990’s [57].
µTAS are microscale systems which perform complex biological and chemical
analysis automatically [57]. The µTAS’s are generally “chip” based devices which are
fabricated using standard micro and nanofabrication techniques. These systems have the
potential advantages of reduced cost, high throughput, reduced reagent volume and waste
and automated operation [55]. The first cell based micro total analysis systems (µTAS)
were developed in the late 1990’s using microfabrication techniques to create
microfluidic systems on a chip with integrated control and detection elements. These
systems perform the relatively simple tasks of cell differentiation and separation [6].
Recent research has focused on the development of more complex µTAS which detect
and quantify biological and chemical interaction.

3
1.1 Objective
The goal of this study is to develop a microscale, laser based, matrix free,
desorption and ionization mass spectrometry technique in an array format would have
immediate application for drug and drug metabolite studies. This whole thesis is directed
to this end. This study also has a broader goal of adding to the body of knowledge of cell
patterning and microfluidic systems on a chip research. It will explore novel cell
patterning techniques and biochemical sensing devices utilizing organic and inorganic
low temperature deposited thin films. These films are stable and compatible with
nanofabrication process and will be demonstrated to offer great promise microfabricated
cell based devices and for biocompatible coatings for implantable devices. Specifically,
this research will be focused on the fabrication of a microscale, cell based, device for
drug metabolism testing using these novel thin films. This device will function to
identify and quantify drugs and associated metabolite products. .
This goal will be accomplished by the following four steps:
(1) Establish an effective technique to pattern cells and proteins using thin
film deposition methods which are robust and compatible with modern micro and
nanofabrication techniques. These patterning materials must meet the
requirements of: thermal budget, vacuum tolerance, and chemical tolerance for
incorporation into the fabrication process flows for complex micro-total analysis
systems.

4
Existing methods for cell patterning suffer from either; lack of effective,
long-term ability to maintain a pattern such as topographical patterning or are
incompatible with the temperatures and chemistries required for micro and nano
fabrication of such physiochemical patterning.
(2) Develop a method for analysis of drugs and drug metabolites by mass-
spectrometry, which is based on deposited thin film materials. This method must
be compatible with the fabrication process flow for a microfluidics based total
analysis systems. The mass analysis system must provide a good signal to noise
ratio for low molecular weight molecules, high sensitivity and be robust enough to
survive the corrosive environment of physiological solutions.
(3) Design and test a microfluidic system which is compatible with all process
steps and conditions of use. The microfluidics system must support both
electrokinetic and hydrodynamic flows. Additionally, the microfluidic system
should have a high yield and low cost of materials and manufacturing.
(4) Integrate the cell component patterning system , mass analysis method and
microfluidic system into one prototype micro total analysis system. Develop
procedures for use to increase the yield of the drug metabolite.
1.1 Scope of Work
This thesis will focus on the development of cell or cell component based micro-
total analysis system which metabolizes drugs and analyzes and identifies the drug and

5
drug metabolite by mass spectrometry. Different methods of patterning cells and proteins
will be compared. These methods will specifically include, PECVD deposited patterned
thin films of columnar/void silicon and polycrystalline silicon, PVD deposited silicon,
PVD glancing angle deposited oxide, and hydrogels. All methods of thin film deposition
are low temperature (< 150oC) and are compatible low glass transition temperature
materials, such as glasses, plastics and metal foils.
A microfluidic fabrication protocol will be explored a device made using poly
dimethylsiloxane (PDMS). The PDMS device process flow utilizes a cast polymer
microfluidic structure made from a master microfabricated mold and bonded to a glass
under layer. Two bonding protocols: reversible and irreversible, will be explored. This
protocol was selected due to the potential for manufacturability, relating to the low cost
of materials and potential for high yield fabrication. Electrokinetic and hydrodynamic
flows will both be compared to evaluate the control of flow and the impact on the
efficacy of drug metabolism.
The drug and drug metabolite analysis will be carried out by direct laser
desorption mass spectrometry from deposited thin film materials. Two types of thin film
materials, porous and continuous, will be compared for optimizing the signal to noise
ratio, dynamic range and sensitivity of the system. Comparative laser desorption and
ionization (LDI) data will be presented.

6
1.2 Development of the Subject
Chapter 2 reviews the current theories and the state of recent research in cell, cell
component and protein patterning, mass spectrometry and drug metabolism techniques
and explains the motivation for this research. This chapter will also describe the
performance criteria for a microscale cell based biosensor for drug metabolism/ADME
studies.
Chapter 3 focuses on the various thin film cell and protein patterning techniques
compared in this study. The materials and methods used to explore cell and protein
adhesion will presented along with the results for these studies.
Chapter 4 deals with the development of the microfluidics fabrication process
flow, device design and protocols of use for a cell based biosensor. Specifically, it will
describe the fabrication process flows for a PDMS based microfluidic device. In addition
this chapter will cover the design and function of the high voltage power supplies for
control of the electrokinetic flow are described.
The exploration of deposited thin films for laser desorption ionization mass
spectrometry is detailed in chapter 5. Specifically, the use of these materials for drug and
drug metabolite studies are examined. Two types of films, columnar void and
continuous, and various surface treatments are compared to optimize signal to noise,
dynamic range and sensitivity.
Based on the results of the fabrication and optimization studies developed in
chapters 3,4,and 5, a final device design and fabrication process flow is presented in

7
chapter 6. The protocols for use and initial results are presented in this chapter along
with the results of limited optimization studies.
Chapter 7 will summarize the results obtained in the entire course of these studies,
and will state the conclusions that emerge from this research. Additionally,
recommendations for future research are discussed.

Chapter 2
Current Theories, Research and Methods for Cell and Cell Component Patterning and Mass Spectrometry
2.1 Background of Cell Patterning Techniques
Cell and protein patterning is the ability to control the spatial distribution,
behavior and properties of living cells or proteins. This section will cover in vivo
patterning, including chemical and physical stimuli, a brief history of cell patterning, and
current methodology for cell patterning.
Broadly speaking, cell patterning techniques may be classified in two types of
methodology. The first being topographical patterning, which uses patterns, texturing or
shapes in the substrate material to influence cell adhesion and behavior. The second
method is physiochemical patterning, which makes uses of patterns of chemicals which
influence adhesion or exert electrical or physical force on a cell [1]. The specific methods
of creating these patterns are myriad and the literature is rich with studies describing
different techniques. The majority of these studies are seeking to replicate in vivo
phenomena in vitro or are seeking to understand the complex interactions that lead to
growth, expansion and differentiation of cell populations.
The interaction of proteins and cells, particularly for cell adhesion and cell
motility, provide a close relationship between the ability to pattern proteins and
cells. Although, the complex response of cells to environmental stimuli makes
this relationship imperfect.
9
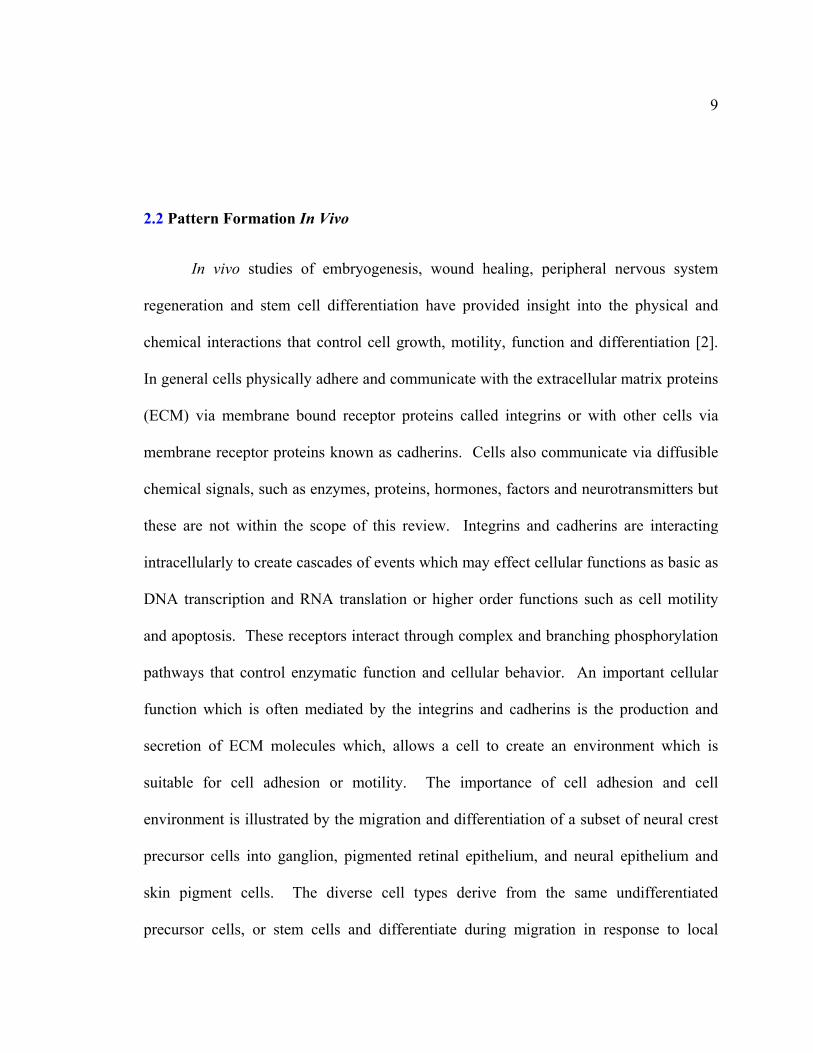
2.2 Pattern Formation In Vivo
In vivo studies of embryogenesis, wound healing, peripheral nervous system
regeneration and stem cell differentiation have provided insight into the physical and
chemical interactions that control cell growth, motility, function and differentiation [2].
In general cells physically adhere and communicate with the extracellular matrix proteins
(ECM) via membrane bound receptor proteins called integrins or with other cells via
membrane receptor proteins known as cadherins. Cells also communicate via diffusible
chemical signals, such as enzymes, proteins, hormones, factors and neurotransmitters but
these are not within the scope of this review. Integrins and cadherins are interacting
intracellularly to create cascades of events which may effect cellular functions as basic as
DNA transcription and RNA translation or higher order functions such as cell motility
and apoptosis. These receptors interact through complex and branching phosphorylation
pathways that control enzymatic function and cellular behavior. An important cellular
function which is often mediated by the integrins and cadherins is the production and
secretion of ECM molecules which, allows a cell to create an environment which is
suitable for cell adhesion or motility. The importance of cell adhesion and cell
environment is illustrated by the migration and differentiation of a subset of neural crest
precursor cells into ganglion, pigmented retinal epithelium, and neural epithelium and
skin pigment cells. The diverse cell types derive from the same undifferentiated
precursor cells, or stem cells and differentiate during migration in response to local
10
environmental signals such as ECM molecules, cell-cell interactions and substratum
shape.
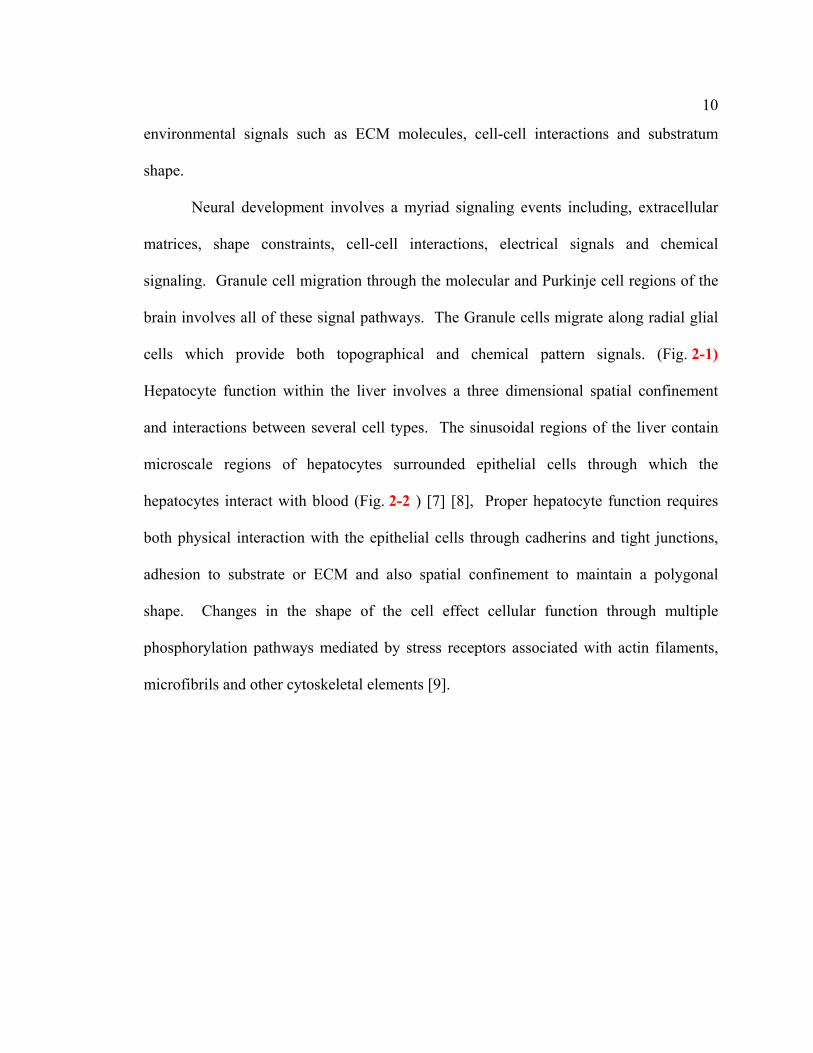
Neural development involves a myriad signaling events including, extracellular
matrices, shape constraints, cell-cell interactions, electrical signals and chemical
signaling. Granule cell migration through the molecular and Purkinje cell regions of the
brain involves all of these signal pathways. The Granule cells migrate along radial glial
cells which provide both topographical and chemical pattern signals. (Fig. 2-1)
Hepatocyte function within the liver involves a three dimensional spatial confinement
and interactions between several cell types. The sinusoidal regions of the liver contain
microscale regions of hepatocytes surrounded epithelial cells through which the
hepatocytes interact with blood (Fig. 2-2 ) [7] [8], Proper hepatocyte function requires
both physical interaction with the epithelial cells through cadherins and tight junctions,
adhesion to substrate or ECM and also spatial confinement to maintain a polygonal
shape. Changes in the shape of the cell effect cellular function through multiple
phosphorylation pathways mediated by stress receptors associated with actin filaments,
microfibrils and other cytoskeletal elements [9].

11
Replicating these interactions in vitro has proven difficult even in the most
simplistic cases of patterning. Replicating organ development and function in vitro has
Fig. 2-1: Granule cells migrating along radial glial cells
Fig. 2-2: Two dimensional view of liver sinusoids and cell distribution

12
been achieved for only limited periods with primary derived cells, such as in the case of
the porcine (pig) bioartificial liver (BAL). Macroscale BAL’s have been fabricated using
several techniques but the most common method is using a core filter packed with
primary porcine hepatocytes [10].
2.3 In Vitro Cell Patterning
he first efforts at artificial patterning used Langmuir-Blodgett (LB) deposited lipid
layers with grooves of varying thickness and depth [11]. This work indicated that cells
adhered more strongly to thinner lipid layers probably related to differential adhesion
properties, but also cells tended to migrate to grooved surfaces regardless of LB layer
thickness. Studies motivated by this LB work examined cell adhesion to grooved glass,
plastic, metal or glass fiber and indicated that the periodicity of the pattern, depth, width
and curvature of the surface all contribute to cell adhesion [1]. In general smaller
grooves provided greater alignment, an indicator of cellular organization, of the
cytoskeletal elements and stress fibers within the cells.
The use of lithographic patterning and wet and dry etching techniques to make
more controllable and reproducible grooved surfaces allowed researchers to determine
more precisely the relationship between topographical pattern and cellular behavior. In
1995 Wojak-Stothard et al. used a confocal microscope to examine the distribution of
actin, microfilaments and microtubules in cells on multiply microscale grooved

13
substrates. They hypothesized that microfilaments respond to changes in groove width
while microtubules respond primarily to changes in groove depth [12].
Physiochemical patterning has been conducted using metal patterns, ECM
molecules, proteins, peptides small molecules, functionalized self-assembling systems
and lipids. Early experiments with evaporated thin film palladium patterns on plastic
substrates demonstrated that both transformed fibroblasts and primary dorsal root
ganglion cells (peripheral nerve cells) displayed an increased adhesion on palladium
compared to the plastic substrate.[Error! Not a valid link.] Treating the cells with
compounds known to disrupt cytoskeletal elements, such as cytocalasian B, allowed them
to conform precisely with the shape of the palladium patterns. Experiments conducted by
Ivanova and co-workers to demonstrate lowered cell adhesion used patterned brain
phospholipids, which are highly inert, to make the substrate more adhesive than the
patterned material for fibroblast cells [13].
During the 1980’s the role of ECM molecules in cellular development and
function was elucidated much more clearly and experiments with lithographic patterning
of proteins and peptides were conducted. Several peptide sequences that are critical for
cellular adhesion were identified, such as the Arg-Gly-Asp (RGD) peptide which was
isolated by Rouslahti and Pierschbacher from laminin (an ECM molecule) by eliminating
large portions of the protein and testing for the ability to promote adhesion [14]. Using
RGD and peptides, experiments were conducted to create substrates which model veinal
cell endothelial remodeling of wound sites [1].
In the early 1980’s self assembled monolayer (SAM) layer patterns of
organothiols on Au were fabricated which controlled the surface energy of the substrate

14
by varying the chain length and terminal functional group. In 1989 Culp and
collaborators reported that the conformation and ability to adhere cells of adsorbed
fibronectin was modulated on surfaces which had been pretreated by organosilane
molecules [15].
Cell growth, differentiation and morphology as function of electrical stimulation
or modulation surface charge has been explored extensively in recent years. Many cell
types including neurons, neural crest cells and ganglion increase in density around DC
cathodes and also non-electrically active cells will polarize and align in DC fields or in
response to patterns of charged surface groups [1].
More recent work has focused defining the micro and nanoenvironments of cells
to promote in vivo function and behavior and also to better define the factors which
modulate cell functionality, growth and differentiation.
2.4 Recent Experimental Methods and Results
Recent topographical experiments almost universally make use of modern
nanofabrication methods for patterning. The most common techniques are
photolithography or electron beam lithography combined with an etching or
deposition process. Other techniques involve the bulk wet/dry etching or
electrochemical etching of materials to form porous or micro-nanostructured
materials or the deposition of micro-nanostructured materials such as deposited
sculptured thin films.

15
Craighead and co-workers have applied reactive ion etching (RIE) to
create randomized nanotexture (~60nm features) over large areas of a silicon substrate.
By masking some regions with photoresist they were able create areas of varying
roughness with similar surface chemistry. Surprisingly, the neuronally derived LRM55
cells displayed a predisposition to adhere to the relatively smooth areas which had not
been exposed to the RIE while primary derived astrocytes, which are the supporting cells
for neurons in the brain, adhered more strongly to the regions of nanotexturing Fig. 2-3
[16]. Craighead also explored more defined surface features using arrays of pillars, 1µm
in height etched from a single crystal wafer. The pillars varied in width from 500nm to
2µm and the spacing varied from 500nm to 5µm. The astrocytes cells used in this
experiment preferentially adhered to the areas with pillars as opposed to the flat wet
etched wafer region, but did not respond in a significant way to the variances in pillar
width or spacing. Analysis of the cytoskeletal elements and stress fibers by fluorescent
immunocytochemistry indicated differences in the internal structure of cells localized to
pillar arrays and smooth silicon Fig. 2-4 [17]. The actin fibers, in red, and the
microtubules, in yellow, resemble the in vivo conformation much more closely on the
pillars than on the flat silicon, indicating that surfaces with significant morphology
provide a potentially more natural cell environment.

16
Other nanostructured materials, such as porous silicon, have been explored for
their ability to promote cell adhesion and function. In Fig. 2-5 a deposited nanostructured
Fig. 2-3: LRM55 cells growing on micron scale pillars
Fig. 2-4: Fluorescent images of the cytoskeletal elements in LRM55 cells growing on (a) planar surface, (b) an interface between planar and pillar surface, and (c) on pillars

17
silicon surface is used to selectively promote hepatocyte adhesion on a corning 1737
glass substrate [18]. This work is basis of my proposed study for directing cell adhesion
on an inorganic/organic nanostructured surface.
Current methods for physiochemical patterning can be broadly classified in two
categories those that use SAM layers and those that use peptide or protein patterns. The
use of SAM layers of oganosilanes or alkanthiolates has become a standard method of
pattern formation for controlling cell and protein adhesion and function. Recently Chen
et al. used microcontact printing to define microscale patterns of ECM molecules to test
the effects of constrained geometries on cell cycle control. Alkanethiol dots and squares
of varying sizes and periodicity were printed from a PDMS stamp on a Au coated glass
substrates to create regions which promoted the adhesion of fibronectin. Capillary
endothelial cells grown on these patterns were analyzed to determine if they were in a
growth cycle or apoptotic (cellular death). Cells in very constrained or rounded
morphologies had much higher rates of apoptosis than those in larger areas Fig. 2-6 [19].
Fig. 2-5: Hepatocytes adhering preferentially to deposited columnar/void silicon

18
This suggests that there exists critical dimensions for cell cultures and aggregates below
which cells and cell culture behavior is very poor.
Recent experiments by Houseman and Mrksich examined how the
microenvironment of immobilized peptide sequence RGD influenced the peptide’s ability
to promote cell adhesion. Ethylene glycol terminated alkanethiols of varying lengths
were functionalized with the RGD peptide and self assembled as a monolayer on Au
coated glass. 3T3 fibroblasts were cultured on these substrates and examined for cell
adhesion. The results indicate that fibroblasts preferentially adhere to RGD peptides
associated with shorter alkanethiol chains. The authors hypothesize that integrin-ligand
binding is disrupted as the alkane chains increase in length Figure 2-7 [8].
Fig. 2-6: Cells in constrained geometries (dots) undergo apoptosis much more frequentlythan those on large areas

19
Bhatia et al. have conducted co-culture patterning experiments to investigate the
role of cell-cell interactions and microscale geometry on cell function. Co-cultures of rat
hepatocytes and fibroblasts were used to model an in vivo liver environment. on
micropatterned collagen fabricated using photolithographically defined aminosilanes.
Homotypic (cells of the same type) and heterotypic (cells of different types) cell-cell
interactions were examined by controlling the co-culture interface area while increasing
the populations of either hepatocyte or fibroblast cells. The results suggest that
Figure 2-7: Fibroblast adhesion to RGD peptides bound to the surface with differinglength alkanethiol chains

20
increasing the number of fibroblasts upregulates the hepatocyte function without
increased heterotypic cell-cell interactions [20].
A study conducted by Brock et al. examined effects of micro and nanoscale
patterns on cell motility using microcontact printing of alkanethiols on gold to form cell
permissive and non-permissive regions. Several patterns of dots, squares, triangles and
polygons of hydrophobic hexadecanethiol were transferred to the gold and formed semi-
crystalline hydrophobic islands. The pattern was backfilled with a hydrophilic poly-
ethylene glycol (PEG) terminated alkanethiol to form distinct regions of differing
wettability. The patterned substrate was exposed to a solution of the ECM protein,
fibronectin (FN). FN has a large hydrophobic core region that preferentially adheres to
hydrophobic materials to reach a stable low energy conformation that excludes water.
The patterned FN was then used to adhere fibroblast and examine the distribution of
cytoskeletal elements and the production of ECM proteins. Actin filaments and ECM
production focused at the corner areas of patterns and cell spreading and movement
started at these locations [
21].
Another technique for patterning cells that has been exploited is capturing cells in
photoactive hydrogel materials which polymerize when irradiated. These materials can
be three dimensionally spatially defined on the micro scale using photolithography to
form free standing gels which contain cells [22]. This technique offers the opportunity to
create a layered or three dimensional network that is more in vivo like than a two
dimensionally defined material and it can be used to control the directionally of cells that
have differentiated basal and apical (top and bottom) membranes, such as intestinal

21
epithelial cells. While many of these techniques are very powerful for patterning cells
and controlling the local cellular environment, these techniques are not easily integrated
into MEMS device process flows, which rely heavily on vacuum based processing and
high thermal loads.
2.5 Modern Mass Spectrometry Techniques and Small Molecule Analysis
Mass spectrometry is a common and powerful analytical technique used in the
determination of the mass to charge ratio (m/z) of atoms and molecules [23]. Mass
spectrometry is particularly useful in the identification and structural analysis of small
molecules, peptides, proteins and nucleic acids. Many types of mass spectrometers exist
with differing sample injection and mass analysis systems. Common systems for sample
injection and ionization include; electrospray ionization (ESI), chemical ionization (CI),
electron impact ionization (EI), inductively coupled plasma ionization and matrix assisted
laser desorption and ionization (MALDI). The methods used in determining the m/z of
the atoms or molecules is also varied, time of flight (TOF), quadrapoles, ion traps are the
most common systems [23]. Each method of sample introduction and ionization has
distinct capabilities. The two most common methods ESI and MALDI will be discussed
in some detail.
In ESI a sample is injected by pumping the compound containing solution
(solvent) through a fine needle and spraying small droplets across a small gap into the
mass spectrometer Fig. 2-8 . A bias of several thousand volts is applied between needle

22
and the sample inlet to the mass spectrometry system. This places a small number of
charges, which are most often positive, on each droplet which stay on the analyte
compounds as the solvent evaporates commonly leaving a charged molecule. This is the
technique most commonly used in small molecule (< 600 amu) detection and
identification.
ESI has two major drawbacks, the first being it often produces multiply charged
molecules which are unstable and fragment. This complicates the determination of the
compounds proper mass by producing molecules with many charges. This can result in
complex spectra with the same mass molecule having many different peaks. The second
is time consumption; this process requires samples to be pumped by syringe or high
performance liquid chromatography (HPLC) through capillaries and often through
chromatography columns, to separate complex analytes, and then into the needle. This
process often takes one and a half to six minutes per samples depending on the method
which used.

23
Tanaka, a 2002 nobel prize winner in chemistry,and his group at Shimadzu
Corporation developed the MALDI method in the mid 1970’s as a more effective
alternative to direct thermal desorption [Error! Not a valid link.]. MALDI is a photon-
based system for desorbing and ionizing a molecule. The photon flux impinges on a light
adsorbing matrix, which is typically composed of an acidic organic resin, that contains
the compound to be analyzed. The adsorption of the light causes intense heating and
desorption of the matrix-analyte mixture. Ionization occurs by a combination of
photoionization and chemical ionization in the expanding plume (Fig. 2-9). A nitrogen
laser, producing a 337nm wavelength light is the typical photon source for this process.
The desorbed molecules are injected into the mass spectrometer directly from the plate.
The MALDI method typically produces singly charge molecules, which simplifies the
Fig. 2-8: Schematic of operation of a Micromass orthogonal ESI source

24
interpretation of the spectra compared to ESI. This process is extremely rapid requiring
only seconds per sample but is limited to higher molecular weight molecules, above 500-
600 amu, as the matrix itself interferes with the detection of small compounds by
saturating the detector and adducting to the analytes.
Direct laser desorption-ionization (matrix-free) has been explored for decades
using many material systems, including carbon, metals and ceramics. All of these
materials provided very poor ion yields, low signal to noise ratios or severe fragmentation
of the molecular ions created during desorption. A matrix free laser desorption process
was described in 1999 by Siudak et al. using electrochemically etched porous Si as the
Fig. 2-9: Schematic of MALDI process.

25
light adsorbing substrate material [24]. This nanostructured material was discovered by
researchers at bell labs in 1956, it is made by electrochemical etching of crystalline
silicon in an aqueous solution of ethanol and hydrofluoric acid in a hole mediated
process. The feature size and morphology is controlled by current and light exposure and
varies widely from columnar to coral-like. Siuzdak et al. have reported an optimized
etching protocol that involves an electrochemical etch step, an oxidation step in hydrogen
peroxide solution and a further electrochemical etch. Etched porous silicon provided a
much higher ion current with lower amounts of molecular ion fragmentation than other
materials that had been previously been tested. The maximum m/z charge ratio that may
be explored using porous Si is 8,000-10,000 with the practical limit of 3,000 m/z. At
m/z’s higher than 3,000 the signal intensity and resolution is reduced resulting in very
small, broad peaks. Siuzdak et al. reported that control of the morphology and degree of
porosity and the associated quantum effects were critical for obtaining the optimum
performance of porous Si for mass spectrometry. They indicated that over or under
etching resulted in severe reductions in the ion yield and effective mass range.
The use of porous silicon suffers from two practical disadvantages; first, there is a
significant noise signal in the m/z range of 100-800, caused by adsorbed atmospheric
contaminants and residues from the etchants and solvents associated with the
electrochemical etching process. At analyte concentrations in the micromolar and
nanomolar regime these contaminants obscure analyte peaks resulting in a significant
decrease in the signal to noise ratio and greatly limiting the usefulness of this material
for the analysis of low mass analytes such as drugs, drug metabolites, fine chemicals or
peptides. Second, porous Si is very unstable chemically the material continues oxidize

26
after the termination of the electrochemical etching process. This is probably caused by
the continuing action of reactant residues trapped within the pore structure. This
oxidation results in functional failure of the device as a mass spectrometry substrate
within days. This process can be retarded by storage in ethanol or other alcohol
solutions, extending the functional lifetime of etched porous Si to weeks.
2.6 Device design and performance requirements for a cell based microscale drug metabolite analysis system
The device designed in the course of this study must have following performance
criteria. It must be microscale in size, and must provide a conducive environment for
biologically based, cell or cell component drug metabolism assays. The device requires
both hydrodynamic and electrokinetic, microfluidic flow control. The system must allow
the operation of the device to be observed optically. The materials used must be
compatible with the physiological solutions used in biological assays. All of the
materials and methods used in the fabrication protocols must be compatible with standard
micro and nanofabrication techniques.
In addition, to make a societal and financial impact, this micro, drug metabolite
system must meet these criteria: they must be inexpensive, rugged and be fabricated
using high yield processing [40].

Chapter 3
Deposited Thin Films for Cell, Cell Component and Protein Patterning
While the scientific and practical importance of cell patterning and cell motility
control has been widely recognized, only recently has concentrated effort been directed
toward the definition of high resolution patterns which promote cell adhesion [25]. The
factors which play critical roles in promoting cell adhesion have been determined as
specific surface chemistry, surface topography, surface charge and specific
protein/protein interaction [25] [26] [27] [28]. Controlling the interaction of a cell with
its microenvironment is critical for regulating the cells proper function [7] [29]. Cell
have very complex responses to stressors which are mediated by a number of
extracellular and intracellular chemical, mechanical and voltage sensitive receptors [32].
These receptors can initiate complex cascades of intracellular events which modify
genetic regulation, RNA production and ultimately protein and enzyme production and
function.
Not only is the patterning of cells of great interest but also the patterning of
individual cellular components is of equal interest. Such components include the
endoplasmic reticulum, the golgi and mitochondria since these may be isolated and
potentially patterned. These organelles can be very useful because they maintain some
aspects of cellular function, such as drug metabolism, protein modification or ATP
production but do not present the complex responses of stressed whole cells. However,
these cell components can not manufacture new proteins, peptides or enzymes, which

28
greatly reduces the functional lifetime [32]. In addition, these intracellular organelles do
not present the adhesion or surface recognition molecules that are commonly expressed in
whole cells, which results in challenging patterning requirements.
Both the nonspecific interactions, such as surface charge and topography, and the
specific interactions, such as surface chemistry and protein/protein interaction facilitate
the formation of cellular patterns. The degree to which these interactions promote
cellular adhesion and maintain the integrity of the established patterns varies and is
dependant on the complex interaction of local chemistry, geometry and biological
response. Failure commonly results in cellular overgrowth or in the initiation of an
apoptotic reaction in the cells1. Pattern failures are commonly caused by the degradation
of the chemical pattern or fouling of the pattern with extracellular matrix molecules
(ECM) or other proteins and peptides.
Chemical and protein patterns can be readily fabricated using a number of
common techniques; such as the following: photolithography, lift-off, microcontact
printing or micro molding in capillaries (MIMIC) [8] [9][11]. While these techniques of
defining regions of permissible surface chemistries or cell attractive protein regions
provide a very effective means of cell and protein patterning, the chemistries are
generally incompatible with the thermal budgets or chemistry requirements of typical
micro and nanofabrication techniques used in the processing of micro-electro-mechanical
systems (MEMS) and bio-chip technology devices.
1 Apoptosis is the process of programmed cell death, in which a cell is triggered by an external stimulus to to begin an intracellular reaction leading to the compromise of the cell membrane integrity, effectively committing suicide.

29
In contrast topographical patterns and patterned surface charge features are
generally more robust and require more complex fabrication processes than
chemical/protein patterning. However, up to now, they have generally been considered
to be much less effective for forming and maintaining cell and protein patterns [25].
This chapter describes experiments conducted to evaluate the efficacy of
deposited thin film materials as substrates for generating and maintaining
topographically/chemically induced patterns of cells, cellular components and proteins.
With an objective of developing an effective system for cell or cell component pattering
for eventual use in a biologically based, microscale drug metabolism and analysis device.
Seven deposited thin films, columnar/void silicon, nanocrystalline continuous silicon,
evaporated silicon, evaporated silicon oxide, glancing angle deposition (GLAD)
deposited silicon, GLAD deposited silicon oxide and polyethylene glycol (PEG)
hydrogels, are compared in this portion of the research for their ability to promote and
maintain cell and cellular component patterns and viability.
Section 3.1 describes the methods, techniques and experimental procedures used
in this study, including thin film deposition techniques, cell culture technique and
methods for evaluating cell adhesion, pattern formation and thin film integrity. Section
3.2 presents the results and related discussion from these studies. The conclusions are
covered in section 3.3 and a procedure is outlined for a specific, optimized method for
cell component patterning which meets the device design requirements described in
section 2.6.

30
3.1 Materials and experimental procedures
This section describes the materials and biological methods used in this research
for the deposition of thin films, for cell culture and for the determining cell adhesion,
evaluating cell motility and establishing thin film integrity.
3.1.1 Thin film deposition techniques and pattern formation
Sections 3.1.1.1-3.1.1.3 will describe the deposition techniques used and films
produced for the cell patterning studies. Section 3.1.1.1 treats electron cyclotron
resonance plasma enhanced chemical vapor deposition (ECR-PECVD) deposited films,
3.1.1.2, discusses evaporated films and GLAD deposited films, section and 3.1.1.3
describes the formation of photocatalyzed hydrogels. Section 3.1.1.4 and 3.1.1.5 deal
with post deposition annealing and the formation of silicides.
3.1.1.1 Electron cyclotron resonance plasma enhanced chemical vapor deposition
The initial feasibility studies for cell patterning were conducted with electron-
cyclotron-resonance plasma enhanced chemical vapor deposition (ECR-PECVD)
deposited columnar/void silicon [33]. This deposition system is a high vacuum, high
density, microwave plasma system. The system consists of two chambers, load lock and
deposition chamber, a mechanical roughing pump, a turbo molecular pump, a gas
manifold to control up-to eight process gasses, two electromagnets, a heated chuck and
both an RF and microwave power supply system. A diagram of the chamber can be seen

31
in Fig. 3-1 the quartz window is the inlet for the microwaves which are carried by an
external wave guide from the Aztex microwave source. The background pressure for this
system is typically in the low 10-7 torr range with process pressures in the mtorr regime.
The ECR-PECVD can provide a range of material morphologies from continuous,
defined as having no surface features with greater depth than width, to porous. In
addition the ECR PECVD can deposit both amorphous and polycrystalline thin films.
For this study the ECR-PECVD was used to produce two morphologies of
polycrystalline silicon thin film: columnar-void and continuous. Columnar/void silicon
material is a thin film of polycrystalline or amorphous rod-like protrusions that penetrate
a continuous void (Fig. 3-2). The base is a silicon layer, thought to be amorphous, which
is approximately 100-200A in thickness. The columns are approximately 10nm in
diameter and approximately 1-2 nm apart. The columns do not branch or expand
significantly with increasing thickness of the film. The columns are in aggregations of
approximately 100 nm in diameter separated by 10nm spaces. The diameter, pitch and
composition of the columns can be controlled by modifying the deposition parameters of
pressure, power, plasma gas composition and magnetic field [33]. Commonly the
processing pressure (pressure of gas in the chamber during deposition) and forward
power are the parameters modified to control the film porosity and well defined
parameters and films have been established for the processing pressures of 6, 8, 10 and
20 mtorr (Fig. 3-2). As the process pressure increases the inter-columnar spacing
increases with little change in the column diameter, creating a more porous film.

32
Typically the film is made from the precursor gases of H2 and SiH4
producing a polycrystalline material that is passivated on the surface and probably
at the grain boundaries with hydrogen. The gas flow rates used in this study were
SiH4: 2 sccm and H2: 20sccm. Changing the ratios of H2 and SiH4 or doping the
process gas with other gases can change the physical and chemical properties of
the film. The deposition rates at 6, 8, 10 and 20 mtorr are approximately 70, 80,
100, and 120 A/min respectively. The target thickness was approximately 100nm
for cell adhesion studies and 150nm for thin film stability studies.
Fig. 3-1: Schematic of ECR PECVD deposition chamber

33
The film can be deposited at low temperature on any substrate that is
thermally stable to at least 150oC. Higher temperature depositions will results
high atomic surface mobility leading to a disruption of the columnar morphology.
The morphology of the film is largely independent of the substrate and was the
same on silicon, glasses, silicon oxide, silicon nitride, metals, or polymers. For
these studies the substrate material for all thin film depositions was Corning 1737
alumino-silicate low sodium glass. The RMS roughness of the 1737 glass was
1.5nm as determined by tapping mode atomic force microscopy (AFM). The
chuck temperature was set at 100oC, but the surface temperature at the substrate
was closer to 150oC during deposition.
Fig. 3-2: Edge on SEM of 20 mtorr deposited columnar-void silicon material, the scale bar is 100nm.

34
In this study the continuous nano-polycrystaline silicon material was deposited at
low pressure of 4 mtorr with 600 W of forward power from the microwave source. The
process gases were SiH4 and H2 at flow rates of 2 sccm and 20 sccm respectively.
3.1.1.2 Evaporation and GLAD
Evaporated thin films of polycrystalline silicon and amorphous silicon oxide
(SiOx) were also explored for patterning. They were deposited in a Kurt Lesker
cryopumped, evaporation system. The source is a 270o electron-beam with a vitreous
carbon crucible for holding the precursor material. Typical base pressures for this system
are low 10-6 torr with process pressures in the mid The precursor silicon material is
99.999% cubes with a size dispersion of 1-2mm, the precursor silicon dioxide material is
99.999% flakes or chips (Alfa Aesar, Ward Hill, MA). The deposition rate was
approximately 1 A/sec for all depositions. The rate and thickness were monitored using a
quartz crystal microbalance thickness monitor (Inficon).
The evaporated silicon films were polycrystalline and possessed significant
nanoscale roughness probably related to the ballistic nature of deposition on the unheated
evaporator stage. The SiOx films sublime under low run currents and no evidence of
melting the flakes in the crucible was observed. The SiOx films had an index of
refraction of 1.38 compared to 1.46 for thermally grown oxide, as determined by
ellipsometery, indicating the stoichiometry may be close to that of SiO2.

35
GLAD, where the substrate is nearly normal to plane of the evaporation source,
creates highly structured films by increasing shadowing of the deposited material. This
technique can be used to deposit complex three dimensional structures by rotating the
substrate and changing angles during the deposition [30]. The GLAD deposited films
were deposited at angle of 85o with respect to the plane of the crucible, with the stage
held stationary. This created a highly structured surface with features approximately
100nm in diameter. The thickness of the film decreased in relation with distance from the
source. The stylus size of the Tencor profilometer prevented accurate measurement of
the depth of the nanoscale features.
3.1.1.3 Formation of PEG hydrogel thin films
Polyethylene glycol is a relatively biologically inert material known to resist
protein adhesion and support cell culture [22]. This material may form the basis of a
water containing hydrogel by polymerization [22]. The catalysts for these polymerization
reactions may be thermal, chemical or photo activated. Thermal and chemical catalysis
are not optimum for biological system as heat and chemical radicals damage proteins and
enzymes. Photocatalysis is less damaging but the photoresponsive catalysts require
photons with energies ~3.5 eV, in the deep blue and ultraviolet range, which can cause
damage to proteins and nucleic acids. Photocatalyzed hydrogel polymerization also
provides the advantage of being compatible with other photolithographic micro and
36
nanofabrication techniques for pattern definition. For these reasons it was adopted in this
research.
For this study PEG diacrylate, mw 575 (Sigma-Aldrich, Milwaukee, WI) was
used as the basic mer unit for the hydrogel and Darocur 1173 (courtesy of Ciba
Chemicals, Tarrytown , NY) photoinitiator was used as the catalyst. Darocur 1173 is a
photocatalyzable radical reaction initiator (Fig. 3-3). It is highly reactive with acrylates
and acrylate containing molecules. The PEG diacrylate mer has a central unit of PEG
composed of 2 carbons, 4 hydrogens and an oxygen with an acrylate structure on either
end of the molecule (Fig. 3-4). PEG diacrylate solution was added to 1% Darocur 1173
and vortexed to mix prior to dilution in aqueous media.

37
Typically, in this work hydrogels of 10-15% PEG were fabricated in
physiological buffers using a high density light source (EFXO, Québec), with a 5mm spot
size using a band pass filter optimized to pass 320-400nm wavelength light. Exposures
varied depending on the percent hydrogel and composition of the aqueous media, but
typically ranged from 2-5 seconds.
Fig. 3-3: Photo catalyzed radical formation

38
3.1.1.4 Thin film annealing
The columnar/void Si films were annealed in a quartz tube, in a resistively heated
furnace at 250oC and 400oC for times of 1, 4, 8, 12 and 24 hours in a N2 ambient to
stabilize the material. The samples were loaded and removed at 1000C to prevent rapid
sample oxidation. The temperature ramp rate was 10oC/min both heating and cooling.
Short anneals at low temperature provided much more stable films which still retained
Fig. 3-4: Photocatalyzed diacrylate structure
39
the ability to promote cell adhesion while longer anneals or high temperature anneals
(>700oC) formed stable films which did not promote cell adhesion. This effect is
probably caused by the formation of a significant oxide layer, which creates a more
hydrophilic material, during the annealing process. The source of oxygen may be water
trapped in the column/void material or atmospheric oxygen which leaks into the furnace
during the loading and unloading process.
3.1.1.5 Silicide formation
Palladium forms a silicide at the lowest temperature of all the noble metals,
approximately 4000C [31]. In this work, 400 A Pd thin films were deposited by
evaporation in the Kurt Lesker evaporator, described above in section 3.1.1.2. Pd was
deposited either before or after columnar/void silicon deposition to form a “bottom-up”
or “top-down”. The samples were annealed at 400oC for 1 hour in a N2 ambient using the
annealing furnace described in 3.1.1.4. Pd silicide has several phases, a silicide formed at
4000C is expected to have a stoichiometry of Pd2Si [31], this was not confirmed by x-ray
photoelectron spectroscopy (XPS).

40
3.1.1.6 Photolithography and liftoff
Photolithography and liftoff methods were used to pattern the thin film materials
for both macro and microscale patterning experiments. To accomplish this, Shipley 1827
positive resist was spun on at 4000rpm for 30 seconds. This resulted in a photoresist
layer of approximately 2.5 microns in thickness. The samples were soft baked for 1
minute at 110oC prior to alignment and exposure. Alignment was performed using a Karl
Suss MA6 contact aligner, exposure times varied from 5-7 seconds depending on the age
of the UV source and photoresist. Samples were developed in MF 312 developer for
approximately 1 minute. No post exposure bakes were performed to assist in the lift off
process.

41
The thin films were deposited over the photo resist patterns and lifted off using
the following protocol: substrates were soaked in acetone for 2 minutes, then sonicated
in acetone for 3 minutes at room temperature, then sonicated for 2 minutes in isopropyl
alcohol followed by a 30 second rinse in flowing DI water. This process is shown
schematically in Fig. 3-5.
Fig. 3-5: Diagram of thin film lift off process flow

42
3.1.2 Methods of characterizing deposited thin films and analysis of experiments
All the thin films used in this study were characterized by one or more of the
following techniques: solution contact angle, optical microscopy, field emission scanning
electron microscopy or , XPS.
3.1.2.1 Solution contact angle determination
Solution contact angle is a simple method to indirectly determine relative surface
hydrophobicity, surface chemistry, and to a more limited degree the porosity of the
surface [
35]. The DI water was used as the solution in this research. The contact angle
was determined using a fixed stage goniometer with optical interrogation with integrated
protractor. Contact angle readings were taken after deposition and all deposition
annealing and chemistry processing steps.
3.1.2.2 Microscopy
Leica metallo-plan or microlab optical microscopes were used to evaluate thin
film integrity, pattern integrity and results of cell patterning experiments. The
Metalloplan microscopes have epi-transmission white light sources and phase contrast
optics. The microlab microscope has a transmission white light source and epi-

43
fluorescent source with 50W Hg lamp and high pass filter set for wave lengths above
500nm.
Scanning electron microscopy of thin films and cells was performed using a
Leica, LEO field emission scanning electron microscope (FESEM) 1530 with in lens and
secondary emitted electron detectors. The resolution of the LEO 1530 is approximately
10-20A under optimum conditions.
3.1.2.3 X-ray photoelectron spectroscopy (XPS)
A Kratos, Axima II XPS system was used to characterize surface chemistry of
selected samples. In XPS photons, with energies in the 200-2000eV range are absorbed
by an atom in a molecule or solid, leading to photo-ionization and the emission of a core
(inner shell) electron. By determining the energy of this emitted electron at a given
excitation energy the binding energy of the electron can be established thereby leading to
information on bond strength and chemicals involved. Consequently, XPS provides
semi-quantitative data on atomic composition and some information on the bonding state
of the structure.

44
3.1.3 Cell culture methods
3.1.3.1 Cell Culture
The cell lines used in the course of these studies were FL83B rat fetal hepatocytes
and PC-12 rat pheochromocytoma (ATCC, Manassas, Va). Long term cell cultures were
maintained at 37oC, in a 5% CO2 atmosphere in 75 cm2 polystyrene, vented cell culture
flasks until confluent (uniform monolayer on the culture flask) and then passaged, by
splitting into smaller aliquots. The media composition for the hepatocytes and PC-12
was Ham's F12K medium with 2 mM L-glutamine adjusted to contain 1.5 g/L sodium
bicarbonate, 90%; fetal bovine serum, 10% horse serum.
The cell culture protocol for the patterning experiments was identical for both
hepatocytes and PC-12 cells. Confluent cells were washed with phosphate buffered
saline (PBS) pH 7.4, trypsinized (released from the culture flask, by cutting proteins) in
10X trypsin solution in Tris-Buffered saline for 3 min at 37OC with occasional agitation
until all cells were suspended. After trypsinization cells were counted in a double sided
Levy type counting chamber and diluted in the appropriate culture media to a final
concentration of 1.4x10⁵ cells per milliliter. 5 milliliters of cell suspension were
transferred to each dish containing a 1-inch square pattern of deposited thin film material.
The samples were cultured for 20 minutes at 37OC in a 5% CO2 ambient and then washed
gently in PBS to remove non-adherent cells. The washed samples were placed back into
culture for 0 hour, 1 hour and 2 hour time points.
For flow chamber experiments the cell culture protocol was the same as above
with the exception that the substrate size was three inches by one and a half inches.
45
3.1.3.2 Cell organelles
Human liver microsomes were purchased from Cellz Direct (Ca) for PEG
hydrogel studies leaching and membrane integrity studies. Microsomes rapidly lose
function (< 30 minutes at room temperature) so they were not included for the studies of
long term viability.
3.1.3.3 Cell and cell organelle fixation and staining
The patterned cell samples (i.e. cells on patterned regions) were removed from
culture, fixed in 2.5% gluteraldehyde/formaldehyde in PBS for 15 minutes for the
fixation of proteins and peptides, followed by 2.5% Osmium tetraoxide fixation for 15
minutes for the fixation of lipid membrane layers. After fixation the samples were
dehydrated by serial exposure to ethanol/deionzed water solutions at 25%, 50%, 75% and
100% ethanol for 18 minutes each.
The fixed and dehydrated samples were sputter coated with 10nm of gold prior to
optical and FESEM imaging. Optical, epi-visable light microscope images were
analyzed to determine the number of cells associated with the columnar/void Si with
respect to time in culture after initial patterning. Cells were counted as on, off or
partially touching the Si.

46
Hepatocytes and microsomes were stained with DiCl3, a membrane stain specific
for the endoplasmic reticulum derived lipids [36]. A 25mg/ml DiCl3 solution was diluted
1:10 by volume in media or microsomal solution and incubated for 1 hr at 37oC, 5% CO2
ambient.
3.1.3.4 Thin film stability study
Experiments were conducted to determine the stability of the columnar/void
silicon, cell patterning films in DI water, simulated body fluid (SBF) and hepatocyte
media. Simulated body fluid is composed of salts at physiologically relevant
concentrations and pH. Each liter of SBF was prepared by dissolving 7.995g of NaCl,
0.353g of NaHCO3, 0.224g of KCl, 0.228g of K2HPO4.3H2O, 0.305g of MgCl2.6H2O,
0.227g of CaCl2, and 0.0710g of Na2SO4 into distilled water. The pH value of 7.4 was
maintained by adjusting amounts of Tris (tris-hydroxymethylaminomethane) and HCl.
The film thickness was determined by profilometer at time points of 1, 2, 4, 8, 24, 48
hours of SBF exposure.
3.1.3.5 Flow cell apparatus and protocol
The flow cell apparatus consisted of three inch by one a half inch acrylic flow cell
with inlet and outlet ports for aqueous media, a Harvard apparatus syringe pump and
microscope for imaging. The cells were cultured using the procedure described in section
3.1.3.1. A 100 µm rubber gasket served to control the spacing between the thin film

47
materials and the flow cell (Fig. 3-6). Cell media was pumped through the device at
flows ranging from 0-10ml/min and was incremented in 0.5ml steps with residence times
of one minute.
Fig. 3-6: Schematic of flow cell device

48
3.2 Results and discussion
3.2.1 DI water contact angle determination
The measured contact angle of de-ionized water (DI) on columnar/void and ECR-
PECVD continuous nanocrystalline silicon were similar. The DI contact angles at room
temperature ranged from 90o-105o on freshly deposited films. They were found not to
change significantly over a period of weeks. Corning 1737 glass had a DI contact angle
of 60o-75o and evaporated silicon had a contact angle of 10o-40o. After annealing contact
angles decreased by approximately 10 degrees on all surfaces except native 1737 glass
which had an increase in the contact angle. The contact angle of the 1737 glass would
return to its pre-annealing state over a period of hours. The DI contact angle data is
summarized in Tab. 3-1 below.
3.2.2 Flow cell studies
The initial cellular adhesion studies were conducted by applying shear stress to
hepatocyte and PC-12 cells. Hepatocytes are adherent cells (they must adhere to a
surface to remain viable and function properly) which provide liver function and PC-12
cells are adherent pheochromocytoma (brain tumors) that possess neuron like function in
that they can extend neurites and release neurotransmitters in response to electrical and
chemical stimuli, adhered to the deposited thin films, in the flow cell apparatus described

49
in section 3.1.3.4. Deposited thin films of materials of 6 mtorr,8 mtorr,10 mtorr, 20 mtorr
columnar/void, PECVD polysilicon , evaporated Si and native 1737 glass were compared
for their ability to promote cell adhesion under shear stress conditions. The results of
these studies are compared in Tab. 3-1. The resistance of a cell to shear stress (generated
by the flow) mediated delamination is noted by a +. A larger number of + marks
correlates with increased adhesion of the cell to the surface.
Cells adhered to the 8 and 10 mtorr columnar void films were most resistant to
being delaminated in response to increasing shear stress. The cells adhered to the
Tab. 3-1: Results of flow cell adhesion studies
50
10mtorr films could not be dislodged at the maximum flow rates which could be applied
using the syringe pump. The 6 mtorr columnar/void and ECR PECVD polycrystalline
continuous films’ performance were nearly identical and displayed significantly less cell
adhesion than the 8 and 10 mtorr films. FESEM analysis of the 6mtorr film indicated it
was nearly continuous with little surface topography. The evaporated silicon and native
1737 glass surfaces displayed the least ability to resist cell delamination and had
significantly reduced initial cell densities after culturing. The 20 mtorr columnar/void
films could not be used in the shear stress studies as cells would not adhere during the
initial culturing process. It is theorized that this failure of cell adhesion is related to the
rapid etch rate and restructuring of the film. PC-12 cells did not respond in a significant
manner to shear stress on any surface. This is probably related to the small size of the
PC-12 which reduced drag on the cell, compared to the larger hepatocytes2.
The cell adhesion results correlates very closely with the trends in hydrophobicity
and porosity for the thin film materials. This indicates that extracellualr matrix molecules
(ECM) may be responsible for the promotion of the cell adhesion to these films. ECM
are polymer molecules which have lengths in excess of 10nm. They also have large
hydrophobic cores which promote adhesion to hydrophobic surfaces by water exclusion.
ECM’s are generally derived from the serum portion, or protein rich portion, of the
cellular media with small amounts being excreted by the cells over long time periods.
The cells recognize and adhere to the ECM molecules using cell surface recognition
molecules.
2 Undifferentiated PC-12 cells are approximately 5µm in diameter compared to hepatocytes which are approximately 10-20µm in diameter.

51
Columnar/void materials provided greater cell adhesion than the other continuous
films of similar hydrophobicity, suggesting that the nanoscale texture played a role
possibly unrelated to the ability to adhere ECM molecules or the ability to hold an
increased density of the ECM molecules. This effect may be related to the ability of cell
surface adhesion molecules (integrins and cadherins) to directly interact with the 10nm
features of the columns, much like anchors, or a more complex events related to up-
regulation of the cell’s ECM production stimulated by the interaction with the nanoscale
morphology of the columnar/void materials.
To test this hypothesis serum-less media, known to support hepatocyte growth,
was used in the same experimental design and significantly less cell adhesion occurred
on all materials but the same trends were maintained.
3.2.3 Thin film stability in SBF and annealing study
Columnar/void films of 6, 8, 10 and 20 mtorr, continuous PECVD polysilicon,
GLAD evaporated polysilicon, GLAD evaporated oxide and PEG hydrogels were
compared for stability in SBF. While the PECVD polysilicon, GLAD silicon and silicon
oxide and PEG hydrogel were all stable for at least 24 hours in SBF, all the columnar
void films etched entirely within 2 hours.
Annealing was conducted to determine if it would make the columnar/void films
more robust. Based on the results of the flow cell experiments the 10 mtorr
columnar/void film was selected as the candidate film for further study. The annealing

52
temperature of 400oC was chosen as it would not cause significant restructuring of the
columnar/void material or reflow of the substrate glass. Fig. 3-7 charts the SBF etch rate
of films annealed for 0, 4, 14 and 24 hours. Film thickness measurements were taken at
0, 2, 4, 8 and 24 hours, The variability in the thickness measurements over the first
several measurements is caused by film to film differences in the initial deposition
thickness.
The etch rate reduced after annealing from 500 A/hr to less than 100 A/hr but did
not change significantly with increasing annealing time. Anneals of longer than 4 hours
caused a reduction in the ability of the columnar/void film to promote cell adhesion.
While these annealed films were more robust than non-annealed films, they still etched
entirely within 24-48 hours.
Fig. 3-7: Etch rate of annealed 10 mtorr columnar/void silicon in cellular media
AMOUNT OF COLUMN-VOID SILICON ETCHED VERSUS TIME AFTER SUBMERSION IN NUTRIENT MEDIA
-500
0
500
1000
1500
2000
2500
0 10 20 30 40 50
TIME IN NUTRIENT MEDIA (HOURS)
CO
LUM
N-V
OID
SIL
ICO
N
ETC
HE
D (
AN
GS
TRO
MS
)
0hr4hr14hr24hr

53
3.2.4 Static patterning experiments
Static patterning experiments were conducted in which macroscale dot and
concentric circle patterns, of varying size, of columnar/void silicon were formed on a
1737 glass substrate using the lift-off protocols described in section 3.1.1.6. After lift-off
the films were annealed for 4 hours according to protocol described above. The PC-12
were not used in any of the further studies in this chapter as this cell line began to display
general decreased cell adhesion and a loss of pattern recognition response. This may be
related to compounding mutations in these cells as they are maintained in long term
culture. The hepatocytes continued to display consistent cell adhesion behavior and were
carried forward for further study.
Films deposited at process pressures of 6, 8, 10 and 20 mtorr were tested with 8
and 10 mtorr films displaying the greatest cell adhesion selectivity compared to the glass
substrate. This data correlated well with the results of the flow cell experiments. An
optical microscope picture of cells preferentially adhered to a 10 mtorr columnar/void
silicon can be seen in Fig. 3-8, the area surrounding the circle is native Corning 1737
glass. The difference in cell density between the columnar/void material and the glass is
at least two orders of magnitude but is difficult to calculate because of the sparse number
of cells on the glass area. Fig. 3-9 shows hepatocytes adhered preferentially to patterns
of concentric circles of 10 mtorr columnar/void silicon. The silicon material is light blue
in this image and the glass is red. It was hypothesized that the nearly continuous 6 mtorr
films did not have a large enough surface area to promote cell adhesion selectivity and
the 20 mtorr films etched so rapidly that the cells could not adhere to the rapidly

54
changing surface. The hepatocytes displayed a significantly greater adhesion to the
columnar/void silicon than to the substrate material, such that after optimization of the
culture times and washing protocols cells would adhere only to regions of columnar/void
silicon. Experiments conducted with serum-less media showed far less cell adhesion,
similar to the flow cell results
Fig. 3-8: Hepatocyte cells selectively adhered to 10 mtorr columnar/void silicon, thepicture was taken after 1.5 hours of culture. The size of the porous silicon pad 1mm in diameter the area surrounding the circle is native corning 1737 glass. The scale bar id100 microns.

55
Based on the results of macroscale patterning experiments, microscale patterning
experiments were developed to determine if hepatocyte cells would respond to
columnar/void patterns which are approximately the same size as the cells. Dense
patterns of 20 µm diameter 10 mtorr columnar/void circles or arrays of 20 µm diamonds
with 5 µm wide interconnecting lines were created using the liftoff system described
above. All patterns were fabricated on Corning 1737 glass substrates.
Comparisons of the two pattern types examined indicate that in general 10 mtorr
columnar/void silicon promotes cell adhesion even when the pattern is constrained to the
Fig. 3-9: Hepatocyte cells selectively adhered to concentric circles of 10 mtorrcolumnar/void silicon, the picture was taken after 1.5 hours of culture. The scale bar is200 microns.

56
microscale. Cells were counted by optical microscopy and categorized as on the silicon
pattern only or partially adhered to the pattern (Fig. 3-10). Initially at 0 hours of
incubation approximately 70% of the cells were confined to the columnar Si surface only.
This number rapidly declines to 28% and 26% at the 1 hour and 2 hour time points, while
the total number of cells associated partially with the columnar Si surface increases
slightly. This shift in location of cell adhesion was caused by post adhesion cell motility
(cell spreading) and also limited cell migration towards the columnar/void Si surface.
This indicates that hepatocyte cells were not constrained to the columnar/void Si surface
after initial patterning and may be responding to different environmental cues during the
cells’ initial adhesion and migration phases.
Static Adhesion Time Study
0.00%10.00%20.00%30.00%40.00%50.00%60.00%70.00%80.00%90.00%
Sample Groups
ABCDEF
Fig. 3-10: Percentage of cells adhered to columnar Si with respect to time in culture. Thepercentage of cells associated with columnar Si only: (A) time = 0, (C) time =1 hour, (E)time = 2 hours. The percentage of cells which are associated with both columnar Si and the underlying glass substrate: (B) time = 0, (D) time = 1 hour, (F) time = 2 hours.

57
The circle arrays had a much greater overall number of cells adhered and also a
higher percentage of cells on or partially touching the columnar silicon than the diamond
pattern arrays ( Fig. 3-11 ). This is probably a result of the larger area of columnar/void
silicon adhesion area. It is hypothesized that the diamond pattern area was too small to
support hepatocyte cell growth. This may be related to the induction of apoptotic events
which are initiated when cells are confined to constrained geometries, which are
significantly smaller the cell body [19] ( Fig. 3-12 ).
Fig. 3-11: Low magnification FESEM image of columnar/void Si circle pattern areadisplaying preferential adhesion of hepatocytes to the circle Si regions. The scale bar is100 microns.

58
Fig. 3-12: Hepatocyte on columnar/void Si grid pattern displaying rounded morphology.This cell is probably in the early stages of apoptosis. The scale bar is 2 microns.

59
Cell motility, shape and behavior are also influenced by the pattern, shape and
size. FESEM images were analyzed to determine cell morphology, health and examine
the indicators of motility such cell fringe extension and cytoskeletal alignment with
respect to time in culture after initial patterning. Cells were observed at three time
points; immediately after patterning, one hour and two hours in culture. Cells imaged
immediately after patterning displayed a preferential adhesion to columnar/void silicon
(Fig. 3-13). In 20 µm circle pattern area almost all the hepatocytes were on the circle
Fig. 3-13: Hepatocyte cells adhered preferentially to columnar/void Si immediately afterinitial patterning.

60
columnar/void Si regions. In the vast majority of the cases the cells had not migrated or
spread beyond the confines of the circle. Indications of cell motility were not obvious
some hepatocytes which had initially adhered to the glass were obviously extending
processes preferentially toward and onto the columnar/void Si (Fig. 3-14).
Fig. 3-14: A Hepatocyte initially adhered to the glass substrate displaying indications ofmigration toward the columnar/void Si surface.

61
At the 2hour culture time point the cellular fringes are spread much more and
cells are exhibiting preference to columnar Si associated cell motility (Fig. 3-15 ). Some
cells had completely flattened at this time point and were no longer constrained by the
columnar Si pattern. This supports the interpretation of the data collected during the
optical microscopy analysis. Cells adhered to the substrate glass were more rounded and
probably in an apoptotic state ( Fig. 3-16 )
Fig. 3-15: SEM of Hepatocyte after two hours in culture, displaying migration towardother columnar Si features.

62
After two hours in culture the columnar Si material began to degrade rapidly,
resulting in the delamination of the hepatocytes and probable cell death. Cells generally
take several hours to days after patterning to reenter a normal cell cycle and regain full
biological function [36]. This greatly limits the application of this columnar material for
patterning in µTAS, as cells must reach a biological steady state before reproducible
results can be achieved in cell based assays. As an alternative method for patterning cells
and components, photocatalyzed polyethylene glycol hydrogels were evaluated to for
their ability to maintain cell viability and cell components integrity.
Fig. 3-16: Hepatocyte adhered to glass, the cell has a very rounded morphology probablyassociated with apoptosis. The scale bar is 3 microns.

63
3.2.1 Hepatocyte and Microsome viability and stability in PEG Hydrogel
Photocatalyzed PEG hydrogels were evaluated for the ability to maintain cell
viability and microsomal integrity for over the course of hours and days. PEG hydrogels
have been previously demonstrated to by stable in cellular media for up to one week at
37oC [34]. Hepatocytes were suspended in 84% media/ 15% PEG/ 1% Darocur solution
and sandwiched between two layers of sterile 1737 glass. The hydrogel formation was
photo catalyzed as using UV light exposed through a quartz/chrome photomask. The
required exposure time for hydrogel formation varied from 1-5 seconds with the
concentration of cells. The plates were cultured for 24 hours at 37oC in a 5% CO2
atmosphere and stained with trypan blue to test viability. Some cells did maintain
viability over this period, but the majority were non viable.
Most of the cultures appeared to be infected with bacteria or other microbes.
Bacterial infection or bacterial toxins were not determined to cause of the cell death.
This cell death could have been produced by radical induced chemical damage during
photocatalysis of the hydrogel or by cell lyses from constriction the cell membrane by an
overly dense hydrogel. It was difficult to determine the overall condition and
functionality of the viable cells with-in the hydrogel, as they were inaccessible to high
magnification optical or electron microscopy. The cells entrapped within the hydrogel
could be relatively dormant or massively overproducing proteins in response to 3-D PEG
environment. Without knowing the condition of the hepatocyte cells entrapped in the

64
hydrogel more precisely, it is unlikely that they could be used effectively for a drug
metabolism assay.
Human liver derived microsomes were tested in the same system to determine the
rate of leaching from the hydrogel and if the integrity of the microsome was maintained.
Microsomes vary in size but are typically approximately 100nm in diameter; they are
derived by ultrasonication of bulk liver tissue. Microsome containing hydrogels were
cultured in DiCl3 containing media and evaluated by fluorescent microscopy at 1 and 3
hour time points. DiCl3 is a polar fluorescent molecule similar to a lipid with a peak of
emission at approximately 520nm, it stains lipid bilayers by intercalating between the
lipid molecules. Lipid layers remained intact within the hydrogel and no significant
leaching of the microsomes occurred in 3 hours (Fig 3-17). A time point for testing of 3
hours was chosen as this is several times the expected functional lifetime of the enzymes
contained with in the microsomal vesicle, at room temperature [46]. This is, therefore,
well longer than the microsomes could be expected to be useful in vitro. The density of
the microsomes in the gel could be controlled by diluting the precursor solution with
media or PBS prior to adding the PEG/Darocur solution.

65
3.3 Conclusions
This study evaluated several different deposited thin film materials and methods
for patterning cells, cell components and proteins for cell based biosensors. While
deposited columnar/void silicon materials proved to be an effective method of
generating patterns of ECM and hepatocytes, these materials suffered from
3-17: Microsomes in 15% PEG hydrogel, after 3 hours in culture. The lipid layersappear intact and have not leached out significantly.
66
stability limitations in high salinity environments. These columnar/void materials
would dissolve within hours in either media or SBF. Attempts to stabilize the
columnar material by annealing greatly reduced the etch rate but only extended
the materials lifetime in solution to approximately 24 hours. Photocatalyzed PEG
hydrogels proved to be more robust in high salinity solutions but encapsulated
hepatocytes had limited viability and were of questionable functionality. The use
of microsomes encapsulated within PEG hydrogels appears to be a viable
alternative to either cell based approaches.
Liver derived microsomes which maintain the critical hepatocyte function of drug
metabolism for short periods, have been demonstrated here to be stable and retained for
short periods within the PEG hydrogel. The hydrogels themselves do not degrade in the
high salinity environments of physiological solutions and the microsomes are retained
intact within the gel. This PEG hydrogel/microsome material system was chosen as the
candidate for use the development of the µTAS drug metabolite sensor. The integration
of these materials and their use will be described in chapter 6.
The columnar/void silicon materials, while not optimum for immediate use in a
µTAS device, present unique system for exploring the effects of micro and nanoscale
topography, surface chemistry and spatial confinement on the cell behavior, function and
cellular process regulation. Future work in this area will examine intracellular
organization and genetic regulation with respect to varying pattern shape and surface
topography.

Chapter 4
Microfluidics Device Fabrication and Use
Microfluidics, the manipulation of liquids and gasses in channels with dimensions
of less than 100µm is becoming a critical technology in a number of miniaturized
systems for chemical, biological and medical sensors [37] [38] [39]. These systems
require properties and attributes which are application specific, such as tailored surface
chemistry, optical qualities, electrical and thermal conductivity. In addition, to make a
societal and financial impact, microfluidic systems must meet certain criteria: they must
be inexpensive, rugged and be fabricated using high yield processing [40].
Microfluidic structure fabricated using poly dimethylsiloane (PDMS) attract a
great deal of attention because they meet these criteria. For this reason PDMS was used
for the fabrication of the microfluidics devices in this work. This chapter will review the
process flow for the fabrication of PDMS devices, by soft lithography and molding
techniques for both electroosmotic and hydrodynamic pumping applications.
4.1 PDMS properties
Poly dimethylsiloxane or PDMS is an excellent material for microscale biological
applications for a number of specific reasons: it is compatible with most organic solvents
with the notable exception of dimethylsulfoxide (DMSO), it replicates features with
excellent with resolution of approximately 200nm and it is optically transparent in the

68
visible region and UV down to 280nm wavelengths allowing it to be used in many optical
detection systems. PDMS cures at low temperature, less than 100oC, and is non-toxic,
further it can be used in direct contact with most biological systems. PDMS can form
reversible seals by van der walls interaction or irreversibly with covalent bonds if
oxygenated in a plasma system [42]. The surface chemistry can be controlled reasonably
well with standard siloxane chemistry for making self assembled monolayers.
4.2 Materials and methods
This section will describe the materials and methods used in the fabrication and
testing of PDMS microfluidics devices for both electrokinetic pumping and
hydrodynamic pumping.
4.2.1 Soft lithography and mold fabrication
The patterning of PDMS was done in this study using soft lithography. The
specific soft lithography technique used in this study is a modified version of a process
described by Oakey et al. and is based on the approach of casting with a mold [41] [42].
Microfluidic master molds were fabricated using the following method (Fig. 4-1): first,
Corning 1737 glass substrate was pretreated with a surface coating material hexamethyl-
disilane (HMDS) by spinning at 4000 rpm for 20 seconds, then baking for 15 seconds at

69
1000C. This step is necessary to improve the adhesion of the photoresist and to prevent
adhesion of the PDMS during the curing process. Photoresist (SU-8) was then spun onto
this HMDS treated surface. The SU-8 was spun on at 1300 rpm for 60 seconds, resulting
in photo resist layer with a thickness of 37 µm. Transferring the pattern of a chrome
shadow mask to the SU-8 negative photoresist film created the microfluidic device relief
(mold shape). The samples were then subjected to a two stage soft bake at 70oC for 4
minutes and 95oC for 10 minutes and cooled slowly on a clean room towel. A two stage
soft bake was used to reduce the stress and associated cracking of these thick photoresist
layers, resulting in more robust molds. To transfer the pattern from the chrome mask to
the photoresist, the resist was exposed for 10 seconds on a Karl Suss MA6 aligner with a
light intensity of approximately 12 mW/cm2 and immediately transferred to SU-8
developer solution for 4 minutes at room temperature. The photons catalyzed a cross
linking reaction in the photoresist creating regions of polymer which were resistant to
removal by the developer. After development the samples were rinsed with DI water and
dried under a stream of nitrogen. A second two stage post development bake was
conducted at 70oC for 1 minute and 95oC for 4 minutes. Subsequently, the samples were
cooled slowly on clean room towel. After the post development bake the samples were
observed by optical microscopy to asses the pattern integrity.
In the molds resulting from this just delineated process, those which were used as
masters for electrokinetic flow driven devices were further modified with macroscale
posts to form loading wells. The posts were made by attaching polyethylene tubing to the
surface using Loctite rapid curing two part epoxy. The inner diameter of the tube was
filled with the epoxy to create more robust features. In some devices epoxy leaked from

70
the tube before curing and wicked up the sides of the SU-8 features, broadening and
distorting the features in the area immediately adjacent to the post, this did not have a
significant impact on the device performance.
Once the masters were fabricated molds were cast by pouring uncured Sylgard
184 PDMS (Dupont, Wilimington, DE) over the mold in a 3 inch polystyrene tissue
culture dish (VWR, West Chester, Pa) see Fig. 4-1 . The PDMS was prepared by a 10:1
mixture of prepolymer and curing agent, and curing for 12 hours at 550C in an
environmental shaker (VWR). After curing the PDMS devices were cut from the mold
and trimmed to final size using a steel razor blade.
Fig. 4-1: Scheme for PDMS molding for microfluidics

71
For devices which were used for hydrodynamic pumping experiments, access
holes were punched through the device in the well area using a punch ground from a
surgical steel, HPLC non-beveled injection needle. Special care was taken to prevent
ripping or tearing the PDMS around the access hole as this led leakages during operation.
4.2.2 Oxygen plasma treatment and sealing
After the release, trimming and punching of access holes (hydrodynamic flow) the
PDMS replica were adhered to 1737 glass substrates to complete the device. Two
different methods of sealing, irreversible and reversible, were compared.
Irreversible PDMS bonding occurs with the formation of covalent bonds between
the substrate and the PDMS. The surface of the PDMS and substrate must activated by
O2 plasma oxidation to achieve this bonding. The plasma exposure introduces silanol
(SiOH) groups onto the surface of the PDMS at the expense of methyl (-CH3). It is
hypothesized that these silanol groups react with alcohol, carboxylic acid or ketone
groups on the substrate through a dehydration reaction forming Si-O-Si or Si-O-C bonds.
This occurs on a number of substrate materials, glass, Si, SiO2, Si3N4 and a variety of
polymers. This bonding is very robust, it can withstand high pressures (~100 psi) and
attempts to delaminate the PDMS will result in bulk PDMS material failure before the
interface fails [40].
The protocol used for this irreversible bonding is as follows: The PDMS and
1737 glass were both rinsed in acetone, IPA and DI water and dried under a N2 stream.

72
The PDMS layer and substrate were then cleaned and oxidized by O2 plasma treatment in
a SPI plasma prep Jr. microwave barrel type reactor at 70% power with 5 sfh O2 flow rate
for 1 minute. Immediately after plasma treatment the PDMS replica and the substrate
were brought into intimate contact and then baked at 60oC, for 12 hours to catalyze the
dehydration reaction.
Reversible sealing occurs when PDMS is placed on any reasonably flat substrate.
This is caused by the flexible nature of the polymer material and van der waals
interactions. These are water tight seals, but only withstand low pressures (< 5 psi) in the
capillary networks[40]. This type of bonding is excellent for electrokinetic flow and in
this case PDMS molded portion of the devices can be removed, cleaned, and reused
several times.
The protocol used for this reversible bonding is as follows: prior to reversible
bonding both PDMS and 1737 glass substrates were rinsed in acetone, IPA and DI water
and dried under a N2 stream. The PDMS surface was then cleaned and oxidized by O2
plasma treatment in a SPI plasma prep Jr. microwave barrel type reactor at 50% power
with 5 sfh O2 flow. This step creates a reproducible alcohol rich surface chemistry for
predictable electroosmotic flow and also helps to limit nonspecific protein binding. The
PDMS and substrate were then brought into intimate contact and baked at 80oC in an
oven for 12 hours.
An intermediate bonding condition between reversible and irreversible can be
achieved by plasma treating both the PDMS and glass substrate, bonding them together
and forgoing the bake step. This results in a bond which will withstand higher pressures
73
than the reversibly bonded PDMS but it will display irreversible bond behavior in at least
some locations.
4.2.3 Microfluidics pumping
The two types of pumping used in this study were electrokinetic and
hydrodynamic. The techniques and apparatus for two types of microscale pumping,
electrokinetic and hydrodynamic, are described and compared in this section.
Electrokinetic pumping is a versatile and robust method for microscale fluid movement.
The term electrokinetic pumping encompasses electroosmotic (EOF), electrophoretic
force (EPF) and dielectrictrophoretic force (DEF) [43]. The EOF is a net fluid movement
in an electric field due to the electrical double layer at liquid/channel wall interface. The
magnitude of this force is dependant on the field strength, the surface charge and the
surface to volume ratio of the channel. The EOF functions by dragging a layer of mobile
charges along the surface of the channels which in turn causes a bulk movement of fluid
in the channel by viscous drag. The layer of mobile surface charge develops to balance
the fixed charge on channel walls. Fig. 4-2 is a graphic representation of the
electroosmotic flow in a glass or oxygenated PDMS channel, the round positively
charged molecules represent, in this case,

74
positive hydronium molecules (H3O+) associated with the negatively charged groups on
the surface of the channel. The hydronium ion sheath moves toward the negative pole
creating a net fluid flow to the left in this example and generating force.
The distinctly different phenomenon of electrophoresis is the technique for
moving a charged molecule in a static matrix based on charge, size and interaction with
the matrix. In this case the matrix is the fluid in the channel. The EPF is the force on a
charged molecule in that fluid body in a field, and therefore only causes the movement of
the charged molecule toward the pole of opposite charge. The EOF and the EPF can
Fig. 4-2: Graphic representation of electroosmotic and electrophoretic force, the channelin this picture is oxygenated PDMS having significant negative charge on the surface.

75
work agonistically or antagonistically depending on the charge of the molecules, charge
on the channel wall and pH of the solution.
Dielectrophoresis is defined as the lateral motion imparted on uncharged particles
as a result of polarization induced by non-uniform electric fields [44]. DEP is similar to
electrophoresis in that it causes movement of molecules in fluid but the DEP acts on
uncharged particles only. A non uniform field my be created using two unbalanced
electrodes or an AC field. The polerizabilty of the particle with respect to the
surrounding medium determines the direction of movement in the field. A particle that is
more polerizable than the surrounding medium is attracted towards a strong field, while a
particle of low polerizabilty is directed away from the strong field region. The magnitude
of the dielectric force is determined by the particle size, shape and the magnitude and non
uniformity of the applied field. It is unlikely that DEP motion is making a significant
contribution to particle or molecule motion is this system, as the electrode size is uniform
and field lines will be relatively uniform over the length of the channels. Some field line
bending may occur at the junctions of the loading wells and the channel, where the
volume is abruptly restricted, creating a small DEP force on a molecule but it has not
been observable.

76
4.2.3.1 Electrokinetic pumping power supply and control
An electrical power supply, distribution system, and computer software were
developed to control electrokinetic flow in the microchannel systems. The electrical
power supply consisted of three positive and one negative 2.5 KV power supplies, current
limited to 8mA (Acopian Easton, Pa). The large current capability is required for
effective electroosmosis in high salinity solutions such as phosphate buffered saline
(PBS) or cellular media. As the ionic concentration of the solution increases the amount
of the ionic current derived from side wall associated hydronium ions decreases while the
current derived from bulk solution ions increases, this leads to a reduction in the
electroosmotic flow. The voltage or current output for each power supply is
independently controlled by an IBM 486 computer, running a visual C++ interface
program that’s provides data on voltage and current conditions. This system allows for
simultaneous independent control of four different channels in a device with a maximum
bias of 5000V and maximum current of 8mA. Contact to the channels was made through
gold wires attached to contact clips on the microscope stage.
4.2.3.2 Hydrodynamic pumping and control
Hydrodynamic flow was controlled using a Harvard apparatus PhD 2000 syringe
pump with a minimum flow rate of .0001 µl/hr. 10 ml disposable polyethylene syringes
were used to dispense liquids and were connected to the microfluidics device using steel
luer lock fittings (Popper and Sons, Hyde Park, NY), Tygon silicon tubing (VWR) and
blunt-end syringe needles(Popper and Sons, Hyde Park, NY) .
77
4.2.4 Fluid flow analysis
Fluid flow analysis was conducted using a Leica Micro-Lab II microscope
described in section 3.1.2.2 with a stage modified to hold electrical contacts and
microfluidic devices. Flow behavior was characterized using fluorescent molecules,
suspended hepatocytes and 960nm polystyrene beads with native, amine and carboxyl
terminated surfaces. The effects of the ionic concentration on the magnitude of
electroosmotic and electrophoretic flow were compared.
Hepatocyte viability, defined as whether a cell is alive, in microfluidic channels
was assed using 1% trypan blue in the solution. This dye is impermeable to a healthy cell
membrane but is soluble in the disrupted membrane of a dying or dead cell.

78
4.2.5 Microfluidic design
The microfluidic network was designed using L-edit version 10 (Tanner) and 5
inch chrome photomasks for creating the molds, were made by the Penn State
Nanofabrication facility staff using a Leica EBPG5-HR e-beam lithography tool. The
microfluidics network was designed to fit on a 3” x 1” slide glass, the largest features
were 1mm access wells, with the smallest features being 20 µm wide channels. The
depth of the features is determined by the height of the photoresist features on the mold.
In the case of this study that depth was 37 µm. The layout of the microfluidic test bed
Fig. 4-3: Microfluidic test-bed layout for drug metabolite sensing device
79
chip can seen in Fig. 4-3, the 3” x 1” overall size was necessary to accommodate the
objectives of the microscope, so that the reaction chamber and channels could be
observed without making contact with wire leads or tubes associated with the access
wells.
4.3 Results and discussion
These PDMS devices were made with a number of channel dimensions and
features. Fluid flow was observed in 100µm, 40 µm and 20 µm channels3 using the
techniques described in section 4.2.4. The minimum feature size of loading channels was
determined to be 40 µm. This was determined based on the measurements of the average
cluster size of hepatocyte cells, which was typically 30µm, after trypsinization. This
channel size allowed a minimum of channel clogging while still providing a large surface
to volume ratio for effective EOF. Expectedly, increasing the ionic content of the solvent
in the system decreased the electroosmotic flow significantly for a given voltage. In a
physiologically relevant solvent such as PBS, reasonable flow rates of 10’s of microns
per second could achieved using ranging from 70-300V and run currents in 1-24 µA.
The negatively charged carboxyl terminated polystyrene particles did not respond
to electroosmotic flow but did move by electrophoretic flow toward the positive pole,
This mode of movement resulted from the electroosmotic and electrophoretic flow being
Αλλ χηαννελσ αρε αππροξιµατελψ 40µm in height, as this parameter is defined by the thickness of the SU-8 photoresist on the master.

80
in opposition for this charge configuration, with electrophoretic motion dominating over
electroosmotic flow. The positively charged amine terminated polystyrene moved by
electroosmotic flow at nominally the same rate as uncharged polymer particles.
Cell flow in the microchannel was tested using both electrokinetic and syringe
pumping methods. Hepatocyte cells were used as they are both relatively large and are
one of active cells for drug metabolism. Hepatocytes pushed through the microchannels
using a syringe pump remained intact and were viable as determined by trypan blue
incorporation. The cells were often fouled in the channels as they stuck to side walls and
agglomerated. Hepatocyte cells pushed through the channel by electrokinetic flow fouled
the channel side walls and agglomerated less than syringe pumped cells. The hepatocytes
were very susceptible to electrical stress, when exposed to high voltages for even short
periods of time they were often appeared sickly or were no longer viable as determined
by trypan blue incorporation.
At high voltages and run currents channel heating could be severe resulting in the
boiling of the solution in the channel or in extreme cases deformation of the PDMS. All
flow was laminar unless the microchannels were largely occluded by cellular
agglomeration or defects.
The hydrodynamic flow experiments conducted were very limited but defined
acceptable pressures and flow rates for maintaining devices integrity and laminar flow
regime. A flow velocity of 10 µm per second could be achieved by setting the syringe
pump to 3-8µl per minute, is hypothesized that pressure loss due to the expansion of the
silicon tubing and PDMS channels accounts for the discrepancy in flow rate. Higher
flow rates resulted in the generation of large amounts of backpressure causing a failure at

81
the junction of the syringe needle and PDMS access port. 100µm width channels had a
significantly smaller resistance to hydrodynamic flow and clogged less than frequently
channels with smaller dimensions.
Experiments conducted using PDMS structures which had been bound using the
intermediate bonding condition described in section 4.2.2 were useful for both
electrokinetic and hydrodynamic driven flow. These devices could withstand higher
pressures than the reversibly bound systems and could also be delaminated without
causing severe bulk failure of the PDMS. Intermediately bound devices using
electrokinetic pumping were more robust than reversibly bound devices during normal
handling and device preparation, and could tolerate higher backpressure when clogged or
obstructed.
4.4 Conclusions
This chapter discussed the fabrication and operation of PDMS microfluidic
devices for both electrokinetic and hydrodynamic flow driven systems. For microfluidic
applications using cultured hepatocyte cells PDMS channel sizes greater than 40 microns
are preferred. This allows cells and cellular components to be loaded into the device by
hydrodynamic flow, provides good resistance to fouling by cell clusters and debris and
more importantly reduces cellular exposure to high voltages and currents. For effective
electrokinetic flow, channels with higher surface to volume ratios provide optimum EOF
at a minimum voltage and run current.

82
The susceptibility of hepatocytes to electrical stress indicates that a the use of a
cell component based system, using only microsomes and the associated membrane
bound enzymes, may be more robust and therefore effective for drug biotransformation in
this device. The data generated from these experiments was used to define the
operational parameters and to optimize the device design for the microscale drug
metabolism system that is presented in detail in chapter 6.

83

Chapter 5
Matrix-less Laser Desorption and Ionization for Drug Metabolism Studies
One of the needs of increasing importance in Drug Discovery is the ability to
assay a potential drug compound for its pharmacological properties. To be an
effective drug, a compound not only must be active against a target, but it needs
also to possess the appropriate absorption, distribution, metabolism, and excretion
(ADME) properties necessary to make it suitable for use as a drug. For many
years, much of this testing was done in vivo using drug treated animal blood or
urine [46]. However, with the increasing numbers of targets and hits being
generated at most pharmaceutical companies using high throughput combinatorial
chemistry techniques, the need to do more ADME screening (particularly in vitro
ADME testing) has become critical.
This chapter will describe development of a macroscale technique of matrix-less
laser desorption/ionization mass spectrometry (LDI-MS) for rapid in vitro
screening of drugs and drug metabolites. Section 5.1 will provide an introduction
to drug metabolism, the current methodology and the motivation for this study.
Section 5.2 will describe the materials methods used in this work. The results will
be discussed in section 5.3 with the conclusions and recommendations for further
research in the final section, 5.4.

85
5.1 Introduction
Determining the in-vivo or in vitro metabolites of a drug lead compound
consumes tremendous drug discovery resources. A large pharmaceutical company may
only perform complete metabolite studies on five to six compounds a year [45]. In vivo,
the work of drug metabolism is carried out primarily by the liver. The liver will
biotransform drugs delivered into systemic circulation by injection or to the portal
circulation by intestinal adsorption. The biotransforming enzymes of the liver are termed
mixed function oxidase enzymes and come in several isoforms all belonging to
cytochrome P450 (CYP) super family [46]. These enzymes occur in the rough
endoplasmic reticulum (microsomes) of the hepatocytes4. The P450 enzymes catalyze
oxidation reactions (Phase 1 reactions) which result in oxidation, hydroxylation,
deamination and de-alkylation reactions among others. Phase 2 reactions are also present,
these involve conjugation of the drug or its phase 1 products with other compounds (e.g.
glucuronic acid) to form conjugates which are less lipid soluble than the parent
compound and more easily excreted [46].
The state of the art in vitro techniques use biological metabolizing agents such as
hepatocytes, human liver or intestinal microsomes and liquid chromatography mass
spectrometry, mass spectrometry (LC/MS/MS) to elucidate the drug metabolism
pathway. LC/MS/MS first identifies the intact metabolites produced from reaction, then
4 Microsomes are small lipid vesicles derived from sub-cellular organelles, typically the
endoplasmic reticulum, by ultrasonic homogenation of the liver.

86
targets components of interest for further cleavage (fragmentation) to get detailed
information of their structure.
Typically these reactions are conducted in 96 or 384 well array plates and
sampling is conducted by an automated liquid chromatography system. The analyte is
then separated by differential retention on a chromatography column and injected into the
mass spectrometer. This is a time consuming process requiring 6-30 minutes from
sampling to regeneration of the column [49]. While the application of drug metabolite
studies in the early phases of compound development would provide valuable
information for compound optimization and greatly streamline the pharmaceutical
development process, the cost in time and resources are prohibitive for doing thousand or
hundreds of thousands of compounds yearly.
The development of a low cost, rapid screening method for drug metabolites
would greatly expand the application of drug metabolism studies to earlier stages of the
drug discovery cycle. MALDI technology (see section 2.5) provides a very rapid
technique with low cost for screening compounds, but this technique’s usefulness is
generally limited, because of matrix interference, to molecules with masses greater than
600-800 amu. Studies conducted to use reduced amounts of matrix or to subtract matrix
noise by data manipulation have met with limited success [47] [48] [49].
A laser based, matrix free, desorption and ionization mass technique would have
immediate application for drug and drug metabolite studies. This whole thesis has been
directed toward this end. It has focused on the localization of cells or cell components
for defining metabolism sites and on development of a deposited thin film material which
promotes laser desorption and ionization and is optimized for drug and drug metabolite

87
analysis. Experiments conducted by Cuiffi et al. on exploring deposited columnar/void
thin films for mass spectrometry provided the basis for the laser desorption portion of this
research, this work has been included for reference in appendix A [50]. The columnar
void films developed in the course of that study provided excellent ion yield but tended to
have high noise in the low mass (<600 amu) region from adsorbed hydrocarbon
contaminants. The objective of this study was to reduce the signal to noise ratio in the
mass range of 0-600 amu while enhancing dynamic range.
5.2 Materials and Methods
The materials and methods used for the laser desorption aspect of this study will
be described in this section. Much of this development was conducted in collaboration
with Joseph Cuiffi of the Pennsylvania State University [52]. Thin film deposition
techniques will be discussed in section 5.2.1. Section 5.2.2 will cover mass spectrometry
techniques and devices, and section 5.2.3 will detail the methodology for drug
metabolism experiments.
5.2.1 Thin film deposition techniques
Germanium thin films were deposited by e-beam evaporation in a Kurt Lesker
evaporator, the details of this system are described in section 3.1.1.2. The precursor

88
material was 99.999% Ge cubes, evaporated from a vitreous carbon crucible. The target
thickness was 100nm. The substrate material was Corning 1737 glass or polished
stainless steel.
To make visualization more convenient, patterns of Ge analysis regions were
created by during deposition by shadow masking, using a laser drilled, 5 mil, spring steel
shadow mask. The pads were 1mm diameter circular wells with a pitch of 4.5 mm.
Typically, 16 spots were aligned on a 1 inch square substrate. Photolithography and
liftoff as described in section 3.1.1.6, were used as an alternative to shadow masking but
concerns regarding chemical contamination during the lift-off procedure prevented these
samples from being tested.
5.2.2 Mass spectrometry techniques and devices
The laser desorption/ionization measurements were performed on one of two
mass spectrometry systems, a Micromass M@LDI time of flight system or a Micromass
Q-TOF system, which is a combination quadrapole and TOF system capable of MS/MS
data analysis. A diagram of the ion path and ion optics of the Q-TOF is seen in Fig. 5-1.
The typical operation pressure for these systems is < 1x10⁻⁶ torr.
The samples substrates were glass and attached to the standard target plates using
double sided conductive carbon tape. Samples were irradiated with a nitrogen laser
(Laser Science Inc.), operated at 337 nm, at 20 Hz and attenuated with a neutral density
filter. Ions produced by laser desorption off the Ge surface were energetically stabilized
during a delayed extraction period of 150 ns and then accelerated through the quadrapole

89
and time-of-flight mass analyzer by a 15-20-kV potential pulse. Spectra shown were
typically an average of between 32 and 128 laser pulses. For all compounds 1µl volumes
of analyte solution were dried in air, at room temperature with no solution clean-up or
desalting.
Fig. 5-1: Micromass Q-TOF ion path and optics diagram

90
5.2.3 Drug metabolism protocol
In vitro drug metabolite studies were carried out using pooled rat liver
microsomes (Cellz Direct, Ca), with an initial protein concentration of 20mg/ml. The
microsomal solution was mixed 1:1 with a substrate solution of 2mM NADPH, 6mM
MgCl2, 25mM Tris-HCl, pH 7.4, 100µm of the drug compound. The drug compounds
used in this study were dextromethorphan, verapamil and sulphadimethoxine (Sigma
Aldrich, Wi) was used as a mass standard. All compounds were at least 98 % pure and
were prepared as 10mM stock solutions in 1:1 mixtures of DI water and methanol.
Sulphadimethoxine was prepared at a concentration of 10ng/µl in DI water for the
calibration experiments. Dextromethorphan is 3 Methoxy-17-methylmorphinan
monohydrate, which is the d-isomer of levophenol, a codeine analogue and opioid
analgesic. It is a commonly used antitussive agent in cough suppressants. The average
molecular weight of this compound 271.4 amu, the structure of the compound is detailed
in Fig. 5-2.
Verapamil is an L-type calcium channel blocker. Calcium channels are abundant
in cardiac and smooth muscle, restricting the function of these channels results in
Fig. 5-2: The chemical structure of dextromethorphan

91
vasodilatation of coronary vessels and increase in coronary blood flow. The average
molecular weight of verapamil 454.6 amu, the structure can be seen in Fig. 5-3.
Sulphadimethoxine was used as a mass standard and calibrant, the average mass
for this compound is 310.327 amu, refer to Fig. 5-4 This drug was not included in the
metabolism studies.
The drug metabolism reactions were carried out in 96 well array plates with 100µl
total solution volumes at 37oC, 5% CO2, for 30 minutes. After incubation the samples
were cooled on ice for 5 minutes to stop the reaction and centrifuged at 1000 rpm for 2
minutes (Eppendorf 5417 C, Hamburg, Ger). The supernatant was drawn off and
immediately used for mass analysis.
Fig. 5-3: Chemical structure of verapamil
Fig. 5-4: Sulphadimethoxine chemical structure
92
5.2.4 Surface Chemistry Modification
The surface chemistry of the germanium was modified by the application of self
assembling silane molecules presenting different terminal functional groups. The
protocol used for self assembly was modified from Ulman and will only be described
briefly here [51]. 3-amino triethoxy silane, (tridecafluoro-1,1,2,2 tetrahydrooctyl)
triethoxy silane, methacryoxypropyl triethoxy silane and (3-glycidoxypropyl) silane were
purchased from Gelest, (Tullytown, PA). These compounds were prepared at
concentrations 1-4% by volume, in aqueous solutions of 95% ethanol (J.T. Baker, NJ),
5% DI water, pH 4.5 with glacial acetic acid (J.T. Baker, NJ). A 5 minute period was
allowed for hydrolysis and silanol formation prior to the addition of the germanium film
coated substrates. The reaction was carried out for 1 hour at room temperature, followed
by 3 rinses in ethanol. The SAM layer was cured for 1 hour at 110oC on a hot plate. The
SAM layer formation was characterized by DI water contact angle measurements as
described in chapter 3.
5.3 Results and Discussions
This study focused on the demonstrating the feasibility of using a continuous,
meaning non-porous, deposited thin film technique for matrix-free laser
desorption/ionization of drug metabolites from a microsomal digestion. The deposited
thin film was designed to have minimum surface area and no porosity, low reflectivity of
UV light, and low hydrophobicity. A porosity free surface minimizes the surface energy
and reduces the amount of adsorbed hydrocarbon contaminants. High UV absorbance

93
reduces the photon flux necessary to desorb and ionize analytes from the surface,
resulting in lower molecular fragmentation and a higher proportion of M+H ions. The
laser power required for LDI from this continuous Ge film is comparable to the power
required to desorb ions from tradition MALDI organic matrices. Hydrophilic surfaces
promote homogenous drying of analyte drops. The evaporated Ge films had a reflectance
of approximately 37% compared to a reflectance of 70% for a single crystal Ge wafer at
337nm. The DI contact angle of evaporated Ge is approximately 30%, which results in
very good wetting for most organic and polar solvents.
The mass spectrometer parameters were optimized and calibrated using
Sulphadimethoxine, the expected mass of the molecule plus a proton is 311.3 amu. It is
hypothesized that this proton for ionization is derived from water or hydrocarbons
adsorbed to the surface of the film or co-crystallized with the dried analyte on the surface
(Fig. 5-5). The other peaks in the spectra were determined to have derived from
impurities in the solvents or the purchased drug material (data not shown). The
background spectra from the Ge film was very limited in both the quantity and intensity
of the peaks, with hydrocarbon noise peaks dominating at a molecular weight of
approximately 200-400 amu.

94
Both dextromethorphan and verapamil are biotransformed by demethylation,
which is the loss of a CH2 group, when incubated with the microsomal solution. The
cytochrome P450 3A4 isozyme is primarily responsible for this n-demethylation reaction
of planar ring molecules. The results of dextromethorphan metabolism experiments can
be seen below, an undigested sample taken before incubation is used for the control
(Fig. 5-6). After 30 minutes of incubation a demethylated peak can be clearly detected
and resolved by the mass spectrometer at 258.2 m/z ( Fig. 5-7 ). Longer incubations do
not result in significantly more metabolism, as the enzyme is mostly denatured after 30
minutes at 37oC.
Fig. 5-5: Mass spectrum of sulphadimethoxine, the expected M+H mass is 311.3

95
Typically, mass spectrometry of complex solutions of biological materials
requires extensive clean up by column fractionation or zip tipping to remove lipids, salts
and surfactants which can suppress ionization of the analyte. This technique is much
more tolerant of contaminants then ESI or MALDI. These samples were analyzed with
no sample clean-up other than a centrifugation to remove large cellular debris.
Fig. 5-6: Mass spectra of dextromethorphan at time 0. Target mass peak can be scene at272.2 m/z.
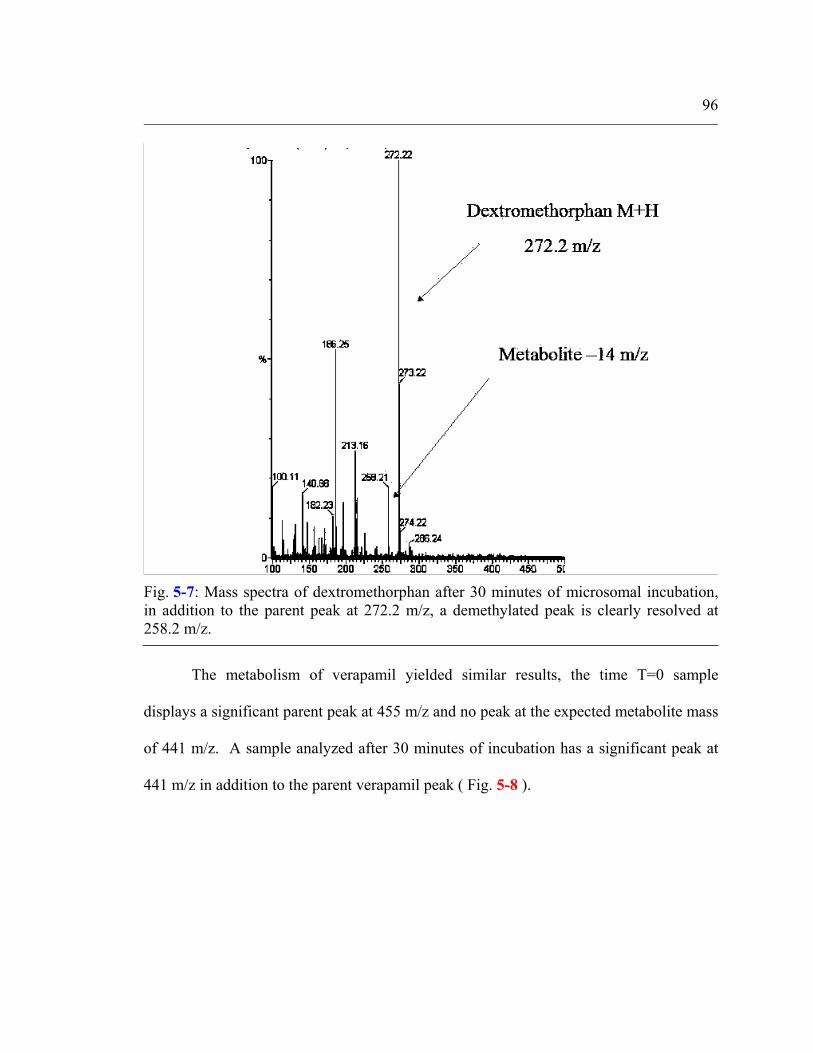
96
The metabolism of verapamil yielded similar results, the time T=0 sample
displays a significant parent peak at 455 m/z and no peak at the expected metabolite mass
of 441 m/z. A sample analyzed after 30 minutes of incubation has a significant peak at
441 m/z in addition to the parent verapamil peak ( Fig. 5-8 ).
Fig. 5-7: Mass spectra of dextromethorphan after 30 minutes of microsomal incubation,in addition to the parent peak at 272.2 m/z, a demethylated peak is clearly resolved at258.2 m/z.

97
The peak at 303.38 m/z is a common fragment ion of verapamil. The peaks at
lower masses are attributed to solvent contaminants. An enlargement of the spectra (
Fig. 5-9 ), shows both the sodium adduct and the potassium adduct at M+22 and M+40
and the isotopic peaks of the compounds. The peak at approximately 462 m/z is likely to
be the sodium adduct of the verapamil metabolite at 441.108 m/z. Sodium and potassium
adduction are common in the high salinity solution used for enzymatic metabolism. In
DI water dilutions the amount of salt adduction is reduced, often leading to more intense
peaks of the M+H ion.
Fig. 5-8: Mass spectra of verapamil metabolism at T=30 minutes, parent compound canbe seen at 455 m/z and demethylated compound at 441m/z.

98
A comparison of the spectra obtained from the continuous germanium film
(Fig. 5-8 ) and a columnar void film ( Fig. 5-10 ) shows a significant difference in the low
molecular weight region of the spectra [53]. The columnar/void film has a large number
of intense peaks in the 200-400 amu region which obscure the analyte peaks entirely. At
very high analyte concentrations (millimolar) this low molecular weight noise is less
pronounced on the columnar void material. This noise suppression is most likely related
to competitive ionization of the high concentration analyte compared to relatively low
concentrations of adsorbed contaminants. Several efforts where made to clean the freshly
Fig. 5-9: Enlargement of the verapamil metabolite spectra T=30 min. The sodium and potassium adducts can be seen at 477.057 m/z and approximately 495 m/z respectively.The isotopic peaks of the compounds can also resolved at this scale.

99
deposited columnar/void silicon and continuous germanium films using organic solvents,
but always resulted in the increasing the low molecular weight noise in the spectra.
Studies of adding organic solvents to the analyte samples before their application
to the deposited germanium thin film surface, indicate that solvent composition can effect
both ion current intensity and dynamic range. Primarily, our samples were prepared with
high performance liquid chromatography (HPLC) purified molecules dissolved in
deionized water; however, we also examined the effects of various additional solvents. In
general, it was found that these additional solvents affected the way the drop dried and,
therefore, modified the state of the analyte on the surface. We found this to be a very
important, but not yet fully understood, phenomenon. A specific example of these effects
can be found in samples that contained >25% acetonitrile. Drops from such a sample
have low surface tension and quickly spread over a large surface area, reducing signal
intensity. Some solvents such as DMSO have extremely low vapor pressures and will not
dry within a reasonable amount of time at room-temperature conditions. Purity of the
organic solvents also must be considered because of the sensitivity of this technique to
low-mass contaminants that can be included in the signal.

100
Chemically mediated molecular attachment to the surface was performed on the
material to also study the effects of surface pH and of hydrophobicity and hydrophilicity
of the germanium films on signal acquisition. To achieve the various modified surfaces,
self assembling silane molecules were reacted with germanium as described in section
5.2.4. It was observed that all such modified films required an increased laser power for
detection but displayed no change in the reflectivity. This indicates that the extra
molecular layer between the analyte and nano-structured surface reduces the energy
transfer efficiency, but still enables desorption and ionization to occur. Hydrophobic
Fig. 5-10: Comparative spectra from deposited columnar/void film displays high noisesignal in the low molecular weight region occluding drug molecule signal.

101
surfaces increased the overall signal intensity, but provided a less uniform signal over the
drop area. This effect is probably related to smaller spot size, rather than an interaction
between analyte and the surface. Other differences in the signals obtained using
hydrophobic and hydrophilic surfaces are difficult to generalize and are probably related
to the analyte distribution, crystallization rate, and footprint that result when a drop dries
on the surface. However, clear mass spectra can be obtained from surface functionalized
samples, which could lead to novel surface selectivity detection devices similar to those
developed by Hutchens’ group [48].
5.4 Conclusions
A high speed, non-matrix laser desorption and ionization technique based for drug
metabolite screening on deposited continuous thin films has been demonstrated in this
chapter. These materials are vacuum deposited, reducing the contamination of
degradation issues associated with electrochemical etched materials. The non-porous
nature of these films reduces the adsorption of atmospheric contaminants providing
optimum performance for small molecule detection. The applicability of non-matrix
laser desorption for the analysis of in-vitro drug metabolism samples was successfully
demonstrated using deposited continuous germanium thin films, providing a suitable non-
matrix alternative to both desorption/ionization on silicon (DIOS) and conventional
electrospray ionization (ESI_ techniques. Higher sensitivity than that of previous
MALDI work has been observed, showing analysis at biologically relevant incubation

102
concentrations. The high throughput potential of this technique as an effective screen.will
be examined later in this thesis. These data show the potential for using array detection
schemes for accurate MS and MS/MS and post-acquisition processing, of in-vitro
samples from a single incubation. The low temperature deposition techniques used
fabricate these Ge films that enabled LDI-MS make these system vary attractive for low
cost microscale, array format applications based on glass or plastic substrates.
Integration of this technique into a µTAS device based on PDMS microfluidics will be
explored in the following chapter.

103

Chapter 6
Microscale, Cell Based Biosensor for High Throughput, In Vitro Drug Metabolism
Research on microfabricated analytical devices has grown considerably in the last
10 years. Many publications have reported results demonstrating the advantages of these
analytical microsystems, including speed, reduced sample/reagent consumption,
integration, and automation [37] [38] [39]. A notable application of these chip-based
analytical systems is enzymatic assays. Current on-chip enzymatic assays use soluble or
immobilized enzymes and rely on the conversion of a non-detectable species to a
detectable one. Fluorescence and amperometry have been the main types of detection
used in these assays [54] [55] [
56].
These methods, while being very useful for molecular recognition assays, do not
provide the high content data that can be acquired by mass spectrometry. A microscale,
chip based, array system, which is capable of high throughput drug metabolism coupled
to analysis by laser desorption/ionization (LDI) mass spectrometry (MS) could have
immediate impact on the drug discovery cycle. Automated, high throughput absorption,
distribution, metabolism, and excretion (ADME) analysis performed on an inexpensive,
robust and potentially disposable platform will provide high content data at an earlier
stage than is presently feasible given the limitations of modern macroscale liquid
chromatography-electrospray ionization based mass spectrometry systems (LC-ESI-MS)
[58].

105
This work studies the feasibility of performing enzymatic reactions in a chip-
based microfluidic format coupled directly with laser desorption mass spectrometry
detection. The enzymes investigated here belong to the cytochrome P450 system, which
is a membrane-bound (water insoluble) enzymatic system responsible for the
biotransformation of drugs and other compounds. Liver microsomes, which are
endoplasmic reticulum derived vesicles, provide the source of the enzyme for drug
metabolism. The microsomes are patterned in-situ, in the microfluidics system, using the
polymerization of a photocatalyzed hydrogel/microsome solution. The microsomes and
drug metabolitism are covered in more detail in chapter 5. The microfluidic network is
fabricated using the PDMS mold casting procedure described in chapter 4.
Section 6.1 covers the materials used the fabrication and methods of operation of
the microscale drug metabolite analysis device. The results will be discussed in section
6.2 and the conclusion in section 6.3.
6.1 Materials and Methods
6.1.1 Chemicals
Verapamil, norverapamil, α-nicotinamide adenine dinucleotide phosphate
(NADPH), magnesium chloride, and 25 mM Tris-saline buffer were purchased from
Sigma Chemical Co. (St. Louis, MO). Pooled human liver microsomes (HLM) containing
20 mg of microsomal protein/mL were purchased from Cellz Direct. (Ca). Other reagents
were hydrochloric acid, isopropanol and HPLC grade acetonitrile (J. T. Baker,

106
Phillipsburg, NJ). Sylgard 184 polymer and curing agent were purchased from Dupont
Chemicals (Wilmington, DE). The 2.5 mM Tris buffered saline was prepared by diluting
the stock in deionized water with the pH adjusted to 7.4 using hydrochloric acid. The
DiCl3 endoplasmic reticulum stain was prepared at 25mg/ml in phosphate buffered saline
(PBS). All solutions in this work were prepared using NANOpure deionized water
(Barnstead, Boston, MA).
6.1.2 Chip Fabrication
The chips were fabricated on 0.97 mm thick, Corning 1737 glass (VWR, Pa) with
external dimensions of 76.2 mm x 25.4 mm. This device size was determined by the area
covered by the objective lenses of the Microlab II microscope as described in section
3.1.2.2. The fabrication process for the poly dimethylsiloxane microfluidic chip (PDMS)
was as described previously in chapter 4.
The design of the chip includes three inlet channels and one outlet channel
meeting at a cross junction and forming the reaction region (Fig. 6-1). This device uses a
combination of hydrodynamic and electrokinetic flow. The depth of all the channels in
the device was 37 µm. A 100 µm wide loading channel is used for hydrodynamic
loading of the microsome/hydrogel solution. The wide loading channel provides a low
resistance to hydrodynamic flow and reduces fouling by cellular debris from the
microsome solution. The inlet and outlet channels for wash buffer and substrate solutions
are 40 µm in width. The smaller channel’s large surface to volume ration provides for
more effective electrokinetic flow than channels with larger dimensions. There is little

107
concern of fouling or blocking these channels, as the wash buffer and substrate solutions
have almost no large particles or debris.
Posts with an 80µm diameter have been fabricated at the junction of the two
smaller inlets and the outlet channel and the reaction chamber to prevent cellular debris
from the microsome solution from entering the inlets and outlets. There is a 10 µm gap
between the post and the side wall. The volume of the outlet channel is approximately
1µl from the junction to the loading well. The smaller inlet channels are for the wash
buffer solution and substrate solution loading.
Fig. 6-1: Schematic of the reaction region of the microfluidics device

108
The germanium LDI analysis regions, described in chapter 5, were fabricated on
the glass substrates using a liftoff method similar to that described previously in section
3.1.1.6. Shipley 1827 positive resist was spun on at 4000rpm for 30 seconds. This
resulted in a photoresist layer of approximately 2.5 microns in thickness. The samples
were soft baked for 1 minute at 110oC prior to alignment and exposure. Alignment was
performed using a Karl Suss MA6 contact aligner, exposure times varied from 5-7
seconds depending on the age of the UV source and photoresist. Samples were
developed in MF 312 developer for approximately 1 minute. No post development bakes
were performed to assist in the lift off process.
The continuous germanium thin film was deposited by sputtering in a MRC 902
in-line sputtering system, with RF power supply and cryo-pump. The base pressure was
approximately 8x10⁻⁸ torr. The deposition process conditions used were as follows: the
process gas was argon at a process pressure of 5 mtorr, the forward power is 750W, the
film was deposited in 5, 1 minute passes, with a target film thickness was 100nm. The
pattern has 5 discrete LDI analysis pads across the width of the substrate. The analysis
pads are 2mm in width by 5 mm in length with a 2.5 mm pitch. The center pad is aligned
with the outlet channel and the side pads, which are covered by the PDMS and not in
contact with microfluidics network, were used for control samples (Fig. 6-2).
The device was assembled using the intermediate reversible bonding protocol
described in section 4.2.2. This process results a robust, but reversible bond and leaves a
well defined oxygen rich surface chemistry on both the microchannel surface and the
glass/germanium substrate.

109
After bonding, the devices were sealed in 3 inch cell culture dishes, in the clean
room atmosphere, to prevent biological and hydrocarbon contamination until use.
6.1.3 Chip Operation
The general scheme of operation of this µTAS for drug metabolism and analysis
is as follows; First, the microsome solution is introduced into the device. This is
followed immediately by the addition of the drug containing substrate solution. Third the
Fig. 6-2: Schematic of the micro drug metabolite analysis device.

110
microsomes and substrate solution are incubated for 30 minutes to allow the enzymes
contained in the microsomes to metabolize the drug. The solution is then
electrokinetically pumped down the outlet channel to the LDI analysis region. The final
step is the removal of the PDMS microchannel system and analysis by LDI mass
spectrometry.
Two different methods for the operation of the device were compared. In the first
method microsomes were encapsulated in a polyethylene glycol (PEG) hydrogel, which
filled the reaction chamber. The second used a hydrogel plug to block the outlet channel
while filling the reaction chamber with a free floating microsome solution. The second
method, using the hydrogel plug, presents two potential advantages: it allows the device
to be washed after hydrogel formation, prior to the addition of the microsomes, and it
results in a higher concentration of microsomes in the reaction area.
To control flow during operation, this device used both syringe and electrokinetic
pumping for different phases of the process. The device set up and protocols for syringe
and electrokinetic pumping were described previously in chapter 4. The syringe pumping
was controlled by a two channel infusion pump (Harvard Apparatus, South Natick, MA).
The syringe pump was used for introducing the microsome and hydrogel solutions into
the chip. The flow rate for loading the microsome and hydrogel solution was set for 10
µl per minute. The computer controlled, 2.5 KV power supply system, described in
section 4.2.3.1, was used to direct electrokinetic flow during the wash steps and for the
loading of the drug containing substrate solution.

111
Flow rates for syringe and electrokinetic pumping were determined by observing
the flow of the fluorescent molecule fluoroscein in the microfluidic system. Fluoroscein
has a peak adsorption at approximately 490nm and a peak emission at 515nm.
6.1.4 On chip enzymatic drug metabolism reaction protocol
The on-chip enzymatic metabolism reaction was conducted using the two
different protocols described briefly above. Both drug metabolism protocols described
here are modified from the macroscale protocols used in chapter 5. The first protocol is
as follows. A PEG diacrylate /1% Darocur (1-phenyl-2-3 hydroxy-2-methyl-1-
propanone), precursor solution, was prepared by vortexing and stored in a dark bottle. A
microsomal solution (10 mg/ml protein) in 2.5mM Tris-saline was diluted to 15% PEG
with the PEG precursor solution. The drug substrate solution was premixed off chip to a
concentration of 2mM NADPH, 6mM MgCl2, 25mM Tris-HCl (pH 7.4), and 100µm
verapamil in DI water. The channels of the device were pre-filled with a 25mM Tris-
saline solution. The microsome/ 15%PEG diacrylate solution was introduced through the
loading channel by the syringe pump. The hydrogel polymerization was then was then
catalyzed in the reaction area by UV light exposure for 10 seconds with an EFOS light
source (3650 mW/cm2 at the fiber tip) through a shadow mask.
The drug substrate solution was immediately introduced into the substrate loading
well. A 70 V bias was applied between the substrate loading well (positive 70 V) and
output channel well (ground) for 5 minutes to pump the drug substrate solution into the
reaction region. The substrate and microsomal solution were allowed to react for 30

112
minutes at 37oC in an environmental controlled chamber (VWR, Pa). Following the
incubation step a 200 V bias was applied between the buffer loading well (positive 200
V) and the output channel well (ground) for 15 minutes. This pumped the contents of the
reaction chamber over the LDI analysis pads. In the final step of operation, the solution
was removed from the loading wells by aspiration with a pipette and the PDMS
microfluidics networks was removed to prepare for LDI-MS analysis.
The second protocol is similar to the first with the exception that the microsomes
are not encapsulated in the hydrogel, but a discrete hydrogel plug is created in the outlet
channel between the reaction chamber and LDI analysis region to separate the microsome
reactions in the reaction chamber from the LDI region. In the first step, the PEG
diacrylate precursor solution is mixed to 15% by volume in a 25mM Tris saline buffer.
The PEG mixture is introduced into the device through the wash buffer loading well and
allowed to fill by capillary action. The hydrogel polymerization reaction is then
photocatalyzed using a shadow mask exposing a 1mm section of the outlet channel. The
conditions for the exposure are the same as above. This creates a discrete plug which
completely occludes the channels. The PEG solution in the wash buffer loading well is
then replaced with DI water and a 100 V bias is applied sequentially between the wash
buffer loading well (positive 100 V) and the other three wells (ground). This generates a
low velocity (~5 µm/second) electroosmotic flow. Each arm of the device is washed with
DI water for 10 minutes. The hydrogel is stable under these conditions and does not melt
or shear in the flow. The microsome solution is then introduced into the microsome
loading well and pumped into the system using the syringe pump. The posts in the
reaction chamber and the hydrogel plug in the outlet channel retard the progress of the

113
microsomes and cellular debris through the device. This allows the microsome solution
to be concentrated in the reaction region, increasing the concentration of enzyme for
metabolism. The device is then operated in the same method as the first case for the
remaining steps of: substrate solution introduction, incubation, and analysis.
6.1.5 Mass Spectrometry Conditions
The MS system used for this study was an Applied Biosystems DE-STR, time-of-
flight, mass spectrometer (Framingham, MA) equipped with a delayed extraction
feature. The operating conditions were set for 15kV extraction voltage with a
150ns delay. The optimal laser power varied from a set point of 3000 to 3600, the
power output was not measured. The spectra were acquired in both linear and
reflectron mode, with 64 spectra averaged for each sample.
The glass substrates, with the LDI analysis pads from the drug metabolite sensor
were adhered to the surface of the standard, stainless steel, analysis plate using
double sided, conductive, carbon tape (EMS, Pa).
6.2 Results and discussion
This work studies the feasibility of performing enzymatic drug metabolism
reactions in a chip-based, microfluidic format, that is coupled directly with laser

114
desorption mass spectrometry detection. The chip was designed to permit the use of both
hydrodynamic, syringe pumping and electrokinetic pumping. The P450 cytochrome
enzyme-containing microsomes were mixed with the drug containing substrate solution
on chip. Experiments utilizing fluoroscein and DiCl3 ER stain, were performed to
confirm the electrokinetic flow of positively charged molecules in the hydrogel (data not
shown) and the integrity of the microsomes in the solution ( Fig. 6-3 ).
Fig. 6-3:The bright areas are agglomerations of the DiCl3 stained microsomes. The microsomes have been encapsulated in a 15% PEG diacrylate hydrogel. The scale bar is100 µm.
115
Fluoroscein was used to model verapamil flow in the microfluidics network as
they are both positively charged in neutral pH solutions and are of approximately the
same molecular weight. It could not be determined whether the movement of was
electroosmotic or electrophoretic as both are complimentary in this charge configuration.
The microsomes were stable in the hydrogel and did leach significantly over a three hour
period. The microsomes appeared to degrade and were washed from the system within
an hour when exposed to 500V bias at 122 µA. This is probably a result of thermal
decomposition of the lipid bilayer membrane of microsome.
A combination of hydrodynamic and electrokinetic flows was selected for use in
this system. Loading with hydrodynamic flow limited the microsome’s exposure to
potentially damaging high voltages and currents prior to the drug metabolism reaction.
Electrokinetic flow is flexible and easy to implement, so it was used for the voltage and
temperature tolerant steps of washing, substrate loading and analysis.
Two different protocols for operation were compared in this study; the first used
human liver derived microsomes encapsulated in a PEG diacrylate hydrogel for the
biotransformation of verapamil, and the second used non-encapsulated microsomes
which were separated for the analysis region by a hydrogel plug.
Control experiments were conducted, without microsomes or PEG diacrylate
hydrogels, to determine the comparative response of the verapamil and norverapamil (the
synthetic analog of demethylated verapamil) in the microfluidics device. The structure of
verapamil can be seen in Fig. 5-3. A 1:1 mixture of 100µm verapamil and norverapamil
were pumped through the system using the same electrokinetic conditions used for
normal operation and were analyzed in the MS system ( Fig. 6-4 ). Norverapamil

116
provided a much larger ionic signal then verapamil at this concentration. It is
hypothesized this disparity in relative signal is related to norverapamil’s higher ionization
efficiency and not to any verapamil losses within the microfluidic system. This
hypothesis is supported by markedly similar relative signals obtained by standard LDI-
MS (see chapter 5). This data was used to perform a rough estimation of the efficiency of
the metabolism reaction in the following experiments.
Spectra were obtained using the hydrogel encapsulated microsome method but
this method provided poor spectra with large intensity noise peaks in the low mass region
Fig. 6-4: A comparison the response of 100 µm verapamil and 100 µm norverapamil control experiment in microfluidic system.

117
between 0-300 m/z (Fig. 6-5). Little evidence of drug metabolism can be seen in this
spectra. Asmall peak at 441 m/z correlates with the correct mass for demethylation of
verapamil but
is too small to be conclusive evidence of metabolism. Most spectra were heavily
contaminated with PEG diacrylate peaks, making the acquisition of a stable signal very
difficult.
Fig. 6-5: Verapamil spectra from micro drug metabolite system utilizing PEG diacrylate hydrogel encapsulated microsomes. A very small metabolite peak may be seen in thisspectra.
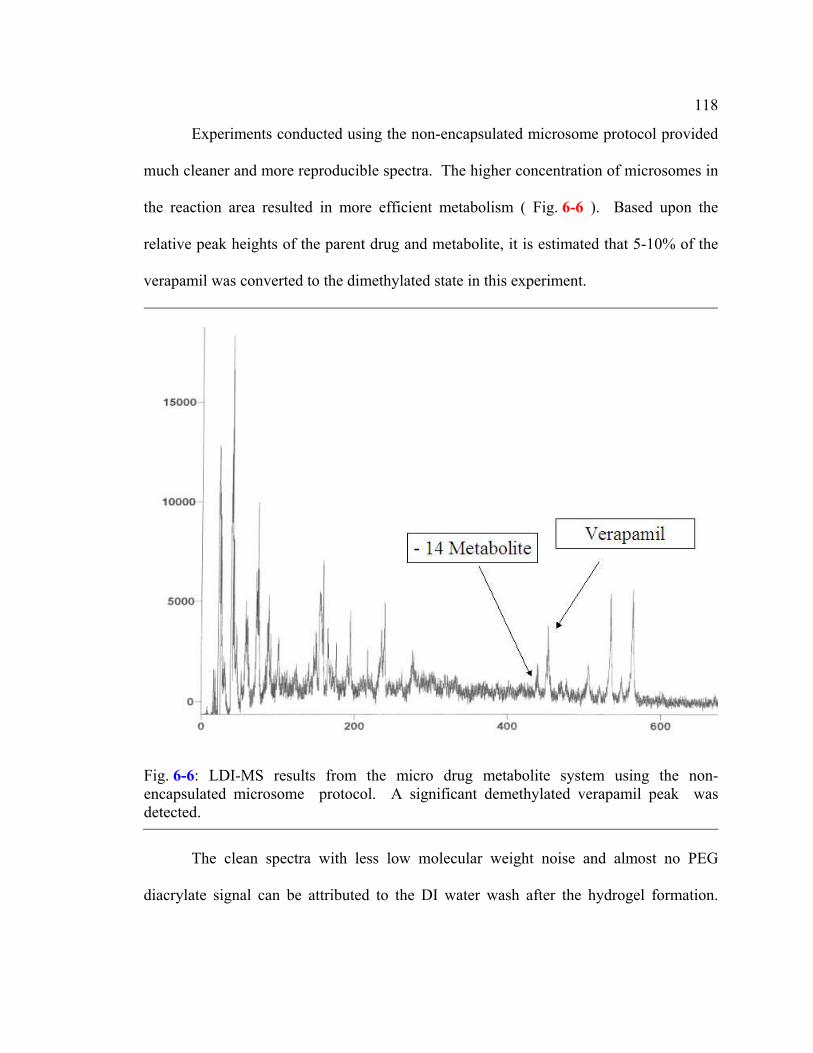
118
Experiments conducted using the non-encapsulated microsome protocol provided
much cleaner and more reproducible spectra. The higher concentration of microsomes in
the reaction area resulted in more efficient metabolism ( Fig. 6-6 ). Based upon the
relative peak heights of the parent drug and metabolite, it is estimated that 5-10% of the
verapamil was converted to the dimethylated state in this experiment.
The clean spectra with less low molecular weight noise and almost no PEG
diacrylate signal can be attributed to the DI water wash after the hydrogel formation.
Fig. 6-6: LDI-MS results from the micro drug metabolite system using the non-encapsulated microsome protocol. A significant demethylated verapamil peak wasdetected.

119
This step cleans the device of the unpolymerized PEG diacrylate and removes salts and
other contaminants that are soluble in an aqueous solvent.
Post acquisition, this data was recalibrated. Then a smoothing and discriminator
algorithm was applied to the raw data set to disregard any data below the threshold value
(Fig. 6-7). The resulting spectra is very clear, and isotopic peaks can be resolved.
However, the absolute intensity of the verapamil and metabolite peaks are lower
compared to the unprocessed data .
Fig. 6-7: Enlargement of the LDI-MS spectra from the non-encapsulated microsome assay, after recalibration and smoothing.

120
While the relative intensity of the demethylated metabolite peak increased with
respect to parent drug, the absolute intensity of the verapamil decreased by half. This
may be a result of increased metabolism of the parent compound resulting a lesser
abundance, but is more likely related variability in losses of the drugs on the side walls of
the channel. A direct comparison with the results presented in chapter 5 cannot be made
as the scale of the reaction in this study is at least two orders of magnitude smaller. The
absolute intensity of the peaks is smaller in microscale devices but the results indicate the
metabolism reaction is nearly as efficient in both cases. The smaller volume of the
reactants and analytes in this system, compared to the method of chapter 5, is likely to be
the cause of the lower absolute peak intensity of the spectra. However, the large signal to
noise ratio allowed these low intensity peaks to be resolved and accurately identified.
This preliminary data supports the results of previous work by Henion’s group
indicating that membrane bound enzymatic reactions, which are traditionally conducted
in an open, free floating environment may be conducted in the confined surface
dominated environment of a µTAS [58] while producing detectable quantities of the
metabolite product.
6.3 Conclusions
This study has shown the feasibility of conducting drug metabolism reactions and
high speed LDI-MS analysis in a high throughput, PDMS chip based format. LDI-MS is
a sensitive and rapid screening method which can analyze compounds in seconds
compared to minutes for the state of the art electrospray ionization techniques. This

121
system will reduce: costly sample consumption, waste by products and cross
contamination issues. This technology coupled to a low cost, high speed, parallel device
array platform can make a near term impact on the drug discovery industry by providing
high content data on drug behavior and structure at early stages of the drug development
cycle.
Future work in the development of this technology will center on improving
sensitivity and streamlining operation. The use of a nanoscale monolithic post array may
alleviate the requirement of using a hydrogel to trap the microsomes removing both a
source of potential contamination and a time consuming step in the operation of the
device. Alternatively, fluorinated hydrogel compositions will be explored which may be
more inert in the LDI-MS anaysis. A long term goal is the incorporation of whole
hepatocyte cells into the device to provide a more biologically complex, in vivo-like
response to drugs. This will provide higher content data on biological response, toxicity
and metabolism.

122

Chapter 7
Conclusions and Recommendations for Future Research
This chapter will summarize the results obtained in the entire course of these
studies, and will state the conclusions that emerge from this research. The majority of the
results come from chapters 3, 5, and 6. These results are briefly revisited in section 7.1.
Section 7.2 summarizes the conclusions which have emerged during the course of this
work. Additionally, section 7.3 will provide recommendations for future research and
development of high throughput, array format, microfluidics based, drug metabolism
reaction and analysis devices.
7.1 Summary of Results
This section summarizes the results of the cell and cell component patterning
studies, the enzymatic drug metabolite analysis by LDI-MS studies and finally the
microfluidics based, drug metabolism reaction and analysis devices.
7.1.1 Cell and cell component patterning
Seven deposited thin films were evaluated to assess their ability to promote the
adhesion and patterning of hepatocytes and PC-12 cells. Of the seven deposited thin

124
films evaluated, in this work, two candidates: columnar/void Si and photocatalyzed PEG
hydrogels displayed the greatest efficacy.
The optimum columnar/void silicon for the promotion of cell adhesion was 10
mtorr pressure film deposited on a Corning 1737 glass substrate. The columnar/void Si
was composed of 10nm polycrystalline Si rods penetrating a continuous void space. The
intercolumnar space is approximately 1nm. The columnar/void material was patterned
using a deposition and lift-off method. This material promoted both cell adhesion and
cell pattern generation on a substrate. The film proved to be effective for generating cell
patterns on either the macro or microscale. These Si films rapidly etched in highly ionic
solutions were only stable for hours. Annealing of these samples at 400oC greatly
improved the stability of materials in SBF but the life-time of the columnar’/void Si
material was still only approximately 24 hours.
Photocatalyzed PEG hydrogel also proved to be effective for patterning not only
cells but also cellular components. The hydrogel material polymerization was catalyzed
by UV light and was patterned using photolithographic techniques. PEG hydrogels are
stable in ionic solutions for at least a week and they are compatible with other micro and
nanofabrication techniques. Hepatocyte cells patterned with this technique did not have
particularly good viability. The majority of the cells in the hydrogel were dead as
determined by trypan blue incorporation. The functionality of the viable cells could not
be assessed because they were encapsulated in the PEG hydrogel.
As a less complex but functional alternative to cell patterning, microsomes, which
are derived from the endoplasmic reticulum portion of hepatocyte cells were patterned
using the above PEG hydrogel method. Microsomes contain the P450 cytochrome

125
enzyme system that is largely responsible for drug metabolism in the liver but do not
possess any of the adhesion molecules which allowed the hepatocytes to interact with
columnar/void Si material. The microsomes do not have the molecular machinery to
replicate and replace damaged proteins, peptides and enzymes. This limits the functional
lifetime of a microsome for enzymatic reactions to approximately 30 minutes. The
microsome/hydrogel patterning system was chosen for use in the development of the
PDMS microfluidic based, drug metabolite sensor because of its ease of patterning and
predictable behavior for drug metabolism.
7.1.2 LDI-MS for drug metabolite identification and quantization
This portion of the research focused on the development of a macroscale
technique of matrix-less laser desorption/ionization mass spectrometry (LDI-MS) for
rapid in vitro screening of drugs and drug metabolites. A 100nm thick deposited thin
film of continuous Ge was used for the LDI substrate. This Ge film material was
optimized to prevent the adsorption of atmospheric contaminants which contribute
significantly to the low molecular weight noise in the mass spectra. The Ge films low
reflectance (~37%) of UV light allowed efficient LDI at laser powers which are
comparable to those required for the desorption of MALDI matrices. The hydrophilic
surface (DI water contact angle of 300) promoted even drop spreading/drying, which
provided a more uniform distribution of the analytes and resulting ion signal.
126
The drug compounds used in this study were dextromethorphan, and verapamil.
Sulphadimethoxine was used as a mass standard but was not metabolized. The
cytochrome P450 enzyme, which is a membrane-bound (water insoluble) enzymatic
system responsible for the biotransformation of drugs and other compounds enzymatic
metabolism of these compounds was carried out using liver derived human microsomes.
The dextromethorphan and verapamil were metabolized by the P450 cytochrome enzyme
system in macroscale quantities. The metabolite product and parent drug peaks were
detected in significant ion yields using this technique.
The spectra obtained from this continuous, Ge, thin film material system were
considerable less noisy than the spectra obtained from similar experiments using a
deposited columnar/void Si film as the LDI substrate. The non-porous nature of these
films reduces the adsorption of atmospheric contaminants providing optimum
performance for small molecule detection
7.1.3 Microscale, cell based biosensor for high throughput in vitro drug metabolism
This portion of the research studies the feasibility of performing enzymatic
reactions in a chip-based microfluidic format coupled directly with laser desorption mass
spectrometry detection. The cytochrome P450 enzymes system was used for enzymatic,
drug metabolism. Human derived, liver microsomes, which are endoplasmic reticulum
derived vesicles, provide the source of the enzyme for drug metabolism. The
microsomes are patterned in-situ, in the microfluidics system, using the polymerization of
a photocatalyzed PEG hydrogel/microsome solution. The PDMS microfluidic system

127
was fabricated using the microscale casting procedure described in chapter 4. A
deposited Ge thin film was used for the LDI-MS analysis of the drug metabolism
reaction.
Two protocols for the operation of the device were compared in this section. The
first method encapsulated the microsomes in a PEG hydrogel in the reaction area of the
device. The second method allowed the microsomes to remain free floating in solution,
but created a hydrogel plug in the outlet channel to separate the reaction region from the
LDI-MS analysis region. The second method provided more efficient drug metabolism
and had less contaminant related noise. The parent drug compound of verapamil and its
demethylated metabolite provided a significant ion signal compared to the background
noise. When compared to the macroscale technique described in chapter 5, the smaller
volumes of reactants and analytes in this system resulted in a lower absolute peak
intensity of the spectra. A large signal to noise ratio allowed these low intensity peaks to
be resolved and accurately identified.
7.2 Conclusions
The goal of this thesis was to develop a laser based, matrix free, desorption and
ionization mass spectrometry technique in a microscale array format that would have
immediate application for drug and drug metabolite studies. This study also had a
broader overriding goal contributing to the body of knowledge of cell patterning and
microfluidic systems on a chip research. The research explored novel cell patterning
techniques and biochemical sensing devices utilizing organic and inorganic low
128
temperature deposited thin films. Specifically, this research sought to fabricate a
microscale, cell based, device for drug metabolism testing using novel deposited thin
films. This device was designed to identify and quantify drugs and associated metabolite
products.
A system utilizing liver derived microsomes and photocatalyzed PEG hydrogels
can be used to pattern functional cytochrome p450 enzymes in situ, in PDMS
microfluidic devices. This system can then be used to biotransform drug molecules by
enzymatic reaction. The metabolism products of the reaction can be identified and
quantified by direct LDI-MS from the surface of chip.
This study has shown the feasibility of conducting drug metabolism reactions and
high speed LDI-MS analysis in a high throughput, PDMS chip based format. LDI-MS is
a sensitive and rapid screening method which can analyze compounds in seconds
compared to minutes for the state of the art electrospray ionization techniques. A
microscale based system offers the advantages of the reduction of: costly sample
consumption, waste by products and cross contamination issues. This technology
coupled to a low cost, high speed, parallel device array platform can make a near term
impact on the drug discovery industry by providing high content data on drug behavior
and structure at early stages of the drug development cycle.

129
7.3 Recommendations for Future Research
This thesis demonstrated the feasibility of fabricating a low cost, high yield µTAS
for enzymatic based drug metabolism. Although this work has been largely successful,
the fabrication and operation of this device is constrained by several factors. This
systems dependence on microsomes for enzymatic metabolism limits the range of assays
that can be conducted and content of the data which can be derived from those assays.
Developing a technique for localizing whole, functional cells in the µTAS would greatly
expand the types of biotransformation assays that could be conducted and increase the
complexity of the data resulting from the assays.
The use of a photocatalyzed hydrogel for patterning is a complex operational step
and also introduces a great potential source of contamination, during both the chemical
reaction and analysis phase. Nanoscale monolithic posts fabricated into the microfluidics
system would be a more suitable alternative for localizing cell components and separating
the reaction and analysis regions.
The incorporation of an on chip resistive heating element and thermocouple
would allow for more precise control of the temperature in the reaction chamber.
Potentially providing for a higher efficiency of the enzymatic reactions than was achieved
in this study.
Further research into LDI capable surfaces may yield materials which are
selective for certain analyte classes or expand the useful mass range of direct LDI-MS.
Both of these advances could open new application areas in microscale, automated
proteomic and genomic analysis.

Bibliography
1. D. Jung, R. Kapur, T. Adams, K. Giuliano, M. Mrksich, H. Craighead, D. Taylor Topographical and Physiochemical Modification Of Material Surface to Enable Patterning of Living Cells, Critical Reviews in Biotechnology, 21, 111 – 154, 2001.
2. Hornyak T. J., Hayes D. J., Chiu L. Y., Transcription Factors in Melanocyte Development: Distinct Roles for Pax-3 and Mitf, Mechanisms of Development, 101 (1-2): 47-59 2001.
3. Murphy W. L., Mercurius K., Koide S., Mrksich M., Substrates for Cell Adhesion
Prepared via Active Site-Directed Immobilization of a Protein Domain, Langmuir Letters, December, web publication, 2003.
4. Taylor A., Rhee S. W., Tu C, Cribbs D. H., Cotman C., Jeon N. L., Microfluidic
Multicompartment Device for Neuroscience Research, Langmuir, August, web publication, 2002.
5. Hemmila L. A., Hurshainen, P., Novel Detection Strategies for Drug Discovery, Drug Discovery Today, 7, S150-S156, 2002.
6 Altendorf, E.; Zebert, D.; Holl, M.; Vannelli, A.; Wu, C. C.; Schulte, T. In
Proceedings of Micro Total Analysis Systems 1998, Kluwer Academic Publishers: Dordrecht, 73-76, 1998..
7. Kandel E., Schwartz J, Jessel T., Principles of Neural Science 3rd Edition,
Appelton and Lange, East Norwalk, Connecticut, 1991.
8 Bhatia S., Microfabrication in Tissue Engineering and Bioartificial Organs,
Kluwer Academic Publishers, Boston, Mass, 1999.
9. Houseman B., and Mrksich M., The Microenvironment of Immobilized Arg-Gly-
Asp Peptides is an Important Determinant of Cell Adhesion, Biomaterials, 22, 943-955, 2001.

131
10 M. Powers, Domansky K., Kalezi A., Capitano A., Kurzwaski P., Wack K., Stoltz D., Kamm R., Griffith L. , A microfabricated array bioreactor for perfused 3D liver culture”, Biotechnology and Bioengineering, 78, 257-269, (2002).
11 Rosenberg M., Cell guidance by alterations in monomolecular films, Science,
139, 411, 1963.
12 Wojiak-Stothard B., Curtis A., Monaghan W., McGrath M., Sommer I.,
Wilkinson C., Role of cytoskeletal elements in the reaction of fibroblasts to multiple grooved strata, Cell Motility and Cytoskeleton, 31, 147-158, 1995.
13 Ivanova O., Margolis M., Nature, 242, 200, 1973.
14. Ruoslahti E, RGD and other Recognition Sequences for IntegrinsAnnual Review
of Cell and Developmental Biology, 12, 697-715, 1996.
15. Lewandowska K., Balachander N., Sukenik C., Culp L., Modulation of Fibronectin Adhesive Functions for fibroblasts and neural cells on chemically derivatized substrata, , Journal of Cell Physiology, 141, 334-345, 1989.
16. Turner S., Kam L., Issacson M., Craighead H., Shain W., Turner J., Cell
Attachment on Silicon Nanostructures, Journal of Vacuum Science Technology B, 15, 2848, 1997.
17. Turner A., Dowell N., Turner S., Craighead H., Shain W., Attachment of
Astroglial Cells to Microfabricated Pillar Arrays in Different Geometries, Biomaterials, 21, 430-442, 2001.
18. Unpublished data, Dan Hayes, (2002).
19. Chen C., Mrksich M.,, Haung S.,, Whitesides G., Ingber D., Micropatterned
Surfaces for Control of Cell Shape, Position, and Function, Biotechnology Progress, 14, 356-363, 1998.

132
20. Bhatia S., Balis U., Yarmush M., Toner M., Microfabrication of Hepatocyte/Fibroblast Co-cultures: Role of Homotypic Cell Interactions, Biotechnology, 14, 378-387, 1998.
21. Brock A., Chang E., Ho C., LeDuc P., Jiang X., Whitesides G., Ingber D.,
Geometric Determinants of Directional Cell Motility Revealed Using Microcontact Printing, Langmuir, Web Publication , 2003
22. W. Koh, A. Revzin, M. Pishko, Poly(ethylene glycol) Hydrogel Microstructures Encapsulating Living Cells, Langmuir, Web Publication, 2002.
23. Busch K., Desorption Ionization Mass Spectrometry, Journal of Mass Spectrometry, 30, 233-240, 1995.
24. Wei J., Buriak J., Siuzdak G., Desorption-Ionization Mass Spectrometry on
Porous Silicon, Nature, 399, 243-246, 1999.
25. Craighead H.G., James C. D., Turner A. P., Chemical and topographical
patterning for directed cell attachment, Current Opinion in Solid State and Material Science, 5, 177-184, 2001.
26 Lee J. H., Jung H.W, Kang I., Lee H.B., “Cell behavior on polymer surfaces with
different functional groups,” Biomaterials, vol. 15, pp. 705–711, 1994.
27 van Kooten T. G., Schakenraad J. M., van der Mei H. C., Busscher H. J.,
“Influence of substratum wettability on the strength of adhesion of human fibroblasts,” Biomaterials, vol. 13, pp. 897–904, 1992.
28 Curtis A. S. G, Wilkinson C., Wojciak-Stothard B,, “Accelerating cell
movement,” Cell. Eng., vol. 1, pp. 35–38, 1995.
29. Hornyak T. J., Hayes D. J., Ziff E. B., Cell-density-dependent regulation of expression and glycosylation of dopachrome tautomerase/tyrosinase-telated protein-2, Journal of Investigative Dermatology, 115 (1): 106-112, 2000.
30. Messier R., Venugopal V. C., Sunal P. D., Origin and Evolution of Sculptured Thin Films, Journal of Vacuum Science and Technology A, 18 (4): 1538-1545, 2000.
31. Murarka A. P., Metallization Theory and Practice for VLSI and ULSI, Butterworth-Heinemann, MA, 188, 1993.

133
32. Alberts B., Bray D., Lewis J. Raff M., Roberts K., Watson J., The Cell 3rd edition, Garland Publishing, London, 721-734, 1994.
33. Kalkan A. K., Bae S., Li H., Hayes D. J., Fonash S. J., Nanocrystalline Si Thin
Films with Arrayed Void-Column Network Deposited by High Density Plasma, Journal of Applied Physics, 88 (1), 555-561, 2000.
34. Koh W., Itle L., Pishko M. V., Molding of Hydrogel Structures to Create Multi-phenotype Cell Culture Arrays; Analytical Chemistry, Web Publication, September, 2003.
35. Clarke A., Blake T. D., Carruthers K., Woodward A., Spreading and Imbibition of
Liquid Droplets on Porous Surfaces, Langmuir, Web publication, 2002.
36. Freshney I., Culture of Animal Cells 4th Ed., Wiley-Liss, New York, NY, 9-16, 1994.
37. Yuan C., Shiea J., Sequential Electrospray Analysis using Sharp Tip Channels Fabricated on a Plastic Chip, Analytical Chemistry, 73,1080-1083, 2001
38. Baeumner A. J., Schlesinger N. A., Slutzki N. S. Romano J., Lee E.. Montagna R.
A., Biosensor for Dengue Virus Detection: Sensitive Rapid and Serotype Specific, Analytical Chemistry, 74(6); 1442-1448, 2002.
39. Cooper J. W., Chen J., Li Y., Lee C., Membrane-Based Nanoscale Proteolytic
Reactor Enabling Protein Digestion, Peptide Separation, and Protein Identification Using Mass Spectrometry, Analytical Chemistry, 75(5); 1067-1074, 2003.
40. J.C. McDonald, D.C. Duffy, J.R. Anderson, D.T. Chiu, H. Wu, O.J. Schueller, G.Whitesides, Fabrication of microfluidic systems in poly(dimethylsiloxane), Electrophoresis, 21, 27-40, 2000.
41. J. Oakey, J. Allely, D. W. M. Marr, Laminar-Flow-Based Separations at the
Microscale, Langmuir, A-D, 2002 42. Folch, A.; Ayon, A.; Hurtado, O.; Schmidt, M. A.; Toner,M, Molding of deep
poly(dimethylsiloxane) microstructures for microfluidics and biological applications. Transpotation. ASME, 1999, 121, 28-34.
43. Koch M., Evans A., Brunnschweiler A., Microfluidic Technology and Applications Research Studies Press, UK, 2000.

134
44. Pohl, H. A, Dielectrophoresis, Cambridge University Press, Cambridge UK, 1978.
45. Personal communication with Dr. Daniel Weston, Schering-Plough Corporation, March, 2002.
46. Gibson G. G., Skett P.,. Introduction to Drug Metabolism. Nelson Thornes, London, 2001.
47. Weinberger, S.R., Boschetti, E., Santambien, P., Brenac, V., Surface-enhanced laser desorption-ionization retentate chromatograph mass spectrometry (SELDI-RC-MS): a new method for rapid development of process chromatography conditions, Journal of Chromatography B, 782, 307-316, 2002.
48. Voivodov, K.I., Ching, J., Hutchens, T.W., Surface arrays of energy absorbing polymers enabling covalent attachment of biomolecules for subsequent laser-induced uncoupling/desorption, Tetrahedron Letters, 37, 5669-5672, 1996.
49. Weston D. J, Clarke N., Cox K., Korfmacher W., Perez J., Tyldesley R., Preece
S., Drug Metabolite Characterization by MALDI/TOF-MS, Poster, ASMS, Chicago, 2001.
50. Cuiffi J., Hayes D., Fonash S. J., Brown K., Jones A., Desorption-Ionization Mass
Spectrometry Using Deposited Nanostructured Silicon Films, Analytical Chemistry, 73, 1292-1295, 2001.
51. Ulman A., Formation and Structure of Self-Assembled Monolayers, Chemical
Reviews, 98, 1533-1554, 1996. 52. Cuiffi J. D., Hayes D., Fonash S. J., Drug Compound Molecular Weight Screening
using Matrix-Less Laser Desorption Mass Spectrometry on Deposited Non-Porous Thin Films, Proceedings of the 51st Conference on Mass Spectromtry and Allied Topics, June 8-12, Montreal, 2003.
53. Weston D. J, Clarke N., Cox K., Cuiffi J. D., Hayes D., Fonash S. J., ., Perez J.,
Major H., Preece S., “Rapid Drug Metabolite Screening by Non-Matrix Laser Desorption and MALDI/TOF-MS,” Proceedings of the 50th ASMS Conference on Mass Spectrometry and Allied Topics, Orlando, Florida, June 2-6, 2002.
54. Park S., Chung T. D., Kim H. C., Nonenzymatic Glucose Detection Using Mesoporous Platinum, Analytical Chemistry, 75(13); 3046-3049, 2003.
55. Wang J., Iba´n˜ez A., Chatrathi M. P. Escarpa A., Electrochemical Enzyme
Immunoassays on Microchip Platforms, Analytical Chemistry, 73(21); 5323-5327, 2001.

135
56. Cheng S B., Skinner C. D., Taylor J., Attiya S., Lee W., Picelli G., Harrison D. J., Development of a Multichannel Microfluidic Analysis System Employing Affinity Capillary Electrophoresis for Immunoassay, Analytical Chemistry, 73(7); 1472-1479, 2001.
57. Reyes D. R., Lossifidis D., Auroux P. A., Manz A., Micro Total Analysis
Systems. 1. Introduction, Theory, and Technology, Analytical Chemistry, 2002. 58. Benetton S., Kameoka J., Tan A., Wachs T, Craighead H., Henion J. D., Chip-
Based P450 Drug Metabolism Coupled to Electrospray Ionization-Mass Spectrometry Detection Analytical Chemistry, 75(23); 6430-6436, 2003.

VITA
Daniel J. Hayes
Education Ph. D, The Pennsylvania State University, Engineering Science and Mechanics May 2004
Bachelor of Science, The Pennsylvania State University, General Science Major/Life Science Focus, May 1997
Professional Experience
Research Assistant, The Penn State Nanofabrication Facility, August 99-May 04 Research in the design and fabrication of micro total analysis systems, micro chemical reactors, in-vivo micro diagnostic devices and cell based virtual toxicity devices.
Publication and Posters
Hornyak TJ, Hayes DJ, Chiu LY, et al. Transcription factors in melanocyte development: distinct roles for Pax-3 and Mitf, MECH DEVELOP 101 (1-2): 47-59, MAR 2001
Cuiffi JD, Hayes DJ, Fonash SJ, et al. Desorption-ionization mass spectrometry using deposited nanostructured silicon films, ANAL CHEM 73 (6): 1292-1295, MAR 15 2001
Hornyak TJ, Hayes DJ, Ziff EB Cell-density-dependent regulation of expression and glycosylation of dopachrome tautomerase/tyrosinase-telated protein-2, J INVEST DERMATOL 115 (1): 106-112, JUL 2000
Kalkan AK, Bae SH, Li HD, et al. Nanocrystalline Si thin films with arrayed void-column network deposited by high density plasma, J APPL PHYS 88 (1): 555-561, JUL 1 2000
Hornyak TJ, Hayes DJ, Ziff EB Pax-3 as a proliferation factor for developing murine melanocytes, J INVEST DERMATOL 112 (4): 105, APR 1999
Weston DJ, Grotz DE, Kathleen Cox A, et al. Rapid Drug Metabolite Screening by Non-Matrix Laser Desorption and MALDI/TOF-MS, Poster ASMS, 2002
Hayes DJ, Cuiffi JD, Carter A, et al. Analysis of the Effects of Nanostructured Thin Film Morphology and Surface Chemistry on Cell Adhesion, Poster BioMEMS, Sept 2001
Cuiffi JD, Fonash SJ, Hayes DJ Laser Desorption Mass Spectroscopy Using Thin Film Deposited Nano-Porous Silicon, Talk MRS, Nov 2000
Fonash SJ, Cuiffi JD, Hayes DJ, et al., Nanostructured Silicon for Bio-medical Applications, Invited Talk, SPIE, 2000