
MicroMax - HORIBA 384 v. 2.0 (5 December 2001) 3 Contents Introduction 4 About the MicroMax 4...
70
MicroMax 384 v. 2.0 (5 December 2001) 1 MicroMax 384 Operation Manual Rev. 2 http://www.isainc.com In the USA: Jobin Yvon Inc. 3880 Park Avenue In France: Edison, NJ 08820 Jobin Yvon S.A. Tel: 1-732-494-8660 16-18, rue du Canal Fax: 1-732-549-5157 91165 Longjumeau cedex Germany: 89/46.23.17-0 E-Mail: [email protected] Tel: (33) 1/64.54.13.00 Italy: 2/57.60.30.50 1-800-533-5946 Fax: (33) 1/69.09.93.19 U.K.: 020/204.81.42
Transcript of MicroMax - HORIBA 384 v. 2.0 (5 December 2001) 3 Contents Introduction 4 About the MicroMax 4...

MicroMax 384 v. 2.0 (5 December 2001)
1
MicroMax 384
Operation Manual
Rev. 2
http://www.isainc.com
In the USA: Jobin Yvon Inc. 3880 Park Avenue In France: Edison, NJ 08820 Jobin Yvon S.A. Tel: 1-732-494-8660 16-18, rue du Canal Fax: 1-732-549-5157 91165 Longjumeau cedex Germany: 89/46.23.17-0 E-Mail: [email protected] Tel: (33) 1/64.54.13.00 Italy: 2/57.60.30.50 1-800-533-5946 Fax: (33) 1/69.09.93.19 U.K.: 020/204.81.42

MicroMax 384 v. 2.0 (5 December 2001)
2
Copyright © 2001 by Jobin Yvon, Inc.
All rights reserved. No part of this work may be repro-duced or transmitted in any form by any means, includ-ing electronic or mechanical, photocopying and re-cording, without prior written permission from Jobin Yvon, Inc. Requests for permission should be requested in writing.
Information in this manual is subject to change without notice and does not represent a commitment on the part of the vendor.
Part Number 81051

MicroMax 384 v. 2.0 (5 December 2001)
3
Contents Introduction....................................................................4
About the MicroMax.............................................................................. 4
Symbols used in this manual ................................................................ 4
Requirements & Installation................................................5
Requirements ....................................................................................... 5
Overview of installation......................................................................... 5
Installation............................................................................................. 6
Software operation ......................................................... 24
DataMax applications specifically for the MicroMax............................. 24
Data collection .................................................................................... 31
Daily Calibration Verification............................................. 47
Tutorials ..................................................................... 48
Introduction......................................................................................... 48
Tutorial 1: Full-spectrum analysis ....................................................... 49
Tutorial 2: Constant Wavelength Analysis .......................................... 55
Additional functions not used in the tutorials....................................... 61
Care of Fiber-Optic Cables ................................................ 64
Troubleshooting .................................................................................. 64
Care of the bifurcated cable................................................................ 64
Storage....................................................................... 65
MicroMax ............................................................................................ 65
F-3000 fiber-optic adapter and cables ................................................ 65
Appendix ..................................................................... 66
Computer requirements ...................................................................... 66
Software requirements........................................................................ 66
Physical specifications........................................................................ 66
Electrical specifications....................................................................... 66
Fiber-optics’ specifications.................................................................. 67
Index.......................................................................... 68

MicroMax 384 v. 2.0 (5 December 2001) Introduction
4
Warning:
Note:
Introduction About the MicroMax 384
The MicroMax 384 is a microwell-plate reader able to accept plates with up to 384 wells, and connect to FluoroMax® or Fluorolog® spectrofluorometers. MicroMax 384’s high speed allows it to scan completely a 96-microwell plate in less than one minute. By moving the microwell plate through stationary optics, the MicroMax 384 insures high sensitivity, excellent accuracy, and high reproducibility. Light from the excitation and emission monochromators is carried via a fiber-optic bundle to and from the MicroMax 384, thus the user may scan with the main spec-trofluorometer and select any excitation and emission wavelength pair for intensity measure-ments. All control of the MicroMax 384 is automated through DataMax software; custom selec-tion of microwells on the plate is possible through the software.
Symbols used in this manual Certain symbols are used throughout the text for special conditions when operating the instruments:
A hazardous condition exists, or danger exists that could damage the equipment. Jobin Yvon Inc. is not responsible for damage arising out of improper use of the equipment.
General information is given concerning operation of the equip-ment.

MicroMax 384 v. 2.0 (5 December 2001) Requirements & Installation
5
Requirements & Installation Requirements
Physical requirements ● Within 0.75 m of the spectrofluorometer sample compartment ● Allow 10" (25 cm) height minimum including the MicroMax 384, to account for fiber op-
tics. ● Requires F-3000 fiber-optic adapter accessory
Computational requirements ● Dedicated serial COM port ● DataMax software ● Windows™ 95 or higher ● 973005 or equivalent PC computer
Overview of installation 1 Unpack and inspect the components.
2 Read this manual.
3 Install the F-3000 adapter on the spectrofluorome-ter.
4 Assemble the MicroMax 384 and its accessories.
5 Install the software (only if the MicroMax was purchased separately).
6 Calibrate and align the F-3000 adapter.
7 Calibrate and align the MicroMax.

MicroMax 384 v. 2.0 (5 December 2001) Requirements & Installation
6
Installation 1 Unpack and inspect all components.
a The following MicroMax 384 components should be included:
Quantity Description Part Number
1 MicroMax 384 microwell plate reader
1 MicroMax 384 Operation Manual 81051
1 AC power cord 98015
1 RS-232 communication cable 97133
1 RS-232 female-9-pin-to-male-25-pin adapter 97134
1 Bifurcated fiber-optic cable, 1 m long 650025
1 Lens assembly for fiber-optic cable 650026
1 Fiber-optic interface for the spectrofluorometer (sold separately from the MicroMax 384)
F-3000
1 3.5" diskette with calibration offset for all-plate.ini (included only if the MicroMax 384 was purchased separately from the spectro-fluorometer)
b Inspect all the components for signs of damage that may have occurred during transit. If damage is evident, do not continue with the installation. Notify Jobin Yvon Inc. and the shipper at once.
Note: Many public carriers do not recognize claims for con-cealed damage reported later than 15 days after delivery. Fora shipping damage claim, inspection by the carrier agent nor-mally is required. Therefore, the original packing materialshould be kept as evidence. While Jobin Yvon Inc. is not liablefor damage occurring during transit, the company will extendevery effort to aid and advise.

MicroMax 384 v. 2.0 (5 December 2001) Requirements & Installation
7
2 Read this instruction manual thoroughly before pro-ceeding to install the MicroMax 384.
3 Install the F-3000 fiber-optic adapter on the spectro-fluorometer.
a Be sure that the MicroMax 384, host computer, and spectrofluorometer are all switched OFF.
b Open the lid of the MicroMax 384 and remove the white plastic rectangular plate. This plastic plate was used to prevent the base from moving during shipping.
c Remove the existing sample mount from the spectrofluorometer. Save the two brass thumb screws for mounting the F-3000 adapter.
d Insert the F-3000 fiber-optic adapter into the spectrofluorometer’s sample compartment. One mirror should face the excitation monochromator, and the other should face the emission monochromator.
e Secure the base plate by using two brass thumb screws. The lens and baffle should be closer to the excitation monochromator.
f
g Remove the plastic shipping caps from the fiber-optic cable’s ferrules.
Warning: Operating the MicroMax 384 without re-moving the white plastic rectangular plate can dam-age the MicroMax 384!
Remove the 1⅜"-diameter (3.5-cm-diameter) plastic plug from the front of the spectrofluorometer’s sample compartment. If there are any threaded plugs or set screws in the two adjacent mounting holes, remove them as well.

MicroMax 384 v. 2.0 (5 December 2001) Requirements & Installation
8
h Thread the two slit-ended fiber bundles through the hole in the sample compartment. Insert the fiber bundle labeled “excitation fibers” into the
excitation port,
and then insert the other (unlabeled) fiber bundle into the other port, as shown be-low.
Secure them loosely, with the narrow thumb screws, on the F-3000 adapter, in their respective mounts. Mount the plate and gasket on the outside of the com-partment, as shown in this photograph:
Warning: Avoidtwisting the fiber-optic cables toomuch. Breakageof the glass fibersmay occur withexcessive strain.
gasket (underneath plate)
light-shield plate

MicroMax 384 v. 2.0 (5 December 2001) Requirements & Installation
9
4 Assemble the MicroMax 384 and accessories.
a Place the MicroMax 384 on a level surface near the spectrofluorometer’s sample compartment, so that the fiber-optic bundle reaches the both sample and MicroMax 384.
b Verify that the MicroMax 384 is set for the proper line voltage for your country. The power entry module has a white arrow that indicates the AC voltage set by the factory.
c Connect the AC power cord to the receptacle on the MicroMax 384.
d Attach one end of the RS-232 communication cable to the I/O connector on the MicroMax 384.
Attach the other end of the RS-232 cable to the free COM port on the back of the computer. Use the enclosed 9-pin–25-pin adapter as necessary.
Note: Which COM port chosen depends on the settings in the filemw.ini, described later.

MicroMax 384 v. 2.0 (5 December 2001) Requirements & Installation
10
Warning: Never pull thecable itself—the ferrulemay loosen from thecable. Hold the cable bythe metal ferrules only.
e Insert the combined end of the fiber-optic cable into the lens cell. The cable should reach to the bottom of the cell. Secure the cable to the lens cell by tightening the set screw on the lens cell.
f Insert the lens-cell assembly into the receptacle at the top of the MicroMax so that it is firmly seated. The top of the lens cell should protrude about 1/8" (~2 mm) from the receptacle.
g Tighten the nylon thumbscrew on the lens receptacle. This secures the lens-cell assembly in place.
h Plug the free end of the power cord into a properly-rated AC receptacle.
This is the initial position for alignment.
5 Install the software. (only if the MicroMax 384 was purchased separately from a spectrofluorometer)
a For FluoroMax® users:
i. Find the layout directory on the computer’s hard drive, C:\Datamax\layout.
ii. Find the readme.txt file, which describes the layout file configuration.

MicroMax 384 v. 2.0 (5 December 2001) Requirements & Installation
11
iii. Open readme.txt using Notepad; find the line containing “Fluoromax with Mi-croMax”, and its corresponding layout file. For example, in line 2, it says, “Fluoro-max with MicroMax, Layout2.lay.”
iv. Copy this layout file (e.g., layout2.lay) into the ISA_INI folder, C:\Datamax\ISA_INI.
v. Find the mw.ini file in the folder C:\Datamax\ISA_INI.ini. Read the file using Notepad, and find the paragraph
[COMMUNICATION] TYPE=1 CHAN_NUM=2
CHAN_NUM sets the communications port used by the computer. The default setting is for COM2, i.e., CHAN_NUM=2. Set the appropriate port number. For example, to use COM3, change the CHAN_NUM to CHAN_NUM=3.
vi. Insert the 3.5" diskette sent with the MicroMax 384 into the computer. From the diskette, copy the allplate.ini file into C:\Datamax\ISA_INI\ to replace the original allplate.ini file. This step enters the calibration data.
b For Fluorolog® users:
Contact Spex® service to get the layout file to operate the MicroMax. With the layout file, continue as for part (a) above, steps (iv) through (vi).
6 Calibrate and align the F-3000 adapter. a Be sure that the DataMax software is properly installed on your computer. Turn
on the MicroMax 384 using its power switch.

MicroMax 384 v. 2.0 (5 December 2001) Requirements & Installation
12
b From Windows™, start the DataMax software by clicking on the icon. Select the layout for your spectrofluorometer that includes the MicroMax 384. This initializes the system. At the end of the boot-up process, the MicroMax 384 makes a characteristic sound as it resets to the home position. The Instrument Control Center appears.
c Click on the Visual Instrument Setup icon to open the Visual Instrument Setup dialog box.
d Click on this symbol of the MicroMax 384. The Sample Compartment Accessories dialog box appears:
e Click on this Image, and the Plate Reader Control dialog box appears:
Note: The instrument configuration shown may vary, de-pending on the particular accessories.

MicroMax 384 v. 2.0 (5 December 2001) Requirements & Installation
13
Warning: If the mi-crowell plate overlapsthe left or right sidesof the platen, align-ment is impaired.
f Enter home to reset the MicroMax 384 to the home position. Click on the Move button.
g Insert the microwell plate into the MicroMax 384 sample compartment. Insert the plate by first setting the left side in, then the right side.
h Click on this icon to open the Real Time Display dialog box:
i Make sure that the Monos dialog box and the Band Pass dialog box are visible by clicking Options in the toolbar.

MicroMax 384 v. 2.0 (5 December 2001) Requirements & Installation
14
j In the Monos (monochromators) box, set the excitation monochromator to 500 nm (blue-green light) by typing in 500 here.
k Click the EX1 (excitation) button, and set the Band Pass to 5 nm.
Open the shutter.
l Remove the top of the spectrofluorometer’s sample compartment.
m With a dental mirror, check to see that the bright blue-green, slit-shaped beam falls properly on the slit-shaped entrance to the excitation fibers. Reduce the Band Pass slits to 2 nm, and examine the beam, then reduce them to 1 nm and examine the beam. In all cases the beam should fall directly on the fibers:
n If the beam is not in the center, remove the fiber-optic cables and F-3000 adapter, and insert an Allen wrench in the central hole between the mounting screws.
Loosen the front mirror set screw, and adjust the mirror’s left-right position slightly. Loosen the interior mirror set screw, and adjust the mirror’s front-back position slightly. Replace the F-3000 and fiber optics in the sam-ple compartment, and examine the beam again. Repeat this procedure until the beam falls properly on the entrance of the fiber bundle.
o Remove the F-3000,
end of ferrule slit-shaped bundle of fibers
beam of light

MicroMax 384 v. 2.0 (5 December 2001) Requirements & Installation
15
Note: If the F-3000 adapter was purchased with the spectrofluorometer, the mir-rors now should be aligned. If the F-3000 was purchased separately, continuealigning the mirrors below.
and replace it in the sample compartment so that the emission beam now is placed in the excitation-fiber position.
p With the dental mirror, examine the slit-shaped beam as in step m. Make sure that the light falls in the middle of the emission ferrule’s end. Adjust the mirror as in step n as needed. (A later procedure will tune the emission signal-level.)
q Remove the F-3000 adapter, rotate 90° clockwise back to its original position, and fasten it down with the two thumb screws.
r Be sure that the DataMax software is properly installed on the computer.
s Start the spectrofluorometer.
t Turn on the MicroMax 384 using its power switch.
The plate holder moves automatically to the Home position.
u Insert a clean, unused microwell plate containing the sample at the proper volume, i.e., the typical volume for the samples. Jobin Yvon® recommends an initial calibration with 200 µL of 100-nM fluorescein (extinction coefficient ε ~
rotate 90° counter-clockwise,

MicroMax 384 v. 2.0 (5 December 2001) Requirements & Installation
16
80 000) in 0.1-N NaOH in one of the wells of the microplate. In addition, prepare a blank solution of 0.1-N NaOH, and put 200 µL of the blank in another well. The fluorescein gives an absorbance A = 0.008 at 490 nm above the blank.
The following steps assume that fluorescein is the sample used to calibrate and align. Other fluorescent solutions may require different settings.
v Close the sample compartment lid.
w From Windows™, start the DataMax software by clicking on the icon. Select the layout for your spectrofluorometer that includes the MicroMax 384. This initializes the system. At the end of the boot-up process, the MicroMax 384 makes a characteristic sound as it resets to the home position. The Instrument Control Center appears.
x Click on the Visual Instrument Setup icon to open the Visual Instrument Setup dialog box:
y Click on this symbol of the MicroMax 384. The Sample Compartment Accessories dialog box appears:
Note: Be sure to use fluorescein in basic solution. Acidified solutions offluorescein have a low quantum yield, so the spectrofluorometer’s sensi-tivity will be far lower than expected.

MicroMax 384 v. 2.0 (5 December 2001) Requirements & Installation
17
z Click on this Image, and the Plate Reader Control dialog box appears:
aa Enter the position of the sample, e.g., A12, in order to move the MicroMax 384 to that position. Click the Move button to activate the plate’s motion.
bb Click on this icon to
open the Real Time Display dialog box:
cc Click Options to make sure
that the Monos dialog box is visible, the Intensity dialog box is visible, and the “S” signal detector is enabled (in the Intensity dialog box).

MicroMax 384 v. 2.0 (5 December 2001) Requirements & Installation
18
dd In the Monos (monochromators) box, set the excitation monochromator to 485 nm by typing in 485 here.
Set the emission monochromator to 513 nm by typing in 513 here.
Set the excitation and emission Band Pass to 2 nm. Open the excitation shutter.
ee Watch the S (signal) detector output (cps) in the Intensity box. If, at any time during alignment, the signal is greater than 4 × 10⁶ cps (counts per second), reduce the slit widths.
ff Adjust the side set-screw for the emission mirror on the F-3000. This controls the left-right fine rotation of the mirror. Set the position to maximize the signal in the Intensity box.
gg Adjust the front set-screw for the emission mirror. This controls the “pitch” (front-back fine rotation) of the mirror. Set the position to maximize the signal in the Intensity box.
7 The mirrors should now be aligned.
Note: Do not adjust the sig-nal for the excitation mirror. If you have trouble adjust-ing the position of the light beam on the ferrules, or maximizing the signal, con-tact Spex® service.
MicroMax 384 v. 2.0 (5 December 2001) Requirements & Installation
19
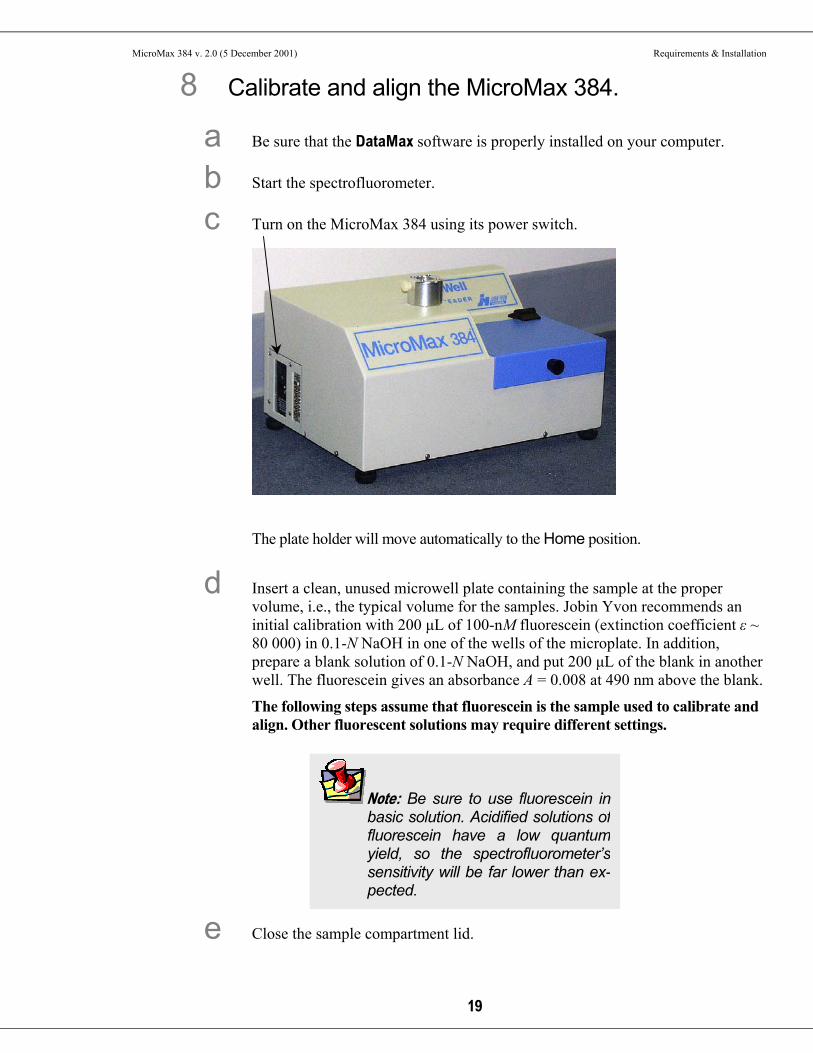
8 Calibrate and align the MicroMax 384. a Be sure that the DataMax software is properly installed on your computer.
b Start the spectrofluorometer.
c Turn on the MicroMax 384 using its power switch.
The plate holder will move automatically to the Home position.
d Insert a clean, unused microwell plate containing the sample at the proper volume, i.e., the typical volume for the samples. Jobin Yvon recommends an initial calibration with 200 µL of 100-nM fluorescein (extinction coefficient ε ~ 80 000) in 0.1-N NaOH in one of the wells of the microplate. In addition, prepare a blank solution of 0.1-N NaOH, and put 200 µL of the blank in another well. The fluorescein gives an absorbance A = 0.008 at 490 nm above the blank.
The following steps assume that fluorescein is the sample used to calibrate and align. Other fluorescent solutions may require different settings.
e Close the sample compartment lid.
Note: Be sure to use fluorescein inbasic solution. Acidified solutions offluorescein have a low quantumyield, so the spectrofluorometer’ssensitivity will be far lower than ex-pected.

MicroMax 384 v. 2.0 (5 December 2001) Requirements & Installation
20
f From Windows™, start the DataMax software by clicking on the icon. Select the layout for the spectrofluorometer that includes the MicroMax 384. This initializes the system. At the end of the boot-up process, the MicroMax 384 makes a characteristic sound as it resets to the home position. The Instrument Control Center toolbar appears.
g Click on the Visual Instrument Setup icon to open the Visual Instrument Setup dialog box:
h Click on this symbol of the MicroMax 384. The Sample Compartment Accessories dialog box appears:
i Click on this Image, and the Plate Reader Control dialog box appears:

MicroMax 384 v. 2.0 (5 December 2001) Requirements & Installation
21
j Enter the position of the sample, e.g., A12, in order to move the MicroMax 384 to that position. Click the Move button to activate the plate’s motion.
k Click on this icon to open
the Real Time Display dialog box:
l Click on Options to make sure
that the Monos dialog box is visible, the Intensity dialog box is visible, and the “S” signal detector is enabled (in the Intensity dialog box).

MicroMax 384 v. 2.0 (5 December 2001) Requirements & Installation
22
Warning: Minimizethe amount oftime the emissionphotomultiplier tube (PMT) is ex-posed to ambientlight, when thesample chambercover is off, to re-duce wear andtear on the PMT.
m In the Monos (monochromators) box, set the excitation monochromator to 485 nm by typing in 485 here.
Set the emission monochromator to 513 nm by typing in 513 here.
Set the excitation and emission Band Pass to 2 nm. Open the excitation shutter.
n Watch the S (signal) detector output (cps) in
the Intensity box. If, at any time during alignment, the signal is greater than 4 × 10⁶ cps (counts per second), reduce the slit widths.
Fiber-optic adapter assembly

MicroMax 384 v. 2.0 (5 December 2001) Requirements & Installation
23
Note: The background count of a microwell plate is large, sosubtracting a blank scan from the sample scan should bedone to give the ultimate sensitivity. Refer to the DataMaxmanual for more information about blank subtraction.
o Loosen the nylon thumbscrew.
Gently adjust the height of the fiber-optic assembly above the microwell plate. As with the other ends of the fiber-optic cable, adjust the level of the fiber-optic adapter assembly until it is positioned at the level of greatest “S” signal.
p With maximum intensity at the “S” detector, tighten the nylon thumbscrew.
The MicroMax 384 is now properly aligned for this sample at its current vol-ume. The procedure need not be repeated unless the sample volume changes.
Note: This alignment of the fiber-optic assembly should beperformed each time a different sample volume is used.

MicroMax 384 v. 2.0 (5 December 2001) Software Operation
24
Software operation DataMax applications specifically for the MicroMax 384
The MicroMax 384 uses four applications within DataMax: ● Visual Instrument Setup
● Real Time Display
● Run Experiment
● Constant Wavelength Analysis

MicroMax 384 v. 2.0 (5 December 2001) Software Operation
25
Visual Instrument Setup
Use Visual Instrument Setup to check the control of the MicroMax 384 via the software.
Click on the MicroMax 384 icon to move the microwell plate to various positions and determine plate type.
Note: All control of the MicroMax 384 is performed through Visual Instrument Setup.

MicroMax 384 v. 2.0 (5 December 2001) Software Operation
26
To move the plate in order to examine a particular well
1 Click on the
MicroMax 384 icon in the Visual Instrument Setup dialog box.
The Sample Compartment Accessories dialog box opens:
2 Click on the rectangular plate icon.
The Plate Reader Control dialog box opens.
3 Enter the coordinate of the well to examine, e.g., C4.
Click the Move button. The MicroMax 384 moves the mi-crowell plate to the desired po-sition.
4 To load or unload a microwell plate, enter home and click the Move button. The MicroMax 384 moves the plate away from the lens cell and underneath the lid for easy removal.

MicroMax 384 v. 2.0 (5 December 2001) Software Operation
27
To enter the type of microwell plate
1 Follow steps 1 and 2 on the previous page to show the Plate Reader Control dialog box:
2 Click on the Properties... button. This brings up the Plate Properties dialog box:
3 Select the appropriate plate type from the list. Scroll up and down the list as needed.
4 Click OK when done.
Note: If the brand name of the 384-well plate is not listed, contactSpex® Fluorescence Applications.

MicroMax 384 v. 2.0 (5 December 2001) Software Operation
28
Real Time Display
Use the Real Time Display dialog box to check and adjust settings of the system before run-ning a scan or experiment. When used with Visual Instrument Setup, the signal response of the sample may be verified, to ensure capture of a useful set of scans.
Open the slits here Control the monochromators here
Monitor detectors’ intensities here.
Adjust slit widths here. Vary integration time here.
Note: The operation of Real TimeDisplay is identical with or withoutthe MicroMax 384 installed. Fordetailed information on the RealTime Display, consult the DataMaxmanual.

MicroMax 384 v. 2.0 (5 December 2001) Software Operation
29
Note: The following scans are not possible with the MicroMax 384: ● Polarization ● Batch ● Temperature Scan ● Dynamic (lifetime) acquisitions ● Multiple sample holders
Run Experiment
The Run Experiment dialog box provides all scanning capability for the spectrofluorometer, with or without the MicroMax 384. Using the MicroMax 384 on any microwell-plate posi-tion or set of positions, all of the following steady-state scans are possible:
● Emission ● Excitation ● Time Base ● Synchronous ● Multigroup

MicroMax 384 v. 2.0 (5 December 2001) Software Operation
30
Constant Wavelength Analysis
Constant Wavelength Analysis allows acquisition of excitation and emission pair data at various sample positions and acquisition modes. Results may be plotted or retained as a ta-ble. Data may be saved as an Excel™ worksheet. Up to 32 wavelength pairs and multiple acquisition modes may be selected. Sample positions may be tagged as blanks, unknowns, and standards. Data manipulation and collection includes:
● Blank subtraction ● Concentration curves ● Correction for lamp intensity ● Variable-time kinetics: acquire scans at different time intervals, and use different
integration times. ● Photobleach mode: Protects light-sensitive samples by closing the shutter during
dead time.
Manipulate files here.
Set exci-tation and emission wave-length pairs here.
Do signal ratioing and time-based ki-netics here. Set up the detector here.

MicroMax 384 v. 2.0 (5 December 2001) Software Operation
31
Data collection There are three recommended methods to collect data with the MicroMax 384 and spectro-fluorometer:
• Experiments on a single well of the microwell plate, with the Run Experiment dialog box.
• Microplate matrix scans, for repetitions of the same experiment across multiple wells of one microplate.
• Constant Wavelength Analysis, to acquire wavelength-pair data.

MicroMax 384 v. 2.0 (5 December 2001) Software Operation
32
To do one experiment on a single well of the microplate:
1 Use Visual Instrument Setup to load and position the sample.
2 Choose Run Experiment.
3 Choose Collect in the Toolbar. This allows definition and acquisition of a single set of data for a particular well on a microplate.

MicroMax 384 v. 2.0 (5 December 2001) Software Operation
33
To repeat the same experiment on multiple wells of one microplate:
1 In the DataMax toolbar, choose Collect:
2 Under Collect, choose MicroPlate Scan....
3 The MicroPlate Matrix Scan dialog box appears:
Choose a prede-termined experi-mental setup with these buttons.
Control a series of experiments here.

MicroMax 384 v. 2.0 (5 December 2001) Software Operation
34
To choose a predetermined experimental setup
Enter the full pathname and filename for an experimental setup here, OR Click on Exp. Browse to browse through a folder of experimental-setup files:
From the list, click on a file to use. It will be highlighted in the space.
Choose the drive and directory in these lists.
List all files of types *.exp or *.*
To preview a file, click on Info.

MicroMax 384 v. 2.0 (5 December 2001) Software Operation
35
To choose an existing scan or to search for specific output files
Click on File Browse to browse through a folder of experimental-setup files. This opens the Select File Name dialog box:
From the list, click on a file to use. It will be highlighted in the space.
Choose the drive and directory in these lists.
List all files of types *.spc or *.*
To preview a file, click on Info.

MicroMax 384 v. 2.0 (5 December 2001) Software Operation
36
To select the type and location of a group of samples in the mi-crowell plate:
Click on Plate Control... to open the MicroPlate Configuration dialog box:
Describe the sample as a blank or an unknown.
Use this section to create a list of the samples to be scanned.

MicroMax 384 v. 2.0 (5 December 2001) Software Operation
37
To load a previously-defined selection of samples to scan:
1 Enter an optional description of the microwell plate in Plate Name/ID.
2 Open the MicroPlate Configuration dialog box as described on the previous page.
3 Click on the Load Set... button. This opens the Read MicroPlate Configuration dialog box.

MicroMax 384 v. 2.0 (5 December 2001) Software Operation
38
4 From the Folders and Drives list, find the appropriate folder in which your set exists.

MicroMax 384 v. 2.0 (5 December 2001) Software Operation
39
To save a previously-defined selection of samples to scan:
1 Open the MicroPlate Configuration dialog box as described two pages back.
2 Click on the Save Set... button. This opens the Save MicroPlate Configuration dialog box:
3 From the Folders and Drives list, find the appropriate folder in which to save your configuration. The file is saved with the extension .tpl.

MicroMax 384 v. 2.0 (5 December 2001) Software Operation
40
To acquire multiple pairs of excitation-emission data: 1 In the Instrument Control Center dialog box, click on the Constant Wavelength
Analysis icon:
2 This brings up the Constant Wavelength Analysis dialog box:
Note: In Constant Wavelength Analysis, there is no way to set the bandpass. Con-stant Wavelength Analysis uses the last setting already defined for the bandpass. Ifthe machine has just been switched on, the bandpass will be defined as 0 nm. To adjust the bandpass, open up the Real Time Display first, set the bandpass,and then open up the Constant Wavelength Analysis dialog box.

MicroMax 384 v. 2.0 (5 December 2001) Software Operation
41
a Set excitation-emission wavelength pairs
1 Type in the excitation-monochromator wavelength (in nm) here.
2 Type in the emission-monochromator wavelength (in nm) here.
3 Continue entering up to 32 wavelength pairs.
4 Edit the wavelength-pair list with these buttons.
5 Choose SB with MicroMax. (“SB” stands for “Sample Box”.)

MicroMax 384 v. 2.0 (5 December 2001) Software Operation
42
b Set the acquisition parameters, including kinetics and photobleach mode:
1 Select S for signal detector, R for reference detector, or enter an expression using S and R.
2 Click Add ›› to enter the acquisition expression into the list.
3 Create a list of acquisition expressions here.
4 Use «Remove to delete unwanted acquisition expressions from the list.
5 (optional) Choose the Kinetics button to create a kinetics experiment or to choose photobleach mode. Click Define... to bring up the Time-based Acquisition Parameters dialog box (see next page).
Note: An example of a list of acquisition pa-rameters would be S (the signal detector) R (the reference detector) S/R (to ratio the signal to the reference)

MicroMax 384 v. 2.0 (5 December 2001) Software Operation
43
To set kinetics and photobleach parameters 1 Choose Kinetics and click Define... as shown on the previous page. The Time-
based Acquisition Parameters dialog box appears:
2 Enter the time cycle for a sequence of scans here.
3 Enter the sequence here.
4 Check this box to close the shutter between scans. This mini-mizes photo-bleaching effects on light sensitive materials.
Note: Up to 23 sequences canbe programmed into thetable.

MicroMax 384 v. 2.0 (5 December 2001) Software Operation
44
c Set the detector parameters (See the DataMax manual for more information.)
1 Set the
integration time for the detector.
2 Choose the standard error, in percent.
3 Enter the maximum number of trials.
d Click on Proceed to Acquisitions. This starts the CWA Data Display, as shown on the next page.

MicroMax 384 v. 2.0 (5 December 2001) Software Operation
45
d (continued) Each cell in the spreadsheet below corresponds to a well in the microwell plate. As the MicroMax scans each well, a data point will be filled in automatically for that well. Go to step (e).
e If the various options in this dialog box are accept-able (see DataMax manual), click on the Start Acq button. This opens the Select Acq Expression To View dialog box, if there are multiple acquisition expressions entered:
f Select the desired acquisition expression to view. Click OK when finished. This opens up the MicroPlate Configuration dialog box (see next page).

MicroMax 384 v. 2.0 (5 December 2001) Software Operation
46
f (continued) In Plate Name/ID, provide an optional description of the microwell plate.
1 Enter the coordinate of each sample to scan here.
2 Tag that sample with the appropriate label (Blank, Unknown, or Standard) here.
3 Add the tagged sample to the list. Notice how the selected samples are highlighted in the schematic of the microwell plate. (Above is shown a 96-well plate.)
See the DataMax manual for more information. g Click on Run Plate to start the run.
The MicroMax 384 begins the multiple-well scan, with its characteristic sound as the plate moves back and forth. As the scan continues, data gradually appear in the CWA Data Display dialog box, until all the selected wells are scanned.

MicroMax 384 v. 2.0 (5 December 2001) Daily Calibration Verification
47
Daily Calibration Verification Jobin Yvon Inc. recommends that the operator verify the calibration of the MicroMax 384 and attached spectrofluorometer at the start of each day.
1 Calibrate the spectrofluorometer Perform the normal calibration recommended for the spectrofluorometer in the spectro-fluorometer user’s manual. For example, check the excitation output with a lamp scan, and then the emission from a water-Raman signal in a cuvette.
2 Install the F-3000 adapter Remove the existing sample holder for cuvettes, and replace it with the F-3000 adapter for the fiber-optic bundles.
3 Calibrate the MicroMax 384 Verify the microwell-plate alignment of the MicroMax 384 as listed in the “Calibrate and Align the MicroMax 384” section of this manual.

MicroMax 384 v. 2.0 (5 December 2001) Tutorials
48
Tutorials Introduction
To help acquaint you with the power offered by MicroMax 384, two tutorials are provided. The first tutorial shows how to scan blanks and unknown samples to obtain a blank-subtracted spectrum. The second tutorial demonstrates the use of Constant Wavelength Analysis to scan a large number of wells in a microwell-plate at a particular wavelength.
Both tutorials assume that the instrument is set up, calibrated, and running, using a 96-well plate.

MicroMax 384 v. 2.0 (5 December 2001) Tutorials
49
Tutorial 1: Full-spectrum analysis The particular sample used in this tutorial is ADIFAB, which is the fluorescent dye acrylo-dan conjugated to intestinal-fatty-acid–binding protein (15 kDa). A 96-well microwell plate is already selected. The ADIFAB is in wells A1 and A2, while blanks are in wells B1 and B2. The remainder of the plate is empty.
1 Choose the Run Experiment icon. This opens the main window in DataMax:
2 Under Collect, choose Experiment.... This opens the Emission Acquisition dialog box, to set up the experiment:

MicroMax 384 v. 2.0 (5 December 2001) Tutorials
50
3 Click on Exp Type... This opens the Select Experiment Type dialog box:
Choose Emission Acquisition; click OK.
Return to the Emission Acquisition dialog box.

MicroMax 384 v. 2.0 (5 December 2001) Tutorials
51
Enter the experimental-scan parameters:
Start the scan at 400 nm Increment the wavelength by 1 nm Use Excitation of 350 nm
End the scan at 550 nm Integration Time per data point of 0.5 s
4 Click on the Signals... button. This opens the Signals dialog box:
5 Choose the S (signal) acquisition parameter. Click OK to close the box, and return to the Emission Acquisition dialog box.

MicroMax 384 v. 2.0 (5 December 2001) Tutorials
52
6 Click the Slits... button. This opens the Slits dialog box:
7 Set the Excitation slit to 10 nm, and the Emission slit to 6 nm. Click OK to return to the Emission Acquisition dialog box.
8 Click on Save to save the experimental setup as s1.exp.

MicroMax 384 v. 2.0 (5 December 2001) Tutorials
53
9 In the Run Experiment main menu, choose Mi-croPlate Scan. This opens the MicroPlate Matrix Scan dialog box:
10 Under Exp. Browse, recall the experimental setup s1.exp.
11 Name the experiment itself test.spc.
12 Click on Plate Control.... This opens the MicroPlate Configuration dialog box:
13 Select wells A1 to B2. Enter A1 in the From: field
Enter B2 in the To: field.
14 Click Add». This adds a new group of four unknowns (samples)—the computer is not told that B1 and B2 are actually blanks—to the list to be scanned. Therefore, there are now four well positions that the MicroMax 384 will scan: A1, A2, B1, and B2.

MicroMax 384 v. 2.0 (5 December 2001) Tutorials
54
15 Click OK to close the MicroPlate Configuration dialog box.
16 Click OK in the MicroPlate Matrix Scan dialog box to scan the wells Automatic display shows all four spectra overlaid together, and automatically named testa1.spc, testa2.spc, testb1.spc, and testb2.spc, based on the wells’ coordinates and the overall experiment’s name.
blanks B1 and B2
samples A1 and A2
Note: To automatically subtract blanks from unknowns, place one blank ineach group with all unknowns associated with that blank. The software thenautomatically subtracts the blank’s signal from each unknown in that group,and does not display the blank.

MicroMax 384 v. 2.0 (5 December 2001) Tutorials
55
Note: If the system has a T-box, an Emission2 Monochromator wavelength is needed for everyEmission 1 Monochromator wavelength, even if un-used. Enter a dummy value—say, 600 nm.
Tutorial 2: Constant Wavelength Analysis In this tutorial, there is a 96-well microwell plate in the MicroMax 384, which contains 15 different solutions in wells F1 to H5. There are 3 different blanks in the wells A1 to C1. The rest of the wells are empty.
1 Open the Con-stant Wavelength Analysis icon.
This brings up the Constant Wavelength Analysis dialog box:
2 Enter the wavelengths to monitor:

MicroMax 384 v. 2.0 (5 December 2001) Tutorials
56
Enter 386 for the first excitation-monochromator wavelength, and 432 for the first emis-sion-monochromator wavelength. Then, underneath 386, enter 386 for the second exci-tation wavelength, and underneath 432, enter 505 for the second emission wavelength. (See note if the system contains a T-box.)
3 Choose SB with MicroMax.
4 Select the signal de-tector
5 Select Detector Pa-rameters
a Choose Acquisition Parameter S
b Click Add» a Set the Integration Time to 2 s
b Allow 3 Maximum Trials
c Make the Standard Error 0.5%

MicroMax 384 v. 2.0 (5 December 2001) Tutorials
57
6 Click on Proceed to Acquisitions. This starts the CWA Data Display, below:
7 Click on the Start Acq button. This opens up the MicroPlate Configuration dialog box (see next page):

MicroMax 384 v. 2.0 (5 December 2001) Tutorials
58
Note: Only one blank is permittedper group of unknowns.
8 Select the samples.
a Select a New Group».
b Choose Blank.
c Enter well A1.
d Click on Add».
e Choose Unknown.
f In the Sample Selection area, enter From: F1 and To: F5.
g Click on Add».
h Select a New Group».
i Choose Blank.
j Enter well B1.
k Click on Add».
l Choose Unknown.
m Enter From: G1 and To: G5.
n Click on Add».
MicroMax 384 v. 2.0 (5 December 2001) Tutorials
59
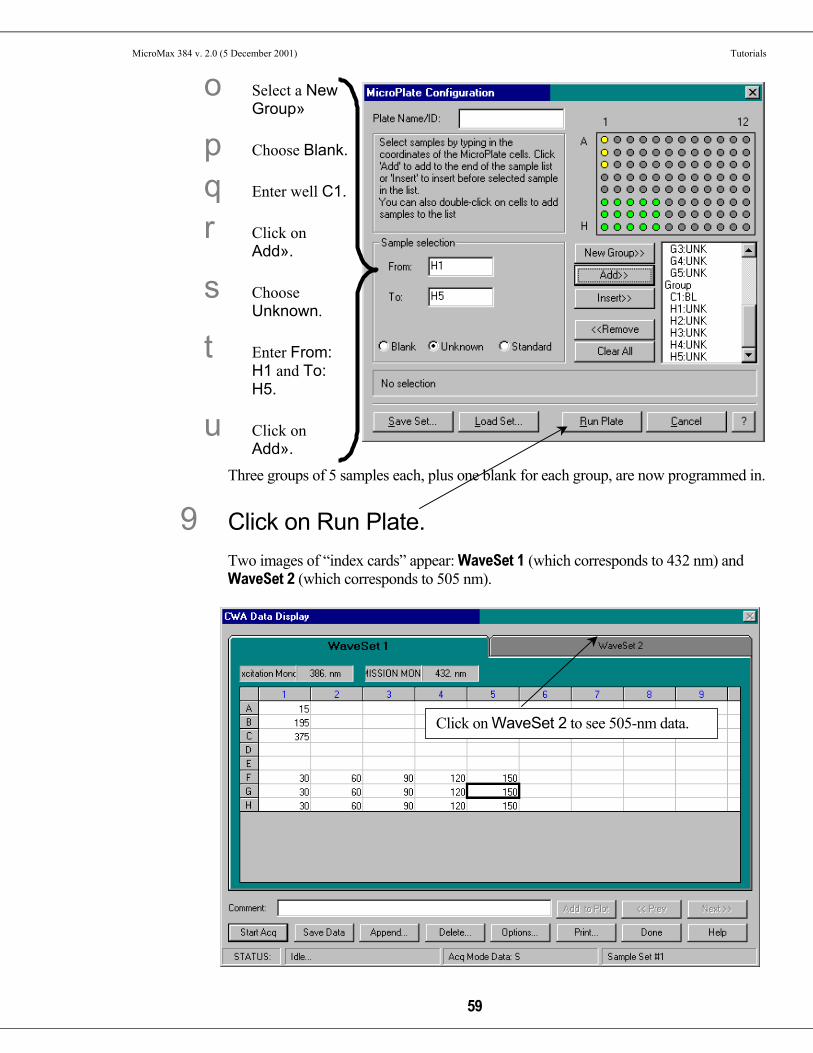
o Select a New Group»
p Choose Blank.
q Enter well C1.
r Click on Add».
s Choose Unknown.
t Enter From: H1 and To: H5.
u Click on Add».
Three groups of 5 samples each, plus one blank for each group, are now programmed in.
9 Click on Run Plate. Two images of “index cards” appear: WaveSet 1 (which corresponds to 432 nm) and WaveSet 2 (which corresponds to 505 nm).
Click on WaveSet 2 to see 505-nm data.

MicroMax 384 v. 2.0 (5 December 2001) Tutorials
60
10 Click on Save Data to save the data. This brings up the Save Data As... dialog box:
The data can be saved as an Excel™ spreadsheet, a CWA file (.cwa) to perform post-experiment analysis, or a text file (.txt).
Here are sample data from the run:
Excel™ Spreadsheet F1 0 1 1000 0
F2 0 1 2000 0
F3 0 1 3000 0
F4 0 1 4000 0
F5 0 1 5000 0
B1 0 1 84500 0
G1 0 1 1000 0
G2 0 1 2000 0
G3 0 1 3000 0
G4 0 1 4000 0
G5 0 1 5000 0
H1 0 1 1000 0
H2 0 1 2000 0
H3 0 1 3000 0
H4 0 1 4000 0
H5 0 1 5000 0
Note: In Excel Spreadsheet and Multi-column Text for-mats, only the active tab is saved. In CWA Data File for-mat, all tabs are saved.

MicroMax 384 v. 2.0 (5 December 2001) Tutorials
61
Additional functions not used in the tutori-als
Append… Append… merges an active, on-screen database with an existing database. For example, a standard curve exists in a file, and new unknowns have just been scanned. These two data-sets can be merged in the Append… function.
This opens the Open dialog box. Find the desired file to append to the existing, active one. Click OK when done.

MicroMax 384 v. 2.0 (5 December 2001) Tutorials
62
Options… Options… creates and fits a standard curve from an active set of standards, and adjusts the display of the spreadsheet on the computer screen. This opens the Data Display Settings dialog box: Create a standard curve in this area Change the view of the spreadsheet in this area

MicroMax 384 v. 2.0 (5 December 2001) Tutorials
63
To run a fit of standard points, check the En-able Fit box.
Choose the type of fit in the Fit Model drop-down list:
Select Acquisi-tion Mode View to display the spreadsheet in terms of signal channels.
Check Auto-scroll Tables to automatically scroll across and down the display as data are re-corded.
Click OK when done.
In View Options, Choose the signal directly from the detectors (Display Raw Detector Data), or use signal algebra (Display Acquisition Mode Data). Check the Display Concentration box to show the abscissa in the standard curve. Display Statistics of the fit in the spreadsheet columns.
To Recalculate the standard curve, check this box.
Under Refer-ence Acq:, choose the signal used as the ordi-nate to fit a stan-dard curve.
Click View Op-tions… to choose which items are shown in the spread-sheet.

MicroMax 384 v. 2.0 (5 December 2001) Care of Fiber-Optic Cables
64
Warning: Never polish the exposedends of the fibers.
Warning: Never pull the cable itself—the ferrule may loosenfrom the cable. Hold the cable by the metal ferrules only.
Warning: Do not expose the ends ofthe cables or the ferrules to aqueoussolutions, especially acids or bases.
Care of Fiber-Optic Cables Troubleshooting
If there is suspicion that the fibers in the bifurcated fiber-optic cable are broken,
1 Hold the single end of the bifurcated cable up to a bright light.
2 View each end of the split side carefully to see that the light is coming though the cable.
Check that nearly all of the fibers are lit up, and that there are few—if any—broken fi-bers.
Care of the bifurcated cable To clean the ends of the bifurcated cable
1 Wet a cotton swab with organic solvent (e.g., acetone).
2 Gently wipe the exposed face of the fibers with the solvent-saturated swab.

MicroMax 384 v. 2.0 (5 December 2001) Storage
65
Storage MicroMax
Simply disconnect the AC power cord and the RS-232 communication cable, remove the sample plates and fiber-optic assembly, and close the lid.
F-3000 fiber-optic adapter and cables Store these in a drawer and cabinet. Cover the open ferrules on the ends of the fiber-optic cables with the plastic shipping caps.

MicroMax 384 v. 2.0 (5 December 2001) Appendix
66
Note: For 24-well (6 × 4), and6-well (3 × 2), considerednon-standard sizes, contactSpex® Fluorescence Service.
Appendix Computer requirements
973005 or equivalent PC computer with RS-232 port
Software requirements Windows™ 9x or NT4 (SP3 or higher)
DataMax 2.2.10
Physical specifications 9" (20.3 cm) deep × 12" (30.5 cm) wide × 7" (17.8 cm) tall. Allow an extra 3" (7.6 cm)
of height for fiber optics.
Compatible with Fluorolog®-3, FluoroMax®-3, Fluorolog®-2, and FluoroMax®-2
Accepts 384-well (24 × 16) and 96-well (12 × 8) plates.
Scans 96 wells in < 1 minute
Typical sensitivity = 25 pM fluorescein with the Fluorolog®-322; 10 nM fluorescein with the FluoroMax®-3.
Electrical specifications Line voltage 110 VAC or 220 VAC
0.5 A at 110 VAC or 0.25 A at 220 VAC
50 or 60 Hz, single-phase
Important
The MicroMax 384 microwell plate reader is designed to comply with the requirements of the Low Voltage Directive 73/23/EEC and the EMC Directive 89/336/EEC, and, as of 1 January 1997, carries the CE marking accordingly. The system was tested using standard (ISA-authorized) components, cables, etc.

MicroMax 384 v. 2.0 (5 December 2001) Appendix
67
Fiber-optics’ specifications Bifurcated-slit-end bundles
Concentric ring combination in cable: outer ring is for excitation; inner ring is for emission collection.
Length = 1 m
Numerical Aperture = 0.12 NA
Wavelength range = covers full range of spectrofluorometers from 250–850 nm. Other wavelength ranges are available.

MicroMax 384 v. 2.0 (5 December 2001) Index
68
Index
A
absorbance · 16, 19 acetone · 64 Acquisition Mode View · 63 acquisition modes · 30 Acquisition Parameter · 56 adapter · 5, 6, 7, 8, 9, 11, 14, 15, 23, 47, 65 Add · 53, 56, 58, 59 Add ›› · 42 Allen wrench · 14, 23 allplate.ini · 6, 11 Append… · 61 Autoscroll Tables · 63
B
Band Pass · 13, 14, 18, 22 blank · 16, 19, 30, 36 Blank · 46, 58, 59 blank subtraction · 30 browse · 34, 35
C
cable · 6, 7, 9, 10, 14, 23, 65, 66, 67 calibration · 11, 15, 19, 47 care · 64 CE · 66 CHAN_NUM · 11 clean · 64 cnts · 18, 22 Collect · 32, 33, 49 COM · 5, 9, 11 computer · 5, 7, 9, 10, 11, 15, 19, 66 concentration curve · 30 Constant Wavelength Analysis · 24, 30, 31, 40, 48, 55 cotton swab · 64 cps · 18, 22 cwa · 60 CWA Data Display · 44, 46, 57
D
damage · 4, 6 danger · 4 Data Display Settings · 62 DataMax · 4, 5, 11, 12, 15, 16, 19, 20, 24, 33, 44, 45, 46, 49,
66 Define · 42, 43 detector · 18, 22, 28, 44
Detector Parameters · 56 directory · 10, 34, 35 diskette · 6, 11 Display Acquisition Mode Data · 63 Display Concentration · 63 Display Raw Detector Data · 63 Display Statistics · 63 drive · 10, 34, 35 Drives · 38, 39
E
EEC · 66 emission · 4, 7, 15, 18, 22, 29, 30, 40, 41, 47, 52, 67 Emission Acquisition · 49, 50, 51, 52 Enable Fit · 63 Excel · 30, 60 excitation · 4, 7, 8, 14, 15, 18, 22, 29, 30, 40, 41, 47, 52, 67 Excitation · 51 exp · 34 Exp Type... · 50 Exp. Browse · 34, 53 Experiment · 49 extinction coefficient · 15, 19
F
F-3000 · 5, 6, 7, 8, 11, 14, 15, 47, 65 fiber optics · 4, 5, 6, 7, 9, 10, 14, 23, 47, 64, 65, 66 File Browse · 35 Fit Model · 63 fluorescein · 15, 16, 19, 66 Fluorolog® · 4, 11, 66 FluoroMax® · 4, 10, 66 Folders · 38, 39
G
gasket · 8
H
home · 12, 13, 15, 16, 19, 20, 26
I
image (of plate reader) · 12, 17, 20 Increment · 51 Info · 34, 35 Installation · 5, 6

MicroMax 384 v. 2.0 (5 December 2001) Index
69
Instrument Control Center · 12, 16, 20, 40 Instrument Setup · 24, 25, 28, 32 integration time · 28, 30, 44 Integration Time · 51, 56 Intensity · 17, 18, 21, 22 ISA_INI · 11
K
kinetics · 30, 42, 43 Kinetics · 42, 43
L
lamp intensity · 30 layout · 10, 11, 12, 16, 20 lens · 6, 7, 10, 26 load · 26, 32, 37 Load Set · 37 Low Voltage Directive · 66
M
Maximum Trials · 56 MicroPlate Configuration · 36, 37, 39, 45, 53, 54, 57 MicroPlate Matrix Scan · 33, 53, 54 Microplate matrix scans · 31 MicroPlate Scan · 33, 53 mirror · 7, 14, 15 monochromator · 4, 7, 14, 18, 22, 28, 41 Monos · 13, 14, 17, 18, 21, 22 Move · 13, 17, 21, 26 multigroup · 29 mw.ini · 11
N
NaOH · 16, 19 New Group · 58, 59 Notepad · 11 Numerical Aperture · 67
O
OK · 45, 61, 63 Open · 61 optics · 4 Options… · 62 organic solvent · 64 output · 18, 22, 35
P
pathname · 34 photobleach · 30, 42, 43
plate · 4, 6, 7, 8, 13, 15, 19, 23, 26, 27, 29, 31, 36, 37, 45, 46, 47, 48, 49, 55, 66
Plate Control · 36, 53 Plate Name/ID · 37, 46 Plate Properties · 27 Plate Reader Control · 12, 17, 20, 26, 27 plates · 65, 66 power cord · 6, 9, 10, 65 preview · 34, 35 Proceed to Acquisitions · 44, 57 Properties · 27
R
R · 42 Raman · 47 readme.txt · 10, 11 Real Time Display · 13, 17, 21, 24, 28 Recalculate · 63 Reference Acq · 63 Remove · 42 Requirements · 5 RS-232 · 6, 9, 65, 66 Run Experiment · 24, 29, 31, 32, 49, 53 Run Plate · 46, 59
S
S · 17, 18, 21, 22, 23, 42, 51, 56 Sample Box · 41 sample compartment · 5, 7, 8, 9, 13, 14, 15, 16, 19 Sample Compartment Accessories · 12, 16, 20, 26 Sample Selection · 58 save · 39, 60 Save · 52 Save Data · 60 Save Data As... · 60 Save MicroPlate Configuration · 39 Save Set · 39 SB with MicroMax · 41, 56 Select Acq Expression To View · 45 Select Experiment Type · 50 Select File Name · 35 sensitivity · 4, 66 service · 11 set screws · 23 setup · 34 shutter · 14, 18, 22, 30, 43 Signals · 51 slits · 14, 18, 22, 28, 52 software · 4, 5, 10, 11, 12, 15, 16, 19, 20, 24, 25, 66 spc · 35 standard · 30 Standard · 46 standard error · 44 Standard Error · 56 Start Acq · 45, 57 Storage · 65 symbols · 4 synchronous · 29

MicroMax 384 v. 2.0 (5 December 2001) Index
70
T
T-box · 56 thumb screws · 7, 8, 10, 15 time base · 29 Time-based Acquisition Parameters · 42, 43 tpl · 39 troubleshooting · 64 Tutorials · 48 txt · 60
U
unknown · 30, 36
Unknown · 46, 58, 59 unload · 26
V
View Options · 63 View Options… · 63 Visual Instrument Setup · 12, 16, 20, 26 voltage · 9, 66
W
Windows · 5, 12, 16, 20