Microfilms - The University of Arizona Campus...
50
THE EFFECT OF AN ACUTE BOUT OF EXERCISE ON SELECTED PULMONARY FUNCTION MEASUREMENTS. Item Type text; Dissertation-Reproduction (electronic) Authors BUONO, MICHAEL JOSEPH. Publisher The University of Arizona. Rights Copyright © is held by the author. Digital access to this material is made possible by the University Libraries, University of Arizona. Further transmission, reproduction or presentation (such as public display or performance) of protected items is prohibited except with permission of the author. Download date 01/06/2018 18:42:52 Link to Item http://hdl.handle.net/10150/183981
Transcript of Microfilms - The University of Arizona Campus...

THE EFFECT OF AN ACUTE BOUT OF EXERCISE ONSELECTED PULMONARY FUNCTION MEASUREMENTS.
Item Type text; Dissertation-Reproduction (electronic)
Authors BUONO, MICHAEL JOSEPH.
Publisher The University of Arizona.
Rights Copyright © is held by the author. Digital access to this materialis made possible by the University Libraries, University of Arizona.Further transmission, reproduction or presentation (such aspublic display or performance) of protected items is prohibitedexcept with permission of the author.
Download date 01/06/2018 18:42:52
Link to Item http://hdl.handle.net/10150/183981

INFORMATION TO USERS
This was produced from a copy of a document sent to us for microfilming. While the most advanced technological means to photograph and reproduce this document have been used, the quality is heavily dependent upon the quality of the material submitted.
The following explanation of techniques is provided to help you understand markings or notations which may appear on this reproduction.
1. The sign or "target" for pages apparently lacking from the document photographed is "Missing Page(s)". If it was possible to obtain the missing page(s) or section, they are spliced into the film along with adjacent pages. This may have necessitated cutting through an image and duplicating adjacent pages to assure you of complete continuity.
2. When an image on the film is obliterated with a round black mark it is an indication that the film inspector noticed either blurred copy because of movement during exposure, or duplicate copy. Unless we meant to delete copyrighted materials that should not have been filmed, you will find a good image of the page in the adjacent frame. If copyrighted materials were deleted you will find a target note listing the pages in the adjacent frame.
3. When a map, drawing or chart, etc., is part of the material being photographed the photographer has followed a definite method in "sectioning" the material. It is customary to begin filming at the upper left hand corner of a large sheet and to continue from left to right in equal sections with small overlaps. If necessary, sectioning is continued again-beginning below the first row and continuing on until complete.
4. For any illustrations that cannot be reproduced satisfactorily by xerography, photographic prints can be purchased at additional cost and tipped into your xerographic copy. Requests can be made to our Dissertations Customer Services Department.
5. Some pages in any document may have indistinct print. In all cases we have filmed the best available copy.
Uni~ Microfilms
International 3[Jll N. IEEf3 rm. ANN /\IH3011, 1'.11 11H10G

8219865
Buono, Michael Joseph
THE EFFECT OF AN ACUTE BOUT OF EXERCISE ON SELECTED PULMONARY FUNCTION MEASUREMENTS
The University of Arizona
University Microfilms
International
PH.D. 1982
300 N. Zeeb Road, Ann Arbor, MI 48106


THE EFFECT OF AN ACUTE BOUT OF EXERCISE ON
SELECTED PULMONARY FUNCTION MEASUREMENTS .
by
Michael Joseph Buono
A Dissertation Submitted to the Faculty of the
COMMITTEE ON ANIMAL PHYSIOLOGY (GRADUATE)
In partial fulfillment of the Requirements For the Degree of
DOCTOR OF PHILOSOPHY
In the Graduate College
THE UNIVERSITY OF ARIZONA
1 982

THE UNIVERSITY OF ARIZONA GRADUATE COLLEGE
As members of the Final Examination Committee, we certify that we have read
the dissertation prepared by Michael Joseph Buono ------------------------------------------------entitled THE EFFECT OF AN ACUTE BOUT OF EXERCISE ON SELECTED
PULMONARY FUNCTION MEASUREMENTS
and recommend that it be accepted as fulfilling the dissertation requirement
for the Degree of Doctor of Philosophy
Date d '
16 /v1.a'l ,Q8'L-Date
Date
Date
Final approval and acceptance of this dissertation is contingent upon the candidate's submission of the final copy of the dissertation to the Graduate College.
I hereby certify that I have read this dissertation prepared under my direction and recommend that it be accepted as fulfilling the dissertation requirement.
I~ Date

STATEMENT BY AUTHOR
This dissertation has been submitted in partial fulfillment of requirements for an advanced degree at The University of Arizona and is deposited in the University Library to be made available to borrowers under rules of the library.
Brief quotations from this dissertation are allowable without special permission, provided that accurate acknowledgment of source is made. Requests for permission for extended quotation from or reproduction of this manuscript in whole or in part may be granted by the head of the major department or the Dean of the Graduate College when in his judgment the proposed use of the material is in the interests of scholarship. In all other instances, however, permission must be obtained from the author.

ACKNOWLEDGMENTS
TO: Big Con, Bess, Phil, Tom R., Tom S .• Mike, Joy. Yuan, Ma,
and Andy who made coming to the lab everyday so much fun.
TO: Drs. Jack H. Wilmore and Fred B. Roby who have taught me
not only by their words, but by their actions. I will
forever be in their debt for the knowledge and friendship
that they lavished upon me. I hope that someday I can
return the favor by passing their wisdom, insights. and
high personal and professional standards, on to the next
generation of exercise physiologists.
TO: My family. Mrs. liB", Dover Joe, and Weas. who's guidance
and support gave me the courage to follow my dreams.
FINALLY: To my best friend and coach, Shelly, who's eyes never dimmed
during the long walk, who's hand was always there during
the trying times, and who's love and encouragement made
everything worthwhile.
i; i

TABLE OF CONTENTS
Page
LIST OF TABLES ..•..••••.••.•...•.•......•......•..•..•.•••..•...•. v
ABSTRACT ..••...•••••...•.•••...•........••......•..•••.•........•. vi
CHAPTER
I NTRODUCTI ON
Revi ew of Literature •.•......•••.•.•••.•...••.••....•. 2 Purpose ••••.••.....•.•...•.•.•...•...•••.•.•...•••...• 6
2 EXPERIMENTAL DESIGN AND METHODOLOGy ••.••..••.••.••••....... 8
Subjects ••.•..•...•...•••••......•.•.•••••••••••...... 8 Methods ....••....•.•.•••.•...•.•..••.••••••••••••.•.•• 8
Transthoracic Electrical Impedance •••••.•.•..••.• 10 Central Blood .Volume Alterations ••••••••••..•..•• 10 Diffusion Capacity of the Lung •..•.•.••••.••..•.• 11 Statistical Analysis ..•..••..••.•••••.••••.•....• 12
3 RESULTS. . . . . • • • • . . . • • • . . • . . • . . . • • . . . . • . • • . . • . • . • • • . • . • . . . .• 13
Study I ....•.......•.••.....•.•..••..•.••••.••..•.•••. 13 Study II .••.••••••••...••••.•••.•.••••..•.••••••.•..•• 13 Study III .•••.•..•.••..•.•••.•.••.••...••.••••.•••••.. 18 Study IV •••.••....••.......•.••..••.•••••••.•••..•..•. 18 Study V .••••.••..••••..••...•.•.•••••.•.•.•••.••..•.•• 24
4 DISCUSSION ..•••..•...•••.••.•.••...•••...••••••.••••••..••. 26
5 SUMMARY. . • . . . . • • • • • . . • . • • • . . • . . . • . . . • . • • • . • • • • • • • • . . • • • • . •. 32
SUMMARY OF TERM ABBREVIATIONS ••••.•.•.••.••••.•...••.•••... 34
LITERATURE CITED ••..•.••.••..•....•••........•.•.•.•..••... 35

LIST OF TABLES
Table Page
1. Selected Physical and Performance Characteristics of Subjects in Study I (N = 11 females) ..................... 14
2. Pre- and Post-Exercise Pulmonary Function Data for Study I (Values are means ~ S.D.) .............................. 15
3. Selected Physical and Performance Characteristics of Subjects in Study II (N = 12 males) ...................... 16
4. Pre- and Post-Exercise Pulmonary Function Data in Study II (Values are means ~ S.D.) ............................. 17
5. Selected Physical and Pey·formance Characteristics of Subjects in Study III (N = 18 males) ..................... 19
6. Pre- and Post-Exercise Measurements in Study III (Values are means ~ S.D.) ................................ 20
7. V02 max and Treadmill Time to Exhaustion in Study IV for the Control, G-Suit, and Venous Occlusion Conditions (Values are means ~ S.D.) ..................... 22
8. Pre- and Post-Exercise Measurement~ in Study IV for the Three Experimental Conditions (Values are means2:.S.D.) ............................................ 23
9. Pre- and Post-Exercise Diffusion Capacity in Study V (Values are means 2:. S.D.) ................................ 25
v

ABSTRACT
A series of five studies were conducted to examine the effect
of exercise on selected pulmonary function measurements. Studies I and
II determined the effect of an acute bout of exercise on various lung
volumes immediately post-exercise and over a 24-hour post-exercise
period. There were significant mean increases of 210 ml (20.6%) and
260 ml (20.8%) in the 5-minute post-exercise residual volume (RV)
measurement for studies I and II, respectively. There also were sig
nificant mean increases of 170 ml (3.4%) and 190 ml (2.7%) in the
5-minute post-exercise total lung capacity (TLC) for studies I and II,
respectively, while vital capacity (VC) remained unchanged. RV and TLC
remained significantly increased over the pre-exercise values through
30 and 15 minutes of recovery, respectively. Studies III through V
were undertaken to determine the physiological mechanism underlying the
responses reported in studies I and II.
In study III, transthoracic electrical impedance (TEl) was
significantly decreased below the pre-exercise value through 30-minutes
of recovery, indicating that there was an increase in thoracic fluid
volume following exercise. However, TEl measurements alone cannot
separate between intra- and extravascular fluid shifts. Therefore,
studies IV and V attempted to identify whether the decrease in TEl and
increase in RV reported in study III were due to intra- or extravascular
fluid shifts. Study IV examined the TEl, RV, and TLC responses before
vi

vii
and following exercise, as central blood volume (CBV) was experimentally
increased via G-suit inflation, and decreased via venous occlusion
tourniquets. The results suggest that RV is relatively insensitive
to intravascular volume shifts within the thorax. Study V determined
and followed the effect of an acute bout of exercise on lung diffusion
capacity (OLco)' 0Lco/VA did not increase significantly following
exercise, suggesting that the decrease in TEl following exercise is
the result of extravascular fluid accumulation.
It was concluded that a sub-clinical pulmonary edema occurs
following exercise. A logical sequence of events based on the results
of studies I through V was proposed as a possible explanation for the
responses of RV and TLC following exercise.

CHAPTER 1
INTRODUCTION
Following a maximal expiration, a certain volume of air remains
in the lungs, i.e. the residual volume (RV). The RV serves an important
physiological function as it allows for uninterrupted gas exchange be
tween the alveoli and the blood throughout the various phases of the
respiratory cycle. Since there is always air in the lungs, oxygen and
carbon dioxide exchange can occur even during a forced expiration, thus
maintaining relatively constant gas tensions in arterial blood.
In recent years, several studies have shown that RV increases
during exercise (10,30) and remains elevated immediately upon completion
of exercise (6,20,28). Although the effect of exercise on RV is well
documented, the physiological mechanisms responsible for the increase
are unclear. Also, none of the previous studies (6,10,20,28,30)
examined the time course of RV as it returned to the pre-exercise value
following exercise.
Therefore, in an attempt to help answer some of the above ques
tions, a series of five different studies were conducted to examine
several aspects of the effect of an acute bout of exercise on RV and
other selected pulmonary function measurements. The five studies repre
sent the collected efforts of over two years of research, with each
preceding study being designed to help answer questions which arose
during the previous one. Hopefully, the five studies represent a
1

logical progression of thought, aimed at addressing several unanswered
questions in the field of exercise physiology.
Review of Literature
During exercise the increased utilization of oxygen and in-
creased production of carbon dioxide impose increased demands on the
respiratory system. These metabolic demands are met by an increased
minute ventilation, tidal volume, breathing frequency, and pulmonary
blood flow. The mechanisms involved in these adaptations have been o
thoroughly studied and have been reviewed by Astrand and Rodah1 (1).
The effect of an acute bout of exercise on post-exercise pulmonary
function measurements, however, have been relatively neglected.
Several studies have shown that RV increases during exercise
2
(10,20) and remains elevated immediately following exercise (6,20,28).
Hanson et a1. (10) found a mean increase of 22% and 3.4% in RV and total
lung capacity (TLC), respectively, during level walking (3 mph) on a
treadmill. In a more recent study, Stubbing et al. (30) measured RV
and TLC during progressive cycle ergometry. Measurements were recorded
at rest and then at workloads starting at 200 kpm·min-1, to a maximum
of 800 kpm.min-1. The RV increased 5.9%, 8.6%, 9.5%, and 15.4% at the
200, 400, 600, and 800 kpm.min-1 workloads, respectively. The mean
exercise TLC values were not significantly different from the pre-
exercise values, however, they did report increases as large as 390 m1
in one subject. Maron et a1. (20) found a mean increase of 24% in RV
immediately following a marathon. The RV had returned to the pre
exercise value when the subjects were retested 24-hours following the

race. Unfortunately, these were the only two post-exercise RV measure
ments performed. Therefore, it is impossible to determine the RV re
covery time course from this data.
Although the effect of exercise on RV is well-documented, the
physiological mechanisms responsible for the increase are unclear.
Basically, three possible theories have developed. First, if there is
peripheral airway constriction following exercise, the airways would
close sooner during expiration, thus trapping more air. The increased
volume of trapped air would increase the RV. However, a recent study
by Doerr et ale (4) suggests that peripheral airway constriction does
not occur following exercise. They administered a bronchodialator
(isoproterenol) following a marathon and found no effect on lung
volumes or flow rates as compared to the post-race values without the
bronchodialator. They concluded that enhanced bronchial smooth muscle
tone did not occur following exercise.
According to the second theory, if CBV was reduced following
exercise, there would be more room in the thoracic cavity for air, thus
resulting in an increased RV (21). Along these lines, Braunwald and
Kelly (3) have shown that central blood volume (CBV), as assessed by
the indicator-dilution technique, decreased below pre-exercise values
following 10 minutes of moderately heavy leg exercise. Also, Okada
et al. (25), using a radiographic technique, found a mean exercise/rest
pulmonary blood volume ration of 0.95, suggesting a decrease in intra
thoracic blood volume during exercise. These studies suggest that the
increase in RV may be mediated by exercise-induced changes in CBV.
3

Recently, a third possible mechanism has been postulated (20).
Maron et al. (20) suggest that if interstitial edema occurred following
exercise, this could cause a decrease in the size of the bronchioles,
thus causing them to close sooner during a forced expiration. It had
previously been reported (9) that the diameter of the small airways is
reduced during the early stages of pulmonary edema as a result of fluid
accumulating in the peribronchial sheath.
4
Why would fluid accumulate in the lung during exercise? Accord
ing to the Starling hypothesis for bulk capillary fluid transfer there
are several factors that could lead to pulmonary edema: elevated
capillary hydrostatic pressure, increased capillary permeability to
plasma proteins, increased capillary surface area, decreased plasma
colloid osmotic pressure, and decreased lymphatic drainage (29). At
least two of these factors could promote fluid accumulation during
exercise. First, several investigations have shown that pulmonary
artery pressure increases 5-10 torr at the onset of exercise (5,19).
This increase in capillary hydrostatic pressure would promote fluid
accumulation. Also, since pulmonary capillary blood volume is increased
during exercise (2), total capillary surface area for fluid exchange
must also increase. These two factors would tend to increase inter
stitial edema formation during exercise.
Several studies (23,31) using the double indicator-dilution
technique have shown an increase in pulmonary extravascular water
volume (PEWV) during exercise in man. However, in a more recent study,
Marshall et al. (22) using a direct dissection technique, concluded

5
that PEWV did not increase during exercise in dogs. The methods em
ployed in that study, however, are only capable of detecting a 10%
increase in PEWV (22). Hughes and Rosenzweig (8) have previously shown
that the volume of trapped gas (VTG) in excised dog lungs increased 83%
with a mere 8% increase in lung weight (i.e. interstitial edema). Also,
increases in lung weight as small as 1% resulted in a 34% increase in
VTG. Along these lines, Lemen et al. (18) have found a 44% increase in
RV in alloxan-treated dogs, which was attributed to the development of
PEWV, although there was no radiological or clinical evidence of pul
monary edema. Therefore, it would appear that small changes in peri
bronchial edema can bring about large changes in RV, as was shown by
Hughes and Rosenzweig (8).
In recent years, several investigators have attempted to use
transthoracic electrical impedance (TEl) as a more sensitive measure
for the early detection of pulmonary edema (15,19,27). This technique
is based on Ohm's Law, and the fact that various biological substances
have different electrical conductivities (15,19). The impedance, or
resistance, of the thorax to the flow of electricity varies inversely
to the amount of fluid contained in the thorax. Ionized fluids have a
comparatively low resistance (19), so TEl decreases as the volume of
fluid in the thorax increases, and vise versa. Therefore, measurement
of changes in TEl allows an indirect assessment of relative changes in
thoracic fluid content. Pomerantz et al. (27) reported that TEl detects
fluid accumulation within the thorax well before there is any indication
of edema with the classical methods of monitoring. In a study they

performed on 43 dogs and 9 patients, they were able to detect fluid
accumulation as small as 50 ml within the intact thorax. In a more
recent study, Jaeger et al. (11), used TEl to determine if sub-clinical
pulmonary edema was a common occurrence among non-acclimatized men
following rapid accent to 4300 meters. Upon physical examination no
signs of pulmonary edema were present, and no definite radiographic
evidence of fluid accumulation was found. However, TEl was signifi
cantly decreased and RV was significantly increased. Again, these
results suggest that TEl may provide a more sensitive measurement of
incipient pulmonary edema, and that small changes in interstitial edema
can alter pulmonary function mechanics.
Purpose
The purpose of this series of studies was as follows. Study I
was conducted to determine the immediate post-exercise effect of a bout
of exercise on residual volume and selected pulmonary function measure
ments. Although similar studies have been reported in the past, it was
felt that confirmation of previous research, and the establishment of
procedures and techniques were necessary before further research was
attempted. Study II was a repeated measures study designed to follow
the effect of an acute bout of exercise on RV immediately post-exercise
and at selected intervals over a 24-hour post-exercise period. This
allowed for determination of the time course of the RV as it returned
to normal. In an attempt to help determine whether transthoracic fluid
shifts were the cause for the post-exercise pulmonary function re
sponses, study III examined the relationship between TEl and RV
6

7
following exercise. Study IV determined the relationship between alter
ations in CBV and various lung volumes following exercise. CBV was
experimentally altered via G-suit inflation (increasing CBV) and venous
occlusion tourniquets (decreasing CBV). This allowed for determination
of the responses of various post-exercise lung volumes to intravascular
fluid shifts. Finally, study V determined the pre- and post-exercise
carbon monoxide diffusion capacity (OLco) of the lungs. This was done
to help differentiate between intra- and extravascular fluid shifts,
within the thorax, following exercise.

CHAPTER 2
EXPERIMENTAL DESIGN AND METHODOLOGY
Subjects
Participants in all studies were volunteers. All were non
smokers and free from respiratory disorders as determined by question
naire. The subjects used in study I were 11 female runners from the
University of Arizona cross country team. Subjects for studies II and
III were 12 and 18 college-aged males, respectively. Subjects from
study III were recruited to participate in studies IV (n=lO) and V
(n=5), respectively. The procedures for each study had been approved
by the University of Arizona Human Subjects Committee and were carefully
reviewed with each subject. Written informed consent was obtained
prior to testing.
Methods
In all five studies, the subjects reported to the laboratory at
least 3 hours post-absorptive, and age, height, and weight were ob
tained. In studies I through IV the pre-exercise RV was determined
using the closed-circuit oxygen dilution technique described by Wilmore
(34). The reproducibility of this method was established on a sample
of 195 men with a correlation of 0.993 and a standard error of 28 ml
(34). A minimum of two RV measurements were administered to each sub
ject. If necessary, additional trials were administered until two
8

trials within 100 ml were obtained. The mean of these two measurements
is the reported value. Each subject then performed two forced vital
capacity (FVC) maneuvers using a Collins 13.5 liter spirometer. Sub-
9
sequently, the largest FVC tracing for each subject was analyzed accord
ing to the methods of Kory et al. (14). All pulmonary function
measurements were converted to BTPS conditions.
In all studies the subjects performed continuous treadmill
tests to exhaustion on a Quinton motor-driven treadmill. The protocol
consisted of a 2-minute warm up at 3 mph, followed by 2-minutes at 6
mph, and 2-minutes at 8 mph, each at 0% grade. Thereafter, the grade
was increased 2% per minute, with the speed remaining constant, until
exhaustion. Oxygen uptake (V02), minute ventilation (VE), carbon
dioxide production (VC02), and respiratory exchange ratio (RER) values
were obtained every minute and during the final seconds of the test
using a Beckman Metabolic Measurement Cart. The gas analyzers were
calibrated at the beginning and end of each test using a standard gas
previously analyzed with a micro-Scholander apparatus.
During the treadmill tests, an ECG was obtained utilizing a
CM5 lead on a Hewlett-Packard electrocardiograph. Heart rates were
determined just prior to exhaustion.
After completion of the treadmill tests, the subject cooled
down by walking at 3 mph at a 0% grade for 2-minutes. At the end of
the cool down period, the subject was immediately disconnected from
the electrocardiograph, and the 5-minute post-exercise RV measurements
were administered as previously described. Two FVC maneuvers followed

10
the RV measurements. In study II, the subjects repeated the RV and FVC
measurements at 15 and 30 minutes, and at 1,2, and 24 hours post
exercise. In study III, the subjects only repeated the RV and FVC
measurements at 15, 30, and 60 minutes post-exercise.
Transthoracic Electrical Impedance
During studies III and IV, TEl was measured using four alumin
ized mylar tape electrodes (Surcon, Inc. Minnesota) and a Minnesota
Impedance Cardiograph (model 304 A), according to the procedures out
lined by Kubichek et al. (15). A constant sinusoidal current (4 rnA rms)
at 100 KHz was applied to the two outer electrodes, one on the forehead
and the other around the abdomen. Changes in voltage, which reflect
changes in impedance, were measured from the two inner electrodes, one
around the neck and one around the lower thorax (15). TEl data were
recorded when the subject had reached maximal expiration during the RV
determinations.
Central Blood Volume Alterations
In an effort to determine the relationship between alterations
in CBV and RV following exercise, 10 of the original 18 subjects from
study III were recruited to perform two additional treadmul1 runs.
RV, FVC, TLC, and TEl were measured at the same time intervals, using
the same procedures as previously reported for study III. However,
before and following one of the additional treadmill runs, CBV was
experimentally increased via G-suit inflation. The G-suit was a
government issued jumpsuit garment which when inflated, selectively

11
increased the pressure in the legs and lower abdomen. Using a similar
suit, Weissler et al. (32) found a mean increase of 27% in CBV following
inflation to 70 torr. In the present study, the suit was inflated to
80 torr l-minutebefore the pre- and post-exercise RV and FVC deter
minations. TEl was recorded at maximum expiration during the RV
determinations. CBV was also experimentally decreased before and
following the other additional treadmill run using venous occlusion
tourniquets. Peripheral blood pooling was produced by placing pneumatic
blood pressure cuffs high on three extremities (both legs and left arm)
and inflating to diastolic pressure levels, as previously outlined by
Weissler et al. (32). Such a procedure has been previously shown to
cause a mean decrease of 7% in CBV (32). In the present study, the
cuffs were applied and inflated two minutes before the pre- and post
exercise RV and FVC maneuvers. TEl was recorded as previously de
scribed.
Diffusion Capacity of the Lung
Five of the original 18 subjects from study III were recruited
to perform an additional treadmill run in which DLco was measured
before the run and at 5, 15, 30, and 60-minutes post-exercise. The
Krogh (13) single breath diffusion capacity procedure was used. A
Collins Modular Lung Analyzer (Model llB) equipped with helium and
carbon monoxide analyzers was used. The subjects inspired a mixture
containing 15% helium, 0.3% carbon monoxide, 28% oxygen, and the
balance nitrogen. Alveolar gas samples were collected following a

12
lO-second breath holding period. Alveolar volumes (VA) were determined
from helium dilution.
Statistical Analysis
A standard statistical package (SPSS) was employed to analyze
the data using repeated t-tests and repeated measures analysis of
variance (ANOVA) where applicable. When significance was determined
by ANOVA, Tukey's post-hoc comparisons were used to assess the dif
ferences between means.

CHAPTER 3
RESULTS
Study I
The subjects physical and performance characteristics are pre
sented in Table 1. The pre- and post-exercise pulmonary function
measurements appear in Table 2. There was a significant mean increase
of 210 ml (20.6%) in the immediate post-exercise RV measure. FVC was
not significantly changed following the exercise bout, therefore, there
was a significant mean increase in the post-exercise TLC of 170 ml
(3.4%). Both the forced expiratory volume exhaled in 1 second (FEV1)
and the forced mid-expiratory flow (FEF25_75%) were unchanged following
exercise.
Study II
The physical and performance data of the subjects are presented
in Table 3. All of the pre- and post-exercise pulmonary function data
appear in Table 4. There was a significant mean increase of 260 ml,
or 20.8% in the 5-minute post-exercise RV measurement. RV remained
significantly increased over the pre-exercise value through 30 minutes
of recovery. FVC was not significantly changed following exercise,
therefore, there was a significant mean increase in the 5-minute post
exercise TLC of 190 ml, or 2.7%. TLC remained significantly increased
over the pre-exercise value through 15-minutes of recovery. Both the
13

TABLE 1
Selected Physical and Performance Characteristics of Subjects in Study I (N = 11 females).
Characteristic
Age (yr)
Weight (kg)
Height (cm)
V02 max (ml/kg'min)
HR max (bpm)
Treadmill time to exhaustion (sec)
x + S.D.
19.7 + 1.7
50.61 + 5.56
163.4 + 5.5
55.9 + 5.0
192 + 8.6
748 + 66
14

Pre
Post
Diff.
TABLE 2
Pre- and Post-Exercise Pulmonary Function Data for Study I (Values are means ~ S.D.)
FVC (L)
3.89
+.42
3.87
+.51
-.02
FEV1 (L)
3.37
+.44
3.37
+.64
.00
FEV1/FVC (%)
86.8
+8.6
87.0
+11.4
.2
FEF25_75% (L/min)
251.6
+74.2
257.1
+92.5
5.4
RV (L)
1.04
+.29
1.25
+.32
.21*
TLC (L)
4.94
+.61
5.11
+.67
.17*
RV/TLC ( %)
20.9
+4.0
24.6
+4.3
3.8*
*p <: 0.05
15

TABLE 3
Selected Physical and Performance Characteristics of Subjects in Study II (N = 12 males).
Characteristic
Age (yr)
Weight (kg)
Height (cm)
V02 max (m1/kg'min)
HR max (bpm)
Treadmill time to exhaustion (sec)
x + S.D.
26.1 + 3.8
72.04 + 7.97
177.5 + 7.3
52.2 + 10.5
185 + 10
640 + 105
16

TABLE 4
Pre- and Post-Exercise Pulmonary Function Data in Study II (Values are means ~ S.D.)
FVC FEV1 FEV1/FVC FEF25_75% RV TLC RV/TLC (L) ( L) (%) (L/sec) (L) ( L) (%)
Pre- 5.84+.78 4.79+.61 82.2+6.2 4.97+ 1. 24 1. 25+.19 7.09+.91 17.7+1.8
5 min post- 5.78+.78 4.80+.68 83.2+7.7 5.26+1.55 1.51+.27* 7.28+.91* 20.7+2.7*
15 min post- 5.78+.77 4.83+.63 83.9+6.4 5.35+1.40 1.46+.23* 7.25+.95* 20.2+1.9*
30 min post- 5.80+.79 4.77+.68 82.4+7.0 5.17+1.38 1.40+.25* 7.20+.97 19.5+2.1*
1 hr post- 5.80+.82 4.69+.60 81.2+7.0 5.12+1.49 1.36+.22 7.13+.97 18.8+2.2
2 hr post- 5.80+.79 4.72+.60 81.6+5.7 5.01+1.23 1.29+.21 7.08+.93 18.3+2.1
24 hr post- 5.77+.80 4.72+.60 81.7+6.1 5.05+1.16 1. 25+.17 7.02+.91 17.9+ 1. 9
*Significant1y different (p< 0.01) from pre-exercise value.
'-.J

18
FEV1 and FEF25_75% were unchanged following exercise. The RV/TLC ratio
was significantly increased over the pre-exercise value through 30-
minutes of recovery. This resulted from the fact that RV increased
proportionally more than TLC.
Study III
Table 5 shows the physical and performance characteristics of
the subjects. All of the pre- and post-exercise lung volumes and TEl
measures appear in Table 6. There was a significant mean increase of
200 ml (16.1%) in the 5-minute post-exercise RV. RV remained signif
icantly increased over the pre-exercise value through 3D-minutes of
recovery. FVC was not changed following exercise, therefore, the mean
5-minute post-exercise TLC was significantly increased by 130 m1 (1.9%).
TEl was significantly decreased below the pre-exercise value through
3D-minutes of recovery, indicating that there was a significant in
crease in thoracic fluid volume following exercise. Since TEl was
measured at RV, and this lung volume was changing with time, TEl values
were also normalized by expressing them as ohms per liter of RV. Such
a procedure has previously been used by Jaeger et a1. (11). This value
was also significantly decreased below the pre-exercise value through
3D-minutes of recovery.
Study IV
A sub group of 10 subjects from study III were recruited to
participate in this study. They performed two additional treadmill
tests to exhaustion. RV, FVC, TLC, and TEl were measured pre- and

TABLE 5
Selected Physical and Performance Characteristics of Subjects in Study III (N = 18 males).
Characteristic
Age (yr)
Weight (kg)
Height (cm)
V02 max (m1/kg·min)
Treadmill time to exhaustion (sec)
x + S.D.
25.4 + 3.5
79.21 + 16.69
177.8 + 11.0
54.1 + 7.5 .
622.7 + 73.9
19

RV (L)
FVC ( L)
TLC ( L)
TEl (ohms)
TABLE 6
Pre- and Post-Exercise Measurements in Study III (Values are means ~ S.D.)
Pre
1.24+.19
5.47+.73
6.71+.79
24.7+2.5
5-min post
1.44+.26*
5.41+.73
6.84+.81*
24.2+2.5*
15-min post
1.38+.22*
5.42+.73
6.80+.78*
24.4+2.4*
30-min post
1.36+.20*
5.44+.78
6.79+.80
24.5+2.4*
TEI/RV**(ohms) 20.2+2.8 17.3+2.8* 17.9+2.5* 18.3+2.6*
*Significantly different (p < 0.05) from pre-exercise value.
**TEI expressed relative to residual lung volume.
20
60-min post
1.29+.21
5.45+.71
6.73+.76
24.7+2.5
19.4+2.4

post-exercise, as CBV was altered via G-suit inflation and venous oc-
clusion toui'niquets. Table 7 shows that there were no significant .
differences between the V02 max or time to exhaustion for the three
treadmill tests (i.e. control, G-suit, venous occlusion). Table 8
shows all of the pre- and post-exercise lung volumes and TEl data for
all 3 conditions. There was a significant mean increase of 180 m1
(14.5%), 120 m1 (9.6%), and 230 ml (17.0%) in the control, G-suit, and
venous occlusion 5-minute post-exercise RV, respectively. RV remained
significantly increased over the pre-exercise value through 30-minutes
of recovery, during the control condition. For the other two con-
21
ditions, it remained significantly elevated only through 15-minutes of
recovery. FVC was not significantly changed following exercise for any
of the 3 conditions. The 5~minute post-exercise TLC was significantly
increased by 130 ml (1.9%), 160 m1 (2.6%), and 160 ml (2.4%) over the
pre-exercise value for the control, G-suit, and venous occlusion con-
ditions, respectively. In all 3 conditions TLC was significantly
elevated over the pre-exercise value during the 5-minute post-exercise
period. TEl and TEljRV were significantly increased over the pre-
exercise value through 30-minutes, l5-minutes, and 15-minutes for the
control, G-suit, and venous occlusion conditions, respectively. Table 8
also shows that G-suit inflation and venous occlusion resulted in sig-
nificant changes in TEl at all measured time intervals, as compared to
the control values. However, there were no significant differences in
any measured lung volume, across the 3 conditions.

TABLE 7
V02 max and Treadmill Time to Exhaustion in Study IV for the Control, G-Suit, and Venous Occlusion Conditions
(Values are means ~ S.D.)
Control
G-Suit
Venous Occlusion
F-Value
VO max (ml/k~'min)
53.4 + 6.0
54.1 + 6.5
53.9 + 5.3
1.02
Treadmill time to exhaustion (sec)
598.5 + 72.1
616.9 + 69.3
615.0 + 57.7
1. 79
22

TABLE 8
Pre- and Post-Exercise Measurements in Study IV for the Three Experimental Conditions
(Values are means ~ S.D.)
Control: RV (L) FVC (L) TLC (L) TEI (ohms) TEI/RV (ohms/L)
G-Suit: RV (L) FVC ( L)
TLC (L) TEl (ohms) TEI/RV (ohms/L)
Venous Occlusion: RV (L) FVC (L) TLC (L) TEl (ohms) TEI/RV (ohms/L)
Pre
1. 24+. 17 5.47+.74 6.70+.79 24.6+2.2 20.3+3;3
1.25+.27 4.86+.74
6.11+.84
5-min post
1.42+.19* 5.41+.81 6.83+.83* 24.2+2.0* 17.3+2.5*
1.37+.28* 4.92+.86 6.27+.94*
22.7+2.3+ 22.3+2.1*+ 18.2+2.9 16.3+2.3*
1.35+.29 1.58+.35* 5.38+.96 5.31+1.08 6.73+.98 6.89+1.01* 25.6+2.5+ 25.4+2.4*+ - -19.0+3.1 16.1+3.0*
15-mi n post
1.37+.13* 5.41+.80 6.78+.78 24.3+2.0* 17.9+2.1*
1.32~.36*
4.83+.83 6.15+.91 22.3+2.0*+ 17.0+2.8*
1.49+.33* 5.33+1.01 6.82+.96 25.6+2.5*+
17.2+2.8*
30-min post
1. 36+.17* 5.41+.85 6.76+.82 24.3+2.0* 18.1+2.7*
1.29+.24 4.88+.83 6.17+.91 22.4+2.0+ 17.4+2.7
1.43+.32 5.34+ 1. 08 6.76+.96 25.7+2.5+ 18.0+2.6
23
60-min post
1.29+.17 5.44+.79
6.72+.80 24.6+2.0 19.3+2.5
1.28+.25 4.80+.91 6.07+.98 22.5+2.2+ 17.6+2.5
1.38+.28 5.40+1.05 6.78+1.02 25.7+2.6+ 18.6+2.1
*Significant1y different (p < 0.05) from pre-exercise value.
+Significantly different (p < 0.05) from corresponding control value.
Study V
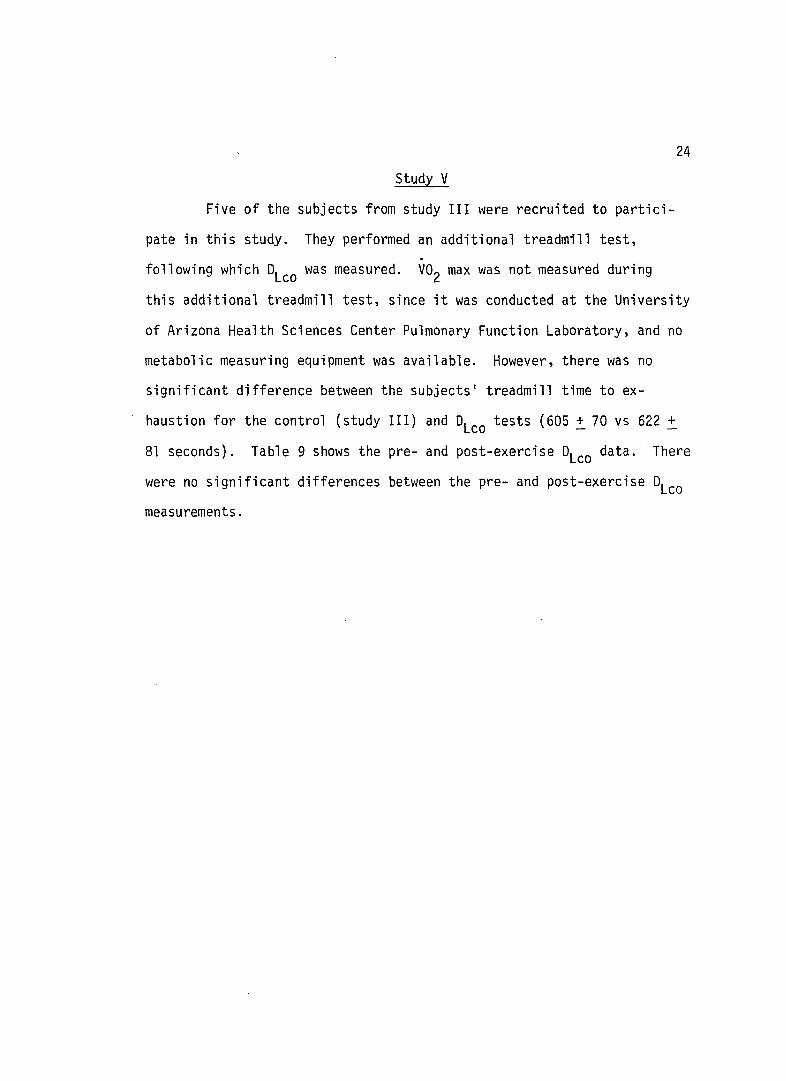
Five of the subjects from study III were recruited to partici
pate in this study. They performed an additional treadmill test, .
following which 0Lco was measured. V02 max was not measured during
24
this additional treadmill test, since it was conducted at the University
of Arizona Health Sciences Center Pulmonary Function Laboratory, and no
metabolic measuring equipment was available. However, there was no
significant difference between the subjects' treadmill time to ex
haustion for the control (study III) and 0Lco tests (605 ~ 70 vs 622 ~
81 seconds). Table 9 shows the pre- and post-exercise 0Lco data. There
were no significant differences between the pre- and post-exercise 0Lco
measurements.

TABLE 9
Pre- and Post-Exercise Diffusion Capacity in Study V (Values are means ~ S.D.)
Pre
5-min post
15-min post
30-min post
60-min post
F-Value
DLc/VA (m1/min·mmHg)
14.3 + 1.7
15.3 + 1.9
14.7 + 1.9
13.8 + 1.7
12.7 + 1.6
1.21
25

CHAPTER 4
DISCUSSION
Studies I, II and III all showed significant increases in the
5-minute post-exercise RV measurement. This agrees with the results of
others (5,20,28). Also, all three of the present studies found a
significant increase, of similar absolute magnitude to that of the
increase in RV, in the "5-minute post-exercise TLC. These results agree
with the findings of Hanson et al. (10) and Stubbing et al. (30), both
of whom have previously reported similar increases in RV and TLC during
exercise. The results from studies I, II, and III suggest that the
increases previously reported (10,30) in RV and TLC during exercise
are carried over into the post-exercise period.
An increase in the post-exercise TLC, as was shown in studies
I, II, and III, has not been previously reported in the literature.
However, this may simply be due to an oversight by previous researchers.
Several studies (16,17) have reported no change in FVC following exer
ci~e, which agrees with the results of studies I, II, and III. However,
neither of these previous studies (16,17) measured RV following exer
cise. Therefore, they could not report of TLC changes.
Maron et al. (20) found an increase in RV immediately following
a marathon. The RV had returned to the pre-exercise value when the
subjects were retested 24-hours following the race. Since these were
the only two post-exercise RV measurements, it was impossible to
26
27
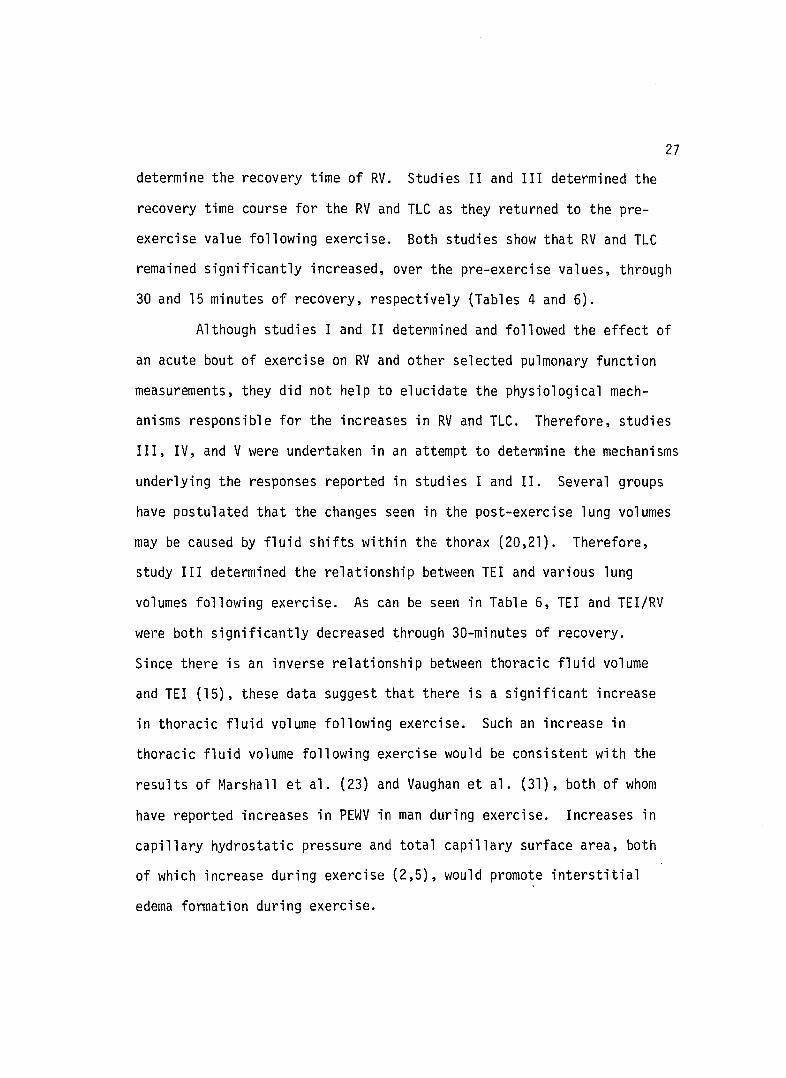
determine the recovery time of RV. Studies II and III determined the
recovery time course for the RV and TLC as they returned to the pre
exercise value following exercise. Both studies show that RV and TLC
remained significantly increased, over the pre-exercise values, through
30 and 15 minutes of recovery, respectively (Tables 4 and 6).
Although studies I and II determined and followed the effect of
an acute bout of exercise on RV and other selected pulmonary function
measurements, they did not help to elucidate the physiological mech
anisms responsible for the increases in RV and TLC. Therefore, studies
III, IV, and V were undertaken in an attempt to determine the mechanisms
underlying the responses reported in studies I and II. Several groups
have postulated that the changes seen in the post-exercise lung volumes
may be caused by fluid shifts within thE thorax (20,21). Therefore,
study III determined the relationship between TEl and various lung
volumes following exercise. As can be seen in Table 6, TEl and TEI/RV
Wel"e both significantly decreased through 3D-minutes of recovery.
Since there is an inverse relationship between thoracic fluid volume
and TEl (15), these data suggest that there is a significant increase
in thoracic fluid volume following exercise. Such an increase in
thoracic fluid volume following exercise would be consistent with the
results of Marshall et al. (23) and Vaughan et al. (31), both of whom
have reported increases in PEWV in man during exercise. Increases in
capillary hydrostatic pressure and total capillary surface area, both
of which increase during exercise (2,5), would promote interstitial
edema formation during exercise.

28
Several studies (8,18) have shown that small increses in inter
stitial edema can result iii large increases in RV. This is thought to
be due to the edema causing a reduction in small airway diameter (9),
thus allowing the airways to close sooner trapping more air. As the
lymphatic system reabsorbs the accumulated fluid (33), it would seem
reasonable to assume that the RV would return to control levels, which
is consistent with the results from studies II and III.
Interestingly, interstitial edema of this magnitude does not
seem to compromise FVC. Lemen et al. (18) found a 44% increase in RV,
attributed to interstitial edema, yet an unchanged FVC, thus resulting
in an increase in TLC. In a more recent study, Jaeger et a1. (11)
found a significant decrease in TEl in nonacc1imated men abruptly
exposed to high altitude. They also reported significant increases in
RV and TLC which they attributed to the increase in thoracic fluid.
Both of these studies (11,18) are consistent with the increase in RV
and TLC reported in studies I, II, and III. The increases in TLC could
also be due to increased patency, and possibly an increased number of
conducting airways, as speculated by Kagawa and Kerr (12).
The unchanged FEV1 and FEF25_75% following exercise, as re
ported in studies I and II, agrees with the results of others (16,20).
However, one may argue that if interstitial edema was causing a re
duction "in the diameter of the small airways, this should cause an
increase in airway resistance, thus resulting in a decrease in FEV 1 and FEF25_75%. However, studies I and II both show unchanged flow
rates following exercise. This apparent paradox is resolved by the

29
fact that the peripheral airways contribute only approximately 10% of
the total airway resistance, so that a decrease in small airway caliber
would have little effect on the total resistance (10). Another fact
complicates the interpretation of the post-exercise flow rate data from
studies I and II. Since TLC was changing during the various time inter
vals, all of the FVC maneuvers were performed from unequal maximal lung
volumes. Lefcoe (16) suggests that an increase in TLC would increase
FEVl and FEF25_75%. Unfortunately, the extent to which a small increase
in TLC, such as that reported in studies I and II, will increase FEV!
and FEF25_75% is unknown at this time.
Although study III shows that there is an increase in thoracic
fluid volume following exercise, TEl measurements alone cannot separate
between intra- and extravascular fluid shifts. Therefore, one could
argue that the decrease in TEl following exercise could simply be due
to an increase in intravascular volume (i.e. blood), and not inter
stitial edema. Studies IV and V took two different approaches .in an
attempt to identify whether the decrease in TEl and increase in RV as
reported in study III were due to intra- or extravascular fluid shifts.
Study IV was based on the assumption that if the increase in
RV following exercise was due to an increase in thoracic intravascular
fluid, then experimental increases and decreases in thoracic blood
volume should bring about parallel changes in RV. Study IV examined
the TEl, RV, and TLC responses before and following an acute bout of
exercise, as intrathoracic blood volume was experimentally altered via
G-suit inflation and venous occlusion tourniquets. The bouts of

30
exercise were similar for the three conditions as there were no signif
icant differences between the treadmill times of V02 max values for the
three tests (Table 7). Intrathoracic blood volume was experimentally
increased and decreased via G-suit inflation and venous occlusion as
evidenced by the 1.9 volt decrease and .9 volt increase in the pre
exercise TEl, respectively. Following their respective treadmill tests,
G-suit inflation and venous occlusion resulted in increased and de-
creased TEl values respectively, at all measured time intervals as
compared to the control condition. However, as can be seen in Table 8,
the post-exercise RV response was not altered from the control condition
by either treatment. This suggests that RV is relatively insensitive
to intravascular volume shifts within the thorax.
Study V determined and followed the effect of an acute bout of
exercise on 0Lco. 0Lco can be considered an indirect measure of
thoracic intravascular volume, since several studies (2,24) have shown
that a linear relationship exists between increases in 0Lco and pul
monary blood volume. Therefore, it was felt that if TEl decreased and
0L increased, this would suggest that the increased intrathoracic co fluid would have to be partially or totally explained by shifts in
intravascular fluid. However, if TEl decreased and 0Lco remained the
same, then one would assume that the increased intrathoracic fluid was
not blood, and must be extravascular fluid, i.e. interstitial edema.
As can be seen in Table 9, 0Lco/VA did not increase significantly
following exercise. This agrees with the results of Brashear et al.
(2) who reported that 0L was similar to the pre-exercise values at co

10 minutes following completion of exercise. In a more recent study,
Maron et al. (20) reported no significant change in 0Lco' as compared
31
to the pre-exercise value, following a marathon. These studies are
consistent with the results from study V. Therefore, these data suggest
that the decrease in TEl following exercise is a result of extravascular
fluid accumulation.
From the results of studies I through IV and the results from
previous research, the following sequence of events is proposed as a
possible explanation for the responses of RV to an acute bout of exer
cise. Ouri~g exercise capillary hydrostatic pressure is elevated (4),
and the total capillary surface area for fluid exchange is increased
(2), both of which promote extravascular fluid accumulation. This was
confirmed by the decrease in TEl following exercise. The fluid pre
ferentially accumulates in the peribronchial interstitial space (29),
thus causing a decrease in small airway diameter (9). Therefore,
during a forced expiration the peripheral airways close sooner, thus
trapping more air, as evidenced by the increase in RV. The inter
stitial edema, however, does not seem to compromise FVC (18). Following
exercise, as the lymphatic system reabsorbs the accumulated fluid (33),
the RV would return to control levels.

CHAPTER 5
SUMMARY
A series of five different studies were conducted to examine
several aspects of the effect of exercise on selected pulmonary func
tion measurements. Studies I and II determined and followed the effect
of an acute bout of exercise on various lung volumes immediately post
exercise and over a 24-hour post-exercise period. There were signif
icant mean increases of 210 ml (20.6%) and 260 ml (20.8%) in the 5-
minute post-exercise RV measurement for studies I and II, respectively.
There also were significant mean increases of 170 ml (3.4%) and 190 m1
(2.7%) in the 5-minute post-exercise TLC for studies I and II, re
spectively. RV and TLC remained significantly increased over the pre
exercise values through 30 and 15 minutes of recovery, respectively.
Since these first two studies only documented the various post-exercise
pulmonary function responses, studies III through V were undertaken in
an attempt to determine the physiological mechanisms underlying the
responses reported in studies I and II.
Study III reported that TEl was significantly decreased below
the pre-exercise value through 3D-minutes of recovery, indicating that
there was a significant increase in thoracic fluid volume following
exercise. However, TEl measurements alone cannot separate between
intra- and extravascular fluid shifts. Therefore, studies IV and V
took two different approaches in an attempt to identify whether the
32

33
decrease in TEl and increase in RV reported in study III were due to
intra- or extravascular fluid shifts. Study IV examined the TEl, RV,
and TLC responses before and following an acute bout of exercise, as
CBV was experimentally altered via G-suit inflation (increasing CBV),
and venous occlusion tourniquets (decreasing CBV). The results suggest
that RV is relatively insensitive to intravascular volume shifts within
the thorax. Study V determined and followed the effect of an acute
bout of exercise on 0Lco' 0Lco/VA did not increase significantly
following exercise, suggesting that the decrease in TEl following exer
cise is the result of extravascular fluid accumulation.
It was concluded that a sub-clinical pulmonary edema occurs
following exercise. A logical sequence of events, based on the results
of studies I through V, and the results of previous research, was
proposed as a possible explanation for the responses of RV and TLC to
exercise.

SUMMARY OF TERM ABBREVIATIONS
l. Residual volume RV
2. Total lung capacity TLC
3. Transthoracic electrical impedance TEl
4. Central blood volume CBV
5. Lung diffusion capacity °Lco 6. Pulmonary extravascular water volume PEWV
7. Volume of trapped gas VTG
8. Forced vital capacity FVC
9. Alveolar volume VA
10. Forced expiratory volume exhaled in 1 second FEV 1
ll. Forced mid-expiratory flow FEF25 _75%
34

LITERATURE CITED
o 1. Astrand, P.O. and K. Rodahl. Textbook of Work Physiology. 2nd ed.
New York: Mcgraw-Hill, Inc., 1977, pp. 207-262.
2. Brashear, R.E., J.C. Ross, and W.J. Daly. Pulmonary diffusion and capillary blood volume in dogs at rest and with exercise. J. Appl. Physiol. 21:516-520,1966.
3. Braunwald, E. and E.R. Kelly. The effect of exercise on central blood volume in man. J. Clin. Invest. 39:413-419, 1960.
4. Doerr, C.E., S.A. Schonfeld, R.W. Gotshall, D.E. Sinks, and D.S. Miles. Changes in lung volume and flow rates after a marathon. The Physiologist 24:63, 1981.
5. Donald, K.W., J.M. Bishop, G. Cummings and O.L Wade. The effect of exercise on the cardiac output and circulatory dynamics of normal subjects. Clin. Sci. 14:37-73, 1955.
6. Girandola, R.N., R.A. Wiswell, J.G. Mohler, G.T. Romero, and W.S. Barnes. Effects of water irrnnersion on lung volumes: implications for body composition analysis. J. Appl. Physiol. 43:276-279, 1977.
7. Hanson, J.S., B.S. Tabakin, and E.J. Caldwell. Response of lung volumes and ventilation to posture change and upright exercise. J. Appl. Physiol. 17:783-786, 1962.
8. Hughes, J.M.B. and D.Y Rosenzweig. Factors affecting trapped gas volume in perfused dog lungs. J. Appl. Physiol. 29:332-339, 1970.
9. Hughes, J.M.B., D.Y. Rosenzweig, and P.W. Kivitz. Site of airway closure in excised dog lungs: histologic demonstration. J. Appl. Physiol. 29:340-344, 1970. -
10. Ififf, L.D., R.E. Greene, and J.M.B. Hughes. Effect of interstitial edema on distribution of ventilation and perfusion in isolated lung. J. Appl. Physiol. 33:462-467, 1972.
11. Jaeger, J.J., J.T. Sylvester, A. Cymerman, J.J. Berberich, J.C. Denniston, and J.T. Maher. Evidence for increased intrathoracic fluid volume in man at high altitudes. J. Appl. Physiol.: Respirat. Environ. Exercise Physiol. 47:670-676, 1979.
35

12. Kagawa, J. and H.D. Kerr. Effects of brief graded exercise on specific airway conductance in normal subjects. J. Appl. Physiol. 28:138-144, 1970.
13. Krogh, M. The diffusion of gases through the lungs of man. J. Physiol. 49:271, 1914.
36
14. Kory, R.C., R. Callahan, H.G. Boren, and J.C. Syner. The Veterans Administration Army cooperative study of pulmonary functions. Am. J. Med. 30:243-258, 1961.
15. Kubicek, W.G., R.E. Patterson, D.A. Witsoe. Impedance cardiography as a noninvasive method of monitoring cardiac function and other parameters of the cardiovascular system. Annals of the New York Academy of Sciences 170:724-732, 1970.
16. Lefcoe, N.M. The time course of maximum ventilatory performance during and after moderately heavy exercise. Clin. Sci. 36:47-52, 1969.
17. Lefco, N.M., R.P. Carter, and D. Ahmad. Post-exercise bronchoconstriction in normal subjects and asthmatics. Am. Rev. Respir. Dis. 104:562-567, 1971.
18. Lemen, R., J.G. Jones, P.O. Graf, and G. Cowan. Closing volume changes in alloxan induced pulmonary edema in anesthetized dogs. J. Appl. Physiol. 39:235-241, 1975.
19. Luepker, R.V., J.R. Michael, and J.R. Warbasse. Transthoracic electrical impedance: Quantitative evaluation of a noninvasive measure of thoracic fluid volume. Am. Heart Jour.-85:83-93, 1973.
20. Maron, M.B., L.H. Hamilton, and M.G. Maksud. Alterations in pulmonary function consequent to competitive marathon running. Med. Sci. Sports 11:244-249,1979.
21. Maron, M.B., P.A. Farrell, L.H. Hamilton, M.G. Maksud, and C. Foster. Time course of lung volume changes during prolonged treadmill running. Med. Sci. Sports Exercise 13:121, 1981.
22. Marshall, B.E., L.R. Soma, and G.R. Neufeld. Lung water volume at rest and exercise in dogs. J. App1. Physiol. 39:7-8, 1975.
23. Marshall, B.E., R.L. Teichner, T. Kallos, H.J. Sugerman, M.Q. Wyche, and K.R. Tantum. Effect of posture and exercise on the pulmonary extravascular water volume in man. J. Appl. Physiol. 31:375-379, 1971.

24. Miles, D.S., C.E. Doerr, S.A. Schonfeld, D.E. Sinks, and R.W. Gotshall. Changes in diffusion capacity and closing volume after a marathon. The Physiologist 24:64, 1981.
25. Okada, R.D., G.M., Pohost, H.D. Kirshenbaum, F.G. Kushner, C.A.
37
Boucher, P.C. Block, and H.W. Strauss. Radionuclide-Determined changes in pulmonary blood volume with exercise. N. Eng. J. Med. 301:569-576, 1979.
26. Patterson, N.A.M., D. Ahmad, and N.M. Lefcoe. Airways narrowing in exercise in normal subjects and the effect of disodium chromoglycate. Br. J. Dis. Chest 67:197-207, 1973.
27. Pomerantz, M., R. Baumgartner, J. Lauridson, and B. Eiseman. Transthoracic electrical impedance for the early detection of pulmonary edema. Surgery 66:260-268, 1969.
28. Raven, P.B., M.D. Bah, and R.W. Blide. Closing volume following exercise of various durations. Fed. Pro~. 36:630, 1977.
29. Staub, N.C., H. Nagano, and M.L. Pearce. Pulmonary edema in dogs: especially the sequence of fluid accumulation in lungs. J. Appl. Physiol. 22:227-240, 1967. -
30. Stubbing, D.G., L.D. Pengelly, J.L.C. Morse, and N.L. Jones. Pulmonary mechanics during exercise in normal males. J. Appl. Physiol. 49:506-610, 1980.
31. Vaughan, T.R., E.M. DeMarino, and N.C. Staub. Indicator dilution lung water and capillary blood volume in prolonged heavy exercise in normal man. Am. Rev. Respir. Dis. 113:757-762, 1976.
32. Weissler, A.M., J.J. Leonard, and J.V. Warren. Effects of posture and Atropine on the cardiac output. J. Clin. Invest. 36:1656-1662, 1957.
33. West, J.B. Respiratory Physiology. Baltimore: Williams and Wilkins Co., 1979, pp. 46-47.
34. Wilmore, J.G. A simplified method for determination of residual lung volumes. J. Appl. Physiol. 27:96-100, 1969.