
Microbiological and Physicochemical Characteristics of ...
139
Cooperation program Microbiological and Physicochemical Characteristics of Different Water Samples Used for Food Factories in Gaza City, Palestine Prepared By Moataz Mohammed Abu warda B.Sc. in Food Science and Teachnology Faculty of Agriculture and Environment AL-Azhar University- Gaza Supervisors Dr. Abd El- Raziq Salama Dr. Nahed Al Laham Prof. Abd El Rahman Khalaf Allah Assistant Prof. of Food Science & Technology Faculty of Agri & Environment Al- Azhar University – Gaza Associate Prof. of Medical and molecular Microbiology Faculty of Applied Medical Sciences , Al- Azhar University- Gaza Prof. of food science and Teachnology Faculty of Agriculture, Cairo University-Giza A Thesis Submitted in Partial Fulfillment of the Requirements for the Degree of Master in Agriculture 2015
Transcript of Microbiological and Physicochemical Characteristics of ...

Cooperation program
Microbiological and Physicochemical Characteristics of
Different Water Samples Used for Food Factories in
Gaza City, Palestine
Prepared By
Moataz Mohammed Abu warda
B.Sc. in Food Science and Teachnology
Faculty of Agriculture and Environment
AL-Azhar University- Gaza
Supervisors
Dr. Abd El- Raziq Salama Dr. Nahed Al Laham
Prof. Abd El Rahman
Khalaf Allah
Assistant Prof. of Food Science
& Technology
Faculty of Agri & Environment
Al- Azhar University – Gaza
Associate Prof. of Medical and
molecular Microbiology
Faculty of Applied Medical
Sciences , Al- Azhar
University- Gaza
Prof. of food science and
Teachnology
Faculty of Agriculture, Cairo
University-Giza
A Thesis Submitted in Partial Fulfillment of the Requirements for the Degree
of Master in Agriculture
2015

II
حمه الل بسم حيم الر الر
{وجعلن ا من الماء كل شيء حي أف لا يؤمنون }
03سورة الأنبياء

III
Didecation
I dedicate this work to:
My kind- hearted father and wonderful mother
My brothers and sisters
my friends
All people supported me

IV
Acknowledgments
I am grateful to Allah, who granted me the power and courage to finish this
study, without his help my effort would have gone a stray.
I would like to acknowledge my supervisors Dr. Abd Al Raziq Salama, Dr.
Nahed Al Laham and Prof. Abd El Rahman Khalaf Hllah for their continuous
support, guidance, constructive suggestions and energetic commitments to my
research.
Many thanks are extended to all my colleagues in the master Food
Technology program.
Special deep gratitude to my family for their unlimited support,
encouragement and affection.
Finally, my thanks to my wife, for the memorable days we shared together.
Moataz Abu warda

V
List of contents
Dedication........................................................................................................... iii
Acknowledgment............................................................................................... iv
List of Tables...................................................................................................... viii
List of Figures..................................................................................................... ix
Abbreviation....................................................................................................... x
Abstract............................................................................................................... xii
Introduction........................................................................................................
Objectives...........................................................................................................
1
3
Review of Literature…………..........................................................................
3.1 Water sources............................................................................................
3.2 Water pollution.........................................................................................
3.3 Water and food industry..........................................................................
3.4 Microbiological quality of Water………………………………….........
3.4.1 Total plate count (TPC) …………………………………............
3.4.2 Total coliform………………………………….............................
3.4.3 Fecal coliforms…………………………………...........................
3.4.4 Fecal streptococci …………………………………......................
3.4.5 Pseudomonas aeruginosa...............................................................
3.4.6 Mold and yeast................................................................................
3.5 Chemical and physical properties of water……………………………..
3.5.1 Total dissolved substance (TDS)…………………………………
3.5.2 Chloride..........................................................................................
3.5.3 Calcium...........................................................................................
3.5.4 Sodium............................................................................................
3.5.5 Magnesium......................................................................................
3.5.6 Potassium........................................................................................
3.5.7 Nitrates and nitrites.........................................................................
3.5.8 Biochemical oxygen demand………………………………......
3.5.9 Hardness..........................................................................................
3.5.10 Turbidity.......................................................................................
4
4
5
7
10
11
13
15
17
18
19
24
24
26
27
28
29
30
31
33
34
35

VI
3.5.11 Electrical conductivity ………………………………….............
3.5.12 pH.................................................................................................
3.5.13 Temperature..................................................................................
3.6 Water quality standards…………………………………........................
36
37
39
40
Materials and Methods......................................................................................
4.1 Materials...................................................................................................
4.1.1 Samples...........................................................................................
4.1.2 Collection of water samples............................................................
4.1.3 Equipment and Instruments............................................................
4.2 Methods....................................................................................................
4.2.1 Methods of sampling……………………………………………...
4.2.2 Microbiological analysis................................................................
4.2.2.1 Microbiological media and determination.......................
4.2.2.2 Biochemical test................................................................
4.2.2.3 Membrane filters (MF).....................................................
4.2.3 Chemical and physical analysis of water samples.....................
42
42
42
42
43
44
44
44
44
47
47
47
Results.................................................................................................................
5.1 Microbiological Analysis..........................................................................
5.1.1 Microbiological analysis of water samples that collected from
juices and carbonated beverages factories.....................................
5.1.2 Microbiological analysis of ice cream factories............................
5.1.3 Microbiological analysis of bakery factories................................
5.1.4 Microbiological analysis of oriental sweets factories...................
5.1.5 Microbiological analysis of cake and pytefor factories................
5.1.6 Microbial contamination of water samples that collected from all
five group factories.........................................................................
5.2 Physicochemical analysis........................................................................
5.2.1 Physicochemical analysis of water samples from juices and
carbonated beverages factories...................................................
5.2.2 Physicochemical analysis of water samples from ice cream
factories…………………………………………
5.2.3 Physicochemical analysis of water samples from bakery
factories………………………………………………………….
56
56
57
58
59
50
61
67
68
69
70
71

VII
5.2.4 Physicochemical analysis of water samples from oriental sweets
factories….………………………………………………………
5.2.5 Physicochemical analysis of water samples from cake and
pytefor factories….……………………………………………....
5.2.6 Average physicochemical analysis of water samples five
group factories................................................................................
5.2.7 Questionnaire..................................................................................
72
73
74
83
Discussion………………………………………………………………………
6.1 Microbiological quality of used water………………………………….
6.2 Physicochemical quality of used water……………....………………….
Summary.............................................................................................................
Conclusio.............................................................................................................
Recommendation……………………………………………………………....
Arabic summary.................................................................................................
References...........................................................................................................
84
84
88
96
99
100
101
104

VIII
List of Tables
Table No Titles Page
1. Water Microbiological Standards 40
2. Water Physical Standards 40
3. Water Shemical Standards 41
4. Number and Distribution of Samples 42
5. Microbiological assessment of water samples collected
from Juices and carbonated beverages factories
57
6. Microbiological assessment of water samples collected
from ice cream factories
58
7. Microbiological assessment of water samples collected
from Bakery factories.
59
8. Microbiological assessment of water samples collected
from oriental sweets factories.
60
9. Microbiological assessment of water samples collected
from Cake and pytefor factories .
61
10. Microbial contamination in water of all five group factories 67
11. Average of Physicochemical parameters at at water from
Juices and carbonated beverages factories
69
12. Average of Physicochemical parameters at at water from
ice cream factories
70
13. Average of Physicochemical parameters at at water from
Bakery factories
71
14. Average of physicochemical parameters at at water from
Oriental Sweets factories
72
15. Average of Physicochemical parameters at water from
Cake and Pytefor factories
73
16. Average Physicochemical parameters for five group
factories
74
17. Analysis of the Questionnaire 83
IX
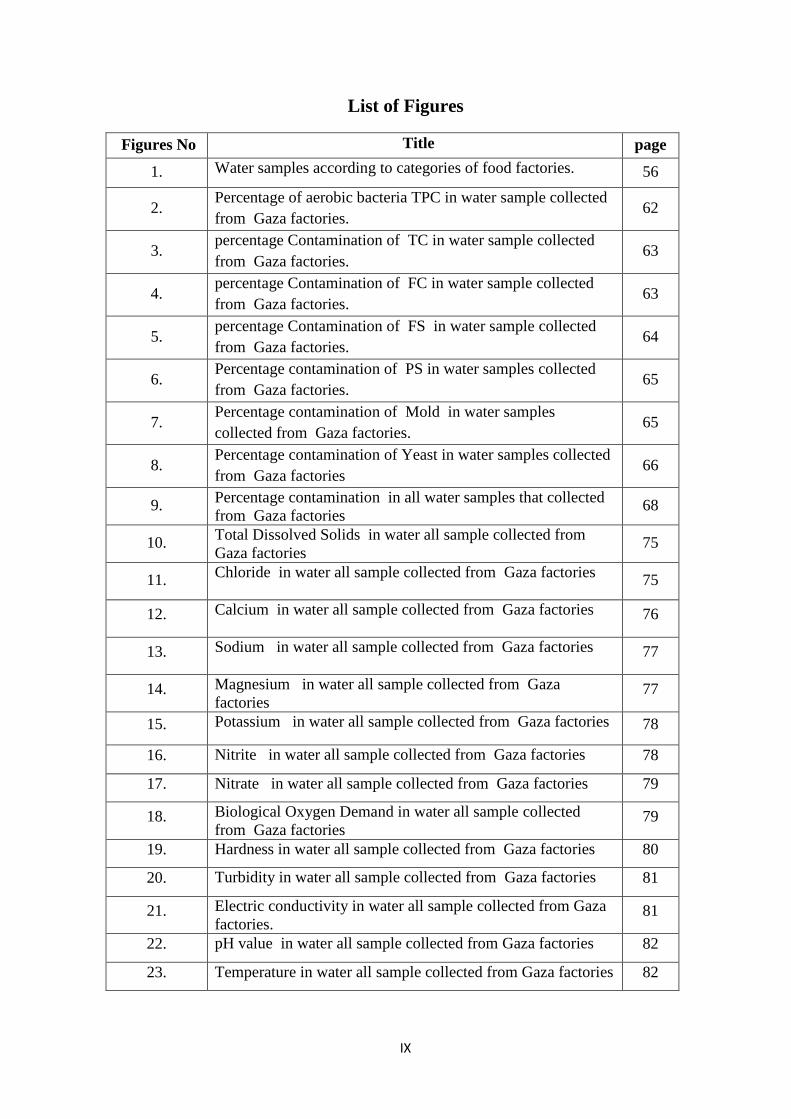
List of Figures
Figures No Title page
1. Water samples according to categories of food factories. 56
2. Percentage of aerobic bacteria TPC in water sample collected
from Gaza factories. 62
3. percentage Contamination of TC in water sample collected
from Gaza factories. 63
4. percentage Contamination of FC in water sample collected
from Gaza factories. 63
5. percentage Contamination of FS in water sample collected
from Gaza factories. 64
6. Percentage contamination of PS in water samples collected
from Gaza factories. 65
7. Percentage contamination of Mold in water samples
collected from Gaza factories. 65
8. Percentage contamination of Yeast in water samples collected
from Gaza factories 66
9. Percentage contamination in all water samples that collected
from Gaza factories 68
10. Total Dissolved Solids in water all sample collected from
Gaza factories 75
11. Chloride in water all sample collected from Gaza factories
75
12. Calcium in water all sample collected from Gaza factories 76
13. Sodium in water all sample collected from Gaza factories 77
14. Magnesium in water all sample collected from Gaza
factories 77
15. Potassium in water all sample collected from Gaza factories 78
16. Nitrite in water all sample collected from Gaza factories 78
17. Nitrate in water all sample collected from Gaza factories 79
18. Biological Oxygen Demand in water all sample collected
from Gaza factories 79
19. Hardness in water all sample collected from Gaza factories 80
20. Turbidity in water all sample collected from Gaza factories 81
21. Electric conductivity in water all sample collected from Gaza
factories. 81
22. pH value in water all sample collected from Gaza factories 82
23. Temperature in water all sample collected from Gaza factories 82
X
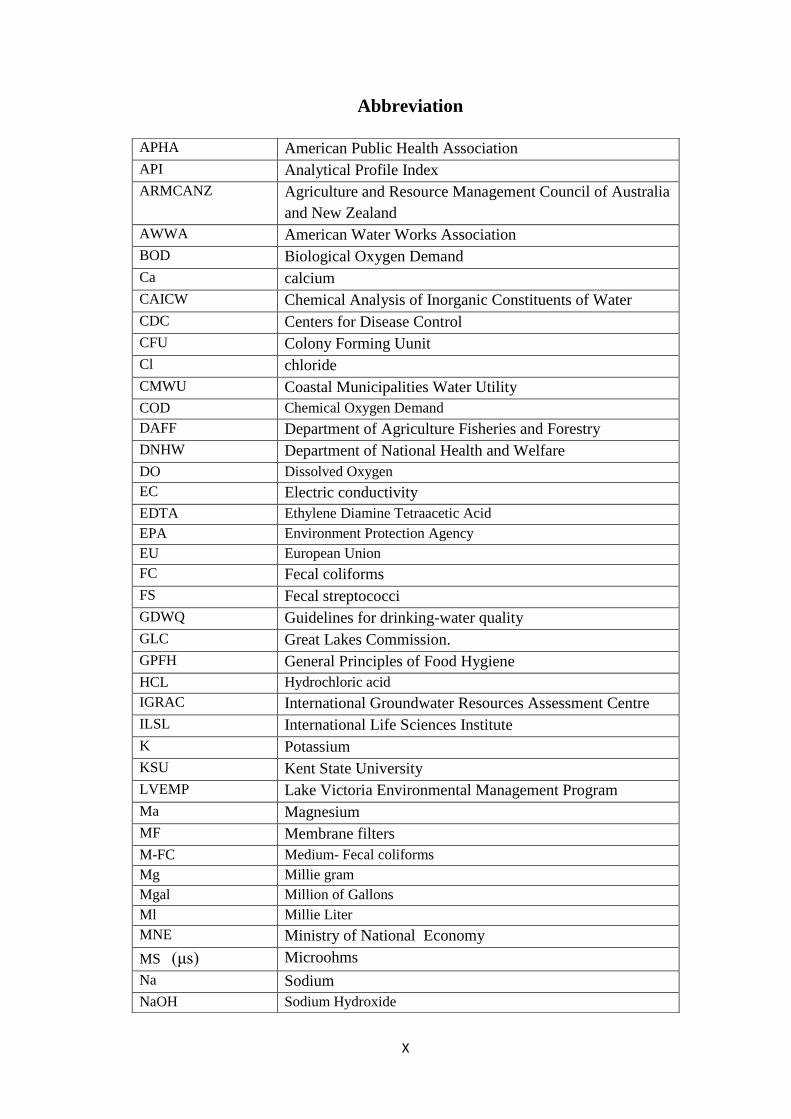
Abbreviation
APHA American Public Health Association
API Analytical Profile Index
ARMCANZ Agriculture and Resource Management Council of Australia
and New Zealand
AWWA American Water Works Association
BOD Biological Oxygen Demand
Ca calcium
CAICW Chemical Analysis of Inorganic Constituents of Water
CDC Centers for Disease Control
CFU Colony Forming Uunit
Cl chloride
CMWU Coastal Municipalities Water Utility
COD Chemical Oxygen Demand
DAFF Department of Agriculture Fisheries and Forestry
DNHW Department of National Health and Welfare
DO Dissolved Oxygen
EC Electric conductivity
EDTA Ethylene Diamine Tetraacetic Acid
EPA Environment Protection Agency
EU European Union
FC Fecal coliforms
FS Fecal streptococci
GDWQ Guidelines for drinking-water quality
GLC Great Lakes Commission.
GPFH General Principles of Food Hygiene
HCL Hydrochloric acid
IGRAC International Groundwater Resources Assessment Centre
ILSL International Life Sciences Institute
K Potassium
KSU Kent State University
LVEMP Lake Victoria Environmental Management Program
Ma Magnesium
MF Membrane filters
M-FC Medium- Fecal coliforms
Mg Millie gram
Mgal Million of Gallons
Ml Millie Liter
MNE Ministry of National Economy
MS (μs) Microohms
Na Sodium
NaOH Sodium Hydroxide

XI
NHMRC National Health and Medical Research Council
NIH National Institutes of Health
Nm Nanometer
NO2 Nitrite
NO3 Nitrate
NRC National Resources Council
NRCC National Research Council of Canada
NTU Nephelometric Turbidity Unit
NWAC National Water Awareness Campaign
OECD Organisation for Economic Co-operation and Development
ONPG o-nitrophenyl-β-D-galactoside
PCBS Palestinian Central Bureau of Statistics
PCL Prevention and Control of Legionella
PS Pseudomonas aeruginosa
PWA Palestinian Water Authority
RWPH Region of Waterloo Public Health
SCA Statistics, Commonwealth of Australia
T Turbidity
TC Total Coliform
TDS Total dissolved solids
TFST Trends in Food Science & Technology.
TH Total Hardness
TPC Total Plate Count
UNEP United Nations Environment Programme
UNWW United Nations World Water
USA United States
USEPA United States . Environmental Protection Agency
UV Ultra Violet
WHO World Health Organization
WWAP World Water Assessment Programme
XII
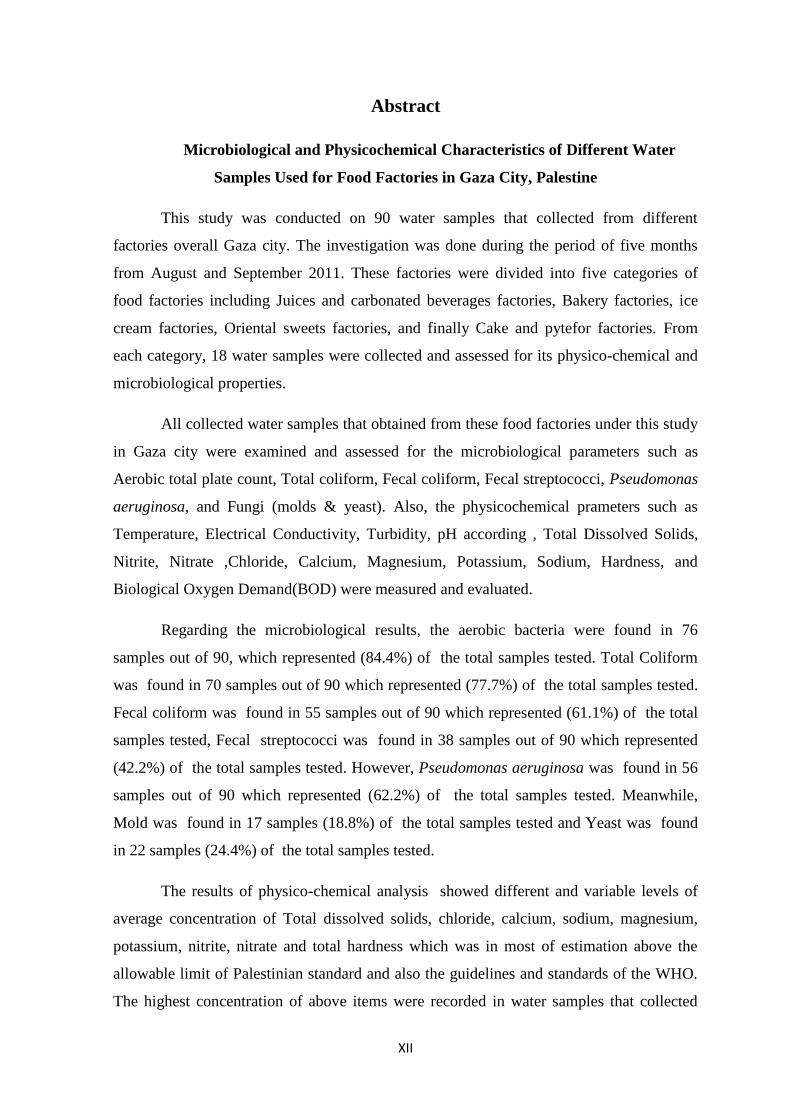
Abstract
Microbiological and Physicochemical Characteristics of Different Water
Samples Used for Food Factories in Gaza City, Palestine
This study was conducted on 90 water samples that collected from different
factories overall Gaza city. The investigation was done during the period of five months
from August and September 2011. These factories were divided into five categories of
food factories including Juices and carbonated beverages factories, Bakery factories, ice
cream factories, Oriental sweets factories, and finally Cake and pytefor factories. From
each category, 18 water samples were collected and assessed for its physico-chemical and
microbiological properties.
All collected water samples that obtained from these food factories under this study
in Gaza city were examined and assessed for the microbiological parameters such as
Aerobic total plate count, Total coliform, Fecal coliform, Fecal streptococci, Pseudomonas
aeruginosa, and Fungi (molds & yeast). Also, the physicochemical prameters such as
Temperature, Electrical Conductivity, Turbidity, pH according , Total Dissolved Solids,
Nitrite, Nitrate ,Chloride, Calcium, Magnesium, Potassium, Sodium, Hardness, and
Biological Oxygen Demand(BOD) were measured and evaluated.
Regarding the microbiological results, the aerobic bacteria were found in 76
samples out of 90, which represented (84.4%) of the total samples tested. Total Coliform
was found in 70 samples out of 90 which represented (77.7%) of the total samples tested.
Fecal coliform was found in 55 samples out of 90 which represented (61.1%) of the total
samples tested, Fecal streptococci was found in 38 samples out of 90 which represented
(42.2%) of the total samples tested. However, Pseudomonas aeruginosa was found in 56
samples out of 90 which represented (62.2%) of the total samples tested. Meanwhile,
Mold was found in 17 samples (18.8%) of the total samples tested and Yeast was found
in 22 samples (24.4%) of the total samples tested.
The results of physico-chemical analysis showed different and variable levels of
average concentration of Total dissolved solids, chloride, calcium, sodium, magnesium,
potassium, nitrite, nitrate and total hardness which was in most of estimation above the
allowable limit of Palestinian standard and also the guidelines and standards of the WHO.
The highest concentration of above items were recorded in water samples that collected

XIII
from bakery factories, while the lowest levels were recorded in Juices and carbonated
beverages factories.
The average concentration of BOD5 in all tested water samples was (1.27mg/L).
The average concentration of turbidity in the all water samples was (0.28mg/L). The
average value of EC and pH in all water samples was (1319.30mg/L) and (6.96mg/l)
respectively. Finally, the average value of temperature in all water samples was
(28.26mg/l).

1
1. Introduction
The earth's surface is 75% water, but out of this only 3% is fresh water, of which only 1%
is available for people to use. Water sustains life for humans, animals and plants. People
need water for basic everyday activities like drinking and cooking, but water is also very
important for the fuelling of agriculture and industry, and plays an important role in the
nature of national economies (NWAC, 2003).
Water is a vital medium used for many different purposes in the food industry. The
quality of water used in food factories can be critical with respect to product quality/safety
in the marketplace, the reliability of production processes and the safety of personnel in the
workplace. Water used in manufacturing operations must be safe in microbiological and
toxicological terms and available at, or treated to, a specified quality. (TFST, 2005).
The water for food processing mainly includes the water for raw materials, the water for
processing and the water for cleaning, etc. The water quality directly affects the food
quality. The processing enterprises must ensure that the quality of water for food
processing is required to be inspected by hygiene and should meet the related standards of
hygiene. In order to ensure the food quality, except that the quality of water for food,
processing should meet the standards of drinking water, some components in water still
need to be strictly controlled. Therefore, a comprehensive understanding of the quality of
water for food processing has played an important role in the guarantee of food quality
(Wujie et al., 2011 ).
Food processors are ultimately responsible for the safety of their products. The design
and implementation of food safety programs, whether they are mandated or used by
industry on a voluntary basis, should address potential food contamination from water
usage, and include deviation procedures in case of adverse water events (GPFH, 2006).
There are no permanent surface water in Gaza Strip like rivers and lakes. Groundwater
is the only source for drinking water, agriculture and food factories.
The water resources in the Gaza Strip depend mainly on groundwater, which is
partially renewed from rainfall (Sami and Ibrahim 2001). The groundwater is recharged
from several sources, which include rainwater, sewage irrigation, sewage infiltration, and
seawater intrusion. Influx of salt and contaminants from anthropogenic sources

2
contributing to the deterioration of water quality in the coastal aquifer in both Gaza and
Israel (Bachmat and Khalid 2000).
Currently only 10% of the water used in Gaza meets World Health Organization
(WHO) drinking water standards. Salinity of the coastal aquifer's groundwater has been
constantly increasing over time, due to seawater intrusion and the excessive
withdrawal of water, far exceeding the natural recharge (Assaf, 2001; Al-Agha and
Mortaja, 2005).
The estimated quantity of water consumed by the health care centers in the Palestinian
territory was 208.0 thousand cubic meters/month in 2008, of which 132.9 thousand cubic
meters/month in the West Bank and 75.1 thousand cubic meters/month in Gaza Strip. In
2008 it was estimated at 175.5 thousand cubic meters/month in the Palestinian territory
(PCBS, 2009).
In the Gaza Strip, there are 2520 manufacturing units registered in the Ministry of
National Economy. There are about 350 factories, and food manufacturing units in Gaza
city. There are approximately 160 factory and manufacturing food units, an imposter part
of these registered factories at the Ministry of National Economy were closed. However,
others were stopped working due to the Israeli aggression and complete siege on Gaza
Strip (MNE, 2011).
3
2. Objectives
1- Evaluating the rate of microbial contamination in water used for food
factories in Gaza city.
2 - Evaluating the chemical and physical properties of water used for
food factories in Gaza city.
3 -To investigate and demonstrate the sources of contamination in water
used for food factories.
4 - Knowledge of the validity of the water used in food processing factories.

4
3. Review of Literature
3.1 Water sources
The sole fresh water resource of Gaza (Household, agricultural, industrial, tourist) is the
coastal aquifer, which also runs beneath the coast of Israel. In contrast to the West Bank
situation, Gaza is ―downstream‖ of the portion of the aquifer that underlies Israel, with
flows coming from Israel into the Gaza portion of the aquifer. With normal flows, the
current sustainable yield of the aquifer segment underlying Gaza is estimated at about 57
Millions of cubic meters, around 15% of the total yield of the shared aquifer, which is
estimated at 360-420 Millions of cubic meters. Abstractions in recent years have been
running well above any estimate of sustainable yield. The overdraft is (Currently, 2008)
estimated at 100 Millions of cubic meters, almost 200 % (PWA and CMWU, 2009).
Groundwater is now a significant source of water for human consumption, supplying
nearly half of all drinking water in the world (WWAP, 2009), and around 43% of all water
effectively consumed in irrigation (Siebert et al., 2010). Also considerably modified local
and global water cycles, environmental conditions and ecosystems. As of 2010 the world‘s
aggregated groundwater abstraction is estimated at approximately 1,000 km3 per year –
about 67% of which is used for irrigation, 22% for domestic purposes, and 11% for
industrial purposes (IGRAC, 2010; Margat, 2008; Siebert et al., 2010).
The best quality drinking water is usually the groundwater which passes through fine
pores of soil layers that changes its composition and properties, absorbing the
compounds that are not desirable to be present in drinkable water. Groundwater is free
from organic substances, safe from the viewpoint of bacteriology; it has the correct
temperature and constant composition. The temperature of groundwater depends on the
depth of the layers it is taken from, but common ground waters have temperatures from 5
to 13 C (Chemistry and Biology, 1993).
Precipitation delivers water unevenly over the planet from one year to the next. There
can be considerable variability between arid and humid climates and wet and dry seasons.
As a result, distribution of freshwater supplies can be erratic with different countries and
regions receiving different quantities of water over any given year. The state of water

5
resources is also influenced by withdrawals to meet socio-economic demands. These are in
turn influenced by population growth, economic development and dietary changes, as well
as by control measures exerted to protect settlements in flood plains and drought-prone
regions (UNWW, 2012).
Groundwater is a valuable natural resource; it occurs almost in all geological formations
beneath the earth surface not in a single widespread aquifer but in thousands of local
aquifer systems with similar characteristics (Vasanthavigar et al., 2010).
The ground water usually contains very few bacteria because of the effective natural
filtering action of the soil and several other controlling factors i.e. temperature, salt
concentration and pH (Geldreich, 1990; Kimberly et al., 2005). The lack of basic sanitation
and lack of access to safe water supplies constitute the cause of water borne diseases in
developing countries (Nanan et al., 2003; Jensen et al., 2004; Haruna et al., 2005).
3.2 Water pollution
Sanitary drinking water is an essential prerequisite for good health, because it is
necessary to sustain life as well as personal and general hygiene. World Health
Organization ranked the quality of drinking water in the twelve indicators health status of
the population of a country, which confirms its important role in protecting and improving
health (WHO, 2008). The importance of drinking water is reflected primarily in its
physiological role in the body, or in maintaining the metabolic processes and the exchange
of substances, toxicological-epidemiological importance, because through the water can
develop and transmit bacterial, viral and parasitic diseases, and toxicological role, if they
are in drinking water contaminants are present in higher concentrations than allowed
(Rajković, 2003).
The effects of drinking contaminated water results in thousands of deaths every day,
mostly in children under five years, in developing countries (WHO, 2004). The World
Health Organization in its ―Guidelines for drinking water quality‖ publication highlighted
at least seventeen different and major genuses of bacteria that may be found in tap water
which are capable of seriously affecting human health (WHO, 2006). In addition, diseases
caused through consumption of contaminated water, and poor hygiene practices are the
leading cause of death among children worldwide, after respiratory diseases (WHO, 2003).
6
Each year, seven million people are estimated to become ill in the United States, and
more than 1,000 die from disease-causing microbes in drinking water (Morris and Levin,
1995). Likewise, food borne diseases cause approximately 76 million illnesses, 325,000
hospitalizations and 5,000 deaths in the United States each year.( Mead el al., 1999). This
number has increased in the past decade due in part to better reporting, globalization of
food supply, introduction of new pathogens in new areas, the development of new
virulence factors by microbes (physiological characteristics changes, immunity decreases,
and changes in agricultural practices such as the reuse of wastewater for irrigation or
manure for fertilizers affecting their pathogenicity, such as the ability to produce toxins
(Carr, 2000).
Water quality has been deteriorating, and there is an increase of seawater intrusion. Now
5-10% of the portion of the aquifer underlying Gaza is drinkable, with more than 90% of
all 150 municipal wells having salt and nitrate levels above WHO standards and so unfit
for human consumption (PWA and CMWU, 2009). Gaza cannot supply itself but must find
new or alternative sources of water, which could be derived from bulk importation,
desalination, and waste water reuse. Both a pipeline from Israel to supply the 5 Millions of
cubic meters annually agreed upon in Article 40, and a large Gaza desalination plant have
been envisaged, but to date neither has been implemented(West Bank And Gaza, 2009).
The pollution of groundwater is contributing to two main types of water contamination
in the Gaza Strip. First, and most importantly, it is causing the nitrate levels in the
groundwater to increase. In most parts of the Gaza Strip, especially around areas of
intensive sewage infiltration, the nitrate level in groundwater is far above the WHO
accepted guideline of 50 mg/liter as nitrates (Palestinian Water Authority, 2002). Second,
because the water abstracted now is high in salt, the sewage is also very saline and hence
infiltrating sewage only adds to the salinity of the aquifer (UNEP, 2009).
Many years of over-pumping have resulted in seawater intrusion and upcoming of saline
groundwater. Furthermore, human activities including agriculture and inadequate
wastewater disposal have increased groundwater contamination levels. Intensive
cultivation and efforts to boost production have led to excessive use of fertilizers,
pesticides, herbicides and soil fumigants, while collection, treatment and disposal of

7
wastewater and solid waste (including hazardous materials) are inadequate in many areas
in Gaza city and Jabalia camp and Gaza strip as well (UNEP, 2003).
Contamination of ground water with nitrate is a global problem. The use of synthetic
fertilizers is a necessary practice in the production of food and fiber to meet the growing
needs of human and livestock consumption (Nolan. 2001).Population explosion, hap
hazardous rapid urbanization, industrial and technological expansion, energy utilization
and wastes generation from domestic and industrial sources have rendered many water
resources unwholesome and hazardous to man and other living resources. Water pollution
is now a significant global problem (Anetor, 2003).
Water, like food, is a potential vehicle for the direct transmission of agents of disease and
continues to cause significant outbreaks of disease in developed and developing countries.
For example, drinking water was identified as the source of a significant and fatal outbreak
of Escherichia coli O157:H7 in Canada (Kondro, 2000). Water is, therefore, also capable
of introducing contamination into food if appropriate care is not taken. In 1970, a cholera
epidemic in Jerusalem (Israel) was traced back to the consumption of salad vegetables
irrigated with raw wastewater (Shuval et al., 1986).
3.3 Water and Food Industry
The quality of water defined by the guidelines is such that it is suitable for all normal uses
in the food industry. Some processes have special water quality requirements in order to
secure the desired characteristics of the product, and the guidelines do not necessarily
guarantee that such special requirements are met. Deterioration in drinking-water quality
may have severe impacts on food processing facilities and potentially upon public health.
The consequences of a failure to use water of potable quality will depend on the use of the
water and the subsequent processing of potentially contaminated materials. Variations in
water quality that may be tolerated occasionally in drinking-water supply may be
unacceptable for some uses in the food industry. These variations may result in a
significant financial impact on food production (WHO, 2008).
The water for food processing should meet the sanitation standards of national living
drinking water, which can‘t contain the pathogenic microorganisms. The chemicals in
water mustn‘t be harmful to human health. The radioactive materials in water mustn‘t be
8
harmful to human health. The sensory properties are good and it must be conducted the
disinfection treatment. The pathogenic bacteria should not be contained and the total
content of bacteria should be low. The total number of bacteria should not be more than
100 in 1ml water and the coliform shouldn‘t be detected. The water for food processing
mainly refers to the natural water and the natural water includes the surface water and the
underground water. The surface water flows through the ground, containing some
impurities such as the clay, the sand, the weeds, the humus, the calcium magnesium salts,
other salts and bacteria. In order to make the upscale food, the first thing is to have the fine
water.Where the water treatment may enable the common water to achieve the
requirements of water for food processing (Wujie et al., 2011).
Water is essential for life. The world‘s population withdraws approximately 4,000 cubic
kilometers of fresh water annually. Of this amount, 69% is used for agriculture, 23% by
industry and 8% for domestic purposes (OECD, 2001). The food water industry uses water
for beer (0.03%), soft drinks (0.01%) and bottled water (0.004%). Water is also essential
for the Food and drinking industry. It is required for most manufacturing processes and is
used by consumers in preparation of food. It is a key ingredient for the beverage and
bottled water sectors. The food water industry uses water in a variety of ways in its
manufacturing processes, including washing, boiling, and extraction and for reconstitution
of dried raw materials. Water consumption varies greatly between sectors.
Manufacturing is an important part of the supply chain. In the context of the food
Water industry, manufacturing can be defined as the variety of processes by which raw
materials are transformed into safe, convenient, high quality food and drink products (EU
and United Nations Environment Program, 2002).
The majority of factories did not have acceptable program for sampling of consumed
water and chemical and microbial analyzing and only water of boilers was controlled for
hardness and alkalinity levels. Unfortunately occurrence of heavy metals and pesticides in
water was not being investigated. Most of authorities had not adequate awareness and
specialty about water pollution and water quality control at 45% of studied industries of
East Azerbaijan (Mosaferi, 2007).
Major water uses in the food manufacturing industry may include:
washing/rinsing/hosing, cooling and refrigeration systems, boilers and heating and as an

9
ingredient in the product. Some common water saving options for the food manufacturing
industry are summarized in the following table, though note, other more specific
opportunities may still exist at your site for you to investigate. Savings and cost estimates
are indicative only. Specific estimates based on your operations should be made before
implementing an option (Water saving factsheet, 2008).
Pathogens discharged into water sources do not normally multiply (with a few
exceptions), but bacterial growth in food products can be an important factor in food-borne
disease (ILSI 2008). Drinking water is often consumed without further processing, but
water that enters the food cycle may be processed further (e.g. canning, cooking), which
will reduce risk from getting food-borne disease (ILSI 2008).
Cryptosporidium spp. is distributed worldwide and has low susceptibility to the
treatment processes used for most bacteria. In particular, they are extremely resistant to
chlorination and some UV treatments. The most suitable technologies that might be applied
in treating water in the food industry are sand or cartridge filtration (membrane filtration, 1
micron) and heat (70°C for 2 min) (Dawson, 2000).
Pollution causes the water to become unsuitable for various uses and also difficult and
more expensive to treat to acceptable quality for use. The nature of emissions and effluents
from industries are varied and industry specific (Phiri et al., 2005).
Although not a major user of water itself, the availability of water for growing and
processing food is a critical issue for the industry. Water has already become scarce in
some of the main food and fiber producing regions of Australia. The food processing sector
uses more water than any other manufacturing sector, consuming 33 per cent of the
combined 3 per cent of total water use consumed by all manufacturing industries (DAFF
and SCA, 2008). However, this is significantly lower than the 66 per cent consumed in
agriculture and the 11 per cent consumed by households (DAFF and SCA, 2008).
Most common uses for water in the food processing industry are washing/cleaning food
and equipment, pasteurization, cooking, and sterilization. It can also be used as an additive
in canned fruits and vegetables (David 1990). How water is used among various food
processing sectors can differ substantially. For sugar production, roughly half of the intake
water is used for cooling and 20% or less for actual processing. Beverage manufacturers
also use large quantities of water for cooling, although they require slightly more process

10
water than cooling water. On the contrary, for meat processing and fruit preservation,
about 60% of the intake water is used as process water (David, 1990). Food processing
techniques have not changed much over the last several decades. Despite this technological
inertia, the food processing industry has shown a trend of decreasing water use since the
mid-1950s. Water use peaked in 1968 at 2,100 Mgal/day but dropped to 1,500 Mgal/day by
1983. Over the same time period, per unit water use declined from 13.1 gallons to 8.6
gallons (David 1990). Most of the decrease in water use has been a direct result of effluent
regulation compliance. The food processing industry has maintained similar recycling
ratios over the past several decades while most other industries have doubled their
respective rates (GLC, 1996).
Diminishing quality water supplies, increasing water purchase costs, and strict
environmental the of effluent standards are forcing industries to target increased water-
efficiency and reuse. These factors, in combination with an estimated fivefold increase in
worldwide manufacturing water use by 2030, will contribute to growing industrial water-
related expenses in the near future (Royal 2000).
3.4 Microbiological quality of water
Microorganisms are widely distributed in nature, and their abundance and diversity may
be used as an indicator for the suitability of water (Okpokwasili and Akujobi, 1996).
Infectious diseases caused by pathogenic bacteria, viruses and parasites (e.g. protozoa
and helminthes) are the most common and widespread health risk associated with drinking-
water. The public health burden is determined by the severity and incidence of the illnesses
associated with pathogens, their infectivity and the population exposed. In vulnerable
subpopulations, disease outcome may be more severe (WHO, 2011).
The greatest risk to public health from microbes in water is associated with
consumption of drinking-water that is contaminated with human and animal excreta;
although other sources and routes of exposure may also be signify cant. This chapter
focuses on organisms for which there is evidence, from outbreak studies or from
prospective studies in non-outbreak situations, of diseases being caused by ingestion of
drinking-water, inhalation of water droplets or dermal contact with drinking-water and
their prevention and control. For the purpose of the Guidelines, these routes are considered
waterborne (WHO, 2011).
11
Exposure to bacteria in water occurs primarily by drinking contaminated water, or
accidentally swallowing it when bathing or brushing your teeth. Exposure can also happen
from eating food off a plate that is still wet from recently washing it, ice, and washed fruits
and vegetables that are eaten raw (EPA, 2006).
3.4.1 Total Plate Count (TPC)
Heterotrophic bacteria are a broad class of organisms that use organic nutrients for
growth. The group includes harmless environmental bacteria, virtually all pathogenic
bacteria, and opportunistic pathogens (bacteria that cause a disease in a comprised host but
that are unlikely to cause a disease in an uncompromised host). Opportunistic pathogens
include strains of Pseudomonas aeruginosa, Acinetobacter spp., Aeromonas spp.,
Klebsiella pneumoniae, and others. However, these opportunistic pathogens arenot
detected with the media used for heterotrophic plate determination (WHO, 2002).The
number of heterotrophic bacteria recovered from a water sample will depend on the
procedures and isolation medium used, and on the interaction among the developing
colonies (APHA, 1995).
Heterotrophic bacteria obtain their carbon and energy from organic compounds. They
are commonly found in natural waters and are widespread in soils. These bacteria are
present in groundwater in relatively low numbers but can rapidly multiply, especially at
elevated summer temperatures. (Gleeson and Gray, 1997). The heterotrophic plate count
heterotrophic plate represents the aerobic component of this microflora and although it has
little sanitary value, it is useful as an indicator of general quality of water supply and to
some extent of the standard of treatment or the microbiological condition of the
distribution system (ARMCANZ/NHMRC, 1996).
The heterotrophic plate count (HPC) test can be used for monitoring the overall
bacteriological quality of drinking water. heterotrophic plate results are not an indicator of
water safety and, as such, should not be used as an indicator of adverse human health
effects. heterotrophic plate results give an indication of overall water quality in public,
semi-public1, and private systems. In groundwater not under the direct influence of surface
water, HPC levels are generally low and stable over time. In surface water and
groundwater under the direct influence of surface water, HPC should be minimized
through effective treatment and disinfection and remain constant over time. In both
12
disinfected and non-disinfected systems, sudden increases in heterotrophic plate above
normal baseline levels can indicate a change in raw water quality or a problem such as
bacterial re-growth in the distribution system or plumbing. Steady increases in
heterotrophic plate over time indicate a gradual decline in raw water quality or in the
condition of the system. Increases in heterotrophic plate in disinfected systems can
indicate a problem with drinking water treatment. If an increase in heterotrophic plate
values does occur, the system should be inspected and the cause determined. Boil water
advisories 2 should not be issued based solely on heterotrophic plate results. Corrective
actions should be taken, if deemed necessary, after discussions with the responsible
authority (Health Canada, 2006).
Unlike other indicators, such as Escherichia coli or total coliforms, low concentrations
of HPC organisms will still be present after drinking water treatment. In general, water
utilities can achieve heterotrophic bacteria concentrations of 10 colony-forming units
(CFU) per milliliter or less in finished water (Fox and Reasoner, 1999). Within a
distribution system, increases in the density of HPC bacteria are usually the result of
bacterial re-growth. The density reached can be influenced by the bacterial quality of the
finished water entering the system, temperature, residence time (i.e., stagnation), presence
or absence of a disinfectant residual, construction materials, surface-to-volume ratio, flow
conditions, the availability of nutrients for growth (Prévost et al., 1997; Payment, 1999).
The range of heterotrophic bacteria usually measured in drinking water is <0.2 CFU/ml
to 10,000 CFU/ml or higher (Allen et al., 2002). No validated epidemiological evidence
links consumption of high levels of heterotrophic bacteria in drinking water to increased
health risks (Leclerc, 2002).
There has been a dramatic increase in infections caused by microorganisms, including
certain heterotrophic microorganisms that are found in water (Huang et al. 2002). We have
shown that on average 60 – 90 % of the microorganisms in water are biochemically active
and living; this is a markedly greater proportion than was determined using the
Heterotrophic Plate Counts method (Berney, 2007; Berney, 2008). Melad, (2002) in a
study of groundwater wells in the Gaza Strip. Found heterotrophic plate in wells and found
the highest number of colonies was 750 CFU / ml

13
In a study that performed to undertake a preliminary assessment of the groundwater
quality of the West Thrace region, forty groundwater samples collected from Edirne and
Canakkale were assessed for their suitability for human consumption. Eight water samples
(20%) had heterotrophic plate counts exceeding the European Union and Turkish Water
Directive limit of 20 cfu/ml in drinking water and the maximum number of bacteria as 44
cfu/ml. (Aydin, 2006).
Also in study of El-Salam canal which is a potential project reusing the Nile Delta
drainage water for Sinai desert agriculture, the authors assist the microbial and chemical
water quality. Representative water samples were manually collected during the seasons
winter, spring, summer, and autumn of two successive years (2003/2004 and 2004/2005).
They found total count bacteria at 37 °C between (32–39000 cfu/1 ml) (Othman et al.,
2012).
3.4.2 Total coliform
Total coliforms represent only about 1% of the total population of bacteria in human
feces in concentrations of about 1000000000 bacteria per gram (Brenner et al., 1982).
Total coliforms include species that may inhabit the intestines of warm-blooded animals or
occur naturally in soil, vegetation, and water. They are usually found in fecally-polluted
water and are often associated with disease outbreaks. Although they are not usually
pathogenic themselves, their presence in drinking water indicates the possible presence of
pathogens. E. coli, one species of the coliform group, is always found in feces and is,
therefore, a more direct indicator of fecal contamination and the possible presence of
enteric pathogens. In addition, some strains of E. coli are pathogenic (Federal , 1985).
The total coliform group belongs to the family enterobacteriaceae and includes the
aerobic and facultative anaerobic, gram-negative,non-spore-forming, rod-shaped bacteria
that ferment lactose with gas production within 48 hours at 35 C (APHA, 1998).The group
consists of several genera of the family Enterobacteriaceae, including species of
Enterobacter, Klebsiella, Citrobacter, and E. coli. Total coliforms may be of fecal origin,
but also survive and grow in the environment (Flint, 1987; Pommepuy et al., 1992). Total
coliforms have been used as an indicator of drinking water quality since the early 1900s.
The rationale for using total coliforms in this manner is based on their presence in large
14
numbers in the gut of humans and other warm blooded animals, allowing their detection
even after extensive dilution (Stevens et al., 2001).
Most coliforms are present in large numbers among intestinal flora of humans and other
warm-blooded animals, and are thus found in fecal wastes (Dorothy, 1998). As a
consequence, coliforms, detected in higher concentrations than pathogenic bacteria, are
used as an index of the potential presence of entero-pathogens in water environments
(Rompré, 2002). Human fecal material is generally considered to be greater risk to human
health as it is more likely to contain human enteric pathogens (Scott et al., 2003).Total
coliforms be removed as an indicator of fecal contamination in the Australian Drinking
Water Guidelines (NHMRC-ARMCANZ, 1996).
The presence of coliform bacteria in potable water indicates unsuitable sanitation
practices. Such occurrences may be a result of poor water treatment, plant design
problems, improper operating procedures, inadequate hygienic practices in plant operation,
or after growths in the distribution system (Geldteich, 1996).
Although coliform organisms may not always be directly related to the presence of fecal
contamination or pathogens in drinking water, the coliform test is still useful for
monitoring the microbial quality of drinking water (WHO, 1997). Confirmed that only E.
coli is considered as a specific and reliable indicator of fecal pollution of water; since the
more general test for Fecal Coliforms also detects thermotolerant non-fecal coliform
bacteria.(Neimi et al., 2001).
The effects of sunlight did show some correlation with the total coliform and E. coli
concentrations; although not as much as in other experiments which support the theory that
sunlight is one of the most powerful factors in bacterial inactivation (Whitman 2004).
Total and fecal coliforms were detected in Nile water at Greater Cairo in 100%of the
tested samples reaching 104 and 103 cfu/100 ml respectively. (Shash et al., 2010). Melad,
(2002) found total coliform were isolated from 17 wells in summer season and the count
rang between (2-130 cfu/100ml) in his study that was aimed to evaluation of ground water
pollution with waste water microorganisms in Beth Lahia, Gaza Strip.
In a study on Microbiological Assessment of Marketed Drinking Water in Gaza City,
Palestine, Tartory (2009) found that the most prevalent type of bacterial contamination was

15
total coliforms. Twelve samples (60%) were contaminated with total coliforms range from
(1-50 cfu/100ml) of the desalination plant. Also six samples(50%) out of 12 samples were
contaminated with total coliforms range between (1-20 cfu/100ml) in the water distribution
car. However, out of 1056 water samples from rain-fed cisterns tested in Gaza Strip for
total Coliform (TC) and fecal Coliform (FC), 8.6% and 3.9% of the samples exceeded the
WHO limits for total coliform and fecal Coliform, respectively.
3.4.3 Fecal coliforms
Fecal coliforms are thermotolerant bacteria that include all coliforms that can ferment
lactose at 44.5 °C. The fecal coliform group comprises bacteria such as Escherichia coli or
Klebsiella pneumonia. (APHA, 1998). A more logical approach is the detection of
organisms normally present in the feces of humans and other warm-blooded animals as
indicators of fecal pollution as well as water treatment and disinfection efficacy. The
indicators should respond to natural environmental condition in water treatment processes.
The indicator should be easy to isolate, identify and enumerate from the aquatic
environment (WHO, 2004 and APHA, 2005).
Coliform bacteria are a general name for a variety of bacteria, including fecal coliform
and E. coli bacteria. Bacteria generally enter the drinking water system through cracks in
lines or wells. Coliform bacteria does not necessarily mean that there is fecal coliform or E.
coli bacteria, but follow-up testing is required to verify whether there is a problem.
Fecal coliform and E. coli are more dangerous bacteria that come from animal and
human waste, generally from poorly maintained or constructed septic systems, cracks in
sewer lines, or animal waste near a water source.(EPA, 2006). Fecal indicator bacteria like
total coliforms, fecal coliforms (thermotolerant coliforms), E. coli and intestinal
enterococci (fecal streptococci) are excreted by humans and warm-blooded animals, pass
sewage treatment plants to a great amount and survive for a certain time in the aquatic
environment (Kavka & Poetsch 2002). E. coli and fecal coliforms are the best indicators
for the assessment of recent fecal pollution, mainly caused by raw and treated sewage and
diffuse impacts e. g. from farm land and pasture. E. coli and fecal coliforms indicate also
the potential presence of pathogenic bacteria, viruses and parasites (Kavka & Poetsch
2002). Detailed knowledge of fecal pollution in aquatic environments is crucial for
16
watershed management activities in order to maintain safe waters for recreational and
economic purposes (Farnleitner et al. 2001).
E. coli bacteria are found within the fecal coliform group in smaller concentrations than
fecal coliform bacteria. E. coli were chosen as the secondary indicator of bacterial
contamination because they are a specific indicator of fecal pollution. E. coli inhabit the
gastrointestinal tract of warm-blooded animals and are an indicator of the presence of
intestinal pathogens that cause human diseases (Francy and others, 1993). Fecal indicator
bacteria in sediment have shown that sediment contains greater concentrations of fecal
coliforms than the overlying water. (Craig, 2004).
Niewolak, (1998) by only analyzing water, the amount of bacterial and pathogenic
concentration may be underestimated. Research has shown that sediment provides a more
suitable environment than water by offering protection from predators and insulation and
by providing higher concentrations of nutrients and organic carbon for bacteria. (Lee,
2006; Craig, 2002).
Higher concentrations of bacteria are believed to exist in sediment, because it provides a
more suitable environment for bacteria than water by providing larger amounts of nutrients
and carbon on particles, decreasing sunlight inactivation, and providing protection against
predators such as flagellates which are unable to graze on bacteria when they are attached
to sediment because of the particle‘s large size (Friesa 2008).
Yassin el al., (2006) found in Gaza strip that the major finding showed that the
contamination level of total and fecal coliform exceeded that of the World Health
Organization WHO limit for water wells and networks . Furthermore, the contamination
percentages in networks were higher than that in wells.
Giannoulis el al., (2000) in their study in Northwestern Greece found that the 36.8% of
the source water samples were found in conformity with WHO guidelines, 42.1 of low risk,
and 21.1% of intermediate risk while there no samples of high or very high risk. The color-
code classification for FC contamination was found as 36.8% A (blue, no risk), 42.1% B
(green low risk) and 21.1% C (yellow, intermediate risk).

17
Also, Bharath el al., (2002) found that of the 344 water samples tested, 262 (76.2%) and
82 (23.8%) were domestic and imported brands, respectively. Eighteen (5.2%) of the 344
samles contained coliforms with a mean count of 6.38 + - 0.88 coliforms per 100 ml, while
5 (1.5%) samples contained E. coli The prevalence of total coliform in domestic brands of
bottled water was (6.9%) as compared with (0.0%) detected in imported brands. Tartory,
(2009) found that six samples 30% were contaminated with fecal coliforms range between
(1-30 cfu/100ml) of the desalination plant. More over five sample (41.7%) out of 12
samples were contaminated with fecal coliforms range between (1-20 cfu /100ml) in the
water distribution car. In additition 4 sample (16%) out of 25 samples were contaminated
with fecal coliforms range between (1-10 cfu/100ml) (Tartory, 2009).
3.4.4 Fecal streptococci
The enterococci were included in the functional group of bacteria known as ―fecal
streptococci‖ and now largely belong in the genus Enterococcus which was formed by the
splitting of Streptococcus faecalis and Streptococcus faecium, along with less important
streptococci, from the genus Streptococcus (Schleifer and Klipper-Balz, 1984). There are
warm- now 19 species that are included as enterococci (Topley, 1997). Fecal streptococci
(FS) are consistently present in the feces of all warm-blooded animals and in the
environment associated with animal discharges (APHA, 1975). Which group comprises
Streptococcus faecalis, S. bovis, S. equinus and S. avium. Since they commonly inhabit the
intestinal tract of humans and blooded animals, they are used to detect fecal contamination
in water. Members of this group survive longer than other bacterial indicators but do not
reproduce in the environment. A subgroup of the fecal streptococci group, the enterococci
(E. faecalis and E. faecium, E. durans, E. gallinarum and E. avium) have the ability to
grow at 6.5% NaCl, high pH (pH=9.6) and high temperature (45C). This group has been
suggested as useful for indicating the presence of viruses, particularly in biosolids and
marine environment.(APHA, 1998).
A taxonomically heterogeneous cocci group associated with the gastrointestinal tract of
humans and animals is traditionally named ‗fecal streptococci‘. Recently, this group of
bacteria has been the subject of a taxonomical revision, essentially on the basis of cultural,
biochemical, serological and mainly genetic characteristics (Hardie and Whiley 1994;
Devriese et al. 1996; Leclerc et al. 1996).

18
None of the three investigated which points meet the microbiological standards for safe
drinking water. Coliform bacteria, Escherichia coli, Fecal Streptococci and Pseudomonas
aeruginosa exceeded severe the standards of the World Health Organisation and the
European Union on the quality of drinking water.( Ranson, 2012). Faecal streptococci as
indicators of pollution showed that the majority of enterococci (84%) isolated from
avariety of polluted water sources were ―true fecal species‖ (Pinto et al., 1999). Fecal
streptococci were isolated from 6 wells during summer season, where the mean count
recorded was (6 cfu/ml) in a study that aimed to evaluate the ground water pollution with
waste water microorganisms in Beth Lahia, Gaza Strip (Melad, 2002). Al- Khatib, (2009)
found of that the 4.8% were contaminated with Fecal streptococcus in Groundwater
(network-distributed) in his study on microbiological quality of desalinated water,
groundwater and rain-fed cisterns in the Gaza strip, Palestine.
3.4.5 Pseudomonas aeruginosa
Pseudomonas aeruginosa is a non-fermentative, aerobic, Gram-negative rod that
normally lives in moist environments. It has minimal nutrition requirements while being
able to use several organic compounds for growth. This metabolic versatility contributes to
a broad ecological adaptability and distribution, and reflects a genome of larger size and
complexity compared with that of many other bacterial species (Goldberg, 2000; Stover,
2000).
Pseudomonas aeruginosa is bacterium readily isolated from water and soil
environments. It is an opportunistic human pathogen frequently causing septicemia in burn
patients, chronic infections in individuals with cystic fibrosis, and urinary tract infections
in catheterized patients ( Kolter, 2010; Lyczak, 2000 ).
Pseudomonas aeruginosa can be isolated from a wide range of inanimate, animal, and
human environments, and can be found in a variety of geographic settings throughout the
world. Pseudomonas aeruginosa is widely distributed in moist environments, including
soil, water and sewage. (NIH, 1994). It can be found on and is occasionally pathogenic for
plants and vegetables. Strains isolated from leaf spot tobacco, identical with or similar to
Pseudomonas aeruginosa (Krieg, 1994). Pseudomonas aeruginosa has been advocated as a
mean of monitoring the hygienic quality of drinking water. It is used to assess the quality
of bottled water as its presence (Warburton, 1998).

19
Isolation of pathogenic and potentially pathogenic microorganisms such as Salmonella
sp., Staphylococcus sp., Aeromonas sp., Streptococcus sp. and Pseudomonas aeruginosa is
of highly importance and indicated that tap water is unsafe. The isolation of Pseudomonas
aeruginosa and Areomonas sp. indicated water quality deterioration and that
immunocompromise people are in risk and suggested that there may be connection
between the high cases of reported diarrhea and the isolated organisms. (Yagoub &
Ahmed, 2010)
Pseudomonas sp. are very common in water systems due to their ease of colonization
and they form thick biofilms which consequently has an effect on turbidity, taste and odour
of drinking water (WHO, 2006; Aquachem, 2009).
Pseudomonas sp. is opportunistic pathogens that have been implicated in water- and
food-borne diseases (Warburton, 1992; Warburton, 1993). Pseudomonas aeruginosa is the
most common pathogen responsible for both acute respiratory infections in ventilated or
immunocompromised patients and chronic respiratory infections in cystic fibrosis patients
(Chastre, 2000; Chastre, 2002).
Pseudomonas or Aeromonas may be a threat to human health due to their ability to
multiply in drinking waters (Havelaar, 1990). Pyogenic infection of injuries, meningitis,
urinary system, respiratory system, inflammation of the middle ear and eyes are typical
diseases caused by contaminated water where Pseudomonas aeruginosa are found (Rusin,
1997; Hernandez1997). Pseudomonas aeruginosa was found in only one sample of the tap
water of drinking water from dispensers in Italy (Liguori, 2010). Pseudomonas aeruginosa
has been detected in 24.1% of the water samples of drinking water from dispenser
(Baumgartner, 2006). In another study revealed that 3.6% of theexamined bottled water
samples were contaminated by P. aeruginosa representing (Abd El-Salam, 2008).
3.4.6 Mold and yeast
Fungi are ubiquitous in nature (Goncalves et al., 2006). They are present in and have
been recovered from a wide range of aquatic habitats including lakes, streams, distribution
systems, drinking water and also on the surface of drinking water reservoirs and
distribution pipes (Bitton, 2005). Fungi may cause some problems in drinking water. They
are involved in the production of taste and odors in water (Bitton, 2005; Goncalves et al.,
2006).
20
There are over 70,000 species of fungi. Fewer than 300 have been implicated in human
diseases, and fewer than a dozen cause about 90% of all fungus infections. They are
involved in different forms of diseases, including allergies to fungal antigens, production
of toxins, or direct invasion of hosts (McGinnis, 1996).
In addition, there is an increasingly number of severe fungal diseases by commensal or
fully saprophytic species in immuneocompromised hosts. These diseases are frequently
associated with abrogated host immunity as a result of viral infections, mainly the human
immunodeficiency virus, hematological and hormonal disorders, organ transplants,
antibiotic usage, and more intensive and agressive medicals practices (Van Burik and
Magee, 2001).
Fungal infections are difficult to treat since the agents are eukaryotes, as human cells.
Despite their wide occurrence, little attention has been given to their presence and
significance in aquatic environments (Souza et al., 2003). Drinking water distribution
systems are colonized by saprophytic heterotrophic microorganisms (such as bacteria,
fungi, yeast) that grow on biodegradable organic matter (Servais et al., 1992).
Growth of fungi in water distribution systems changes not only the water taste and odor
for the worse but also may cause technological and operational difficulties. Fungi also
produce secondary metabolites, some of which are toxins. Some of the fungal species and
the metabolites they produce are human pathogens or allergens (Paterson and Lima, 2005).
Fungal infections are becoming of increasing concern due to the increasing numbers of
immunocompromised patients and those with other risk-factors (Annaisie et al., 2002). The
presence of fungi in water distribution systems may cause other indirect challenges for
water companies. For instance, the secondary metabolites produced by some species can
alter the taste and smell of water, generating complaints from end-users. Organic acids
produced by fungal metabolic processes can increase the rate of corrosion of water pipes,
especially when it is difficult to maintain sufficient concentrations of water disinfectants,
such as chlorine, throughout the distribution system (Grabinska-Loniewska et al., 2007).
There is strong evidence of a correlation between fungal exposure and severity of
asthma ( Hogaboam et al., 2005). Much of the evidence is related to associations between
frequency of asthma attacks and numbers of airborne spores. Such spores may have been

21
aerosolised from a water source. For example, inhabiting damp and mouldy buildings has
also been linked to a worsening of asthma symptoms (Denning et al., 2006).
At the consumer side, installations such as cisterns, heating tanks, taps, and shower
heads can yield large numbers of fungi (in terms of Colony Forming Units. This releases
fungi and other microorganisms into the water transported through the network to end
users ( Hageskal et al., 2007).
Studies that included analyses of both groundwater-derived and surface water-derived
drinking water found that isolation of fungi was more likely from surface water-derived
drinking water (Hageskal et al., 2006 and Hageskal et al., 2007).The source of the raw
water affects the total number of CFU found due to biotic and abiotic differences between
surface and groundwater. Surface waters tend to contain larger amounts of organic matter,
which both provide nutrients and a substrate for fungal growth. Differences in acidity and
calcium content may also account for some of the variation – studies in Norway and
Portugal found that surface water is slightly more acidic with lower calcium content
(Hageskal et al., 2007 and Pereira et al., 2009). Furthermore, groundwater has lower levels
of turbidity and total organic carbon compared to spring and surface water (Pereira et al.,
2009).
The overall influence of nutrient concentration on fungal establishment in water
distribution systems is likely to be different from that for bacteria, given that fungi are able
to grow in environments that appear to be nutrient free (Kinsey et al., 2003). Competition
for nutrients between bacteria and fungi in culture is thought to occur (Gonçalves et al.,
2006).
Understanding the interactions between bacteria and fungi is important in order to
determine if bacterial content, a commonly measured parameter of drinking water, can be
used as an indicator of fungal content (Gonçalves et al., 2006). Fungal colonisation of food
is also thought to be an important source from which patients‘ respiratory or digestive
systems are colonised. Contaminated water used in food production processes may be a
route by which fungi are introduced into food (Paterson et al., 2009 and Hageskal et al.,
2006). Preventative measures include sterilising or disinfecting foods where possible, and
banning some particularly contaminated foods such as soft cheeses for high-risk patients
(Bouakline et al., 2000).

22
The Actinomycetes have been found to be associated with the musty and earthy odours
in water (Zaitlina and Watson, 2006). Musty/earthy odours are the second problems
encountered by the water utilities besides chlorine (Suffett et al. 1996). The filamentous
fungi and the actinomycetes in the water can produce volatile compounds like geosmin
(Paterson et al. 2007). Many of the taste and odor compounds produced by bacteria are also
found to be produced by filamentous fungi and significantly affect the effectiveness of
chemicals used for disinfecting drinking water (Paterson et al. 2009).
Fungi in drinking water are a significant source of fungal infections in vulnerable
patients are contradictory, leading to debate about whether further information is required
before action taken (Hageskal et al., 2009). Inaddition to that many filamentous fungi
appear in various surface water and underground water, but during the last years they have
been found in various drinking water as well (Arvanitidou et al., 2000; Warris et al., 2001;
Gottlich et al., 2002; Cabral and Fernandez, 2002 and Canovas et al., 2003). Fungi
growing in drinking water resources cause modification in taste, odor and composition of
water pools (Nazim et al., 2008; Ahmed et al., 2010). Many aquatic fungi including
important human pathogens are able to grow in water and land (Mullenborn et al., 2008).
Impact of water fungi is not restricted to human health but also to the oxidation of water
supply pipes ( Emde, 1992). as well as may produce unwanted flavors and odors in water
(Bays, 1970).
Filamentous fungi were recovered from 62% of all samples. In ground water 42.3% of
the samples were positive for mould growth, while surface waters yielded 69.7% positive
samples Oslo, Norway Hageskal, (2006). Filamentous fungi in drinking water has been
reported in several studies worldwide, although the frequencies of mould recovery are most
variable, ranging from 82.5% to 17.6% ( Frankova´ and Horecka 1995; Arvanitidou et al.
1999).
Only detected 7.5% fungal positive samples from ground water in Germany. (Gottlich et
al. 2002) Identified mould colonies in all of the surface water samples analysed in
Slovakia, while the ground water revealed 40% positive samples (Frankova´ .1993). the
occurrence of filamentous fungi in water sampled from taps, showers and main pipe in a
paediatric bone marrow transplantation unit at Rikshospitalet University Hospital, Norway
( Warris et al. 2001 ). The results revealed 94% mould positive samples from inside of the
hospital, at the intake reservoir fungi were recovered from all samples (Warris et al. 2002).

23
Hedayati al el., (2011) tested the of tap water as a potential reservoir of fungi in
hospitals in Sari city Iran , Out of 240 plates or sample, 77.5% were positive for fungal
growth. Twelve different genera were identified. Aspergillus (29.7%), Cladosporium
(26.7%) and Penicillium (23.9%) were the most common isolated. Among Aspergillus
species, A. flavus had the highest frequency. Highest colony counts were found in autumn.
Aspergillus predominated in autumn, Cladosporium in winter and spring and Penicillium
in summer.
Tartory, (2009).assessed the microbiological quality of drink water marketed in Gaza
found of that five samples (25%) were contaminated with mold ranging between (1-10
cfu/100ml), and 4 samples (20%) were contaminated with Yeast ranging between (1-50
cfu/100ml), Also 14 sample 56% out of 25 samples were contaminated with mold range
between (1-20 cfu/100ml) and 4 sample 16% out of 25 samples were contaminated with
yeast range between (1-20 cfu/100ml) in the water Vending Machine.

24
3.5 Chemical and physical properties of water
Water is a chemical compound which molecules contain two hydrogen atoms and one
oxygen atom. In natural waters there are many other components that make up the
complete composition of water. The cations with biggest concentration are calcium,
magnesium, sodium and potassium, and the more important anions are hydrogen
carbonate, sulphate, chloride and nitrate. These components create the chemical
composition of fresh waters and must be considered assessing water quality (Chemistry
and Biology, 1993).
Drinking-water is usually not the only source of human exposure to the chemicals for
which guideline values have been derived. In many cases, the exposure to or intake of
chemical contaminants from drinking-water is much lower than that from other sources,
such as food, air and consumer products (WHO, 2011)
3.5.1 Total dissolved solids (TDS)
Total dissolved solids (TDS) is the term used to describe the inorganic salts and small
amounts of organic matter present in solution in water. The principal constituents are
usually calcium, magnesium, sodium, and potassium cations and carbonate,
hydrogencarbonate, chloride, sulfate, and nitrate anions (GDWQ, 1996). The corrosive
nature of demineralised water and potential health risks related to the distribution and
consumption of low TDS water has led to recommendations of the minimum and optimum
mineral content in drinking water and then, in some countries, to the establishment of
obligatory values in the respective legislative or technical regulations for drinking water
quality. Organoleptic characteristics and thirst-quenching capacity were also considered in
the recommendations.(WHO 1980).
TDS and Cl- used indicator of groundwater salinity contamination in Gaza Strip and
nitrate was used as an indicator of anthropogenic contamination of groundwater. High
levels of Cl- and TDS in the groundwater cause high salinity in the water supply (Al-Jamal
and Al-Yaqubi, 2002).
The presence of dissolved solids in water may affect its taste (Bruvold and Ongerth,
1969). The palatability of drinking water has been rated by panels of tasters in relation to
its TDS level as follows: excellent, less than 300 mg/liter; good, between 300 and 600
25
mg/liter; fair, between 600 and 900 mg/liter; poor, between 900 and 1200 mg/liter; and
unacceptable, greater than 1200 mg/liter (Bruvold and Ongerth,1969). Water with
extremely low concentrations of TDS may also be unacceptable because of its flat, insipid
taste (GDWQ, 1996). The palatability of water with a TDS level less than 600 mg/l is
generally considered to be good whereas water with TDS greater than 1200 mg/l becomes
increasingly unpalatable (Mc Cutheon et al., 1983).
Regular intake of low-mineral content water could be associated with the progressive
evolution of the changes , possibly without manifestation of symptoms or causal symptoms
over the years. Nevertheless, severe acute damage, such as hyponatremic shock or
delirium, may occur following intense physical efforts and ingestion of several liters of
low-mineral water (Basnyat et al. 2000).
Rain will have a TDS of about five ppm. Once the rainwater soaks into the ground, it
begins to dissolve some hardness minerals and these minerals (calcium and magnesium)
end up in underground water aquifers. Illustrates the classifications of various degrees of
hard and soft water (Harrison, 2001). Sowed that the raw water conductivity and the
targeted residual TDS in treated water were the key process variables. Power consumption
increased linearly as difference between these two values increased (Broseus et al., 2009).
In study for the evaluation of the surface water quality from 29 sampling points along
the Kor River in Fars province South West Iran, it was found that the TDS was between
(4566–12632 mg/l) in all samples analyzed. (Sheykhi and Moore , 2012). Also Sulieman el
al., (2010) found that TDS of Siebel water was in the range of (115-137 mg/l) which was
in agreement with those of the Sudanese and International standards.
The Saudi Arabian Specification and Measurements Agency states that the optimum
value for the total dissolved solids TDS is 500 mg/l, and the maximum allowable value is
1500 mg/l. Using this standard, all the samples of the location around Makah were within
the maximum allowable value of the total dissolved solids (Ghulman el al., 2008). The
average concentration of TDS for drinking water wells in Gaza Governorates ranges was
2709 mg/l (Abu Mayla and Abu- Amr, 2010).
26
3.5.2 Chloride
The taste threshold of the chloride anion in water is dependent on the associated cation.
Taste thresholds for sodium chloride and calcium chloride in water are in the range 200–
300 mg/l (Zoeteman, 1980). The taste of coffee is affected if it is made with water
containing a chloride concentration of 400 mg/l as sodium chloride or 530 mg/l as calcium
chloride (Lockhart, 1955).
Evidence of a general increase in chloride concentrations in groundwater and drinking-
water has been found, but exceptions have also been reported (Gelb, 1981). In the USA,
aquifers prone to seawater intrusion have been found to contain chloride at concentrations
ranging from 5 to 460 mg/l (Phelan, 1987), whereas contaminated wells in the Philippines
have been reported to have an average chloride concentration of 141 mg/liter (Morales,
1987).Chloride levels in unpolluted waters are often below 10 mg/liter and sometimes
below 1mg/liter (DNHW, 1978).
Thanks to chlorine disinfection, the waterborne plagues of the past -- such as cholera and
typhoid fever -- are no longer a widespread problem in developed nations. Outbreaks of
waterborne disease, however, still occur and are primarily due to the use of untreated or
inadequately treated drinking water supplies or recontamination in the distribution system.
Although treatment methods of filtration and disinfection are effective at eliminating most
waterborne pathogens, these systems are an inexact science, evidenced by the frequent
prevalence of viral and protozoan pathogens in finished waters (Le Chevallier, 1991).
Easa and Abou-Rayan (2010) studied chlorides concentrations of groundwater at various
investigation years in Egypt. Thy stated that the increase of chlorides in groundwater is
getting along with the presence of chlorides concentrations in domestic wastewater. In a
study that evaluated the quality of drinking water wells supplies residence of Gaza Strip for
chloride and nitrate concentrations during the period from 1990 to 2002, the authors found
mean of chloride concentration (397.1 mg/l) and of nitrate concentration (126.2 mg/l) were
found statistically higher than were found statistically higher than WHO-recommended
guidelines (El-Madhoun, 2002).
Sheykhi and Moore, (2012) found in evaluate the surface water quality from 29
sampling points along the Kor River in Fars province South West Iran. They Found
chloride between (1205–7161 mg/l) in all samples analyzed. In study of water quality in

27
Gaza strip for the chloride concentration, the authors found that the average of chloride in
water was 381 mg/l (Metcalf and Eddy, 2000). However, in another study of water quality
of drinking wells in Gaza Strip, the authors found 11% of the drinking water wells contain
chloride concentration of less than 250 mg /l (PWA, 2007).
3.5.3 Calcium
Calcium‘s role in the body includes the mediation of vascular contractions and
vasodilatation. Calcium also plays an important role in muscle contraction, nerve
transmission and glandular secretion (Morris, 1992). The human body contains
approximately 20,000 mg. The significance of drinking water calcium for nutrition was
underlined in the 1940‘s by a German nutritionist R. Hauschka who recommended sodium
hydrogen sulphate to be added to water prior to boiling in order to maintain the level of
dissolved calcium and to prevent loss of calcium due to precipitation (Hauschka, 1951).
Mentioned that Calcium and Magnesium are known to occur naturally in water due to its
passage through mineral deposits and rock strata and contribute to its total hardness
(Karavoltsos el al., 2008).
Determined that concentrations of Calcium and Magnesium are usually much greater
than all other ions, it has generally been accepted that hardness can be equated to the sum
of calcium and magnesium concentrations.( Lerga and Osullivan, 2008). Investigated that
the main source of Mg concentration in groundwater is geomedia dissolution .These
relationships reflect mixing processes among different water types such as agricultural
wastewater, Pleistocene aquifer, Nile water, surrounding aquifer, and rock/water
interaction. The dissolution of geomedia (clay, shale, marl, limestone and sand deposits)
produces high concentration of Mganesium, Calcium and HCO3 in the aquifer system (El-
Kashouty, 2010).
Gibrilla al el., (2011) found in study of Seasonal Evaluation of Raw, Treated and
Distributed Water Quality from the Barekese Dam (River Off in) in the Ashanti Region of
Ghana, that the mean dry season of Calcium concentrations in the raw water is equal to
9.20mg/l.
The analytical data of inlet water samples for small scale desalination plants in the Gaza
show that 40% of the samples have calcium concentration less than the recommendations
of the WHO standards (100 mg/l) and 60% of the samples higher than the WHO standards.

28
All product water samples have calcium concentration accepted by the WHO standards.
The calcium concentration in product water samples ranges from 0.6 mg/l to 14.5 mg/l
plants in the Gaza Strip, Palestine (Aish, 2011).
3.5.4 Sodium
Sodium (Na) is an essential element required for normal body function including nerve
impulse transmission, fluid regulation, and muscle contraction and relaxation (Austgen,
2006; Mayo, 2008). However, in excess amounts, sodium increases individual risk of
hypertension, heart disease, and stroke (CDC, 2009). One of the chief sources of sodium is
the consumption of salt; therefore salt restrictions are often recommended as a first-line of
treatment for individuals suffering from these conditions (Korhonen, 2000). The taste
threshold concentration of sodium in water depends on the associated anion and the
temperature of the solution. At room temperature, the average taste threshold for sodium is
about 200 mg/l. No health-based guideline value has been derived as the contribution from
drinking-water to daily intake (WHO, 2011).
The major sources of sodium found in groundwater supplies across the United States is
derived from the natural erosion of salt deposits and sodium bearing rock minerals and the
infiltration of surface waters or storm waters contaminated by road salt; additional sources
may include irrigation and precipitation waters leaching through soils high in sodium,
groundwater pollution by sewage effluent, and infiltration of leachate from landfills and/or
industrial sites (RWPH, 2007).
In the home, additional sodium may be added to drinking water from household water
softening systems. Water softeners that are recharged with salt (sodium chloride) replace
hardness minerals (i.e. calcium and magnesium) with sodium to ―soften‖ water supplies
(KSU, 2002).
Kinetics and metabolism in laboratory animals and humans virtually all of the sodium
present in water and foods is rapidly absorbed from the gastrointestinal tract. Sodium is the
principal cation found in the extracellular body fluids; only small amounts are found within
cells (Guthrie, 1989).
In study of El-Salam canal as a potential project to reuse the Nile Delta drainage water
for Sinai desert agriculture, the microbial and chemical water qualitywere assessed.
29
Representative water samples were manually collected during the seasons winter, spring,
summer, and autumn of two successive years (2003/2004 and 2004/2005), found found
Sodium between (75–294mg/l), in all samples (Othman al el., 2012). Agrawal el al.,
(2011) found that the average of sodium in water was 29.7 mg/l in all samples in a study of
Groundwater Environment of Begusarai District, Bihar.
3.5.5 Magnesium
Magnesium, of which 60 percent (12,000 mg) is found in bone and 20 percent (4,000
mg) in skeletal muscle; the rest circulates in the serum (200 mg) or is divided among other
tissues (3,800 mg) (Elin, 1988). The serum level is maintained between 17 mg/l and 26.7
mg/l. Approximately 50-65 percent of serum magnesium is in the ionized form (Elin,
1988). In the general population, the major portion of magnesium intake is via food and, to
a lesser extent, water (Rubenowitz, 1996). Magnesium deficiency increases risk to humans
of developing various pathological conditions such as vasoconstrictions, hypertension,
cardiac arrhythmia, atherosclerotic vascular disease, and acute myocardial infarction,
eclampsia in pregnant women, possibly diabetes mellitus of type II and osteoporosis
(Rude, 1998; Innerarity, 2000; Saris et al, 2000).
At levels exceeding 0.1 mg/l, manganese in water supplies causes an undesirable taste in
beverages and stains sanitary ware and laundry. The presence of manganese in drinking-
water, like that of iron, may lead to the accumulation of deposits in the distribution system.
Concentrations below 0.1 mg/l are usually acceptable to consumers. Even at a
concentration of 0.2 mg/l, manganese will often form a coating on pipes, which may
slough off as a black precipitate. The health-based value of 0.4 mg/l for manganese is
higher than this acceptability threshold of 0.1 mg/l. (WHO, 2011).
Magnesium-rich mineral waters are easily absorbed and have many health benefits due
not only to their magnesium content, but also because of their content of bicarbonate ions
that help neutralize the carbonic acid formed in the body during metabolic processes.
Several studies have shown that an increased intake of bicarbonate may help prevent
muscle wasting and bone loss (Sebastian, 1994; Frassetto, 1998).
In study of Groundwater resources in some parts of the lower section of the Shire River
valley, Malawi, Manganese exceeded 30 mg / l in 70% of the samples analyzed (Monjerezi
and Ngongondo, 2012).
30
Found magnesium concentration of 50% of the inlet water samples is below the WHO
recommendation standard (60 mg/l) and 50% of the water samples have magnesium
concentration higher than the WHO standard. In the product water samples, the magnesium
concentration of all samples is less than 25 mg/l. 95% of the product samples contain
magnesium concentrations less than 10 mg/l in study of Water quality evaluation of small
scale desalination plants in the Gaza Strip, Palestine (Aish, 2011) .
3.5.6 Potassium
Potassium is an alkali metal and the seventh most common element on earth (Lewis,
1997). It comprises 2.59% of the Earth‘s crust, is highly reactive and does not occur in
nature as a free metal (Burkhardt and Brüning, 2002). potassium has a crystal structure, has
high thermal and electrical conductivities (Burkhardt and Brüning, 2002) and is rapidly
oxidized in moist air (Lewis, 1997). It has a melting point of 63.5°C, a boiling point of
759°C and a density of 0.89 g/cm3 at 20°C (Lide, 2004). Potassium‘s principle salt,
potassium chloride readily dissolves in water (34.4 g/100 g at 20°C), has a low vapour
pressure (Linke, 1965) and a low octanol/water partition coefficient (log Kow) of -0.46
(OECD, 2001). potassium chloride is odourless and has a taste detection threshold of 0.32
g/100 mL (Environment Canada, 1985).
Potassium plays a critical role in many vital cell functions, such as metabolism, growth,
repair and volume regulation, as well as in the electric properties of the cell. Adverse
health effects from exposure to potassium in drinking water are unlikely in healthy
individuals. Higher than normal potassium concentrations in the blood (hyperkalemia) and
ensuing health effects are unlikely because potassium is rapidly excreted in the absence of
pre-existing kidney damage. potassium is a natural and essential element in plants and
animals. Humans are primarily exposed to potassium through food. Although potassium
concentrations in drinking water are generally low and do not pose health concerns, the
high water solubility of potassium chloride and its use in water softeners can lead to
significantly increased exposure. Drinking-water, with an upper 90 th percentile
concentration of 5.2 mg/l. Data from Canada indicate that average concentrations of
potassium in raw and treated drinking water in different areas vary between <1 and 8 mg/l.
However, concentrations ranged up to 51 mg/l in Saskatchewan, which is the largest
production area for potassium chloride in Canada (Health Canada, 2008).

31
The concentration of potassium in seawater is 0.38 g/L. Both sea salt aerosols and soil
dust can contribute to the potassium content of rainwater. Potassium concentrations in
rainwater are generally low, with an average annual concentration of just over 0.1 mg/l
(NRCC, 1977).Potassium levels in deep bedrock aquifers of the prairies tend to be higher
and are generally a function of depth below surface and the distance from the outcrop area
containing the potassium minerals (NRCC, 1977). In Saskatchewan, potash formations are
very deep and are hydrogeologically isolated from useable groundwater resources by very
thick layers of low permeability shales (Shaheen, 2004). In a study conducted on
groundwater environment of Begusarai District, Bihar found the average potassium in
water was 2.1 mg/l in all samples that analyzed.
3.5.7 Nitrates and nitrites
Nitrates and nitrites come in various forms, but when dried are typically a white or
crystalline powder. Nitrate (NO3) and nitrite (NO2) are also naturally-occurring compounds
that are a metabolic product of microbial digestion of wastes containing nitrogen, for
example, animal feces or nitrogen-based fertilizers (USA, 2001; USEPA, 2006). Nitrogen
occurs primarily in the oxidized forms of nitrates and nitrites or the reduced forms of
ammonia or “ organic nitrogen .“ Where the nitrogen is part of an organic compounds
such as amino acids, a protien, a nucliec acid or one of many other compounds. All of
these can be used as nutrients, although the organic decompose to simpler form (Pandy et
al., 1998).
Most chemicals arising in drinking water are of health concern only after extended
exposure of years, rather than months. The principal exception is nitrate. Typically,
changes in water quality occur progressively, except for those substances that are
discharged or leach intermittently to flowing surface waters or groundwater supplies from,
for example, contaminated landfill sites (WHO, 2011).
Sodium and potassium nitrates are used as fumigants in canisters, which are placed
underground in rodent dens and holes, and then ignited to explode and release gases that
kill the rodents (USEPA, 1991). Sodium nitrite is a food additive that is used as a
preservative (USA2001; WHO, 2006).
Exposure to higher levels of nitrates or nitrites has been associated with increased
incidence of cancer in adults, and possible increased incidence of brain tumors, leukemia,
32
and nasopharyngeal (nose and throat) tumors in children in some studies. (Ward, 2000;
Sanchez, 2001; Pogoda and Preston 2001; Volkmer, 2005).Nitrate contamination of
drinking water is of special concern in agricultural areas (Gelberg .1999; Knobeloch and
Proctor. 2001).Nitrates are not filtered out of drinking water using filtration devices that
utilize only carbon or activated carbon filtration. Nitrates can be filtered from drinking
water using ion exchange, reverse osmosis, or electrolysis methods (USEPA, 2005).
The increase in demand for food supplies may lead to groundwater contamination by
nitrate since the major contributor to nitrate contamination in groundwater is the use of
nitrogenbased fertilizers associated with cropping activities (Shamrukh et al., 2001; Wolf
et al., 2003; Almasri and Kaluarachchi, 2005; Mao et al., 2006; Tait et al., 2008).
Elevated nitrate concentrations in drinking water can cause methemoglobinemia in infants
and stomach cancer in adults (Lee et al., 1991; Wolfe and Patz, 2002).Sources of
groundwater contamination by nitrate can be classified into point and non-point sources.
Non-point sources of nitrogen include fertilizers, manure application, leguminous crops,
and dissolved nitrogen in precipitation, irrigation return-flows, and dry deposition. Point
sources such as septic systems and cesspits can also be major sources of nitrate pollution
(Mitchell et al., 2003; Babiker et al., 2003; Almasri and Kaluarachchi, 2005; Santhi et al.,
2006). Elevated Major routes of entry of nitrogen into water bodies are municipal and
industrial wastewater, private sewage disposal systems, decaying plant debris according to
(LVEMP, 2002). An increase of nitrates in water is often associated with farming fertilizer,
pesticide or poor sanitary activities (Jacinthe, 2000; George, 2001). Increased nitrate intake
could also affect the thyroid function (Penka el al., 2008).
Nitrate often contaminates groundwater resources due to excessive use of fertilizer and
uncontrolled on-land discharge of raw and treated wastewater and can therefore limit the
direct use of groundwater for drinking water purpose (Buttiglieri el al., 2005).
Experimental studies have shown that the presence of high concentration of nitrates in
groundwater is linked to the nature of the soil on the other, to the effect of continuous
discharges of wastewater and successive irrigations (Ibnoussina el al., 2006).
Several studies in Gaza reported high nitrate levels in groundwater as one of the major
concerns among the public and governmental decision makers (Abu Maila et al., 2004;
Shomar, 2006).

33
In a study conducted in gaza Strip, almost 90% of the groundwater wells of the Gaza Strip
sampled between 2001 and 2007 showed nitrate concentrations two to eight times higher
than the WHO standards (Shomar, 2008). In another study of water well in Gaza Strip, the
authors found 11% of the drinking water wells contain nitrate concentration of less than 50
mg / L (PWA, 2007). However, in a study that have been done to evaluate the surface
water quality from 29 sampling points along the Kor River in Fars province South West
Iran, the authors found nitrate between (15–1421 mg/l ) in all samples that have been
analyzed. (Sheykhi and Moore, 2012).
Bonham, (2011) found nitrate (NO3) concentration varies from 0.19 to 140.3 mg/l and
0.39 to 152.9 mg/l in dry and wet seasons, respectively. About 19% of water samples in
dry season and 28% in wet season.
Akoto and Adiyiah,( 2007) found in their study that was aimed for the determination of
the trace metals and some physiochemical properties in drinking water samples from the
Brong Ahafo region of the Republic of Ghana, where drinking water samples are not
treated before it is consumed. The purpose was to ascertain the quality of water from these
sources. They found nitrite concentration between 0.09-0.99 mg/l in all samples they
analyzed.The average concentration of nitrate for drinking water wells in Gaza Strip is 139
mg/l (Mayla and Abu- Amr. 2010).
3.5.8 Biochemical oxygen demand
Biochemical oxygen demand (BOD) is defined as ‗the amount of oxygen consumed by
bacteria and other microorganisms while they decompose organic matter under aerobic
conditions at a specified temperature‘ (Delzer and McKenzie, 2003).
BOD is often used as an assessment of the oxygen demand of wastewaters, effluents,
and polluted waters with greater BOD generally signifying higher rates of pollution.
Biochemical oxygen demand is a measure of the oxygen used in bacteria mediated
oxidation of organic substances in water and wastewater (Mayur and Indu , 2002)
measures the amount of oxygen used by microorganisms, in this case bacterium, to oxidize
organic matter present within the water sample (Nielsen el al., 2004).
The BOD concentration in most wastewaters exceeds the concentration of dissolved
oxygen available in an air-saturated sample. Therefore, it is necessary to dilute the sample

34
before incubation to bring the oxygen demand and supply into appropriate balance.
Because bacterial growth requires nutrients such as nitrogen, phosphorus, and trace metals,
these are added to the dilution water, which is buffered to ensure that the pH of the
incubated sample remains in a range suitable for bacterial growth. Complete stabilization
of a sample may require a period of incubation too long for practical purposes; therefore, 5
days has been accepted as the standard incubation period (APHA, 1999).
The amount of BOD present is calculated by finding the difference between the initial
and final levels of dissolved oxygen. The test can be modified to use longer and shorter
time periods, as well as various temperatures (APHA et al 1992). The oxygen consumption
from degradation of organic material is normally measured as Biochemical oxygen demand
and chemical oxygen demand, so there is an important relation between them (Dongan et
al., 2009).
As most of the BOD sensors previously reported have been designed for long-term use, a
pure culture or a mixture of two microbial strains has been widely used. Some of these
BOD sensor systems have already been commercialized (Praet et al., 1995; Marty et al.,
1997).
Biochemical oxygen demand (BOD) is a way to assess the amount of oxygen required
for aerobic microorganisms to decompose the organic material in a sample of water over a
specific time frame (Houghton Mifflin Company, 2010). It is the oxygen uptake demand of
a source of water. The purpose of this test is to determine the potential of wastewater and
other water to deplete the oxygen levels of receiving waters (Brake, 2007).
3.5.9 Hardness
The use of hard water could lead to scale formation in the equipment which in turn, could
lead to cleaning problems, under-pasteurization or malfunctioning of valves essential for
the microbiological or chemical safety of the process. For some but not all utility water
applications, water of potable source is required. Therefore, the requirements regarding
safe storage and distribution may vary. Below are a selection of guidelines and standards
for selected utility water applications in the food industry (PCL, 2002). Health significance
of water hardness was directly evidenced in the late 1950‘s. The relationship between
water hardness and the incidence of vascular diseases was first described by a Japanese
chemist Kobayashi (Kobayashi, 1957).

35
Hardness caused by calcium and magnesium is usually indicated by precipitation of soap
scum and the need for excess use of soap to achieve cleaning. Consumers are likely to
notice changes in hardness. Public acceptability of the degree of hardness of water may
vary considerably from one community to another. The taste threshold for the calcium ion
is in the range of 100–300 mg/l, depending on the associated anion, and the taste threshold
for magnesium is probably lower than that for calcium. In some instances, consumers
tolerate water hardness in excess of 500 mg/l. Depending on the interaction of other
factors, such as pH and alkalinity, water (WHO, 2011).
In the late 1990‘s several epidemiological studies were carried out in Taiwan to focus on
relationships between drinking water hardness and mortality from various diseases
showing significant geographical variation. Magnesium was found to have protective effect
against cerebrovascular diseases (Yang, 1998) and hypertension (Yang et al, 1999).
Reported that the hardness of drinking water is determined largely by it,s content of
calcium and magnesium. It is expressed as the equivalent amount of calcium carbonate that
could be formed from calcium and magnesium in solution. Hard water contains higher
levels of calcium or magnesium than soft water (Chiu el al., 2010). Water hardness is
essential parameter industrial water consumption in manufacturing of high –quality
products (vireo, 2002). Water hardness originates from existence of cations such as
calcium, magnesium and in lower traces aluminum, iron and other bivalent and trivalent
cations. Among hardness causes, ions calcium and magnesium are identified as main
factors of hardness (Ildiz, 2003).
In a study of Groundwater resources in some parts of the lower section of the Shire
River valley, Malawi, the authors found that these parts are not potable for rural domestic
water supply due to high salinity (Monjerezi and Ngongondo, 2012).
3.5.10 Turbidity
It is deemed as the cloudiness of a liquid as a result of particulate matter being
suspended within it. Its importance is highlighted by the fact that suspended solids interfere
with effective chlorination/disinfection and helps to shield bacteria (Asano, 2007).
Additionally, suspended solids also serve as a place of attachment for bacteria (Hurst,
1996). The general WHO standard set for drinking water is a turbidity <0.1 NTU
(Nephelometric Turbidity Unit). A turbidity >5 NTU is considered unhealthy.
36
Microorganisms can adhere to particles protected them from disinfection, provide a
source of nutrients, and facilitate their movement within the distribution system (Morin el
al., 1999). Furthermore an increase in turbidity in the distribution system will exert a
greater chlorine demand which could lead to inadequate disinfection of the distributed
water (Kirmeyer el al., 2002). Increased turbidity may be due to contamination in the
storage tank, water age or mixing issues or tank material degradation (Kirmeyer el al.,
2002).
Zielina, (2010) stated that it is very important to constantly control the dynastic work of
rapid filters drink rung. Usually, turbidity is used for filtration process monitoring but
recently, particle size distribution characterizes treated water quality and filter efficiency
more precisely than turbidity.
Akoto and Adiyiah,( 2007) found in study of the determination of the trace metals and
some physiochemical properties in drinking water samples from the Brong Ahafo region of
the Republic of Ghana, where drinking water samples are not treated before it is consumed.
The purpose was to ascertain the quality of water from these sources. Found turbidity
between 3.25-72.50 NTU. In all samples analyzed.
3.5.11 Electrical conductivity
Electrical conductivity is a water-quality property of ten measured when environmental
water samples are collected. It is a simple and highly accurate measurement and is used in
many environmental and industrial applications. In solutions, the electrical conductivity is
the sum of the conductivities of all the conducting constituents. Electrical conductivity
measurements have been used to predict the salinity (Lewis, 1980; Brown, 1989).
Accurate measurements and calculations of electrical conductivities for natural waters
will provide a greater understanding of the relative contributions of individual ions to the
electrical conductivity. In addition, when coupled with charge balance, electrical
conductivity can be used to identify erroneous chemical analyses (Miller, 1988) .Several
methods have been developed to calculate electrical conductivities of natural waters from
their chemical compositions. (Pawlowicz, 2008).
The global contend of dissolved cations, and anions, represented by the EC (280
μs/cm) is rather high for river water. However, it follows normal seasonal trends; it is
37
highest during the coolest months of December and January when discharge of the river is
low and lowest during the summer months when the flow released from Lake Nasser is
highest. (Batisha, 2007).
Mentioned that the EC of the water samples from Jeddah wells showed a wide variation
even in the sample, which is collected from the same village, and the range is between 800
μs/cm and 7000 μs/cm (Al-Ahmadi).
Abd-Elrahman (2003) stated that the EC is a measure of water ability to conduct
electrical current that passes through it and it is directly proportional to the amount of
dissolved substances in water. Dev el al., (2011) stated that the EC is also reduced for
distilled water in comparison to the sea water due to low amount of TDS as expected .
Akoto and Adiyiah, (2007) study the determination of the trace metals and some
physiochemical properties in drinking water samples from the Brong Ahafo region of the
Republic of Ghana, where drinking water samples are not treated before it is consumed.
The purpose was to ascertain the quality of water from these sources. They found
electrical conductivity between 35-1216 μs/cm in all samples analyzed.Also Sheykhi and
Moore (2012) found in the evaluation the surface water quality from 29 sampling points
along the Kor River in Fars province South West Iran that EC value was between (6500–
21510 μs/cm) in all samples analyzed.
3.5.12 pH
Is a measure of how acidic or alkaline a solution is. In pure water at room temperature, a
small fraction (about two out of every billion) of the water molecules (H2O or really H-O-
H) split or dissociate, a spontaneously into one positively charged hydrogen ion (H+) and
one negatively charged hydroxide ion ( OH-) each. Then is an equal number of each ion,
so the water is said to be neutral (Panicker and Ravindra, 997).
pH is the hydrogen ion concentration expressed as log10 (1/h).Sins pH value of 7
indicates neutrality, 0-7 acidity, and 7-14 alkalinity, pH value of 6-8 is desirable.
Bicarbonate ion is a component of both alkalinity and acidity. Aquatic life is more
sensitive to pH. pH important in chemical reaction and is significant in the treatment units
like coagulation, softening, chlorination and sludge digestion (Workshop, 2006).

38
The pH of water is a measure of the acid–base equilibrium and, in most natural waters,
is controlled by the carbon dioxide–bicarbonate–carbonate equilibrium system. An
increased carbon dioxide concentration will therefore lower pH, whereas a decrease will
cause it to rise. Temperature will also affect the equilibrium and the PH. In pure water, a
decrease in pH of about 0.45 occurs as the temperature is raised by 25 °C. In water with a
buffering capacity imparted by bicarbonate, carbonate, and hydroxyl ions, this temperature
effect is modified (APHA, 1989). The pH of most raw water lies within the range 6.5–8.5
(APHA, 1989).
Exposure to extreme pH values results in irritation to the eyes, skin, and mucous
membranes. Eye irritation and exacerbation of skin disorders have been associated with pH
values greater than 11. In addition, solutions of pH 10–12.5 have been reported to cause
hair fibers to swell (WHO, 1986). In sensitive individuals, gastrointestinal irritation may
also occur. Exposure to low pH values can also result in similar effects. Below pH 4,
redness and irritation of the eyes have been reported, the severity of which increases with
decreasing pH. Below pH 2.5, damage to the epithelium is irreversible and extensive
(WHO, 1986). As water does not consist only of hydrogen and oxygen, there are various
chemical compounds that influence water taste, as iron, manganese, magnesium, calcium,
zinc, chlorides, sulphates, etc. The best pH of drinking water is 6-7 (CAICW, 1982).
pH value considerably influences the course of biochemical and chemical processes in
waters. In clean natural waters pH value is 4.5-8.3, dependent on content of hydrogen
sulphide, phosphates etc. pH value can also be influenced by biological processes, water
temperature and respiration (Chemistry and Biology, 1993). pH is an important parameter
considering water quality; it is used for calculating concentrations of carbonate,
bicarbonate and carbon dioxide in the water (CAICW, 1982).
El-Baba, (1999) found that the pH of the ground water wells that supply Gaza city for
domestic use should be in equilibrium point. If the pH of water is raised from the
equilibrium point, the water becomes scale forming and will deposit calcium carbonate. If
the pH is lowered from the equilibrium pH, point the water turns corrosive.
In a study to undertake a preliminary assessment of the groundwater quality of the West
Thrace region, forty groundwater samples collected from Edirne and Cana kale were

39
assessed for their suitability for human consumption found pH values of all samples were
between 5.5 and 8.5 limits (Aydin, 2006).
3.5.13 Temperature
The water temperature varied from 24 °C in the wet season to 28 °C in the dry season
with a mean annual temperature of 26 °C. These values are within the natural background
levels of 22–29 C for waters in the tropics (Stumm & Morgan, 1981).
The temperature of source water can fluctuate seasonally and depends upon the type of
source. For example, groundwater are nearly constant temperatures, while surface water
temperature depends strongly on climate (Viessman and Hammer, 1993). In Philadelphia
Pennsylvania, the summer time water temperature of rivers and drinking water is about 25
ºC, whereas the wintertime temperature can be 10-15 ºC depending on the winter
conditions (Burlingame, 2001). Additionally, a southwest Virginia water authority has seen
raw water temperatures approaching 1-2 ºC in the winter months, and as high as 20 ºC
during the summer (Knocke, 2000).
Temperature is a very important parameter for many physical and chemical water
treatment applications (AWWA, 2002). Changes in temperature are also important to
predicting distribution system integrity breaches including mains breaks, corrosion
nitrification and changes in hydraulic conditions (NRC, 2006). Many systems conduct
online temperature monitoring both at entry points and within the distribution system,
Warmer temperature are associated with increased growth rates of bacteria (Besner el al.,
2002).
Although the literature suggests that water temperature influences odor response, there
are few quantitative data reported (Bartels, 1986; Burlingame, 1991; Burlingame and
Tanjuncto, 2001). Data reported for the food and beverage industries indicated that sample
serving temperature affected consumer perception (Pangborn and Bertolero ,1972; Baron
and Penfield.1996 ).

40
3.6 Water quality standards:
Speciation of potable water for drinking and household uses and water used in the food
industry according to the Palestinian standards were given in the following tables
(Palestinian standard, 2005):
Table (1): Water Microbiological standards
Tests WHO standard Palestinian standard
Total Count -- --
Total Coliform 0 3/100ml
Fecal Coliform 0 0
Fecal Streptococci 0 --
Pseudomonas aeruginosa. -- --
Mold -- 0
Yeasts -- 0
Table (2): Water Physical standards.
Tests WHO standard Palestinian standard
Hardness 500 mg/l 500 mg/l
pH 8.5-6.5 pH 8.5-6.5 pH
Temperature -- 8-25 °C
Turbidity 5 NTU 5 NTU
Electrical Conductivity 3300 μs/cm 3300 μs/cm

41
Table (3): Water chemical standards.
Tests WHO standard (mg/l) Palestinian standard (mg/l)
Total dissolved solids 1000 1000
Chloride 250 250
Calcium 200 100
Sodium 200 200
Magnesium 0,5 0,5
Potassium 5 10
Nitrite 50 50
Nitrate -- --
Biological Oxygen Demand 0 --
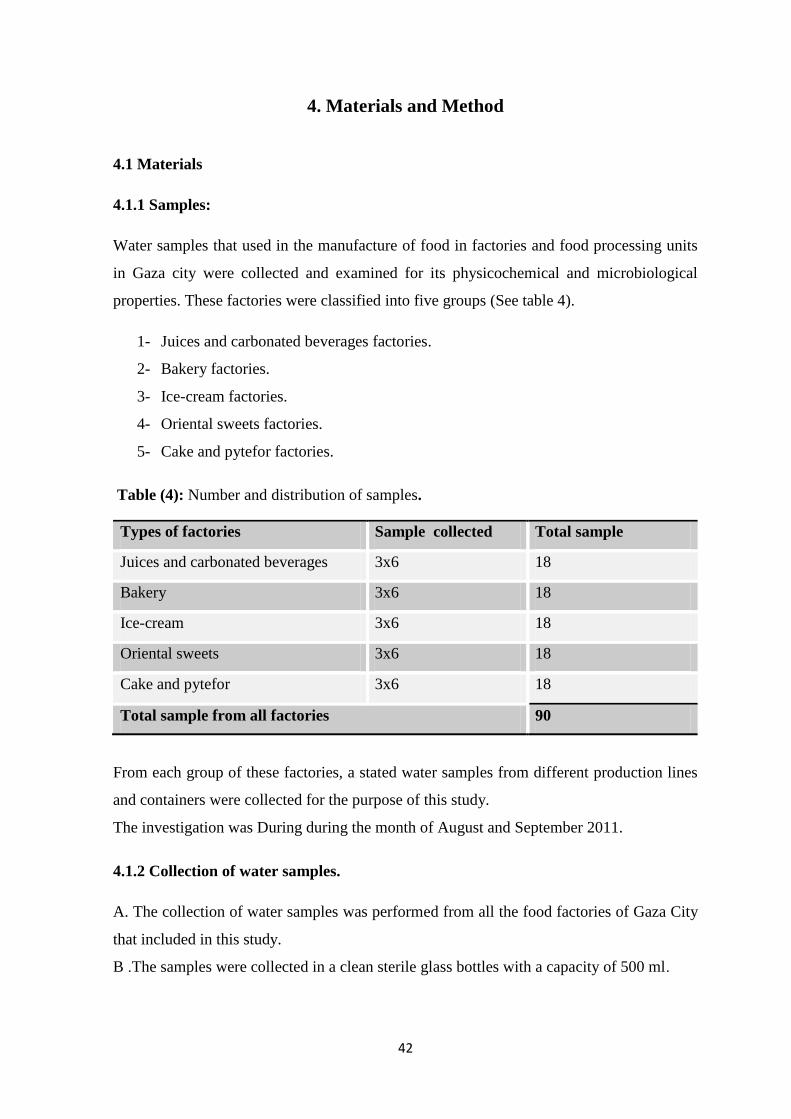
42
4. Materials and Method
4.1 Materials
4.1.1 Samples:
Water samples that used in the manufacture of food in factories and food processing units
in Gaza city were collected and examined for its physicochemical and microbiological
properties. These factories were classified into five groups (See table 4).
1- Juices and carbonated beverages factories.
2- Bakery factories.
3- Ice-cream factories.
4- Oriental sweets factories.
5- Cake and pytefor factories.
Table (4): Number and distribution of samples.
Types of factories Sample collected Total sample
Juices and carbonated beverages 3x6 18
Bakery 3x6 18
Ice-cream 3x6 18
Oriental sweets 3x6 18
Cake and pytefor 3x6 18
Total sample from all factories 90
From each group of these factories, a stated water samples from different production lines
and containers were collected for the purpose of this study.
The investigation was During during the month of August and September 2011.
4.1.2 Collection of water samples.
A. The collection of water samples was performed from all the food factories of Gaza City
that included in this study.
B .The samples were collected in a clean sterile glass bottles with a capacity of 500 ml.

43
°C. The glass bottles were washed thoroughly with distilled water and sterilized in the
autoclave. The water samples were transported to the laboratory in an ice box at 5 ± 1°C,
and subjected for bacteriological and chemical analysis within 24 hours of collection.
4.1.3 Equipment and Instruments
-Ice box
-Glass and plastic bottles
- 45mm disposable pre-sterilized culture dishes
- Incubator, typ1711509900310 Brand WTC Binder production Germany
- Oven , typ1511530000202 Brand WTC Binder production Germany
- Autoclave, model ER-38501 , Brand A.Ravona production Germany
- Vacuum filtration apparatus, model 2534c-01 Brand Welch Production America
- 0.45μm porosity membrane filters (Schleicher&schuell, ME25/21ST0).
- Forceps (sterilized).
- Binocular microscope.
- Safety cabinet. model Filtair 936 Brand Erlab Production France
- Turbid meter. model 46500-00 Brand Hach Production America
- pH meter. model pH 211 Brand Hanna Production Portugal
- EC meter. model 51875-60 Brand Hach Production America
- Spectrophotometer. , model S-22 , Brand Boeco production Germany
- Flame photometer. model PFP7-10 Brand Jenway Production United Kingdom
- BOD Manometer. model 26197-10 Brand Hach Production America

44
4.2 Methods
4.2.1 Methods of sampling
Prepare the required tools. Such as steriles bottles , cotton alcohol. The source of the
flame and ice box.
cleaning nozzle tap with alcohol for 30 seconds. Then open the tap for 20 seconds. Then
grab hold of bottles open and cover and tired even before its end. Then closed bottles .
And write the desired data on the bottles. Then put the bottles in the ice box. And
transported to the laboratory
4.2.2 Microbiological Analysis
The procedure used in the microbiological analysis were recommended by the standard
method according to American Public Health Association, APHA, (1995).All Media use
were from Brand Himedia Production India
4.2.2.1 Microbiological Media and determination
All the media used in the present investigation were purchased and prepared according to the
instruction manual of Difco company (Difco Manual, 1998).
4.2.2.1.1 Plate Count Agar for aerobic bacteria determination.
The typical formula (g/l):
BactoTryptone, 5 ;Bacto Yeast Extract, 2.5; Bacto Dextrose (Glucose), 1 andBacto Agar,
15 .Final pH 7.0 ± 0.2 at 25°C. Suspend 23.5 grams in 1 liter of distilled or deionized
water, heat to boiling to dissolve completely, autoclave at 121°C for 15 minutes.
Aerobic bacteria determination:
One ml of properly diluted water sample was spread on to Plate Count Agar plates were
then incubated at 35 ± 2°C for 18-48 hours. Colonies were counted under 10-25x
magnification.
4.2.2.1.2 M-Endo agar for Total Coliform
The typical formula (g/l):
Tryptose, 10.0 ; Thiopeptone, 5.0; Casitone, 5.0 ; Yeast extract, 1.5; lactose, 12.5; Sodium

45
chloride, 5.0; Potassium phosphate dibasic (K2HPO2), 4.375; sodium lauryl sulfate, 0.050;
sodium desoxylate, 0.10; Sodium sulfate, 1.05; Basic fuchsin, 1.05 and Agar, 15.0.
All the above ingredients was rehydrated in one liter of distilled water containing 20 ml ethanol
(95%) . heated to dissolve agar, then quickly removed and cooled to 50 °C. the medium was not
sterilized . the final pH value was adjusted at 7.1 ± 0.2.
Total Coliform determination:
The coliform group of organisms include aerobic and facultative anaerobic bacteria which
ferment lactose sugar at 35 °C and produce gas (CO2). These bacteria include Citrobacter,
Enterobacter, Acinetobacter, Klebsiella and E. coli. The membrane filter technique was used for
their isolation. A 100 ml of water was filtered and the mmbrane filter was placed on M-Endo
agar, the plates were incubated for 24-48 hours. at 35 °C. Colonies with red colour suspected to
be a coliform and were confirmed by each of Gram stain, lactose fermentation test, API 20E test
and ONPG test. (American Public Health Association APHA, 1995).
4.2. 2.1.3 M-FC meduim agar for Fecal Coliform
The typical formula (g/l):
Tryptone, 10.0; Peptocomplex, 5.0; Yeast extract, 3.0; Sodium chloride, 5.0; Lactose, 1.25;
Bile salts, 1.5; Aniline blue, 0.1 and agar, 13.0.
50 gram of the powder was suspended in 100ml of distilled water , 10ml of rosolic acid
solution (1% NaOH 0.2N) was added. The mixture was mixed well and boiled. Medium
was not sterilized and cooled to 50 °C then poured into petri dishes.The final pH value was
adjusted at 7.2 ± 0.2.
Fecal coliform determination:
This is a subgroup of total coliform which has a property of fermentation of lactose sugar
at 45.5 °C with the production of gas (CO2). This group contain E. coli and Klebsiella.
The procedure used for their isolation was the membrane filter technique .A 100ml of
water was passed through the membrane under a negative pressure and the membrane were
placed on the surfacce of M.fecal coliform agar (M-FC). The plates were incubated for 24
hours at 44.5°C. the suspected colonies with blue colour were confirmed by inoculating EC
broth and incubated for 48 hours at 44.5 °C, the air bubbles in the Durham tube indicated a
positive result for fecal coliform. (American Public Health Association APHA, 1995).

46
4.2.2.1..4 M- Enterococcus agar for Fecal Streptococcus
The typical formula (g/l):
Pancreatic digest of casein , 12.0; Proteose peptone nitrate, 8.0; Yeast extract, 5.0;
Dextrose, 2.0; Dipotassium phosphate, 4.0; soduim azide, 0.4; Agar, 10.0 and
Triphenyltetrazolium chloride, 0.1.
42 gram of the powder was suspended in one liter of distilled water, mixed throughly,
heated with frequent agitation and boiled for completely dissolving. Medium was not
sterilized . the final pH value was adjusted at 7.2 ± 0.2.
Fecal Streptococci determination:
This is a subgroup of Enterococci, which are gram positive bacteria. Fecal streptococci
have been shown a good indicator for fecal pollution. They are more persistent in the
environment than the coliforms which means that when the coliforms in a sewage have
died off the sewage may still be detected by the content of fecal streptococci. The
procedure used for their isolation was the membrane filter technique. A 100ml of water
were filterd and the membranes were placed with the forceps on the surface of m-
Enterococcus agar. The plates were incubated for 24 –48 hours at 35°C. the suspected
colonies with dark red were counted. (American Public Health Association APHA, 1995).
4.2.2.1.5 Cetrimide agar for Pseudomonas aeruginosa
The typical formula (g/l):
Bacto Peptone , 20; Magnesium Chloride , 1.4; Potassium Sulfate,10 ;Cetrimide
(Cetyltrimethylammonium Bromide) , 0.3 ;Bacto Agar , 13.6 ; Final pH 7.2 ± 0.2 at 25°C.
45.3 grams in one liter distilled or deionized water containing 10 ml of glycerol. Heat to
boiling to dissolve completely. Autoclave at 121°C for 15 minutes. Cool to room
temperature. Dispense into sterile Petri dishes, or as desired.
Pseudomonas aeruginosa determination:
The procedure used for their isolation was the membrane filter technique. A 200 ml of
water were filtered and the membranes were placed with the forceps on the surface of
Cetrimide agar. The plates were incubated for 18 –48 hours at 35± 2oC. The suspected
47
colonies with yellow-green to blue were counted. (American Public Health Association
APHA, 1995).
4.2.2.1.6 Sabouraud Dextrose Agar for Fungi (molds & yeast)
The typical formula (g/l):
BactoNeopeptone, 10; Bacto Dextrose, 40 and Bacto Agar, 15. Final pH 5.6 ± 0.2 at 25°C.
65 grams in one liter of distilled was, heat to dissolve the medium completely, sterilize by
autoclaving at 121 °C for 15 minutes.
Fungi (molds & yeast) determination:
The procedure used for their isolation was the membrane filter technique. A 100ml of
water were filterd and the membranes were placed with the forceps on the surface of
Sabouraud Dextrose Agar. The plates were incubated for 18 –48 hours at 30± 2°C, for 3-5
days. (APHA, 1995).
4.2.2.2 Biochemical test
The Analytical Profile Index (API) 20 E strips (BioMerieux) was used as a biochemical
system for identification of Gram- negative rod bacteria. The API 20 E strip consists of 20
microtubes containing dehydrated substrates .These tests were inoculated with bacterial
suspension, which reconstitutes the media .The strips were incubation, metabolism
produces changes that are either spontaneous or revealed by the addition of reagents .The
standard were scored according to a Reading Table and the identification was obtained by
referring to the API catalogue.
4.2.2.3 Membrane filters (MF).
The MF technique was used in the isolation of bacteria from different water samples
according to the American Standard Methods for Examination of Water and Wastewater
(APHA, 1995).
4.2.3 Chemical and Physical Analysis of Water Samples.
All water samples used in the present study was investigated and examined for total
dissolved solids, nitrite, nitrate, chloride, calcium, magnesium, potassium, sodium,
hardness, biological oxygen demand (BOD), temperature, electrical conductivity, turbidity,
48
and pH according to the American Standard Methods for Examination of Water and
Wastewater (APHA el al., 1995).
4.2.3.1 Total dissolved solids (TDS)
Total dissolved solids (TDS) comprise inorganic salts (principally calcium, magnesium,
potassium, sodium, bicarbonates, chlorides and sulfates) and small amounts of organic
matter that are dissolved in water.(WHO, 2011).
Method: Gravimetric After Filtration
Procedure
1-. Wash filter paper by inserting it in the filtration assembly and filtering 3 successive 20
mL portions of distilled water. Continue suction to remove all traces of water. Discard
washings.
b. Dry evaporating dish at 104 ± 10 °
C for 1 h, cool and store in desiccator. Weigh
immediately before use.
c. Stir sample with a magnetic stirrer and while stirring pipette a measured volume on to
the filter using a wide bore pipette. Choose sample volume to yield between 10 and 200 mg
dried residue. Wash with three successive 10 mL volumes of distilled water. Continue
suction for about 3 min after filtration is complete.
d. Transfer total filtrate with washings to a weighed evaporating dish and evaporate to
dryness in an oven at 104 ± 10C. If necessary add successive portions to the same dish
after evaporation in order to yield between 10 and 200 mg dried residue. To prevent
splattering oven temperature may be lowered initially by 20 °
C below boiling point and
raised to 104 °C after evaporation for 1h. Cool in a desiccator and weigh.
Calculation
mg Dissolved Solids/L =
Where:
A = weight of dried residue + dish, mg
B = weight of dish, mg.
(A - B) x 1000
ml sample
49
4.2.3.2 Chloride
Chloride is present in natural waters from the dissolution of salt deposits, and
contamination from effluent disposal. Sodium chloride is widely used in the production of
industrial chemicals such as caustic soda, chlorine, and sodium chlorite and hypochlorite.
Potassium chloride is used in the production of fertilizers.
Method: Argentometric Titration
Procedure:
a. Use a 100 mL sample or a suitable portion diluted to 100 mL. If the sample is coloured
or turbid, add 3 mL Al(OH)3 suspension, mix, let settle and filter.
b. Add 1 mL K₂CrO₄ indicator solution; titrate with AgNO3 titrant to a pinkish yellow end
point.
c. Repeat the titration with distilled water blank. A blank of 0.2 to 0.3 mL is usual.
Calculation
Cl mg /L =
A = mL titration for sample
B = mL titration for blank
N = normality of AgNO3
4.2.3.3 Calcium
Method: EDTA Titrimetric
Procedure
a. Take 50 mL sample or an aliquot diluted to 50 mL such that the calcium content is not
more than 10 mg. Samples which contain alkalinity greater than 300 mg/L should be
neutralized with acid, boiled for 1 min and cooled before titration.
( A - B ) x N x 35 .450
ml sample

50
b. Add 2 mL NaOH solution or a volume sufficient to produce a pH of 12 to 13. Start
titration immediately after addition of the alkali. Add 0.1 to 0.2 g indicator mixture. Titrate
with EDTA solution, with continuous mixing, till the color changes from pink to purple.
Check end point by adding 1 to 2 drops excess titrant to make certain that no further color
change occurs.
Calculation
mg Ca/L=
Where:
A = mL titrant for sample
B =
4.2.3.4 Sodium
Depends on the appreciation of the idea of atoms flame burning. By a reception where they
are gentle on the filter element sodium. Special shades obscure the other elements and the
spectrum of sodium is absorbed only.
Method: Flame Emission Photometric
Procedure
a. Follow instructions of flame photometer manufacturer for selecting proper photocell,
wavelength, slit width adjustments, fuel gas and air pressure, steps for warm up, correcting
for interference and flame background, rinsing of burner, sample ignition and emission
intensity measurements.
b. Prepare a blank and sodium calibration standards, in any of the applicable ranges, 0-
100, 0-10, or 0-1 mg Na/L. Set instrument zero with standard containing no sodium.
Measure emission at 589nm and prepare calibration curve. Determine sodium
concentration of the sample, or diluted sample, from the curve.
mgNa/L= mgNa/L( from the calibration cuve ) x Dilution
A x B x 400.8
ml sample
mL of standard calcium solution taken for titration
mL EDTA titrant
51
Dilution =
4.2.3.5 Magnesium
Magnesium is one of the reasons total hardness. As a temporary hardship. And be in the
case of magnesium carbonate and hardship always either in the case magnesium nitrate.
Method: Calculation from Total Hardness and Calcium
Get the values for Total Hardness and Ca Hardness determined by EDTA and calculate
Mg.
Calculation:
mg mg/l = (TH as mg CaCO3/l - Calcium Hardness as mg CaCO3/l) x 0.243
Where:
TH = Total Hardness, mg CaCO3/l
4.2.2.6 Potassium
Depends on the appreciation of the idea of atoms flame burning. By a reception where they
are gentle on the filter element potassium. Special shades obscure the other elements and
the spectrum of potassium is absorbed only
Method: Flame Emission Photometric
a. Follow instructions of flame photometer manufacturer for selecting proper photocell,
wavelength, slit width adjustments, fuel gas and air pressure, steps for warm up, correcting
for interference and flame background, rinsing of burner, sample ignition and emission
intensity measurements.
b. Prepare a blank and potassium calibration standards, in any of the applicable ranges, 0-
100, 0-10, or 0-1 mg K/L. Measure emission at 766.5 nm and prepare calibration curve.
Determine potassium concentration of the sample, or diluted sample, from the curve.
mL sample + mL distilledwater
ml sample

52
mgK/L= mgK/L( from the calibration cuve ) x Dilution
Where:
Dilution =
4.2.3.7 Nitrite
Sample was analyzed quickly to avoid biochemical changes Converts nitrite To nitrate or
ammonia.
Method: Sulphanilamide Spectrophotometric
Spectrophotometer for use at 543nm or filter photometer with green filter, maximum
transmittance near 540nm, providing 1 cm light path or longer.
Spectrophotometer for use at 543nm or filter photometer with green filter, maximum
transmittance near 540nm, providing 1cm light path or longer.
a. Add 2 mL colour reagent to 50 mL sample, or to a portion diluted to 50 mL, and mix.
b. Measure absorbance at 543nm. Wait between 10 min and 2h after addition of color
reagent before measurement
c. Prepare standard curve by diluting 1, 2, 3, 4 and 5 mL of standard nitrite solution to 100
mL to give 5, 10, 15, 20 and 25 μg/L concentration, respectively.
Calculation:
Compute sample concentration directly from the curve, taking in consideration dilution of
the sample if applicable.
4.2.3.8 Nitrate
Spectrophotometer, for use at 220nm and 275nm with matched Silica cells of 1 cm or
longer light path.
Method: Uv Spectrophotometric
Spectrophotometer, for use at 220nm and 275nm with matched Silica cells of 1 cm or
longer light path.
Procedure
a. Treatment of sample: Add 1 mL HCl to 50 mL clear/filtered sample, mix.
mL sample + mL distilledwater
ml sample

53
b. Preparation of standard curve: Prepare calibration standards in the range of 0-7 mg NO3-
-N/L, by diluting to 50 mL the following volumes of standard solutions; add 1 mL of HCl
and mix.
Nitrate Standard
solution, mL 1 2 4 7 10 15 20 25 30 35
NO3--N, mg/l 0.2 0.4 0.8 1.4 2.0 3.0 4.0 5.0 6.0 7.0
c. Spectrophotometric measurements: Read absorbance or transmittance against re-distilled
water set at zero absorbance or 100 % transmittance. Use a wavelength of 220 _m to obtain
nitrate reading and a wavelength of 275nm to determine interference due to dissolved
organic matter.
4.2.3.9 Biochemical oxygen demand(BOD5)
The principle of the method involves measuring the difference between the oxygen
concentration of the sample and after incubation it for five days at 20 oC .
Procedure:
1.prepare dilution water in a glass container by bubbling compressed air in distilled
water for about 30 minutes.
2. Add one ml of each of Phosphate buffer, Magnesium Sulphate, Calcium Chloride,
and Ferric Chloride solutions for each liter of dilution water and mix throughly.
3.Neutralize the sample to pH arround 7.0 by using 0.1 N NaOH or H2SO4.
4.Since the DO in the sample is likely to be exhausted, it is usually necessary to prepare a
suitable dilution of the sample according to the expected BOD5 range.
5. Prepare dilutions in a bucket or large glass through, mix the contents thoroughly, fill
two sets of the BOD5 bottles.
6.Keep one set of the bottles in BOD5 incubator at 20 °C for Five days, and determine
the DO content in another set immediately.
7.Determine DO in the sample bottles immediately after the completion of five days
of incubation
54
Calculation:
BOD, mg/l = Do – D5 x dilution factor.
Where Do = initial Do in the sample.
D5 = Do after five days
4.2.3.10 Total hardness
Total hardness is the sum of the concentrations of calcium and magnesium ions expressed
as a calcium carbonate equivalent. Hardness may also be classified as carbonate
(temporary) or noncarbonated (permanent) hardness.
Method: EDTA Titrimetric
Procedure
a. Dilute 25 mL sample to 50 mL with distilled water. Add 1 to 2 mL buffer to give a pH of
10.0 to 10.1. Add 1 to 2 drops of indicator solution and titrate with EDTA titrant to change
in colour from reddish tinge to blue. Select a sample volume that requires less than 15 mL
EDTA titrant and complete titration within 5 min after buffer addition.
b. Standardize the EDTA titrant against standard calcium solution using the above
procedure.
Calculation
Total Hardness (EDTA), mg CaCO /L =
Where:
A = mL EDTA titrated for sample
B = mg CaCO3 equivalent to 1.00 mL EDTA titrant
A x B x 1000
ml sample
55
4.2.3.11 Turbidity
Method: Nephelometric
Procedure
a. Calibrate nephelometer according to manufacturer‘s operating instructions. Run at least
one standard in each instrument range to be used.
b. Gently agitate sample. Wait until air bubbles disappear and pour sample into cell. Read
turbidity directly from instrument display.
4.2.3.12 Electric conductivity
The electric conductivity (EC) was measured by electric conductivity meter. The
instrument was calibrated with potassium chloride solution and set up at zero scale with
reference solution. The unit of measurement was Microohms/Cm (Ms/Cm).
4.2.3.13 pH value:
Field pH meter electrode was washed with distilled water, dried with soft tissue, calibrated,
washed again with distilled water and dried prior to immersing the electrode in the sample.
Samples were stirred gently. Stable readings were recorded.
4.2.3.14 Temperature
Method: Mercury Thermometer
The temperature of the water was measured immediatly at place of samples collection .
Procedure
a. Immerse thermometer in the sample up-to the mark specified by the manufacturer and
read temperature after equilibration.
b. When a temperature profile at a number of different depths is required a thermistor with
a sufficiently long lead may be used.
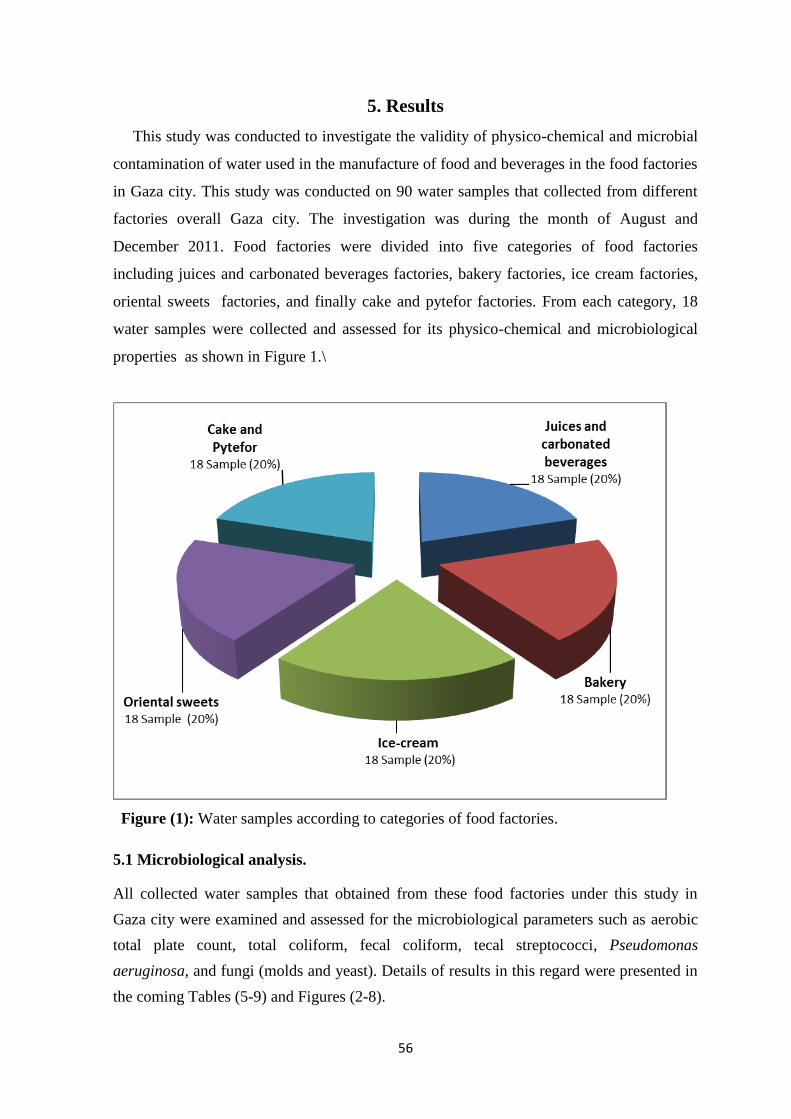
56
5. Results
This study was conducted to investigate the validity of physico-chemical and microbial
contamination of water used in the manufacture of food and beverages in the food factories
in Gaza city. This study was conducted on 90 water samples that collected from different
factories overall Gaza city. The investigation was during the month of August and
December 2011. Food factories were divided into five categories of food factories
including juices and carbonated beverages factories, bakery factories, ice cream factories,
oriental sweets factories, and finally cake and pytefor factories. From each category, 18
water samples were collected and assessed for its physico-chemical and microbiological
properties as shown in Figure 1.\
Figure (1): Water samples according to categories of food factories.
5.1 Microbiological analysis.
All collected water samples that obtained from these food factories under this study in
Gaza city were examined and assessed for the microbiological parameters such as aerobic
total plate count, total coliform, fecal coliform, tecal streptococci, Pseudomonas
aeruginosa, and fungi (molds and yeast). Details of results in this regard were presented in
the coming Tables (5-9) and Figures (2-8).

57
5.1.1 Microbiological analysis of water samples that collected from juices and
carbonated beverages factories
Results in Table (5) show that aerobic total plate count bacteria (TPC) were positive for
all samples tested and the count of colonies ranged from 5 to 340 CFU/ml. Total Coliform
(TC) was positive in 16 samples from 18 which represented (88.8%) of the total samples.
Fecal Coliform ( FC) was positive in 15 samples from 18 that represented (83.3%) of the
total samples. Fecal Streptococci (FS) was positive in only 7 samples from 18 which
represented (38.8%) of the total samples. However and unexpectedly Pseudomonas
aeruginosa was positive in 15 samples out of 18, which represented (83.3%) of the total
samples. Molds were positive in 5 samples from 18 that represented (27.7%) of the total
samples. Yeasts were positive in 3 samples from 18 that represented (16.7%) of the total
samples. Tese result, inclicated that most of water samples that collected from this factories
category were contaminated with different pathogen indicators, especially fecal coliform
bacteria and Pseudomonas aeruginosa (83.3% for each).
Table (5): Microbiological assessment of water samples collected from Juices and carbonated
beverages factories
No. Test CFU Sample
Total Min-Max Positive %
1 TPC 5-340 18 100 18
2 TC 20-200 16 88.8 18
3 FC 2-50 15 83.3 18
4 FS 2-11 7 38.8 18
5 PS 3-15 15 83.3 18
6 Mold 1-3 5 27.7 18
7 Yeast 10-26 3 16.7 18
TPC= Total Plate Count CFU/1 ml, FS= Fecal Streptococci CF/100 ml
TC= Total Coliform CFU/100 ml, FC= Fecal Coliform CFU/100 ml
PS= Pseudomonas aeruginosa CFU/200 ml, CFU= colony forming unit

58
5.1.2 Microbiological analysis of ice cream factories
Results in Table (6) showed that aerobic total plate count (TPC) were found in 15 samples
from 18, which represented (83.3%) of the total samples. Number of colonies were ranged
from 2 to 110 CFU/ml. Total coliform (TC) was positive in 14 samples from 18 that
represented (77.7%) of the total samples. Fecal coliform ( FC) was positive in 12 samples
from 18, which represented (66.6%) of the total samples. Fecal streptococci (FS) was
positive in only half of tested water samples (9 samples), out of 18 which represented
(50%) of the total samples. Meanwhile, Pseudomonas aeruginosa was positive in 10
samples from 18 that represented (55.5%) of the total samples. Mold was positive in only
2 samples from 18, which represented (11.1%) of the total samples. However, Yeast was
positive in 6 samples from 18 that represented (33.4%) of the total samples.
Table (6): Microbiological assessment of water samples collected from ice cream factories
No. Test CFU Sample
Total sample Min-Max Positive %
1 TPC 2-110 15 83.3 18
2 TC 4-215 14 77.7 18
3 FC 1-85 12 66.6 18
4 FS 1-125 9 50 18
5 PS 5-70 10 55.5 18
6 Mold 1-2 2 11.1 18
7 Yeast 5-40 6 33.4 18
TPC= Total Plate Count CFU/1 ml, FS= Fecal Streptococci CF/100 ml
TC= Total Coliform CFU/100 ml, FC= Fecal Coliform CFU/100 ml
PS= Pseudomonas aeruginosa CFU/200 ml, CFU= colony forming unit
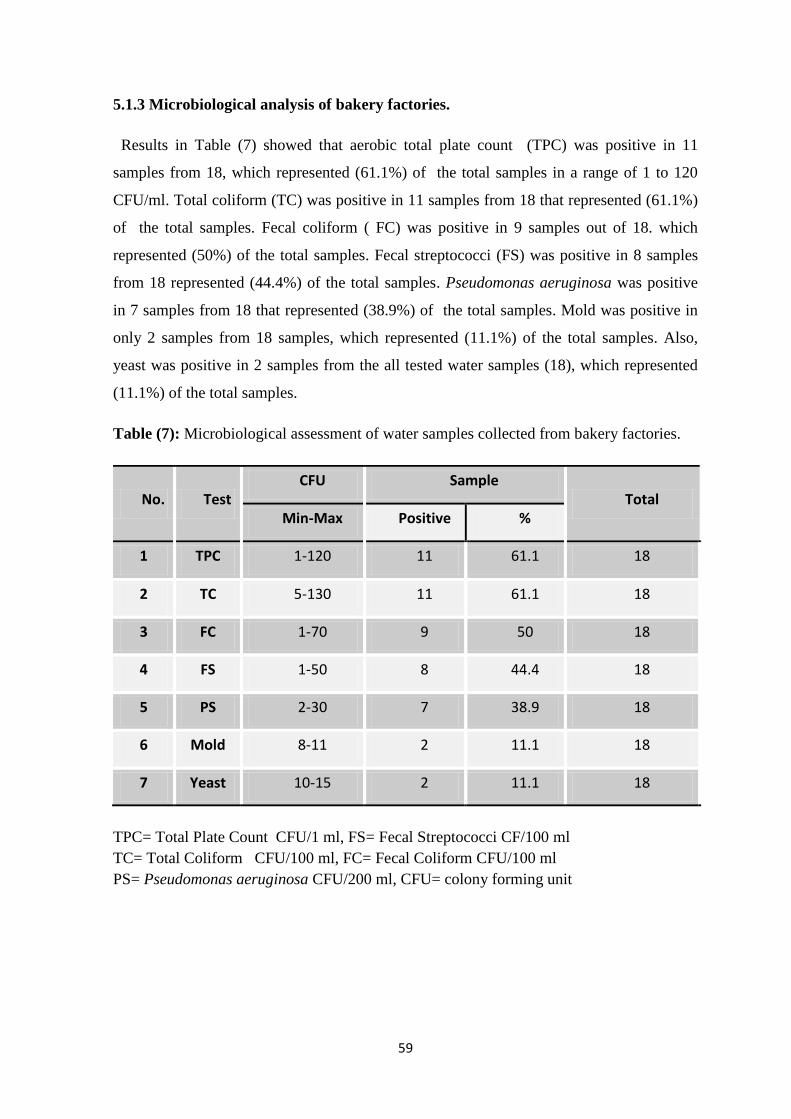
59
5.1.3 Microbiological analysis of bakery factories.
Results in Table (7) showed that aerobic total plate count (TPC) was positive in 11
samples from 18, which represented (61.1%) of the total samples in a range of 1 to 120
CFU/ml. Total coliform (TC) was positive in 11 samples from 18 that represented (61.1%)
of the total samples. Fecal coliform ( FC) was positive in 9 samples out of 18. which
represented (50%) of the total samples. Fecal streptococci (FS) was positive in 8 samples
from 18 represented (44.4%) of the total samples. Pseudomonas aeruginosa was positive
in 7 samples from 18 that represented (38.9%) of the total samples. Mold was positive in
only 2 samples from 18 samples, which represented (11.1%) of the total samples. Also,
yeast was positive in 2 samples from the all tested water samples (18), which represented
(11.1%) of the total samples.
Table (7): Microbiological assessment of water samples collected from bakery factories.
No. Test CFU Sample
Total Min-Max Positive %
1 TPC 1-120 11 61.1 18
2 TC 5-130 11 61.1 18
3 FC 1-70 9 50 18
4 FS 1-50 8 44.4 18
5 PS 2-30 7 38.9 18
6 Mold 8-11 2 11.1 18
7 Yeast 10-15 2 11.1 18
TPC= Total Plate Count CFU/1 ml, FS= Fecal Streptococci CF/100 ml
TC= Total Coliform CFU/100 ml, FC= Fecal Coliform CFU/100 ml
PS= Pseudomonas aeruginosa CFU/200 ml, CFU= colony forming unit
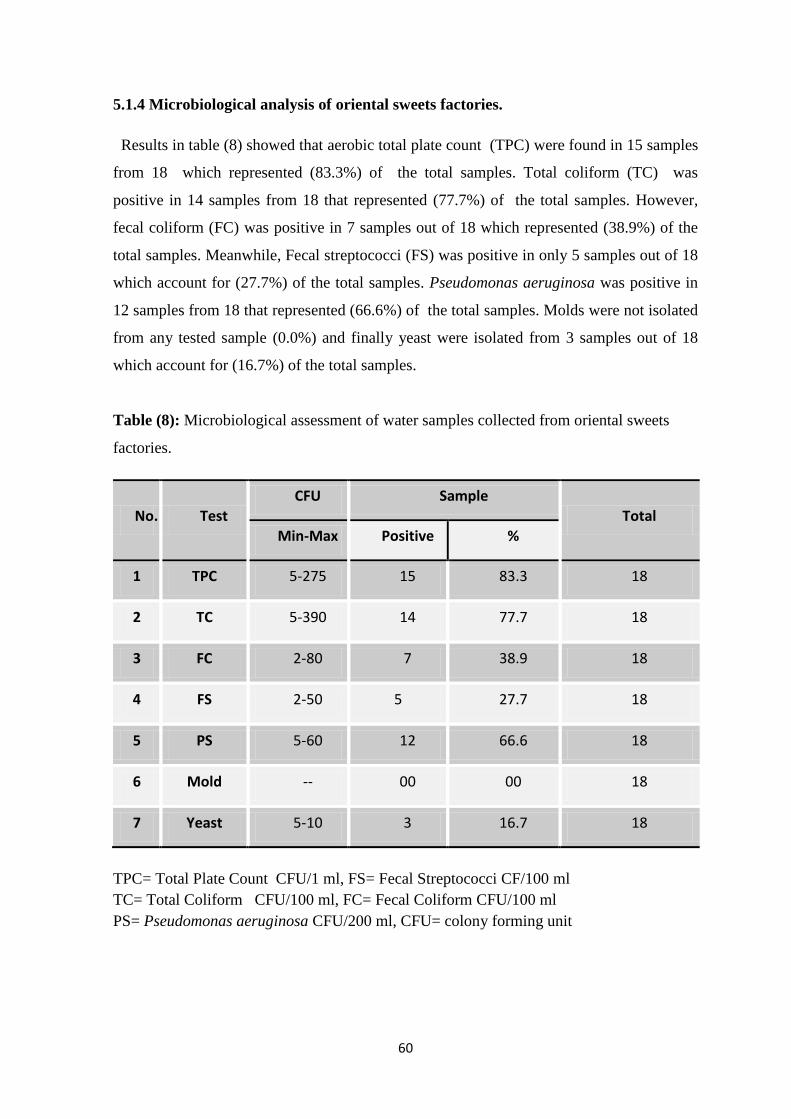
60
5.1.4 Microbiological analysis of oriental sweets factories.
Results in table (8) showed that aerobic total plate count (TPC) were found in 15 samples
from 18 which represented (83.3%) of the total samples. Total coliform (TC) was
positive in 14 samples from 18 that represented (77.7%) of the total samples. However,
fecal coliform (FC) was positive in 7 samples out of 18 which represented (38.9%) of the
total samples. Meanwhile, Fecal streptococci (FS) was positive in only 5 samples out of 18
which account for (27.7%) of the total samples. Pseudomonas aeruginosa was positive in
12 samples from 18 that represented (66.6%) of the total samples. Molds were not isolated
from any tested sample (0.0%) and finally yeast were isolated from 3 samples out of 18
which account for (16.7%) of the total samples.
Table (8): Microbiological assessment of water samples collected from oriental sweets
factories.
No. Test
CFU Sample
Total
Min-Max Positive %
1 TPC 5-275 15 83.3 18
2 TC 5-390 14 77.7 18
3 FC 2-80 7 38.9 18
4 FS 2-50 5 27.7 18
5 PS 5-60 12 66.6 18
6 Mold -- 00 00 18
7 Yeast 5-10 3 16.7 18
TPC= Total Plate Count CFU/1 ml, FS= Fecal Streptococci CF/100 ml
TC= Total Coliform CFU/100 ml, FC= Fecal Coliform CFU/100 ml
PS= Pseudomonas aeruginosa CFU/200 ml, CFU= colony forming unit

61
5.1.5 Microbiological analysis of cake and pytefor factories.
Results in table (9) showed the microbiological assessment of water samples that used in
cake factories. The total plate count (TPC) were found in 17 samples from 18 which
represented (94.4%) of the total samples. Total coliform (TC) bacteria was positive in 15
samples from 18 which represented (83.3%) of the total samples. Fecal coliform ( FC)
was positive in 12 samples from 18 represented (66.6%) of the total samples. So far, Fecal
streptococci (FS) was positive in 9 samples from 18 which represented (50%) of the total
samples. Pseudomonas aeruginosa was positive in 12 samples out of 18 which represented
(66.6%) of the total samples. Both molds and yeast were isolated from 8 samples out of 18
which represented (44.4%) of the total tested samples.
Table (9): Microbiological assessment of water samples collected from Cake and pytefor
factories .
No. Test CFU Sample
Total Min-Max Positive %
1 TPC 5-590 17 94.4 18
2 TC 5-280 15 83.3 18
3 FC 2-100 12 66.6 18
4 FS 4-35 9 50 18
5 PS 1-30 12 66.6 18
6 Mold 1-4 8 44.4 18
7 Yeast 5-35 8 44.4 18
TPC= Total Plate Count CFU/1 ml, FS= Fecal Streptococci CF/100 ml
TC= Total Coliform CFU/100 ml, FC= Fecal Coliform CFU/100 ml
PS= Pseudomonas aeruginosa CFU/200 ml, CFU= colony forming unit
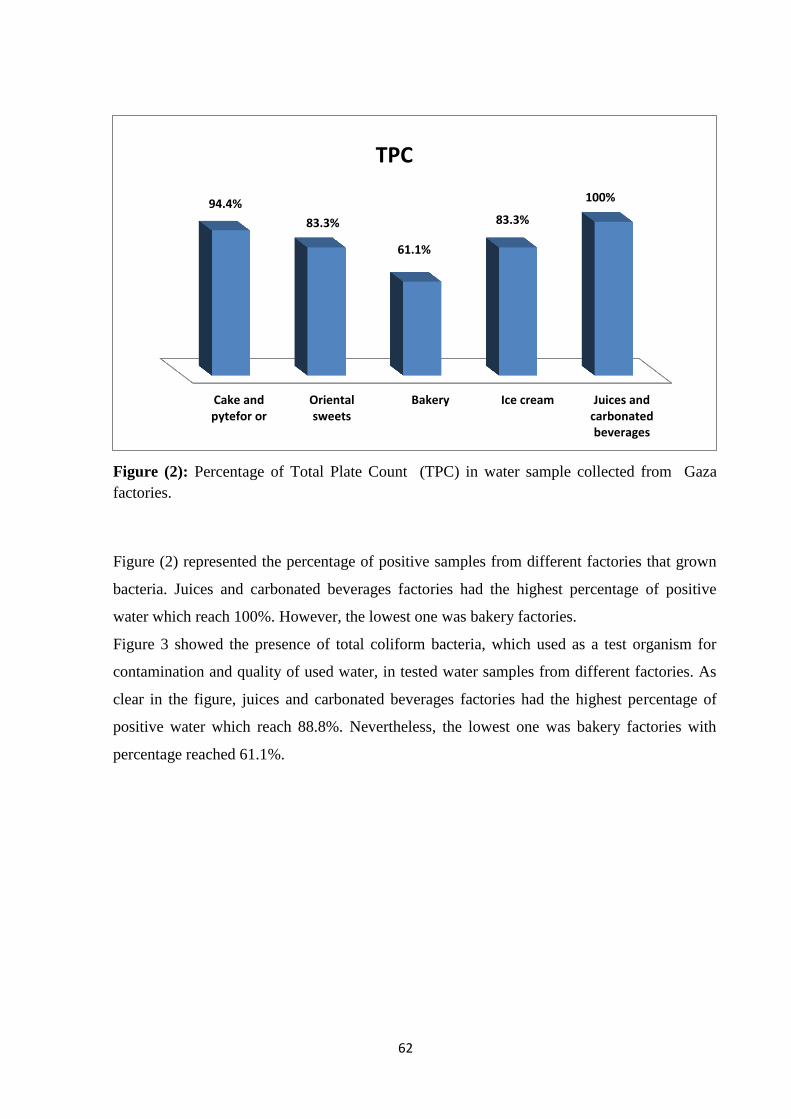
62
Figure (2): Percentage of Total Plate Count (TPC) in water sample collected from Gaza
factories.
Figure (2) represented the percentage of positive samples from different factories that grown
bacteria. Juices and carbonated beverages factories had the highest percentage of positive
water which reach 100%. However, the lowest one was bakery factories.
Figure 3 showed the presence of total coliform bacteria, which used as a test organism for
contamination and quality of used water, in tested water samples from different factories. As
clear in the figure, juices and carbonated beverages factories had the highest percentage of
positive water which reach 88.8%. Nevertheless, the lowest one was bakery factories with
percentage reached 61.1%.
Juices andcarbonatedbeverages
Ice creamBakeryOrientalsweets
Cake andpytefor or
100%
83.3%
61.1%
83.3%
94.4%
TPC

63
Figure (3): Percentage contamination of TC in water sample collected from Gaza factories
Figure 4 showed the percentage of fecal coliform contamination. Again, the juices and
beverages factories represented the highest contamination water samples (83.3%) but the
lowest FC contamination (38.9%) was found in oriental sweets factories.
Figure (4): Percentage Contamination of FC in water sample collected from Gaza factories.
Juices andcarbonatedbeverages
Ice creamBakeryOriental sweetsCake andpytefor
88.8%
77.7%
61.1%
77.7% 83.3%
TC
Juices andcarbonatedbeverages
Ice creamBakeryOriental sweetsCake andpytefor
83.3%
66.6%
50%
38.9%
66.6%
FC
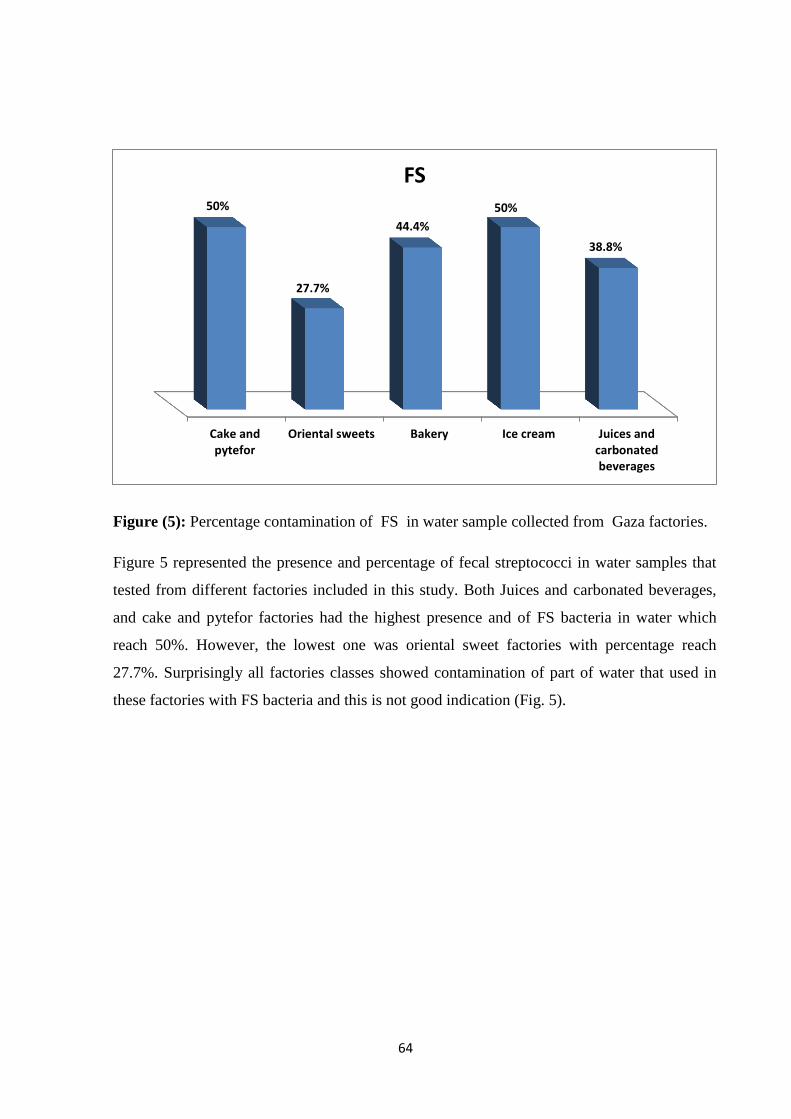
64
Figure (5): Percentage contamination of FS in water sample collected from Gaza factories.
Figure 5 represented the presence and percentage of fecal streptococci in water samples that
tested from different factories included in this study. Both Juices and carbonated beverages,
and cake and pytefor factories had the highest presence and of FS bacteria in water which
reach 50%. However, the lowest one was oriental sweet factories with percentage reach
27.7%. Surprisingly all factories classes showed contamination of part of water that used in
these factories with FS bacteria and this is not good indication (Fig. 5).
Juices andcarbonatedbeverages
Ice creamBakeryOriental sweetsCake andpytefor
38.8%
50%
44.4%
27.7%
50%
FS

65
Figure (6): Percentage contamination of PS in water samples collected from Gaza factories.
Figure (7):Percentage contamination of mold in water samples collected from Gaza factories.
Figure 6 showed the presence and percentage of Pseudomonas aeruginosa, which used as a
test organism for contamination and quality of used water, in tested water samples from
different factories. As clear in this figure, juices and carbonated beverages factories again had
the highest percentage of contaminated water samples with PS which reach 83.3%.
Juices andcarbonatedbeverages
Ice creamBakeryOrientalsweets
Cake andpytefor
83.3%
55.5%
38.9%
66.6% 66.6%
PS
Juices andcarbonatedbeverages
Ice creamBakeryCake and pytefor
27.7%
11.1% 11.1%
44.4%
Mold

66
Nevertheless, the lowest one was also again bakery factories with percentage reached 38.9%.
Generally, all factories classes showed presence of PS in water used in these factories but with
different percentage of contamination (Fig. 6).
In figure 7 we presented the presence of molds in tested water samples from all factories
classes. As shown in the figure, cake and pytefor had the highest prevalence of mold
contaminated water with a percentage of 44.4%, followed by juices and carbonated beverages
factories which had a percentage of positive water with mold reach 27.7%. Nevertheless, the
lowest one was bakery and ice cream factories with a percentage reached 11.1%.
Interestingly, all water samples that collected from oriental sweet factories were tested
negative for presence of molds.
Figure (8):Percentage contamination of yeast in water samples collected from Gaza factories.
In figure 8 we presented the presence of yeast in tested water samples from all factories
classes. As shown in this figure, all factories had contaminated water with yeast. Cake and
pytefor had the highest prevalence of yeast contaminated water with a percentage of 44.4%,
followed by ice cream factories (33.4%), then the juices and carbonated beverages factories
and oriental sweet factories which had a percentage of positive water with mold reach 16.7%.
Nevertheless, the lowest one was bakery factories with a percentage reached 11.1%.
Juices andcarbonatedbeverages
Ice creamBakeryOriental sweetsCake andpytefor
16.7%
33.4%
11.1%
16.7%
44.4%
Yeast

67
5.1.6 Microbial contamination of water samples that collected from all five group
factories.
Results in Table 10 and figure 9 showed the overall contamination of water samples with
different bacterial indicators and also the total plate count of aerobic bacteria.
Table (10): Microbial contamination in water of all five group factories.
No. Test done All factories CFU Total samples
+ve % Min-Max
1 TPC 76 84.4 1-590 90
2 TC 70 77.7 4-390 90
3 FC 55 61.1 1-100 90
4 FS 38 42.2 1-125 90
5 PS 56 62.2 1-70 90
6 Mold 17 18.8 0-11 90
7 Yeast 22 24.4 5-40 90
TPC= Total Plate Count CFU/1 ml, FS= Fecal Streptococci CF/100 ml
TC= Total Coliform CFU/100 ml, FC= Fecal Coliform CFU/100 ml
PS= Pseudomonas aeruginosa CFU/200 ml, CFU= colony forming unit

68
Figure (9):Percentage contamination in all water samples that collected from Gaza
factories.
The TPC was found in 76 samples out of 90 which represented (84.4%) of the total
samples tested. Total coliform (TC) was positive in 70 samples out of tested 90 water
sample which represented (77.7%) of the total samples. Fecal coliform ( FC) was positive
in 55 samples with percentage of (61.1%) of the total samples. Fecal streptococci (FS) was
positive in 38 samples with percentage of (42.2%) of the total samples. Pseudomonas
aeruginosa was positive in 56 out of 90 that represented (62.2%) of the total samples.
Mold was positive in 17 samples and this represented (18.8%) of the total tested samples.
Finally, yeast was positive in 22 samples which represented (24.4%) of the total samples.
5.2 Physicochemical analysis
All the tested collected samples obtained from the food factories in Gaza were
examined for the physicochemical prameters such as Temperature, Electrical
Conductivity, Turbidity, pH according , Total dissolved solids, Nitrite, Nitrate ,Chloride,
Calcium, Magnesium, Potassium, Sodium, Hardness, and Biological Oxygen
Demand(BOD) . see tables (11-15) and figures (10-22).
TPC;76 ( 84.4%)
TC;70 ( 77.7%)
FC;55 ( 61.1)%
FS; 38 (42.2%)
PS; 56 (62.2%)
Mold;17 (18.8%)
Yeast;22 (24.4%)

69
5.2.1 Physicochemical analysis of water samples from juices and carbonated
beverages factories.
Results in Table (11) showed that average TDS was of 135.03mg/l for all samples.
Average Chloride was of 59.7 mg/l for all samples. Average calcium was of 2.33 mg/l for
all samples. Average sodium was of 32.56 mg/l for all samples. Average magnesium was
of 1.09 mg/l for all samples. Average potassium was of 1.12 mg/l for all samples. Average
nitrite was of 0.00 mg/l for all samples. Average nitrates was of 10.46 mg/l for all samples.
BOD was the outcome average 1.15 mg/l for all samples . Average HN was of 11.78 mg/l
for all samples. Average measurement of turbidity was of 0.22 NTU for all samples.
Average measurement of electrical conductivity was of 218.09 μs/cm for all samples.
Average measurement of pH was of 6.41 pH. The temperature was registered by Alturmo
Lemaitre average of 26.55 °C degrees per samples.
Table (11) : Average of physicochemical parameters at at water from Juices and carbonated
beverages factories.
No Parameter
s
Average
Sample
factories
(1)
Average
Sample
factories
(2)
Average
Sample
factories
(3)
Average
Sample
factories
(4)
Average
Sample
factories
(5)
Average
Sample
factories
(6)
Average
all
Sample
factories
1 TDS.mg/l 282.33 86.33 66.17 102.00 225.33 48 135.03
2 Cl.mg/l 97.87 42.93 42.57 42.94 101.4 27.31 59.17
3 Ca.mg/l 3.07 1.57 2.36 3.87 1.57 1.53 2.33
4 Na.mg/l 75.67 24.33 7.67 19.67 64.33 3.67 32.56
5 Mg.mg/l 1.92 0.03 0.03 1.41 2.73 0.42 1.09
6 K .mg/l 0.53 0.13 0.23 0.37 2.47 2.97 1.12
7 NO2.mg/l 0.00 0.00 0.00 0.00 0.00 0.00 0.00
8 NO3.mg/l 13.17 11.27 9.53 17.33 5.33 6.10 10.46
9 BOD.mg/l 1.10 0.27 0.17 1.47 3.87 0.03 1.15
10 HN.mg/l 17 6.53 8.67 16.00 16.67 5.83 11.78
11 T. NTU 0.25 0.18 0.15 0.36 0.19 0.21 0.22
12 EC. μs/cm 461.33 142.7 105.9 162.67 358.33 77.6 218.09
13 pH 7.15 6.51 6.52 6.61 5.92 5.77 6.41
14 Temp 25 25.03 26.9 29.67 27.03 25.67 26.55
TDS= Total dissolved solids EC= Electrical conductivity
T= Turbidity HN = Hardness
BOD= Biological Oxygen Demand TEMP= Temperatu
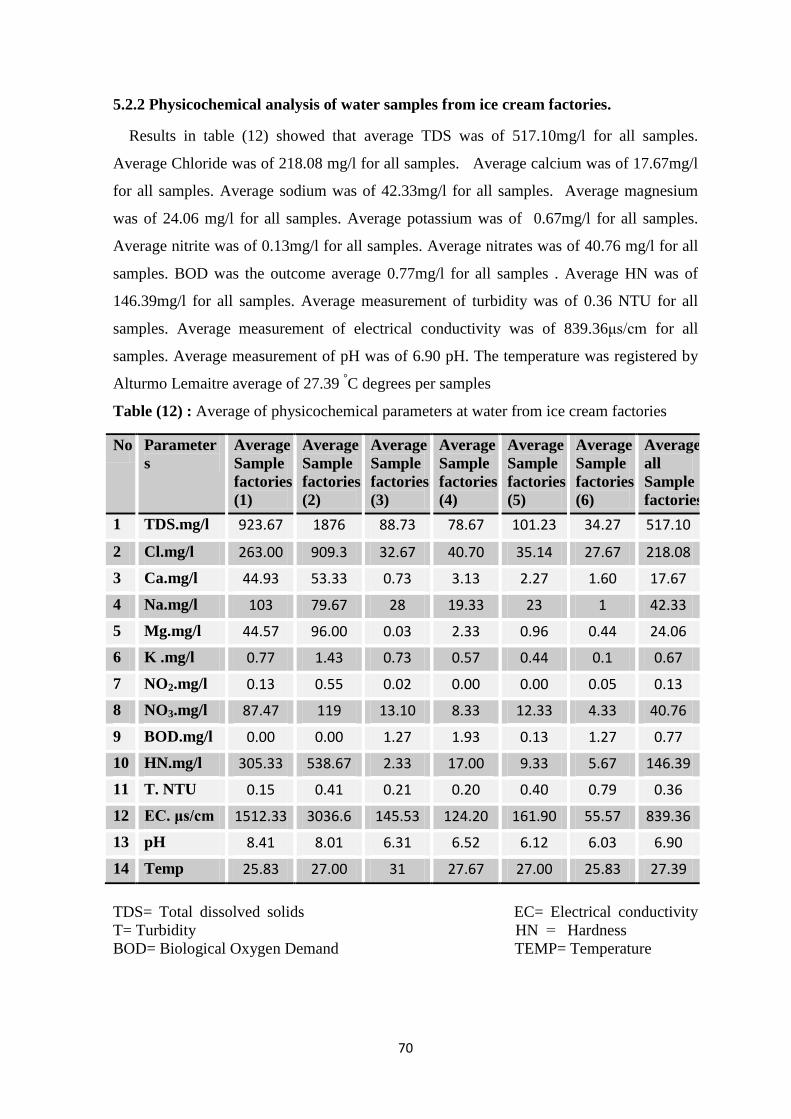
70
5.2.2 Physicochemical analysis of water samples from ice cream factories.
Results in table (12) showed that average TDS was of 517.10mg/l for all samples.
Average Chloride was of 218.08 mg/l for all samples. Average calcium was of 17.67mg/l
for all samples. Average sodium was of 42.33mg/l for all samples. Average magnesium
was of 24.06 mg/l for all samples. Average potassium was of 0.67mg/l for all samples.
Average nitrite was of 0.13mg/l for all samples. Average nitrates was of 40.76 mg/l for all
samples. BOD was the outcome average 0.77mg/l for all samples . Average HN was of
146.39mg/l for all samples. Average measurement of turbidity was of 0.36 NTU for all
samples. Average measurement of electrical conductivity was of 839.36μs/cm for all
samples. Average measurement of pH was of 6.90 pH. The temperature was registered by
Alturmo Lemaitre average of 27.39 °C degrees per samples
Table (12) : Average of physicochemical parameters at water from ice cream factories
No Parameter
s
Average
Sample
factories
(1)
Average
Sample
factories
(2)
Average
Sample
factories
(3)
Average
Sample
factories
(4)
Average
Sample
factories
(5)
Average
Sample
factories
(6)
Average
all
Sample
factories
1 TDS.mg/l 923.67 1876 88.73 78.67 101.23 34.27 517.10
2 Cl.mg/l 263.00 909.3 32.67 40.70 35.14 27.67 218.08
3 Ca.mg/l 44.93 53.33 0.73 3.13 2.27 1.60 17.67
4 Na.mg/l 103 79.67 28 19.33 23 1 42.33
5 Mg.mg/l 44.57 96.00 0.03 2.33 0.96 0.44 24.06
6 K .mg/l 0.77 1.43 0.73 0.57 0.44 0.1 0.67
7 NO2.mg/l 0.13 0.55 0.02 0.00 0.00 0.05 0.13
8 NO3.mg/l 87.47 119 13.10 8.33 12.33 4.33 40.76
9 BOD.mg/l 0.00 0.00 1.27 1.93 0.13 1.27 0.77
10 HN.mg/l 305.33 538.67 2.33 17.00 9.33 5.67 146.39
11 T. NTU 0.15 0.41 0.21 0.20 0.40 0.79 0.36
12 EC. μs/cm 1512.33 3036.6 145.53 124.20 161.90 55.57 839.36
13 pH 8.41 8.01 6.31 6.52 6.12 6.03 6.90
14 Temp 25.83 27.00 31 27.67 27.00 25.83 27.39
TDS= Total dissolved solids EC= Electrical conductivity
T= Turbidity HN = Hardness
BOD= Biological Oxygen Demand TEMP= Temperature

71
5.2.3 physicochemical analysis of water samples from bakery factories
Results in table (13) showed that average TDS was of 2104.50 mg/l for all samples.
Average Chloride was of 1042.82 mg/l for all samples. Average calcium was of 142.75
mg/l for all samples. Average sodium was of 400.44 mg/l for all samples. Average
magnesium was of 81.91 mg/l for all samples. Average potassium was of 3.54 mg/l for all
samples. Average nitrite was of 0.61 mg/l for all samples. Average nitrates was of 125.17
mg/l for all samples. BOD was the outcome average 0.19 mg/l for all samples . Average
HN was of 708.89 mg/l for all samples. Average measurement of turbidity was of 0.27
NTU for all samples. Average measurement of electrical conductivity was of 3438.50
μs/cm for all samples. Average measurement of pH was of 7.45 pH. The temperature was
registered by Alturmo Lemaitre average of 29.18 °C degrees per samples
Table (13): Average of physicochemical parameters at at water from bakery factories
No Parameter
s
Average
Sample
factories
(1)
Average
Sample
factories
(2)
Average
Sample
factories
(3)
Average
Sample
factories
(4)
Average
Sample
factories
(5)
Average
Sample
factories
(6)
Average
all
Sample
factories
1 TDS.mg/l 2128.33
2605.33
1245.67
3124.33
2293.67
1229.67
2104.50
2 Cl.mg/l 928.67 596.50 410 1403.33
1048.00
1870.43
1042.82 3 Ca.mg/l 101.67 149.67 88.17 161.00 222.67 133.33 142.75
4 Na.mg/l 276.33 457 263.67 719.33 429.33 257.00 400.44
5 Mg.mg/l 80.37 81.77 49.97 138.8 109 31.57 81.91
6 K .mg/l 1.43 15.67 1.67 1.47 0.47 0.53 3.54
7 NO2.mg/l 0.66 0.91 0.47 0.92 0.40 0.27 0.61
8 NO3.mg/l 139.00 127.67 116.67 116.33 152.67 98.67 125.17
9 BOD.mg/l 0.00 0.87 0.00 0.00 0.00 0.27 0.19
10 HN.mg/l 595.33 719 443.33 993 1044 458.67 708.89
11 T. NTU 0.25 0.26 0.25 0.30 0.23 0.33 0.27
12 EC. μs/cm 3456.33
4222 2034 5078.67
3816 2024 3438.50 13 pH 7.67 7.43 7.39 7.51 7.34 7.36 7.45
14 Temp 26.8 30.53 28.77 31 29 29 29.18
TDS= Total dissolved solids EC= Electrical conductivity
T= Turbidity HN = Hardness
BOD= Biological Oxygen Demand TEMP= Temperature

72
5.2.4 Physicochemical analysis of water samples from oriental sweets factories.
Results in table (14) showed that average TDS was of 731.03 mg/l for all samples.
Average Chloride was of 355.29 mg/l for all samples. Average calcium was of 35.52 mg/l
for all samples. Average sodium was of 98.11 mg/l for all samples. Average magnesium
was of 28.37 mg/l for all samples. Average potassium was of 0.61 mg/l for all samples.
Average nitrite was of 0.22 mg/l for all samples. Average nitrates was of 43.69 mg/l for all
samples. BOD was the outcome average 1.49 mg/l for all samples . Average HN was of
209.46 mg/l for all samples. Average measurement of turbidity was of 0.30 NTU for all
samples. Average measurement of electrical conductivity was of 1067.74 μs/cm for all
samples. Average measurement of pH was of 6.98 pH. The temperature was registered by
Alturmo Lemaitre average of 28.86 °C degrees per samples
Table (14) : Average of physicochemical parameters at water from Oriental sweets factories
No Parameter
s
Average
Sample
factories
(1)
Average
Sample
factories
(2)
Average
Sample
factories
(3)
Average
Sample
factories
(4)
Average
Sample
factories
(5)
Average
Sample
factories
(6)
Average
all
Sample
factories
1 TDS.mg/l 68.7 2946.33 120.80 1045.00 127.37 77.97 731.03
2 Cl.mg/l 27.03 1597.33 64.15 337.33 70.32 35.60 355.29
3 Ca.mg/l 3 132.87 1.63 69.50 1.57 4.53 35.52
4 Na.mg/l 4.9 301.33 38.10 195.00 39.67 9.67 98.11
5 Mg.mg/l 2.37 118.7 1.83 45.43 0.00 1.90 28.37
6 K .mg/l 0.37 1.67 0.30 0.77 0.27 0.27 0.61
7 NO2.mg/l 0.00 1.17 0.00 0.15 0.00 0.02 0.22
8 NO3.mg/l 9.6 136 12.8 82. 13 8.73 43.69
9 BOD.mg/l 0.17 0.00 2.47 0.17 1.87 4.23 1.49
10 HN.mg/l 17.10 837.33 12.00 366.33 4.33 19.67 209.46
11 T. NTU 0.15 0.46 0.13 0.13 0.25 0.68 0.30
12 EC. μs/cm 111.93 4072.33 193.37 1702.00 200.33 126.50 1067.74
13 pH 6.66 7.93 7.11 7.72 6.28 6.17 6.98
14 Temp 25 29 30 29.13 30 30 28.86
TDS= Total dissolved solids EC= Electrical conductivity
T= Turbidity HN = Hardness
BOD= Biological Oxygen Demand TEMP= Temperature

73
5.2.5 Physicochemical analysis of water samples from cake and pytefor factories.
Results in table (15) showed that average TDS was of 640.80 mg/l for all samples.
Average chloride was of 265.21 mg/l for all samples. Average calcium was of 44.02 mg/l
for all samples . Average sodium was of 122.03 mg/l for all samples. Average magnesium
was of 21.99 mg/l for all samples. Average potassium was of 1.28 mg/l for all samples.
Average nitrite was of 0.18 mg/l for all samples. Average nitrates was of 59.85 mg/l for all
samples. BOD was the outcome average 2.77 mg/l for all samples . Average HN was of
203.06 mg/l for all samples. Average measurement of turbidity was of 0.26 NTU for all
samples. Average measurement of electrical conductivity was of 1032.80 μs/cm for all
samples. Average measurement of pH was of 7.05 pH. The temperature was registered by
Alturmo Lemaitre average of 29.33 °C degrees per samples
Table (15): Average of physicochemical parameters at water from Cake and pytefor
factories
No Parameter
s
Average
Sample
factories
(1)
Average
Sample
factories
(2)
Average
Sample
factories
(3)
Average
Sample
factories
(4)
Average
Sample
factories
(5)
Average
Sample
factories
(6)
Average
all
Sample
factories
1 TDS.mg/l 2013.3 77.8 120.13 46.2 1504 83.37 640.80
2 Cl.mg/l 906.67 35.58 56.77 26.33 530.67 35.23 265.21
3 Ca.mg/l 72.27 6.43 7.33 1.57 171.93 4.57 44.02
4 Na.mg/l 377.67 7.67 21.00 9.67 315.33 0.83 122.03
5 Mg.mg/l 81.2 2.77 3.15 0.00 42.50 2.30 21.99
6 K .mg/l 1.78 1.57 1.37 0.10 1.67 1.17 1.28
7 NO2.mg/l 0.62 0.00 0.00 0.00 0.33 0.11 0.18
8 NO3.mg/l 157.00 9.67 5.93 8.19 164 14.33 59.85
9 BOD.mg/l 0.57 4.73 3.60 0.00 2.63 5.07 2.77
10 HN.mg/l 527.67 26.33 33.67 3.67 605.33 21.67 203.06
11 T. NTU 0.42 0.29 0.26 0.10 0.31 0.18 0.26
12 EC. μs/cm 3263.3
3
123.17 197.67 75.33 2405.3
3
131.97 1032.80
13 pH 7.80 7.15 6.93 6.30 7.34 6.76 7.05
14 Temp 29 30 28 31 30 28 29.33
TDS= Total dissolved solids EC= Electrical conductivity
T= Turbidity HN = Hardness
BOD= Biological Oxygen Demand TEMP= Temperature
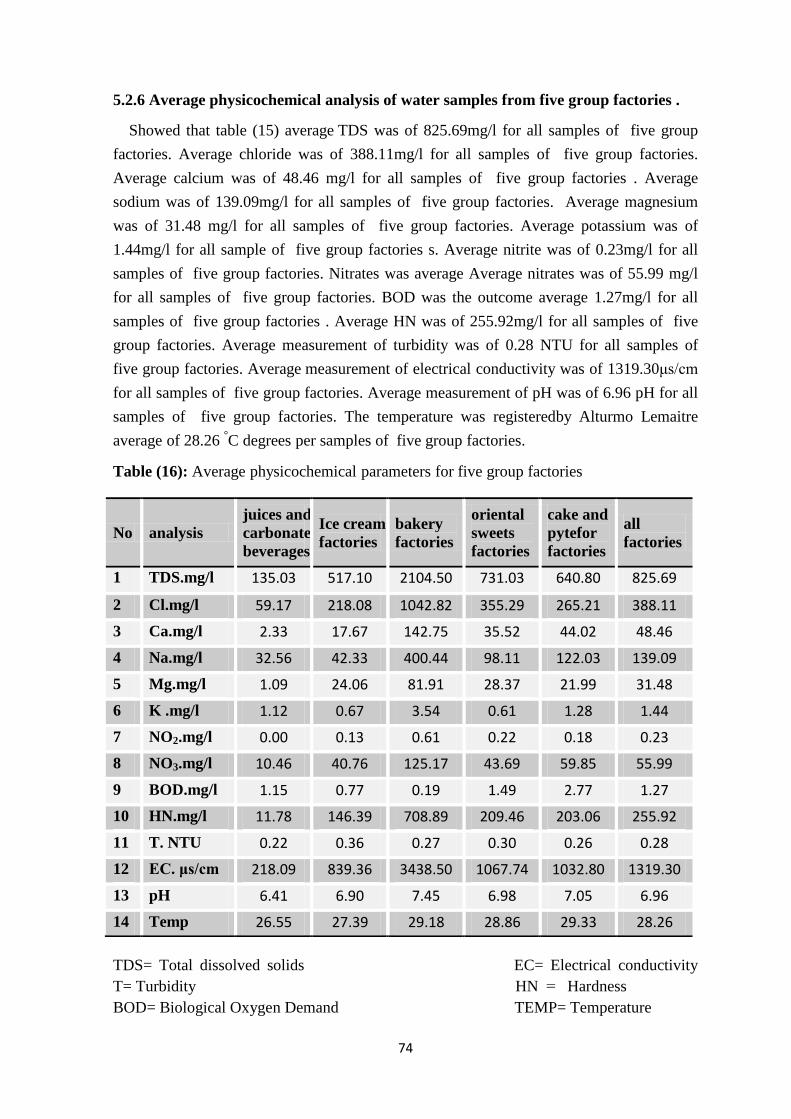
74
5.2.6 Average physicochemical analysis of water samples from five group factories .
Showed that table (15) average TDS was of 825.69mg/l for all samples of five group
factories. Average chloride was of 388.11mg/l for all samples of five group factories.
Average calcium was of 48.46 mg/l for all samples of five group factories . Average
sodium was of 139.09mg/l for all samples of five group factories. Average magnesium
was of 31.48 mg/l for all samples of five group factories. Average potassium was of
1.44mg/l for all sample of five group factories s. Average nitrite was of 0.23mg/l for all
samples of five group factories. Nitrates was average Average nitrates was of 55.99 mg/l
for all samples of five group factories. BOD was the outcome average 1.27mg/l for all
samples of five group factories . Average HN was of 255.92mg/l for all samples of five
group factories. Average measurement of turbidity was of 0.28 NTU for all samples of
five group factories. Average measurement of electrical conductivity was of 1319.30μs/cm
for all samples of five group factories. Average measurement of pH was of 6.96 pH for all
samples of five group factories. The temperature was registeredby Alturmo Lemaitre
average of 28.26 °C degrees per samples of five group factories.
Table (16): Average physicochemical parameters for five group factories
TDS= Total dissolved solids EC= Electrical conductivity
T= Turbidity HN = Hardness
BOD= Biological Oxygen Demand TEMP= Temperature
No analysis
juices and
carbonated
beverages
Ice cream
factories
bakery
factories
oriental
sweets
factories
cake and
pytefor
factories
all
factories
1 TDS.mg/l 135.03 517.10 2104.50 731.03 640.80 825.69
2 Cl.mg/l 59.17 218.08 1042.82 355.29 265.21 388.11
3 Ca.mg/l 2.33 17.67 142.75 35.52 44.02 48.46
4 Na.mg/l 32.56 42.33 400.44 98.11 122.03 139.09
5 Mg.mg/l 1.09 24.06 81.91 28.37 21.99 31.48
6 K .mg/l 1.12 0.67 3.54 0.61 1.28 1.44
7 NO2.mg/l 0.00 0.13 0.61 0.22 0.18 0.23
8 NO3.mg/l 10.46 40.76 125.17 43.69 59.85 55.99
9 BOD.mg/l 1.15 0.77 0.19 1.49 2.77 1.27
10 HN.mg/l 11.78 146.39 708.89 209.46 203.06 255.92
11 T. NTU 0.22 0.36 0.27 0.30 0.26 0.28
12 EC. μs/cm 218.09 839.36 3438.50 1067.74 1032.80 1319.30
13 pH 6.41 6.90 7.45 6.98 7.05 6.96
14 Temp 26.55 27.39 29.18 28.86 29.33 28.26
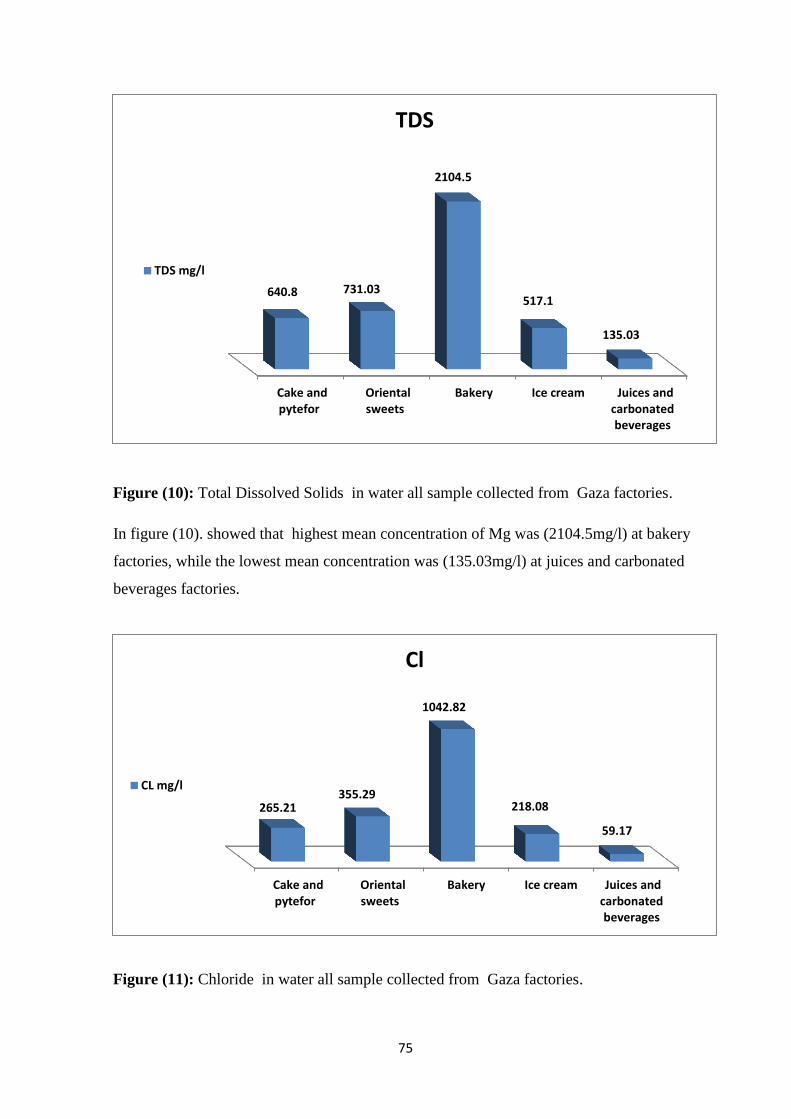
75
Figure (10): Total Dissolved Solids in water all sample collected from Gaza factories.
In figure (10). showed that highest mean concentration of Mg was (2104.5mg/l) at bakery
factories, while the lowest mean concentration was (135.03mg/l) at juices and carbonated
beverages factories.
Figure (11): Chloride in water all sample collected from Gaza factories.
Juices andcarbonatedbeverages
Ice cream Bakery Orientalsweets
Cake andpytefor
135.03
517.1
2104.5
731.03 640.8
TDS
TDS mg/l
Juices andcarbonatedbeverages
Ice cream Bakery Orientalsweets
Cake andpytefor
59.17
218.08
1042.82
355.29 265.21
Cl
CL mg/l
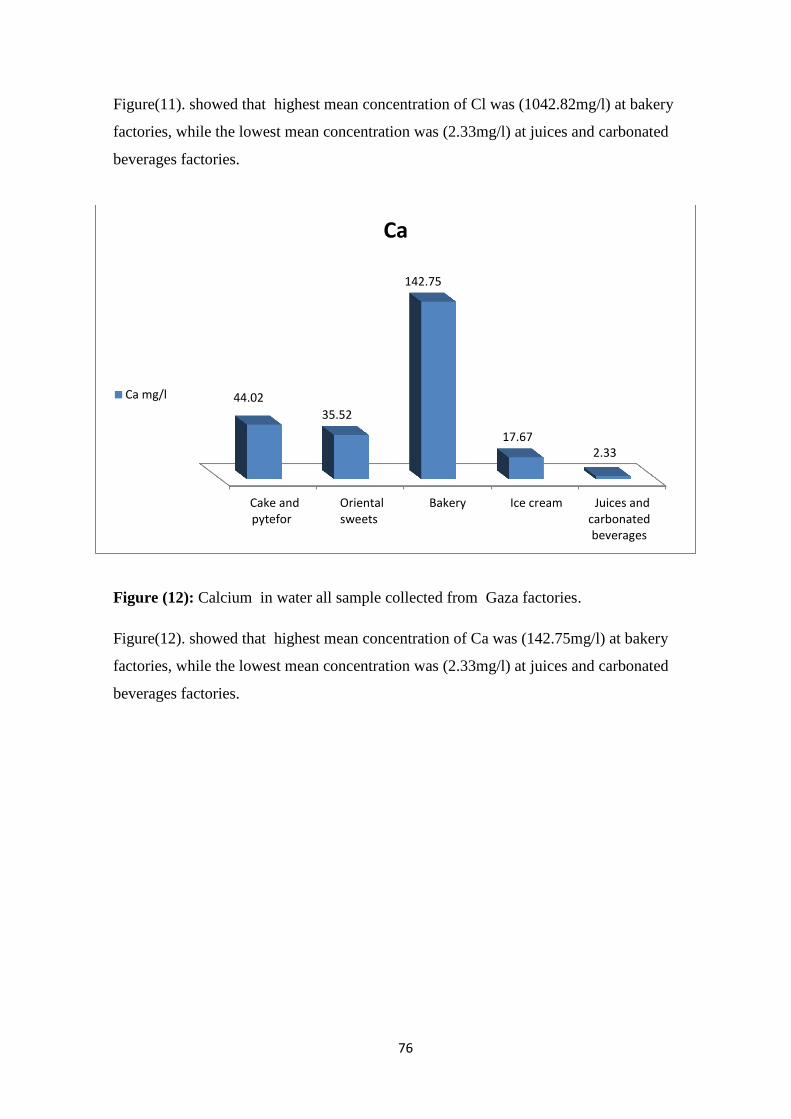
76
Figure(11). showed that highest mean concentration of Cl was (1042.82mg/l) at bakery
factories, while the lowest mean concentration was (2.33mg/l) at juices and carbonated
beverages factories.
Figure (12): Calcium in water all sample collected from Gaza factories.
Figure(12). showed that highest mean concentration of Ca was (142.75mg/l) at bakery
factories, while the lowest mean concentration was (2.33mg/l) at juices and carbonated
beverages factories.
Juices andcarbonatedbeverages
Ice cream Bakery Orientalsweets
Cake andpytefor
2.33 17.67
142.75
35.52
44.02
Ca
Ca mg/l
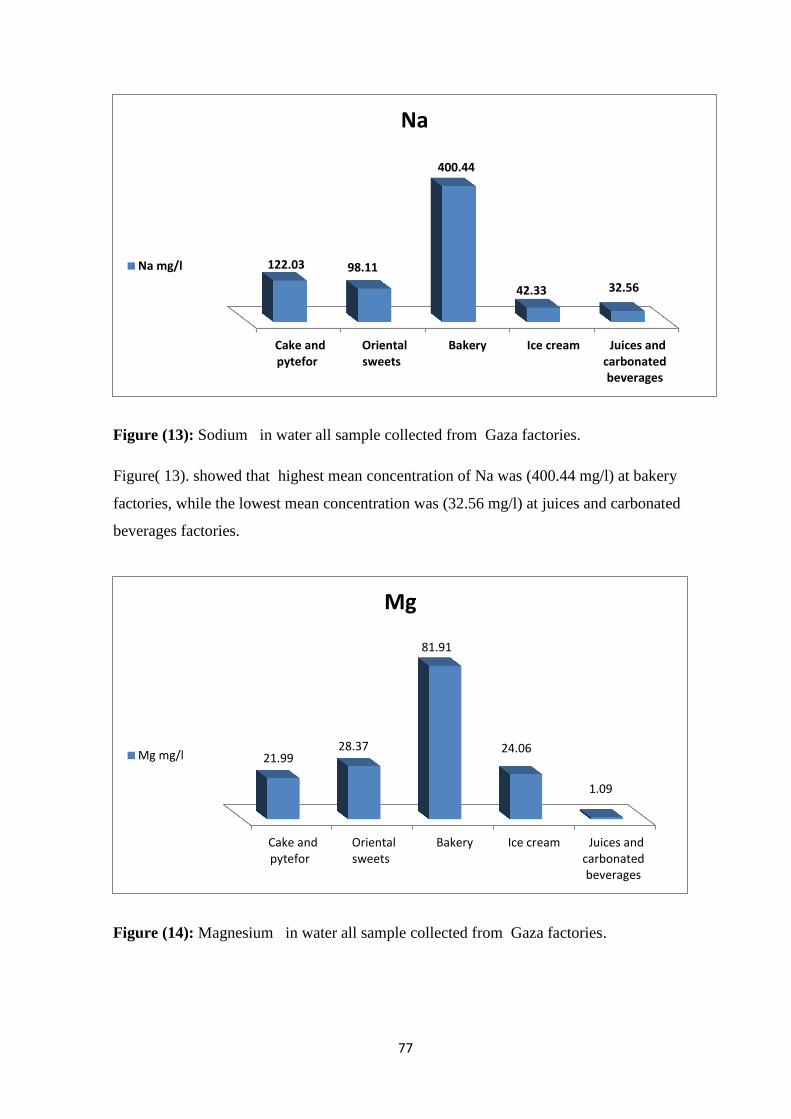
77
Figure (13): Sodium in water all sample collected from Gaza factories.
Figure( 13). showed that highest mean concentration of Na was (400.44 mg/l) at bakery
factories, while the lowest mean concentration was (32.56 mg/l) at juices and carbonated
beverages factories.
Figure (14): Magnesium in water all sample collected from Gaza factories.
Juices andcarbonatedbeverages
Ice cream Bakery Orientalsweets
Cake andpytefor
32.56 42.33
400.44
98.11 122.03
Na
Na mg/l
Juices andcarbonatedbeverages
Ice cream Bakery Orientalsweets
Cake andpytefor
1.09
24.06
81.91
28.37 21.99
Mg
Mg mg/l

78
In figure (14). showed that highest mean concentration of Mg was (81.91mg/l) at bakery
factories, while the lowest mean concentration was (1.09mg/l) at juices and carbonated
beverages factories.
Figure (15): Potassium in water all sample collected from Gaza factories
In figure( 15). showed that highest mean concentration of K was (3.45mg/l) at bakery
factories, while the lowest mean concentration was (0.61mg/l) at oriental sweets factories
Figure (16): Nitrite in water all sample collected from Gaza factories.
Juices andcarbonatedbeverages
Ice cream Bakery Orientalsweets
Cake andpytefor
1.12
0.67
3.54
0.61
1.28
K
K mg/l
Ice cream Bakery Orientalsweets
Cake andpytefor
0.13
0.61
0.22 0.18
NO2
NO2 mg/l
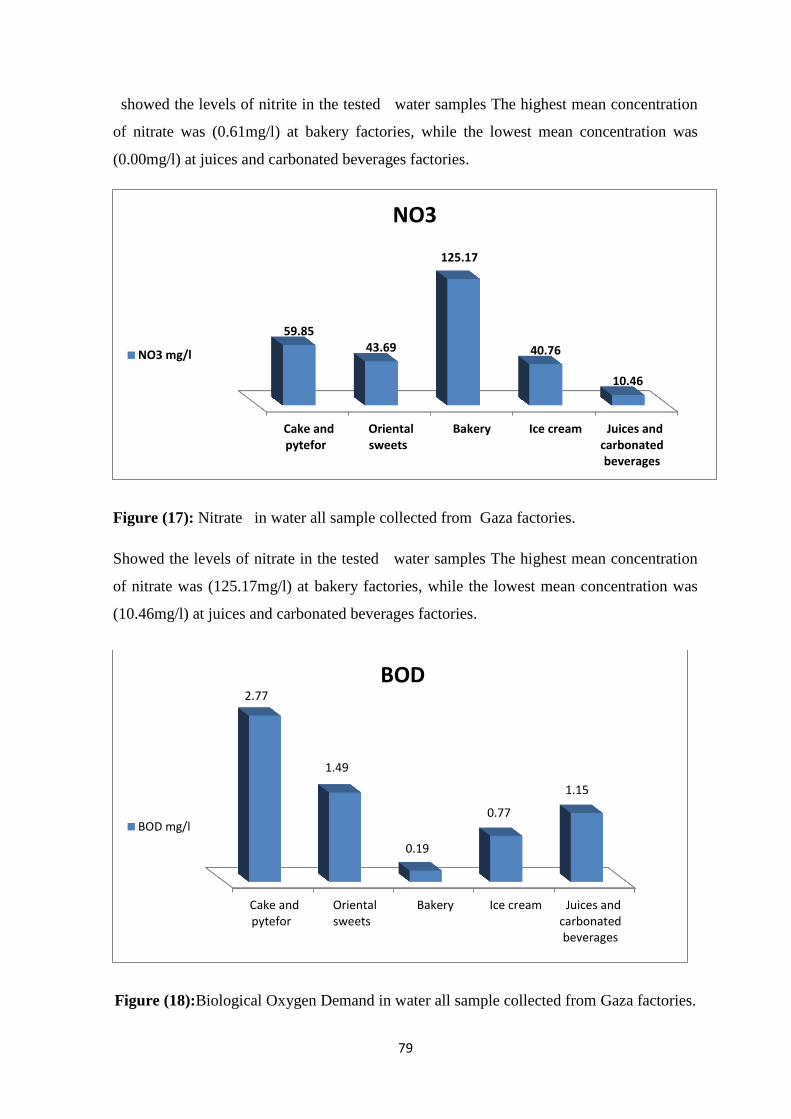
79
showed the levels of nitrite in the tested water samples The highest mean concentration
of nitrate was (0.61mg/l) at bakery factories, while the lowest mean concentration was
(0.00mg/l) at juices and carbonated beverages factories.
Figure (17): Nitrate in water all sample collected from Gaza factories.
Showed the levels of nitrate in the tested water samples The highest mean concentration
of nitrate was (125.17mg/l) at bakery factories, while the lowest mean concentration was
(10.46mg/l) at juices and carbonated beverages factories.
Figure (18):Biological Oxygen Demand in water all sample collected from Gaza factories.
Juices andcarbonatedbeverages
Ice cream Bakery Orientalsweets
Cake andpytefor
10.46
40.76
125.17
43.69 59.85
NO3
NO3 mg/l
Juices andcarbonatedbeverages
Ice cream Bakery Orientalsweets
Cake andpytefor
1.15
0.77
0.19
1.49
2.77
BOD
BOD mg/l
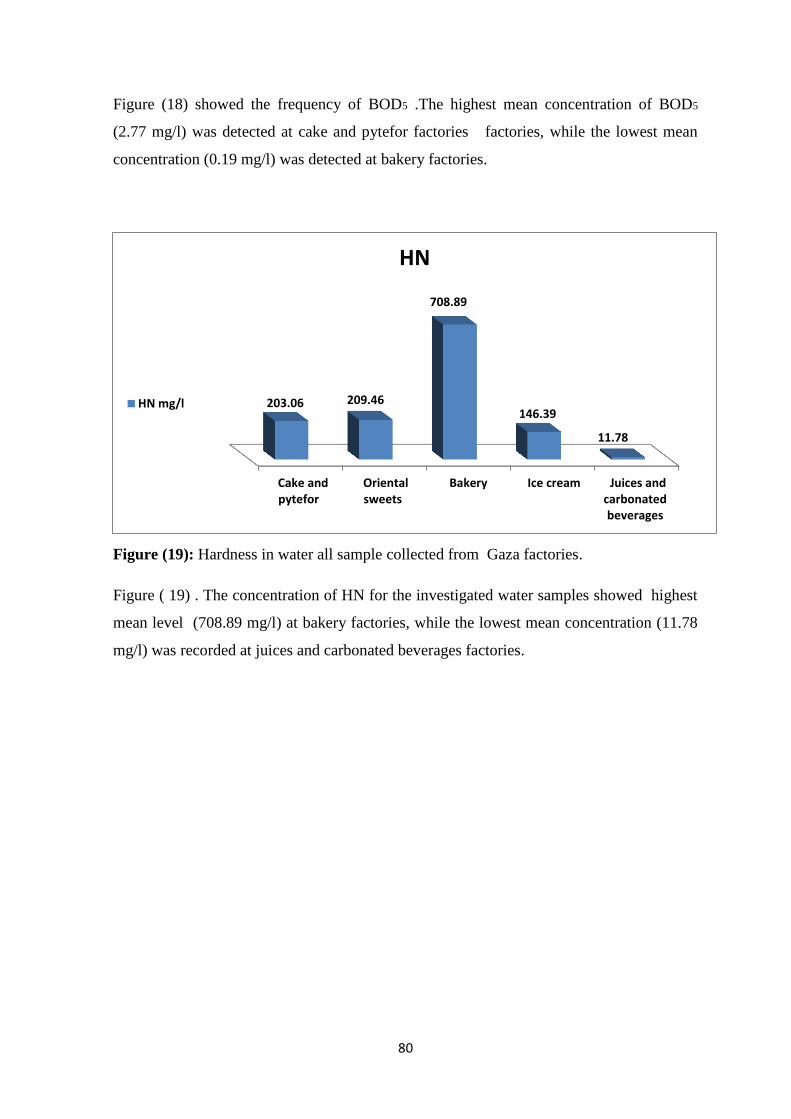
80
Figure (18) showed the frequency of BOD5 .The highest mean concentration of BOD5
(2.77 mg/l) was detected at cake and pytefor factories factories, while the lowest mean
concentration (0.19 mg/l) was detected at bakery factories.
Figure (19): Hardness in water all sample collected from Gaza factories.
Figure ( 19) . The concentration of HN for the investigated water samples showed highest
mean level (708.89 mg/l) at bakery factories, while the lowest mean concentration (11.78
mg/l) was recorded at juices and carbonated beverages factories.
Juices andcarbonatedbeverages
Ice cream Bakery Orientalsweets
Cake andpytefor
11.78
146.39
708.89
209.46 203.06
HN
HN mg/l

81
Figure (20): Turbidity in water all sample collected from Gaza factories.
Figure (20) . The concentration of Turbidity for the investigated water samples showed
highest mean level (0.36 NTU) at ice cream factories, while the lowest mean
concentration (0.22 NTU) was recorded at juices and carbonated beverages factories.
Figure (21): Electric conductivity in water all sample collected from Gaza factories.
The highest mean value of EC (3438.5 sm/cm) was detected at bakery factories, while the
lowest mean value (218.09 sm/cm) was detected at juices and carbonated beverages
factories as represented in figure (21).
Juices andcarbonatedbeverages
Ice cream Bakery Orientalsweets
Cake andpytefor
0.22
0.36
0.27 0.3
0.26
T
T NTU
Juices andcarbonatedbeverages
Ice cream Bakery Orientalsweets
Cake andpytefor
218.09
839.36
3438.5
1067.74 1032.8
EC
EC micro…
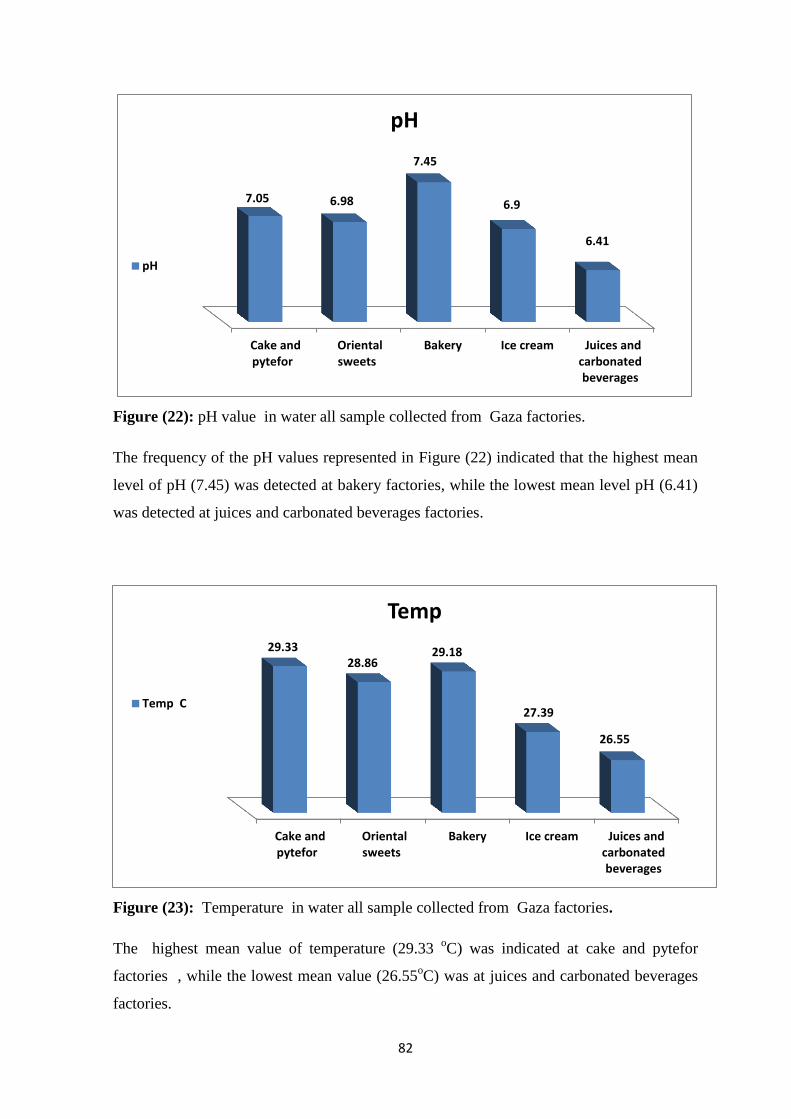
82
Figure (22): pH value in water all sample collected from Gaza factories.
The frequency of the pH values represented in Figure (22) indicated that the highest mean
level of pH (7.45) was detected at bakery factories, while the lowest mean level pH (6.41)
was detected at juices and carbonated beverages factories.
Figure (23): Temperature in water all sample collected from Gaza factories.
The highest mean value of temperature (29.33 oC) was indicated at cake and pytefor
factories , while the lowest mean value (26.55oC) was at juices and carbonated beverages
factories.
Juices andcarbonatedbeverages
Ice cream Bakery Orientalsweets
Cake andpytefor
6.41
6.9
7.45
6.98 7.05
pH
pH
Juices andcarbonatedbeverages
Ice cream Bakery Orientalsweets
Cake andpytefor
26.55
27.39
29.18 28.86
29.33
Temp
Temp C
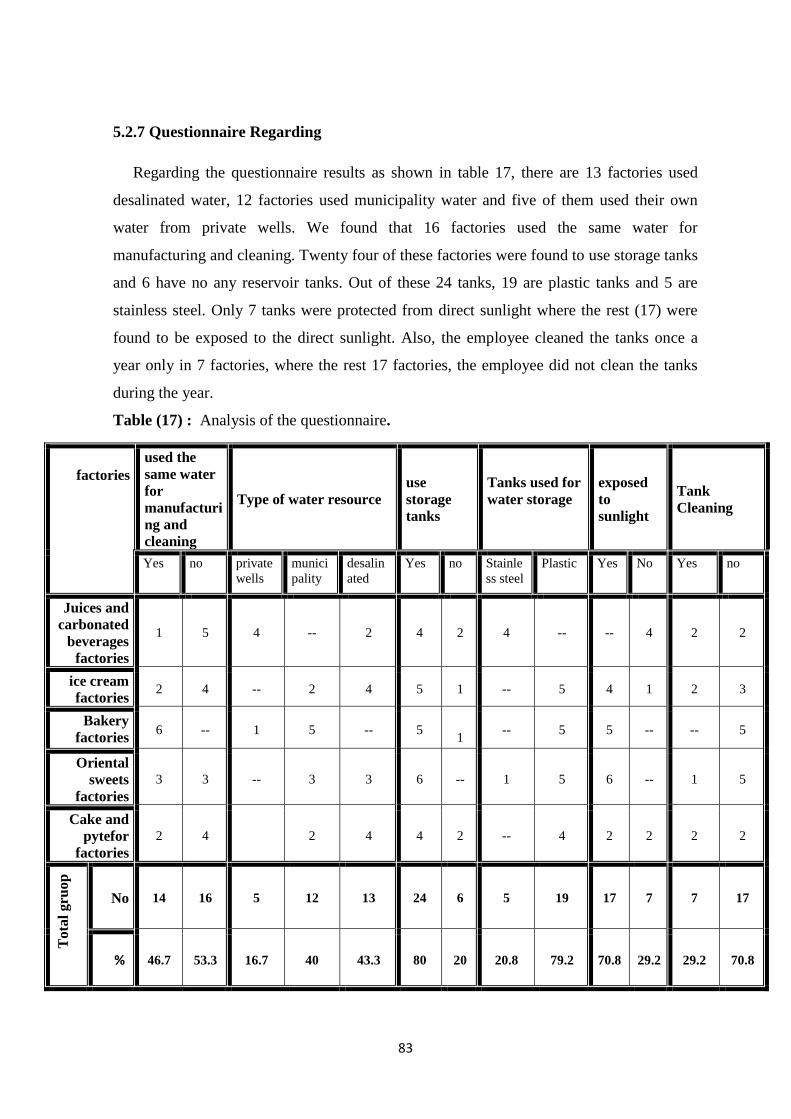
83
5.2.7 Questionnaire Regarding
Regarding the questionnaire results as shown in table 17, there are 13 factories used
desalinated water, 12 factories used municipality water and five of them used their own
water from private wells. We found that 16 factories used the same water for
manufacturing and cleaning. Twenty four of these factories were found to use storage tanks
and 6 have no any reservoir tanks. Out of these 24 tanks, 19 are plastic tanks and 5 are
stainless steel. Only 7 tanks were protected from direct sunlight where the rest (17) were
found to be exposed to the direct sunlight. Also, the employee cleaned the tanks once a
year only in 7 factories, where the rest 17 factories, the employee did not clean the tanks
during the year.
Table (17) : Analysis of the questionnaire.
Tank
Cleaning
exposed
to
sunlight
Tanks used for
water storage
use
storage
tanks
Type of water resource
used the
same water
for
manufacturi
ng and
cleaning
factories
no Yes No Yes Plastic Stainle
ss steel
no Yes desalin
ated
munici
pality
private
wells
no Yes
2 2 4 -- -- 4 2 4 2 -- 4 5 1
Juices and
carbonated
beverages
factories
3 2 1 4 5 -- 1 5 4 2 -- 4 2 ice cream
factories
5 -- -- 5 5 --
1 5 -- 5 1 -- 6
Bakery
factories
5 1 -- 6 5 1 -- 6 3
3
-- 3 3
Oriental
sweets
factories
2 2 2 2 4 -- 2 4 4 2 -
- 4 2
Cake and
pytefor
factories
17
7 7 17 19 5 6 24 13 12 5
16
14 No
To
tal
gru
op
70.8 29.2 29.2 70.8 79.2 20.8 20 80 43.3 40 16.7 53.3 46.7 %

84
6-Discussion
This study was conducted to investigate the validity of physico-chemical and
microbial contamination of water used in the manufacture of food and beverages in
the food factories in Gaza city.
6.1 Microbiological quality of used water
6.1.1 Total Plate Count
The aerobic total plate count bacteria (TPC) were found in 76 samples from 90, which
represented (84.4%) of the total samples. Number of colonies were ranged from 1 to 590
CFU/ml. Juices and carbonated beverages factories had the highest percentage of TPC
bacteria which reach 100%. However, the lowest one was bakery factories with percentage
of (61.1%).
In a study that performed to undertake a preliminary assessment of the groundwater
quality of the West Thrace in Turkish region, forty groundwater samples were
investigated. The maximum number of aerobic bacteria was 44 CFU/ml (Aydin, 2006).
Melad, (2002) in a study that investigated the groundwater wells in the Gaza Strip found
TPC in all tested wells and found the highest number of TPC colonies was 750 CFU / ml.
6.1.2 Total coliform
The total coliform was found in 70 samples out of 90 which represented (77.7%) of the
total samples tested. Also showed the presence of total coliform bacteria, which used as a
test organism for contamination and quality of used water, in tested water samples from
different factories. Juices and carbonated beverages factories had the highest percentage of
positive water which reach 83.3%. Nevertheless, the lowest one was bakery factories with
percentage reached 38.9%. Number of colonies were ranged from 4 to 390 CFU/100ml .
All the results were found in 70 samples, more than the allowable limit in Specified
standard for manufacturing water in Palestine. According to the Palestinian standards, only
limit of 3 CFU/100ml total coliform is allowed and accepted for water used in food
factories (Palestinian standard of drinking water, 2005). Also all the results were over than
the guidance and the limit of the World Health Organization (WHO, 2008)..
Our results seem to be consistent with the Shash et al., ( 2010) who found that the Total
and fecal coliforms were detected in Nile water at Greater Cairo in 100% of the tested

85
samples reaching 104 and 103 CFU/100 ml respectively. Also Tartory (2009) in a study
dealing with microbiological assessment of marketed drinking water in Gaza city found
that the most prevalent type of bacterial contamination was total coliforms. Twelve water
samples (60%) were contaminated with total coliforms range from (1-50 CFU/100ml) of
the desalination plant.
6.1.3 Fecal coliform
The Fecal coliform was found in 55 samples out of 90 which represented (61.1%) of
the total samples tested. The study showed the presence of fecal coliform bacteria, which
used as a test organism for contamination and quality of used water, in tested water
samples from different factories. Juices and carbonated beverages factories had the highest
percentage of positive water which reach 88.8%. Nevertheless, the lowest one was bakery
factories with percentage reached 61.1%. Number of colonies were ranged from 1 to 100
CFU/100ml .
All the results that were found in the 55 samples exceeded the Palestinian standard for
the presence of fecal coliform in water that used in food manufacturing plants in Palestine.
The Palestinian standards allow number 0 CFU/100ml of fecal coliform in water used for
food manufacturing purposes (Palestinian standard of drinking water, 2005). Also All the
results were over than the guidance of the World Health Organization(WHO, 2008).
Yassin el al. ( 2006) found in Gaza strip that the major finding showed that the
contamination level of total and fecal coliform exceeded that of the World Health
Organization limit for water wells and networks. Furthermore, the contamination
percentages in networks were higher than that in wells. In the other hand, Tartory, (2009)
in a study that conducted in Gaza city investigated the microbiological quality of drinking
water in Gaza and found that six samples (30%) were contaminated with fecal coliforms
and this contamination was range from 1 to 30 CFU/100ml of the water that collected from
the desalination plant under the study. Also, five sample (41.7%) out of 12 samples were
contaminated with fecal coliforms and the contamination rate was ranged from 1 to 20
CFU/100ml in the water that collected from the distribution cars. Giannoulis el al., (2000)
in their study in Northwestern Greece found that 36.8% of the source water samples was
found in conformity with WHO guidelines and the other samples did not meet the WHO
standards.
86
6.1.4 Fecal streptococci
The Fecal streptococci was found in 38 samples out of 90 which represented (42.2%)
of the total samples tested. The study showed a moderately high presence and percentage
of fecal streptococci in water samples that tested from different factories included in this
study. Both Juices and carbonated beverages, and Cake and pytefor factories had the
highest presence of FS bacteria in water which reach 50%. However, the lowest one was
oriental sweet factories with percentage reach 27.7%. Number of colonies were ranged
from 1 to 125 CFU/100ml. Surprisingly all factories classes showed contamination of part
of water that used in these factories with FS bacteria and this is not good indication.
The results that indicated here did not match the Palestinian standard which did not allow
any presence of FS in water sources that used in food industry. Also, these results were
over than the guidance of the World Health Organization (0 CFU/100ml) of Fecal
streptococci.
In a study that conducted by Melad, (2002), fecal streptococci were isolated from 6
wells during summer season, where the mean count recorded was (6 cfu/ml) in a study that
aimed to evaluate the ground water pollution with waste water microorganisms in Beth
Lahia, Gaza Strip (Melad, 2002). Also Al- Khatib, (2009) found that 4.8% of groundwater
samples were contaminated with Fecal streptococci in Groundwater (network-distributed)
in his study that aimed to investigate the microbiological quality of desalinated water,
groundwater and rain-fed cisterns in the Gaza strip, Palestine.
6.1.5 Pseudomonas aeruginosa
The Pseudomonas aeruginosa was found in 56 samples out of 90 which represented
(62.2%) of the total samples tested. Here we showed the presence and percentage of
Pseudomonas aeruginosa, which used as an indicator organism for contamination and
quality of used water, in tested water samples from different factories. Juices and
carbonated beverages factories again had the highest percentage of contaminated water
samples with Pseudomonas aeruginosa which reach 83.3%. Nevertheless, the lowest one
was also again bakery factories with percentage reached 38.9%. Number of colonies were
ranged from 1 to 70 CFU/200ml . Generally, all factories classes showed presence of
Pseudomonas aeruginosa in water used in these factories but with different percentage of
contamination. Abd El-Salam ( 2008) found in his study that 3.6% of examined bottled
water samples were contaminated by Pseudomonas aeruginosa.

87
Pseudomonas aeruginosa has been detected in 24.1% of the water samples of drinking
water from dispenser and possible control measures ( Baumgartner, 2006).
6.1.6 Mold and Yeast
The Mold was found in 17 samples out of 90 which represented (18.8%) of the total
samples tested. The results in the study showed of molds in tested water samples from four
factories classes. Cake and pytefor had the highest prevalence of mold contaminated water
with a percentage of 44.4%, followed by juices and carbonated beverages factories which
had a percentage of positive water with mold reach 27.7%. Nevertheless, the lowest one
was bakery and ice cream factories with a percentage reached 11.1%. Interestingly, all
water samples that collected from oriental sweet factories were tested negative for presence
of molds. Number of colonies were ranged from 1 to 11 CFU/100ml . The Yeast was
found in 22 samples out of 90 which represented (24.4%) of the total samples tested . The
Yeast was found in 22 samples out of 90 which represented (24.4%) of the total samples
tested . The results in the study showed of yeast in tested water samples from all factories
classes. All factories had contaminated water with yeast. Cake and pytefor had the highest
prevalence of yeast contaminated water with a percentage of 44.4%, followed by ice cream
factories (33.4%), then the juices and carbonated beverages factories and oriental sweet
factories which had a percentage of positive water with mold reach 16.7%. Nevertheless,
the lowest one was bakery factories with a percentage reached 11.1%. Number of colonies
were ranged from 5 to 40 CFU/100ml .
Represented the mold (18.8%) of the total samples tested and represented the yeast
(24.4%) of the total samples tested more than the allowable limit in specified standard for
manufacturing water in Palestine. The Palestinian standards indicate that any water used
for food industries purposed must be free of mold and yeast (Palestinian standard of
drinking water, 2005)
Convergent results were obtained in a study that performed by Tartory et al., (2009) in
the water collected from vending machine in a study that performed to evaluate the
microbiological situation of marketed drinking water in Gaza City, Palestine. The authors
found that five samples (25%) were contaminated with mold and the contamination level
was ranging between (1-10 CFU/100ml), and 4 samples (20%) were contaminated with
yeast with contamination level ranging between (1-50 CFU/100ml), Also 14 sample (56%)
out of 25 samples were contaminated with mold and the contamination was ranged from 1

88
to 20 CFU/100ml and 4 sample (16%) out of 25 samples were contaminated with Yeast
and range between (1-20 CFU/100ml).
Gottlich et al. (2002) indicated in their study that mold colonies were found in all of
the surface water samples that analyzed in Slovakia, while the ground water revealed only
40% positive samples.
Hageskal, (2006) in his study in Oslo found filamentous fungi in 62% of all tested
samples. In ground water samples, the percentage of mold contamination was 42.3%, while
surface waters yielded 69.7% positive samples.
6.2 Physicochemical quality of used water.
6.2.1 Total Dissolved Solids
The chemical analysis of TDS of water samples revealed high concentration in the
wate, highest mean concentration of TDS was (2104.5 mg/l) at bakery factories, while the
lowest mean concentration was (135.03 mg/l) at juices and carbonated beverages factories.
And the average concentration of TDS in the all water samples was (825.69mg/l) .
Some of the results of TDS recorded in the current study exceeded the permissible limit
in Specifier standard Palestine where allowed (1000 mg/l) only (Palestinian standard of
drinking water, 2005). also the guidance of the World Health Organization where allowed
(1000-1500 mg/l).
These results were nearly similar to that obtained by Baalousha,( 2008). In study Chemical
analysis of groundwater from 63 wells in the Gaza Strip found TDS between (3205 mg/l
to 330 mg/l) an average 1145 mg/l.
Al-Jamal and Al-Yaqubi, (2002).The total dissolved solids and Cl- used indicator of
groundwater salinity contamination in Gaza Strip and Nitrate was used as an indicator of
anthropogenic contamination of groundwater. High levels of Cl- and TDS in the
groundwater cause high salinity in the water supply.
In the study of Abu Mayla and Abu- Amr. ( 2010).that conducted on samples water
wells ,The average concentration of TDS for drinking water wells in Gaza Governorates
ranges 2709 mg/l Ghulman el al.,( 2008).The Saudi Arabian specification and
measurements Agency states that the optimum value for the total dissolved solids TDS is
500mg/l, and the maximum allowable value is 1500mg/l. Using this standard, all the

89
samples of the location around Makah were within the maximum allowable value of the
total dissolved solids. Also Sulieman el al., (2010) Found that TDS of Siebel water was in
the range of (115-137m g/L) which was in agreement with those of the Sudanese and
International standards.
Sheykhi and Moore , (2012).In study for the evaluation of the surface water quality
from 29 sampling points along the Kor River in Fars province South West Iran, they found
TDS between (4566–12632 mg/l) in all samples analyzed .
6.2.2 Chloride
The result showed that highest mean concentration of Cl was (1042.82mg/l) at bakery
factories, while the lowest mean concentration was (2.33mg/l) at juices and carbonated
beverages factories. The average concentration of Cl in the all water samples was
(388.11mg/l).
Some of the results of Cl recorded in the current study exceeded the permissible limit in
Palestine standard where allowed (250 mg/l) only (Palestinian standard of drinking water,
2005)..also the guidance of the World Health Organization where allowed (250 mg/l) only
.
These results were similar with study of El-Madhoun, (2002). In a study that evaluated
the quality of drinking water wells supplies residence of Gaza Strip for Chloride and
Nitrate concentrations during the period from 1990-2002, the authors found mean of Cl
concentration (397.1 mg/l).
Also in study of water quality in Gaza strip for the chloride concentration, the authors
found that the average of chloride in water was 381 mg/L (Metcalf and Eddy, 2000).
However, in another study of water quality of drinking wells in Gaza Strip, the authors
found 11% of the drinking water wells contain chloride concentration of less than 250 mg /
l (PWA, 2007).
6.2.3 Calcium
Showed that highest mean concentration of Ca was (142.75mg/l) at bakery factories,
while the lowest mean concentration was (2.33mg/l) at juices and carbonated beverages
factories. The average concentration of Ca in the all water samples was (48.46mg/l).
90
Some of the results of Ca recorded in the current study exceeded the permissible limit
in Specifier Palestine standard where allowed (100 mg/l) only (Palestinian standard of
drinking water, 2005).
These results were nearly similar to that obtained samples ranges from 0.6 mg/l to 14.5
mg/l . These above results were obtained from a study of water quality evaluation of small
scale desalination plants in the Gaza Strip, Palestine (Aish, 2011).
Gibrilla al el., (2011) found in study of seasonal evaluation of Raw, Treated and
distributed water quality from the Barekese Dam (River Off in) in the Ashanti Region of
Ghana, that the mean dry season Ca concentrations in the raw water is equal to 9.20mg/l.
6.2.4 Sodium
Showed that highest mean concentration of Na was (400.44 mg/l) at bakery factories,
while the lowest mean concentration was (32.56 mg/l) at Juices and carbonated beverages
factories. The average concentration of Na in the all water samples was (139.09mg/l).
Some of the results of Na l recorded in the current study exceeded the permissible limit
in Specifier Palestine standard and WHO where allowed (200 mg/l) only (Palestinian
standard of drinking water, 2005).
These results were nearly similar to that obtained In study of El-Salam canal is a
potential project reusing the Nile Delta drainage water for Sinai desert agriculture,
microbial and chemical water quality. Representative water samples were manually
collected during the seasons winter, spring, summer, and autumn of two successive years
(2003/2004 and 2004/2005), found Found Na between (75–294mg/l), in all samples
(Othman al el., 2012). Agrawal el al., (2011) found that the average of sodium in water
was 29.7 mg/L in Groundwater samples from Begusarai District, Bihar.
6.2.5 Magnesium
The results showed that highest mean concentration of Mg was (81.91mg/l) at bakery
factories, while the lowest mean concentration was (1.09mg/l) at juices and carbonated
beverages factories. The average concentration of Mg in the all water samples was
(31.48mg/l).
91
Some of the results of Mg l recorded in the current study exceeded the permissible limit
in Specifier standard Palestine Where allowed (0.5 mg/l) only (Palestinian standard of
drinking water, 2005)..also the guidance of the World Heal th Organization. Where
allowed (0.5 mg/l) only.
These results were nearly similar to that obtained Baalousha,( 2008). In study Chemical
analysis of groundwater from 63 wells in the Gaza Strip found Mg between( 21 mg/l to
0.75 mg/l) an average 3.9 mg/l.
In study of Groundwater resources in some parts of the lower section of the Shire River
valley, Malawi, Manganese exceeded 30 mg/l in 70% of the samples analyzed (Monjerezi
and Ngongondo, 2012).
6.2.6 Potassium
Our results showed that highest mean concentration of K was (3.45mg/l) at bakery
factories, while the lowest mean concentration was (0.61mg/l) at oriental sweets factories
The average concentration of K in the all water samples was (1.44mg/l).
Some of the results of K l recorded in the current study exceeded the permissible limit
in specifier Palestine standard which allowed (10 mg/l) only (Palestinian standard of
drinking water, 2005). And also the guidance of the World Heal th Organization. Which
allowed (0.5-5 mg/l) only.
These results were nearly similar to that obtained by Baalousha,( 2008). From groundwater
where 63 wells in the Gaza Strip found K found between( 21 mg/l to 0.75 mg/l) with an
average to 3.9 mg/l.
Drinking-water, with an upper 90th-percentile concentration of 5.2 mg/l. Data from
Canada indicate that average concentrations of potassium in raw and treated drinking water
in different areas vary between <1 and 8 mg/l. However, concentrations ranged up to 51
mg/l in Saskatchewan, which is the largest production area for potassium chloride in
Canada (Health Canada, 2008).
6.2.7 Nitrite And Nitrate
The study showed the different levels of nitrite in the tested water samples The highest
mean concentration of nitrate was (0.61mg/l) at bakery factories, while the lowest mean

92
concentration was (0.00mg/l) at juices and carbonated beverages factories. Also showed
the different levels of nitrate in the tested water samples The highest mean concentration
of nitrate was (125.17 mg/l) at bakery factories, while the lowest mean concentration was
(10.46mg/l) at juices and carbonated beverages factories The average concentration of
nitrate in the all water samples was (55.99mg/l) .
These results were nearly similar to that obtained Melad (2002) ) in a study that aimed
to evaluate the ground water pollution in Beth Lahia, Gaza Strip was mean of nitrite and
nitrate concentration in the some wells recorded (1.1 mg/l, 1.3 mg/l, 1.0 mg/l, 1.5 mg/l)for
nitrite and (57.3 mg/l, 60.3 mg/l, 65.2 mg/l, 72.4 mg/l)for nitrate .
Several studies in Gaza reported high nitrate nitrate levels in groundwater as one of the
major concerns among the public and governmental decision makers (Abu Maila et al.,
2004; Shomar, 2006).
Shomar (2008) .Found almost 90% of the groundwater wells of the Gaza Strip sampled
between 2001 and 2007 showed nitrate – concentrations two to eight times higher than the
WHO standards. In another study of water well in Gaza Strip, the authors found 11% of the
drinking water wells contain nitrate concentration of less than 50 mg / l (PWA, 2007).
Sheykhi and Moore. (2012).Evaluate the quality of surface water from 29 sampling
points along the Kor River in Fars province South West Iran, the authors found nitrate
between (15–1421 mg/l ) in all samples that have been analyzed..
Abu Mayla and Abu- Amr. ( 2010).Reported that average concentration of nitrate for
drinking water wells in Gaza strip was 139 mg/l.
Most chemicals arising in drinking water are of health concern only after extended
exposure of years, rather than months. The principal exception is nitrate. Typically,
changes in water quality occur progressively, except for those substances that are
discharged or leach intermittently to flowing surface waters or groundwater supplies from,
for example, contaminated landfill sites (WHO, 2011).
6.2.8 Biological oxygen demand
Showed the frequency of BOD5 .The highest mean concentration of BOD5 (2.77 mg/l)
was detected at cake and pytefor factories, while the lowest mean concentration (0.19 mg/l)
93
was detected at bakery factories. The average concentration of BOD5 in the all water
samples was (1.27mg/l).
These results were nearly similar to that obtained Melad, (2002) ) in a study that aimed
to evaluate the ground water pollution in Beth Lahia, Gaza Strip was mean of BOD5
concentration in the some wells recorded (3.3 mg/l, 5.5 mg/l,3.6 mg/l, 5.5 mg/l).
6.2.9 Hardness
The concentration of HN for the investigated water samples showed highest mean level
(708.89 mg/l) at bakery factories, while the lowest mean concentration (11.78 mg/l) was
recorded at juices and carbonated beverages factories. The average concentration of HN in
the all water samples was (255.92mg/l)
The results of HN that showed some of the sample HN recorded in the current study
exceeded the permissible limit in specifier Palestine standard which allowed (500 mg/l)
only (Palestinian standard of drinking water, 2005)..also the guidance of the World Heal th
Organization. Where allowed (200-500 mg/l) only.
Reported that the hardness of drinking water is determined largely by it,s content of
calcium and magnesium. It is expressed as the equivalent amount of calcium carbonate that
could be formed from calcium and magnesium in solution. Hard water contains higher
levels of calcium or magnesium than soft water (Chiu el al., 2010).
Water hardness is essential parameter industrial water consumption in manufacturing of
high –quality products (vireo, 2002).
Monjerezi and Ngongondo, (2012).In a study of Groundwater resources in some parts
of the lower section of the Shire River valley, Malawi, the authors found that these parts
are not potable for rural domestic water supply due to high salinity
6.2.10 Turbidity
The concentration of turbidity for the investigated water samples showed highest mean
level (0.36 NTU) at ice cream factories, while the lowest mean concentration (0.22 NTU)
was recorded at juices and carbonated beverages factories. The average concentration of
turbidity in the all water samples was (0.28mg/l).
94
All the results were less than the allowable limit. in specifier Palestine standard which
allowed ( 5 NTU) only (Palestinian standard of drinking water, 2005)..also the guidance of
the World Heal th Organization. Where allowed (5 NTU).
Kirmeyer el al. (2002).. Increased turbidity may be due to contamination in the storage
tank, water age or mixing issues or tank material degradation
6.2.11 Electric conductivity
The highest mean value of EC (3438.5 sm/cm) was detected at bakery factories, while
the lowest mean value (218.09 sm/cm) was detected at juices and carbonated beverages
factories. The average value of EC in the all water samples was (1319.30mg/l).
The results of EC showed that some of sample EC recorded in the current study exceeded
the permissible limit in specifier Palestine standard which allowed (3300 μs/cm) only
(Palestinian standard of drinking water, 2005). And also the guidance of the World Health
Organization. which allowed (1200-3300 μs/cm) only.
Sheykhi and Moore (2012) found in 29 sampling EC value between (6500–21510
μs/cm) in all surface water from Kor River in Fars province South West Iran samples.
6.2.12 pH value
The frquency of the pH values indicated that the highest mean level of pH (7.45) was
detected at Bakery factories, while the lowest mean level pH (6.41) was detected at Juices
and carbonated beverages factories. The average of the pH values in the all water samples
was (6.96 mg/l)
Showed the some of the results of pH value recorded in the current study exceeded the
permissible limit in specifier Palestine standard which allowed (8.5-6.5 ph) only
(Palestinian standard of drinking water, 2005)..also the guidance of the World Heal th
Organization. Where allowed (8.5-6.5 ph) only.
Aydin. (2006) . assessment of the groundwater quality of the west thrace region,wher
forty groundwater samples collected from Edirne and Cana kale were assessed for their
suitability for human consumption pH values between 5.5-8.5 were reported.

95
El-Baba, (1999) found that the pH of the ground water wells that supply Gaza city for
domestic use should be in equilibrium point. If the pH of water is raised from the
equilibrium point, the water becomes scale forming and will deposit calcium carbonate. If
the pH is lowered from the equilibrium pH, point the water turns corrosive.
6.2.3 Temperature.
The highest mean value of temperature (29.33 oC) was indicated at cake and pytefor
factories,while the lowest mean value (26.55oC) was at Juices and carbonated beverages
factories. The average value of temperature in the all water samples was (28.26mg/l).
Showed the some of the results of temperature recorded in the current study exceeded
the permissible limit in specifier Palestine standard which allowed (8-25 °C) only
(Palestinian standard of drinking water, 2005).
Stumm & Morgan, (1981).The water temperature varied from 24 °C in the wet season to
28 °C in the dry season with a mean annual temperature of 26 °C. These values are within
the natural background levels of 22–29 °C for waters in the tropics
Burlingame, (2001) Reported that in Philadelphia Pennsylvania, the summer time water
temperature of rivers and drinking water is about 25 °C whereas the wintertime temperature
can be 10-15 °C depending on the winter conditions
The temperature is a very important parameter for many physical and chemical water
treatment applications (AWWA, 2002).
96
7.Summary
The microbiological and physico-chemical parameters for water used in food
processing are very important in determining the quality of the water used in food
factories, Where the Authority has standard specifications Palestinian specific
measurements of water use in food processing which is the same standards of drinking
water. This study was conducted on 90 water samples that collected from different
factories over all Gaza city. We divided factories and manufacturing units to five groups
according to the type of food product. They are juices and carbonated beverages factories,
bakery factories, ice cream factories, oriental sweets factories, and finally cake and pytefor
factories. From each category, 18 water samples were collected. Questionnaire was
conducted for all thirty food factories.
7.1 Microbiological results
The aerobic total plate bacteria (TPC) were found in 76 samples out of 90, which
represented (84.4%) of the total samples. Number of colonies were ranged from 1 to 590
CFU/ml. juices and carbonated beverages factories had the highest percentage of positive
water which reach 100%. However, the lowest one was bakery factories with (61.1%).
The total coliform (TC) was found in 70 samples out of 90 which represented (77.7%) of
the total tested samples . The highest percentage of positive water reach(83.3%).
Nevertheless, the lowest one was bakery factories with percentage reached (38.9%).
Number of colonies were ranged from 4 to 390 CFU/100ml .
The fecal coliform (FC) was found in 55 samples out of 90 which represented (61.1%)
of the total tested samples. The juices and carbonated beverages factories had the highest
percentage of positive water which reach (88.8%). Nevertheless, the lowest one was
bakery factories with percentage reached (61.1%). Number of colonies were ranged from
1 to 100 CFU/100ml .
The fecal streptococci (FS) was found in 38 samples out of 90 which represented
(42.2%) of the total tested samples. The juices and carbonated beverages, and cake and
pytefor factories had the highest presence of FS bacteria in water which reach (50%).
However, the lowest one was oriental sweet factories with percentage reach (27.7%).
Number of colonies were ranged from 1 to 125 CFU/100ml.
97
The Pseudomonas aeruginosa was found in 56 samples out of 90 which represented
(62.2%) of the total samples tested. The factories of juices and carbonated beverages had
the highest percentage of contaminated water samples with Pseudomonas aeruginosa
which reach (83.3%). Nevertheless, the lowest one was also again bakery factories with
percentage reached 38.9% . Number of colonies were ranged from 1 to 70 CFU/200ml.
The mold was found in 17 samples out of 90 which represented (18.8%) of the total
tested samples. The cake and pytefor had the highest prevalence of mold contaminated
water with a percentage of (44.4%). The lowest one was bakery and ice cream factories
with a percentage reached (11.1%). Interestingly, all water samples that collected from
oriental sweet factories were tested negative for presence of molds. Number of colonies
were ranged from 1 to 11 CFU/100ml.
The yeast was found in 22 samples out of 90 which represented (24.4%) of the total
samples tested. The cake and pytefor had the highest prevalence of yeast contaminated
water with a percentage of (44.4%). The lowest one was bakery factories with a
percentage reached 11.1%. Number of colonies were ranged from 5 to 40 CFU/100ml.
7.2 Physico-chemical results
Results of chemical analysis of water samples showed different levels of average
concentration of Total dissolved solids ,chloride, calcium, sodium, magnesium, potassium,
nitrite, nitrate, total hardness of which was higher than the allowable limit in the standard
Palestinian and also the guidelines of WHO, where the and highest values for these
parameters were recorded in water samples that collected from bakery factories. It was as
follow:
TDS: 2104.5 mg/l , Cl: 1042.82 mg/l ,Ca :142.75 mg/l ,Na: 400.44 mg/l , Mg :81.91
mg/l, K :3.45 mg/l, NO2 :0.16 mgl , NO3 :125.1 mgl , HN :708.89mg/l
Also the lowest recorded readings of chemical analysis were in the group of juices and
carbonated beverages factories and it was as follow:
TDS: 135.03 mg/l Cl: 59.17mg/l ,Ca :2.33 mg/l Na : 32.56 mg/l, Mg :1.08mg/l, K :1.12
mg/l , NO2 :0.00 mg/l , NO3 :10.46 mg/l , HN :11.78mg/l.
The frequency of BOD5. The highest mean concentration of BOD5 (2.77 mg/l) was
detected at cake and pytefor factories, while the lowest mean concentration (0.19 mg/l) was
98
detected at bakery factories. The average concentration of BOD5 in the all water samples
was (1.27mg/l).
The concentration of turbidity for the investigated water samples showed highest mean
level (0.36 mg/l) at ice cream factories, while the lowest mean concentration (0.22 mg/l)
was recorded at juices and carbonated beverages factories. The average concentration of
Turbidity in the all water samples was (0.28mg/l).
The highest mean value of EC (3438.5 sm/cm) was detected at bakery factories, while
the lowest mean value (218.09 sm/cm) was detected at juices and carbonated beverages
factories. The average value of EC in the all water samples was (1319.30mg/l).
The frequency of the pH values indicated that the highest mean level of pH (7.45) was
detected at Bakery factories, while the lowest mean level pH (6.41) was detected at Juices
and carbonated beverages factories. The average of the pH values in the all water samples
was (6.96mg/l).
The highest mean value of temperature (29.33 oC) was indicated at cake and pytefor
factories, while the lowest mean value (26.55oC) was at juices and carbonated beverages
factories. The average value of temperature in the all water samples was (28.26mg/l).
7.3 Questionnaire
Regarding the questionnaire results, we found that 13 factories used desalinated water,
12 factories used municipality water and five of them used their own water from private
wells. We found that 16 factories used the same water for manufacturing and cleaning.
Twenty four of these factories were found to use storage tanks and 6 have no any reservoir
tanks. Out of these 24 tanks, 19 are plastic tanks and 5 are stainless steel. Only 7 tanks
were protected from direct sunlight where the rest 17 were found to be exposed to the
direct sunlight. Also, the employee cleaned the tanks once a year only in 7 factories, where
the rest 17 factories, the employee did not clean the tanks during the year.

99
8. Conclusion
1- Water is a basic and vital center in all stages of food processing
2- There are three sources of water used in food factories, a municipal water and water
desalination plants and water wells special factory
3- It showed results of microbiological analysis of samples emergence of aerobic bacteria
in a sample 76 and was isolated TC group in 70 sample and FC in 55 samples and FS in
38 samples and PS 56 in samples and Mold in 17 samples and Yeast in 22 samples of the
total 90 samples
4- Chemical analysis showed different levels of the average concentration of total
dissolved salts and mineral elements of which exceeded the allowable limit for the
Palestinian Standard
5- Higher average concentration of total Dissolved salts and mineral elements in the bakery
group and knead attributed to the use of raw water without treatment
6- Lower average concentration of total Dissolved salts and mineral elements in the
factories group juices and soft drinks group and knead attributed to the use of water
treatment

100
Recommendations
1. The physical and chemical characteristics of water that used for food and beverage
industry in foods factories should meet the Palestinian and WHO standards.
2. The used water for food and beverage industries should be free of microbial pathogens
and meet the Palestinian and WHO standards in term of microbial indicators as total and
fecal coliforms.
3. For water storage, we recommend using stainless steel tanks
4. Periodic cleaning and washing these water tanks to prevent or at least minimize its
contamination.
5. Protect these tanks from direct sunlight to avoid any chemical reactions between the tank
material and the water due to the increase in water temperature.
101
الملخص العربي
مدينة في الأغذية مصانعفي المستخدمة من المياه مختلفةلعينات يوكيميائيةوالفيز الميكروبيولوجية الخصائص
فلسطين -غزة
اىزظغ اىغذائ ب عذا ف رؾذذ ذي ف اىظزخذخ يبىمبئخ اىفش اىنزثىعخاىخظبئض رؼزجز
قبض ؾذدح اىفيظطخف اىظبغ اىغذائخ ؽش ضؼذ ئ اىاطفبد اىقبطخ اىظزخذخعد اىب
ظغ غذائ 30 اىذراطخشيذ ذ ىيشزة اىظبىؾخلاطزخذا اىب ف اىزظغ اىغذائ ثفض قبض اىب
خض غػبد ػي ؽظت ع اىزظ اىغشح ر رقظ اىظبغ ؽذاد اىزظغ خرظغ غذائ ف ذ حؽذ
6,اىنل أي ىنو غػ اىشزقخاىؼظبئز , اىخبثش ,الاض مز ,اىؾيبد خاىغذائ اىشزثبد اىغبس
اىز ىيضلاص ظغػ , مب ر ػو اطزجب 90ػبد مو ظغ ىظجؼ ػذد اىؼبد 3ظبغ .ر طؾت
.اىذراطخاعزذ ػيب
ةالميكربيولوجي الفحوصات
اىقى غػ اىقى غػ اىائخنزثىع ضو اىجنززب أخضؼذ عغ ػبد اىب ىيفؾطبد اى
اىظذض ارغسا اىؼف اىخبئز خ ,ثنززب اىظززجزممض اىجزاس ,خاىجزاس
خ غع اىؼبد مب اػي ظج %84.4 ظجخأي ب خػ 90 اطو خ ػ 76ف اىائخعذد اىجنززب
% اقو ظجخ ظر ف 100 خظجاىؼظبئز ث اىغبسخظبغ اىشزثبد خظر ف ػذد اىؼبد غػ
.%61.1اىخبثش ثظج خغػ
خ غع اىؼبد مب اػي ظر ف غػ %77.7ب ظج خػ 70اىقى خر ػشه غػ
..%38.9 خاىخبثش ثظج خاقو ظر ف غػ .%83.3 خاىؼظبئز ثظج اىغبسخظبغ اىشزثبد
غع اىؼبد مب اػي ظر ف %61.1 اي ب ظجخ ػ 55 خاىجزاساىقى خر ػشه غػ
خمب اقو ظر ف غػ اىخبثش ثظج %88.8اىؼظبئز ثظجخ اىغبسخظبغ اىشزثبد خ غػ
61.1%..
غع اىؼبد مب اػي ظر ف %42.2ظجخ ػ اي ب 38ر ػشه ثنززب اىظززجزممض اىجزاسخ
ظبغ خاقو ظر مب ف غػ %50ثظجخ اىنل خاىؼظبئز غػ اىغبسخظبغ اىشزثبد خغػ
. %27.7 ثظجخ اىشزقخاىؾيبد
غع اىؼبد مب اػي ظر ف %62.2اي ب ظجخ خػ 56مب ر ػشه اىظذض ارغسا
%38.9اقو ظر مب ف غػ اىخبثش ثظجخ %83.3اىؼظبئز ثظجخ اىغبسخغػخ ظبغ اىشزثبد
غع اىؼبد مب اػي ظر ف غػ ظبغ اىنل %18.8ثظجخ ػخ 17ر ػشه اىؼف
%11.1 خاىخبثش ثظج خظبغ الاض مز غػ خاقو ظر مب ف غػ %44.4ثظجخ
102
غع اىؼبد مب اػي ظر ف غػ ظب اىنل %24.4ػخ ثظجخ 22اضب ر ػشه اىخبئز
%11.1اقو ظر مب ف غػخ اىخبثش ثظجخ ,%44.4ثظجخ
ةالفحوصات الفيزيوكيميائي
اىنيرذ اىنبىظ اىظد اىبغظ اىنيخ اىذائجخلاػ ضو الأ خاىفشمبئ اىخظبئضر رؾيو
اىزطو اىنزثبئ الاص اىؼنبرحاىجربط اىززذ اىززاد اؽزبط الامظغ اىؾي اىؼظز اىني
اىذرع درع اىؾزارح.
ب رؼذيب اىنيخ اىذائجخ زطط رزمش الالاػ خزيفخظزبد اىنيخ اىذائجخ ىلألاػاظز اىزؾيو اىنبئ
اىنيخ اىذائجخ ىلألاػزطط رزمش ىب اىزظغ اىغذائ , ؽش مب اػي اىفيظطخ اىقبطخ خاىؾذ اىظػ ىياطف
اقو زطط رزمش مب ف غػ ظبغ اىشزثبد mg/l 2104.5رظغو ثقزاءحخبثش ف غػ اى
ىغغ اىؼبد اىنيخ اىذائجخمب زطط رزمش الالاػ mg/l 135.03رظغو ثقزاءحاىؼظبئز اىغبسخ
825.69mg/l.
زطط رزمش اىنيرذ اىنبىظ اىظد اىبغظ خزيفخمب اظز اىزؾيو اىنبئ ظزبد
اىفيظطخ اىقبطخ اىاطفخاىجربط اىززذ اىززاد اىؼظز اىني ب اررفغ ػ اىؾذ اىظػ ث ف
مبذ مب ي : اىخبثش خف غػ زاقطغيذ اػي اىؼبىخ خاىظؾاضب اىزعبد
Cl: 1042.82 mg/l ,Ca :142.75 mg/l ,Na: 400.44 mg/l , Mg :81.91 mg/l, K :3.45 mg/l ,
NO2 :0.16 mg/l , NO3 :125.1 mg/l , HN :708.89mg/l
اىؼظبئز مبذ مب ي: اىغبسخظبغ اىشزثبد خف غػ قزاطغو اقو ىلمذ
Cl: 59.17mg/l ,Ca :2.33 mg/l Na : 32.56 mg/l, Mg :1.08mg/l, K :1.12 mg/l ,
NO2 :0.00 mg/l , NO3 :10.46 mg/l , HN :11.78mg/l
ؼشي اررفبع زطط اىززمشاد ف اىخبثش اى اطزخذا اىخبثش ىب اىجيذبد ب الاثبر د أي ؼبىغ ىيب
. اىؼبىغخف اىغبىت رظزخذ اىب ف اىغبسخاب ف ؽبى ظبغ اىشزثبد اىظزخذخ
بم msm/cm.3438ف اىزطو اىنزث ؽش طغو زطط اىقبص الأػيىاىخبثش خىذىل مبذ غػ زغخ
msm/cm 218.09 ثقزاءحاىؼظبئز اىغبسخظبغ اىشثبد خاقو زطط رطو اىنزث ف غػ
mg/l 2.77طغيذ ثقزاءح ظبغ اىنل خاىؾي مب اػي زطط رزمش ف غػ الأمظغر رؾيو اؽزبط
الأمظغمذىل طغو زطط رزمش اؽزبط mg/l 0.19طغيذ ثقزاءحاىخبثش خ مب اقو زطط رزمش ف غػ
. 1.27mg/lاىؾي ف عغ اىؼبد

103
مب الاقو ف mg/l 0.36رظغو ثقزاءحظبغ الاض مز خف غػ الأػيى اىؼنبرحطغو زطط رزمش
.مبذ قزاء mg/l 0.22رظغو ثقزاءحاىؼظبئز اىغبسخزطط رزمش اىؼنبر غػ ظبغ اىشزثبد
.0.28mg/lىغغ اىؼبد اىؼنبرحزطط رزمش
مب pH (7.45)اىخبثش ثق خىغػ خاػي قالاص اىذرع ف عغ اىؼبد مبذ زطط خطغيذ ق
الاص خمبذ زطط ق pH (6.41) خاىؼظبئز ثق اىغبسخف غػخ ظبغ اىشزثبد خزطط اقو ق
. pH 6.96اىذرع ىغغ اىؼبد
ح ف رؽ زا خاػي درع ؽذ طغو زطط اىؾزارح خػبد اىب مب بك رفبد ف ق درع حطغيذ درع ؽزار
29.33ثق غػ خ اىن ل oC ظ بغ اىش زثبد خاىؾ زارح غػ خدرع خم ب الاق و ف زط ط ق
26.55اىؼظبئز ثق اىغبسخoC 28.28 ف عغ اىؼبد اىؾزارحمب زطط ق درع c .
وتائج تحليل الاستبيان
13ىيب خزيفخ فنب بك صلاس ظبدر اىذراطخظغ اىز اعزذ ػيب ثبىضلاصر ػو اطزجب خبص
16رظزخذ ب ثئز خبص ثبىظغ , مب 5 خرظزخذ ب ثيذ 12مب اىزؾيخظغ رظزخذ ب ؾطبد
لا 6ىيب قبثو خشا ظغ مبذ رؾزي ػي 24ظغ ظزخذ فض ظذر اىب ىيزظغ ىيزظف , اضب
5رظزخذ رل ثلاطزن قبثو 19اىزخش خشاػب خشا, اطزخذذ اىظبغ اىز عذ ث خشاثب عذ
لا رزؼزع 7ىيشض قبثو خشابربظغ رزؼزع 17 الافضو , مب اضب طزو اىظزبيض خشافقط رظزخذ
خلاه اىؼب اىاؽذ. اىخشالا ز رظف 17خلاه ػب قبثو خشااىظبغ رق ثزظف 7اىشض , فقط حىؾزار

104
References
Abd El-Salam M . El-Ghitany E and Kassem M .(2008). Quality of Bottled Water Brands
in Egypt Part II: Biological Water Examination. Nutrition, Cairo, Egypt. Vol. 83 No. 5 & 6
Abd-Elrahman M F .(2003).Ground Water in El-Managil Province. Agric, Gezira Univ,
Sudan,90p.
Abu Mayla Y and Abu- Amr S (2010). Chemical and microbiological quality of drinking
water in Gaza Strip, Institute of Water and Environment, Al-Azhar University – Gaza .
Abu Maila Y, El-Nahal I, Al-Agha M.(2004). Seasonal variations and mechanisms of
groundwater nitrate pollution in the Gaza Strip. Environ Geol 47:84–90.
Agrawal D. Kumar P. Avtar R. Ramanathan A.(2011). Multivariate Statistical Approach to
Deduce Hydrogeochemical Processes in the Groundwater Environment of Begusarai
District, Bihar. Water Qual Expo Health, 3:119–126.
Ahmed, A., S. Dawar and M. Tariq. (2010). Mycoflora associated with sugar cane juice in
Karachi city. Pakistan. Journal. Botany., 42(4): 2955-2962.
Aish M A. (2011). Water quality evaluation of small scale desalination plants in the Gaza
Strip, Palestine. Desalination and Water Treatment, 29 (1-3): 164-173.
Akoto O. Adiyiah J.(2007). Chemical analysis of drinking water from some communities
in the Brong Ahafo region. Department of Chemistry, Kwame Nkrumah University of
Science and Technology Kumasi, Ghana International Journal of Environmental Science
and Technology., 4 (2): 211-214, ISSN: 1735-1472
Al- Khatib I. Arafat H .(2009). Chemical and microbiological quality of desalinated
water, groundwater and rain-fed cisterns in the Gaza strip, Palestine. Desalination 249:
1165–1170
Al-Agha, M.R. and Mortaja, R.S. (2005) . Desalination in the Gaza Strip: drinking
water supply and environmental impact, Desalination 173 157–171.
Al-Ahmadi M E (2005). Ground water quality in some villages northeast of Jaddah City ,
Saudi Arabia. Ninth International Water Technology Conference.pp.387-394
Al-Jamal K and Al-Yaqubi A (2000). Prospect of Water Desalination in Gaza, Palestinian
Water Authority, Gaza palestin.
Allen, M., S. Edberg, and D. Reasoner. April 22-24, (2002). Heterotrophic Plate
Count(HPC) Bacteria - What is Their Significance in Drinking Water? NSF
International/WHO Symposium on HPC Bacteria in Drinking Water: Public Health
Implications? Geneva, Switzerland.
Almasri, M.N., Kaluarachchi, J.J., (2005). Modular neural networks to predict the nitrate
distribution in ground water using the on-ground nitrogen loading and recharge data.
Environmental Modelling and Software 20 (7), 851–871.
105
American Public Health Association., American Water Works Ass Association., and Water
Pollution Control Fed.( 1992). Standard Methods for the Examination of Water and
Wastewater. 18th
Edition. New York.
American Public Health Association . (APHA).( 2005). Standard Methods for the
Examination of Water and Wastewater 21th ed. APHA, Inc. Washington, DC.
American Public Health Association (APHA). (1995). Standard Methods for the
Examination of Water and Wastewater 19th. Edition. American Public Health
Association, Washington. D. C.
American Public Health Association, (1998). Standard Methods for the Examination of
Water and Wastewater (20th ed.), American Public Health Association, Washington, DC.
American Public Health Association, (1998). Standard Methods for the Examination of
Water and Wastewater (20th ed.), American Public Health Association, Washington, DC.
American Public Health Association, (1999). American Water Works Association, Water
Environment Federation Standard Methods for the Examination of Water and Wastewater
5210 Biochemical Oxygen Demand .
American Public Health Association, (APHA). (1975). Standard methods for the
examination of water and waste waters. 13th
edition. New York.
American Public Health Association, (1998). Standard Methods for the Examination of
Water and Wastewater (20th ed.), American Public Health Association, Washington, DC
American Public Health Association. (1989) .Standard methods for the examination of
water and wastewater, 17th ed. Washington,
Anaissie, E.J., Stratton, S.L., Dignani, M.C., Summerbell, R.C., Rex, J.H., Monson, T.P.,
Spencer, T., Kasai, M., Francesconi, A. and Walsh, T.J., (2002). Pathogenic Aspergillus
species recovered from a hospital water system: a 3-year prospective study. Clinical
Infectious Diseases, 34: 780-789.
Anetor, J.I, Adeniyi, F.A.A, and Olaleye S.B. (2003). Molecular Epidemiology: A Better
Approach for the Early Detection of Pathophysiologic Response to Environmental
Toxicants and Diseases. African Journal of Biomedical Research. 6: 113-118.
APHA, AWWA, WEF (1995). Standard methods for the examination of water and
wastewater, 19st ed. Washington, DC, American Public Health Association, American
Water Works Association and Water Environment Federation.
APHA.( 1995). Standard Methods for the Examination of Water and Wastewater. 19th
Edition. Washington, DC.
ARMCANZ/NHMRC. ,(1996). (Agriculture and Resource Management Council
ofAustralia and New Zealand, National Health and Medical Research Council),1996,
Australian Drinking Water Guidelines. Commonwealth of Australia.
Arvanitidou M., Spaia S., Velegraki A., Pazarloglou M., Kanetidis D., Pangidis P.,
Askepidis N., Katsinas C., Vayonas G. and Katsouyannopoulos V. (2000). High level of

106
recovery of fungi from water and dialysate in haemodialysis units. J Hosp Infect.
Jul;45(3):225-230.
Arvanitidou, M., Kanellou, K., Constantinides, T.C. and Katsouyannopoulos, V. (1999)
.The occurrence of fungi in hospital and community potable waters. Lett Appl Microbiol
29, 81–84.
Asano, T. (2007). Water reuse: Issues,technologies, and applications. New York: McGraw-
Hill.
Assaf, S. (2001). Existing and the future planned desalination facilities in the Gaza
Strip of Palestin e and their socio- economic and environmental impact, Desalination 138
17–28.
Austgen, L. (2006). The Na+ - K+ - ATPase (sodium pump). Retrieved
fromhttp://www.vivo.colostate.edu/hbooks/molecules/sodium_pump.html.
AWWA(2002). online Monitoring for Drinking water Utilities Denver , CO. 123-26.
Aydin A.(2006) . The Microbiological and Physico-Chemical Quality of Groundwater in
West Thrace, Turkey. Istanbul University Faculty of Veterinary Medicine, Department of
Food Hygiene and Technology, 34320 Avcilar, Istanbul, Turkey.
Baalousha,( 2008). analysis of nitrate occurrence and distribution in groundwater in the
Gaza Strip using major ion chemistry, Environmental Geology.Vol 10, No 3, pp 337-349
.
Babiker, I.S., Mohamed, M.A.A., Terao, H., Kato, K., Ohta, K., (2003). Assessment of
groundwater contamination by nitrate leaching from intensive vegetable cultivation using
geographical information system. Environment International 29, 1009–1017.
Bachmat, Y .and . Khalid, A. (2000). The 1999 Drought and its Hydrologic Impact.
Baron RF and Penfield MP.( 1996). Capsaicin Heat Intensity – Concentration, Carrier, Fat
Level, and Serving Temperature Effects. J. Sensory Studies. 11: 4: 295-316.
Bartels JHM, Brady BM, Suffet IH. (1986). Could the Flavor Profile Analysis Method for
the Evaluation of Taste and Odor in Drinking Water be Developed in a Standard Method?
Proc. American Water Works Association (AWWA) Annual Conference. Denver, CO.
Basnyat, B., Sleggs, J. and Spinger, M. (2000). Seizures and delirium in a trekker: the
consequences of excessive water drinking? Wilderness Environ. Med. 11, 69-70.
Batisha A F (2007).Water quality analysis of water structures projects, case study : New
Naga Hammadi Barrage in Egypt. Eleventh International Water Technology Conference,
Sharm El-Sheikh Egypt . 11:1009-1019.
Baumgartner A, Grand M. (2006). Bacteriological quality of drinking water from dispenser
(coolers) and possible control measures. Journal Food Protection 69:3043-3046.
107
Bays LR, Burman NP, Lewis WM.(1970). Taste and odour in watersupplies in Great
Britain: a survey of the present positionand problems for the future. Water Treat Exam
;19:136—60.
Behnam K ., Farid M ., Mohammad M ., Farah R .,(2011) .The Source of Natural Arsenic
Contamination in Groundwater, West of Iran Water Qual Expo Health (2011) 3:135–147
DOI 10.1007/s12403-011-0051-x
Berney M., Hammes F., Weilenmann H.-U., Bosshard F., Egli T. (2007). Assessing and
interpreting bacterial viability using LIVE/DEAD BacLight TM Kit in combination with
flow cytometry. Applied and Environmental Microbiology 73, 3283– 3290.
Berney M., Vital M., Hulshoff I., Weilenmann H.U., Egli T., Hammes F. (2008). Rapid
assessment of microbialviability in drinking water. Water Research (in press).
Besner, M.C., Gauthier V.Servais P. and Camper A. (2002). Explaining the Occurrence of
Coliform in Distribution Systems. Journal American Water Works Association,94(8):
pp.95-109.
Bharath J. Mosodeen M. Motilal S. Sandy S. Sharma S. Tessaro T. Thomas K.
Umamaheswaran M. Simeon D . and Adesiyun A. (2002). Microbial quality of domestic
and imported brands of Botted water in Trinidad .International Journal of Food
Microbiology 81:pp.53-62.
Bitton, G. (2005). Wastewater microbiology. Third edition. Wiley-Liss, A John Wiley &
Sons, INC., Publication.
Boethling R.S. and Mackay D. (2000). Handbook of Property Estimation Methods for
Chemicals. Environmental Health and Sciences. CRC Press. Boca Raton, FL.
Bouakline, A., Lacroix, C., Roux, N., Gangneux, J.P. and Derouin, F., (2000). Fungal
contamination of food in hematology units. Journal of Clinical Microbiology, 38 (11):
4272-4273.
Brady, N.C. and R.R. Weil.( 1999). The Nature and Properties for Soils 12th edition.
Prentice- Hall, Inc. Upper Saddle River, New Jersey.
Brake, P. (2007). A Bug‘s-Eye-View of the BOD Test. Washington State Department of
Ecology. Olympia, Washington, U.S.A.
Brenner, D.J., David, B.R., and Steigerwalt, A.G. (1982). Atypical biogroups of
Escherichia coli found in clinical specimens and description of Escherichia hermanii sp.
nov. Journal of Clinical Microbiology. 15:703-713.
Broseus R Cigana J .Barbeau B. Dainnes-Martinez C and Suty S.(2009).Removal of total
dissolved solids , nitrates and ammonium ions from drinking water using charge-barrier
capacitive deionization Desalination, 249:217-223.
Brown, J.; Colling, A.; Park, D.; Phillips, J.; Rothery, D.; Wright, J.(1989)..Seawater: Its
Composition, Properties and BehaViour; Pergamon Press: Oxford.

108
Bruvold WH and Ongerth HJ.( 1969). Taste quality of mineralized water. Journal of the
American Water Works Association, 1969, 61:170.
Burlingame G and Tanjuncto A. (2001). Does Boiling Improve Water Quality and Taste?
Opflow. March. 27: 3: 7.
Burlingame GA, Khiari D, Suffet IH. (1991). Odor Reference Standards: The Universal
Language. Sunday Seminar: Case Studies on Taste and Odor: Evaluation and Treatment.
Proc. AWWA Water Quality Technology Conference WQTC. Orlando, FL.
Buttigliglieri G .Malpei F . Melchiori M .Nieman H and Ligthart J (2005). Denitrification
of drinking water sources by advanced biological treatment using a membrane bioreactor
.Desalination, 178:211-218.
Cabral D. and Fernandez P. (2002). Fungal spoilage of bottled mineral water. Int J Food
Microbiol.Jan 30;72(1-2):73-76.
Canovas D, Duran C, Rodriguez N, Amils R, and de Lorenzo V. (2003). Testing the limits
of biological tolerance to arsenic in a fungus isolated from the River Tinto. Environ
Microbiol.Feb;5(2):133-138.
Carr, R., (2000). Public health implications of water reuse in the food and beverage
industry,‖ Presented at the ILSI Seminar Pretoria, South Africa; Available online at:
http://southafrica.ilsi.org/file/Water_Re-use_symp_Carr_paper.pdf.
Centers for Disease Control and Prevention (CDC). (2009). Most Americans should
consume less sodium (1,500 mg/day or less). Retrieved from:
http://www.cdc.gov/Features/Sodium/ .
Chastre J, Fagon JY. (2002).Ventilator-associated pneumonia. Am J Respir Crit Care
Med;165:867–903.
Chastre J, Trouillet JL. (2000). Problem pathogens (Pseudomonas aeruginosa and
acinetobacter). Semin Respir Infect;15:287–98.
Chemical Analysis of Inorganic Constituents of Water.(CAICW). (1982), Editor Jon C.
Van Loon, CRC Press, Inc. Boca Raton, Florida , United States of America.
Chemistry and Biology of Water, Air and Soil,(1993). Edited by J.Tolgyessy, ELSEVIER
Amsterdam-London-New York-Tokyo , Czechoslovakia , Chapter 3.4.1.6.29.
Chiu H . Tsai S. Wu T and YuhYang C (2010). Effect modification of the association
between trihalomethanes and pancreatic cancer by drinking water hardness ;Evidence from
an ecological study. Environmental Research , 110:513-518.
Craig, D. L., Fallowfield, H. J., and Cromar, N. J. (2002). "Enumeration of faecal
coliforms from recreational coastal sites: evalution of techniques for the separation of
bacteria from sediment." Journal of Applied Microbiology, 93, 557-565.
Craig, D. L., Fallowfield, H.J., and Cromar, N.J. (2004): "Use of Microcosms to
Determine persistence of Escherichia coli in recreational coastal water and sediment and
validation with in situ measurements." Journal of Applied Microbiology, 922-930.

109
David, Elizabeth L. (1990). ―Trends and Associated Factors in Offstream Water Use:
Manufacturing and Mining Water Use in the United States, 1954-83.‖ USGS National
Water Summary 1987–Water Supply and Use. Water Supply Paper 2350. Washington,
D.C.: U.S. Government Printing Office.
Dawson, D. (2000). Water quality for the food industry: management and microbiological
issues. CCRFA .guideline No 27. Campden and Chorleywood Food Research Association,
Chipping Campden, UK. de l'Eau, 5, 69-89.
Delzer, G.C. and S.W. McKenzie. (2003). Five-day biochemical oxygen demand: U.S.
Geological Survey Techniques of Water-Resources Investigations. Book 9. Chapter A7
(3rd ed.). Section 7.0 accessed on 2 February, 2006 from
http://pubs.water.usgs.gov/twri9A/.
Denning, D.W., O‘Driscoll, B.R., Hogaboam, C.M., Bowyer, P., and Niven, R.M., (2006).
The link between fungi and severe asthma: a summary of the evidence. European
Respiratory Journal, 27 (3): 615-626.
Department of Agriculture Fisheries and Forestry (2008)., Australian Food Statistics,
Commonwealth of Australia.
Department of National Health and Welfare . (1978). Canada , Guidelines for Canadian
drinking water quality. Supporting documentation. Ottawa .
Dev R.Abdul-Wahab S A and Tiwari G N (2011).Performance study of inverted absorber
solar still with water depth and total dissolved solid . Applied Energy,88:252-264.
Devriese, L.A., Pot, B., Kersters, K., Lauwers, S. and Haesebrouck, F. (1996).
Acidification of methyl-(-D-glucopyranoside: a useful test to differentiate Enterococcus
casseliflavus and Enterococcus gal-linarum from Enterococcus faecium species group and
from Enterococcusfaecalis. Journal of Clinical Microbiology 34 (10), 2607–2608.
Difco Manual, (1998). Dehydrated culture media and reagents for microbiology. Difco
laboratories, Detroit, Michigan 21152 USA. 11th
. Edition.
Dongan E Segorur B . and Koklu R.(2009). Modeling biological oxygen demand of the
Melen River in Turkey using an artificial neural net work technique . Journal of
Environmental Management,90:1229-1235.
Dorothy, A.G. & Philip, R.A. (1998). Technology of Bottled Water. USA: Sheffield
Academic Press.
Easa A and Abou-Rayan A .(2010). Domeastic wastewater effect on the pollution of the
groundwater in rural areas in Egypt Thirteenth International Water Technology
Conference ,Cairo , Egypt, pp.909-923.
El-Baba M. (1999).Evaluation for the groundwater quality of the domestic water wells in
Gaza City. . Fourth International Water Technology Conference, Alexandria Egypt
,pp.303-313.
Elin RJ.(1988). Magnesium metabolism in health and disease. Dis Mon . 34:163-218.
110
El-Kasshuty M.(2010). Modeling of the limestone aquifer using isotopes major, and trace
element in t western river NILE been Benisuf and E-Mina. Thirteenth International Water
Technology Conference ,Cairo , Egypt , PP.941-969.
El-Madhoun F.(2002). Evaluation of Drinking Water Quality in Gaza Strip Governorates
Through The Period From 1990 To 2002. Environmental & Information Centre -Gaza
Governorate- P.O Box 1422, Palestine. [email protected]
Emde KM, Smith DW, Facey R.(1992).Initial investigation of microbially influenced
corrosion (MIC) in alow temperature water distribution system.Water Res ;26:169-75.
Environment Canada. (1985). Potassium chloride (potash). Environmental and technical
information for problem. spills. Environmental Protection Service, Environment Canada,
Ottawa, March (ISBN 0-662-13984-4).
Environment Protection Agency.(2006), ―Drinking Water Contaminants, Microbes,‖
available at http://www.epa.gov/safewater/hfacts. html#Microbiological
European Union and United Nations Environment Programme, (2002). Copyright © 2002
Confederation of the Food and Drink Industries of the ISBN: 92-807-2185-2.
Farnleitner, A.H., Hocke. L. Beiwl, C., Kavka, G.G., Zechmeister T., Kirschner A.K.T.,
and MACH, R.L. (2001). Rapid enzymatic detection of Escherichia coli contamination in
polluted river water, Letters in Applied Microbiology, 33, 246-250.
Federal Register. (1985). National Primary Drinking WateRegulations; Synthetic
Organic Chemicals, Inorganic Chemicals and Microorganisms; Proposed Rule. Federal
Register 50: 46936-47022.
Flint, K. P. (1987). The Long Term Survival of Escherichia coli in River Water. Journal
ofApplied Bacteriology. 63:261-270.
Fox, K.R. and Reasoner, D.J. (1999). Water quality in source water, treatment, and
distribution systems. In: AWWA manual of water supply practices. AWWA M48.
Waterborne pathogens. American Water Works Association, Denver, CO.
Francy, D.S., Myers, D.M., and Metzker, K.D.,( 1993), Escherichia coli and fecal coliform
bacteria as indicators of recreational water quality:U.S. Geological Survey Water-
Resources Investigations Report 93-4083, 34 p.
Frankova´ , E. (1993). Isolation and identification of filamentous soil Deuteromycetes from
the water environment. Biologia 48, 287–290.
Frankova´ , E. and Horecka, M. (1995). Filamentous soil fungi and unidentified bacteria in
drinking water from wells and water mains near Bratislava. Microbiology Research 150,
311–313.
Frassetto, Lynda A., et al. (1998). Estimation of net endogenous noncarbonic acid
production in human from diet potassium and protein contents. American Journal of
Clinical Nutrition, Vol. 68, pp567-83.
111
Friesa, J. Stephen, Characklisb, Gregory W., and Noble, Rachel T.(2008). "Sediment–
water exchange of Vibrio sp. and fecal indicator bacteria: Implications for persistence and
transport in the Neuse River Estuary, North Carolina, USA." Water Research,: 941-950.
Gelb SB, Anderson MP. (1981).Sources of chloride and sulfate in ground water beneath an
urbanized area in Southeastern Wisconsin (Report WIS01 NTIS). Chemical abstracts,
96(2):11366g.
Gelberg, K.H., et al. (1999). "Nitrate levels in drinking water in rural New York State."
Environ.Res. 80(1):34-40.
Geldreich, E.E. (1996). Microbial Quality of Water Supply in Distribution Systems. Lewis
Publishers. CRC Press Inc. Boca Raton, FL.
Geldreich, E.E., (1990). Microbiological quality of sourse waters for water supply In:
Drinking water microbology (ed. G. A. McFeters), Springer Verlag, New York.
George MH, Wiklund L, Aastrup M, Pousette J, Thunholm B, Saldeen T, et al.
(2001)Incidence and geographical drinking water and groundwater levels. Eur-J-Clin-
Invest. 31(12):1083-94.
Ghulman B A . El-Bsy M. S. and Ali h .(2008). .Ground water assessment of Makah Al-
Mokarama. Twelfth International Water Ttechnology Conference, Alexandria ,Egypt,
pp.1515.
Giannoulis N. Maipa V. Konstantinou I . Albanis T . and Dimoliatis
I.(2000).Microbiological risk assessment of Agios Georgios source supplies in
Northwestern Greece based on fecal coliforms determination and sanitary inspection
survey Southeast Asian J Trop Med Public Health 20:pp333-9.
Gibrilla A. Bam E. Adomako D.Ganyaglo S. Dampare S. Ahialey E. Achoribo E. Alhassan
H. Denutsui D. Tetteh E.(2011). Seasonal Evaluation of Raw, Treated and Distributed
Water Quality from the Barekese Dam (River Offin) in the Ashanti Region of Ghana
Water Qual Expo Health 3:157–174.
Gleeson, C. and Gray, N. (1997) The Coliform Index and Waterborne Disease. E&FN
Spon, London.
Goldberg JB. (2000).Pseudomonas: global bacteria. Trends Microbiol 8: 55–57.
Goncalves, A. B., Russell R., Paterson M. and Lima N. (2006). Survey and significance of
filamentous from tap water. International journal. Hydrogen. Environ. Health., 209: 257-
264.
Gottlich, E., van der Lubbe, W., Lange, B., Fiedler, S., Melchert, I., Reifenrath, M.,
Flemming, H.C. and de Hoog, S. (2002). Fungal flora in groundwater-derived public
drinking water. International Journal Hydrogen Environ Health 205, 269–279.
Grabinska-Loniewska, A., Konillowicz-Kowalska, T., Wardzynska, G. and Boryn, K.,
(2007). Occurrence of fungi in water distribution system. Polish Journal of Environmental
Studies, 16 (4): 539-547.
112
Great Lakes Commission. (GLC).(1996). (last rev.). Liquid Asset: Great Lakes Water
Quality and Industry Needs. http://www.glc.org/docs/liqasset/liqasset.html. Ann Arbor,
Mich.: Great Lakes Commission.
Guidelines for drinking-water quality.(1996), 2nd ed. Vol. 2. Health criteria andother
supporting information. World Health Organization, Geneva .
Guthrie HA. Introductory nutrition, 7th ed. St. Louis, MO, Times Mirror/Mosby College
Publishing, 1989.
Hageskal G. Gaustad P. B.T. Heier B.T. and Skaar I.(2006A). Occurrence of moulds in
drinking water. Ida Skaar, Section for Food and Feed Microbiology, PO Box 8156 Dep.,
0033 Oslo, Norway. E-mail: [email protected]
Hageskal, G., Gaustad, P., Heier, B.T. and Skaar, I., (2007). Occurrence of moulds in
drinking water. Journal of Applied Microbiology, 102 (3): 774-780.
Hageskal, G., Knutsen, A.K., Gaustad, P., de Hoog, G.S. and Skaar, I., (2006B). The
diversity and significance of mold species in Norwegian drinking water. Applied
Environmental Microbiology, 72 12): 7586-7593.
Hageskal, G., Lima, N. and Skaar, I., (2009). The study of fungi in drinking water.
Mycological Research, 113: 165-172.
Hardie, J.M. and Whiley, R.A. (1994) Recent developments in streptococcal taxonomy:
their relation to infections. Review ofs in Medical Microbiology 5 (3), 151–162.
Harrison, Joseph F., P.E.,(2001). Water Treatment Fundamentals, 7th ed., Water Quality
Association,2001.
Haruna, R., Ejobi, F. And Kabagambe, E.K., (2005). The quality of water from protected
springs in Katwe and Kisenyi parishes, Kampala city, Uganda. Afr. Hlth. Sci., 5: 14-20.
Hauschka, R. (1951). Nutrition science. Understanding physiology of digestion and
ponderable and imponderable qualities of nutrients. (in German). Vittorio Klostermann,
Frankfurt amMain.
Havelaar A. H., Versteegh J. F. M, DurinG M. (1990). The presence of Aeromonas in
drinking water supplies in the Netherlands. Zentralbl. Hyg. Umweltmed., 190, 236.
Hayette M P. Christiaens G. Mutsers J. Barbier C. Huynen P.Melin P and Mol P.(2010).
Filamentous fungi recovered from the water distribution system of a Belgian university
hospital. Medical Mycology November 48, 969–974.
Health Canada (2006). Guidelines for Canadian Drinking Water Quality: Guideline
Technical Document— Heterotrophic Plate Count. Water Quality and Health Bureau,
Healthy Environments and Consumer Safety Branch, Health Canada, Ottawa, Ontario.
Health Canada .(2008). Guidance on Potassium from Water Softeners. Water, Air and
Climate Change Bureau, Healthy Environments and Consumer Safety Branch, Health
Canada, Ottawa,Ontario.

113
Hedayati M.T. Mayahi S. Movahedi M. ShokohiT.(2011). Study on fungal flora of tap
water as a potential reservoir of fungi in hospitals in Sari city, Iran. Journal de Mycologie
Médicale (2011) 21, 10—14
Hernandez J., Ferrus A. A., Hernandez M.,Alonso J. L. (1997). Comparison of six different
methods for typ ing Pseudomonas aeruginosa strains isolated from bottled and well waters.
Water Res. 31, 3169.
Hogaboam, C.M.,Carpenter, K.J. Schuh, J.M. and Buckland, K.F.( 2005). Aspergillus and
asthma – any link? Medical Mycology, 43 (S1): S197-S202.
Houghton Mifflin Company,( 2010). Biochemical oxygen demand." The American
Heritage® Dictionary of the English Language, Fourth Edition. oxygen demand .
<Dictionary.com http://dictionary.reference.com/browse/Biochemical.
Huang, S.S., Labus, B.J., Samuel, M.C., Wan, D.T. and Reingold, A.L. (2002). Antibiotic
resistance patterns of bacterial isolates from blood in San Francisco County, California,
1996–1999. Emerging Infectious Disease 8,
Hurst, C. J. R. M. Clark, and S. E. Regli. (1996). Estimating the risk of acquiring infectious
disease from ingestion of water. Chapter 4. pp. 99-139. In C. J. Hurst (ed.), Modeling
Disease Transmission and Its Prevention by Disinfection. Cambridge University Press,
Cambridge.
Ibnoussina M .Mohamed E H and Abdellatif M .(2006). Expeerimentation et
modelisation de la lixiviation de lazote nitrique dans un sol sableux. C.R
Geossciences,338:787-94.
Ildiz E .(2003). Water softening in acrossflow membrane reactor Desalination .159:139-
152.
Innerarity, S. (2000). Hypomagnesemia in Acute and Chronic Illness. Crit. Care Nurs. Q.
23:1-19.
International Groundwater Resources Assessment Centre .(IGRAC). (2010). Global
Groundwater Information System(GGIS). Delft, The Netherlands, IGRAC.
http://www.igrac.net
International Life Sciences Institute (ILSI)(2008). Europe a.i.s.b.l. Avenue E. Mounier 83,
Box 6B-1200 Brussels Belgium E-mail: [email protected] Website: http://europe.ilsi.org
Printed in Belgium D/2008/10.996/ ISBN 9789078637080
Jacinthe PA, Dick WA, Brown LC.(2000). Bioremediation of nitrate-contaminated shallow
soils and waters via water table management techniques: evolution and release of nitrous
oxide. Soil Biology and Biochemistry ;32(3):371-82.
Jensen, P. K., Jayasinghe, G., Van Der Hoek, W., Cairncross, S. And Dalsgaard, A.,
(2004). Is there an association between bacteriological drinking water quality and
childhood diarrhoea in developing countries. Tropical Medicine and International Health.,
9:1210-1215.
114
Karavoltsos, S. Sakellari A .Mihopoulo N. Dassenakis M And Scoullosm. J. (2008).
Evaluation of the quality of drinking water in regions of Greece . Desalination, 2244:317-
329.
Kavka, G. G.& Poetsch, E. (2002): Microbiology. - In: Technical Report of the
International Commission for the Protection of the Danbue River. Eds. Péter Literáthy,
Veronika Koller Kreimel, Igor Liska. Eigenverlag ICPDR. 138-150.
Kent State University. (2002). Sodium in drinking water. Retrieved from:
http://www.oznet.ksu.edu/library/h20ql2/MF1094.PDF.
Kimberly, L., Anderson, J., Whitlock, E. And Harwood, V. J., (2005). Persistence and
differential survival of fecal indicator bacteria in subtropical waters and sediments. Appl.
environ. Microbiol., 71:3041-3048.
Kinsey, G., Paterson, R. And Kelley, J.,( 2003). Filamentous fungi in water systems. In
Handbook of Water and Wastewater Microbiology, Mara, D. And Horan, N. (eds.),
Academic Press, London, UK.
Kirmeyer G . Friedman M. Martel K.Thompson G . Sandvig A. Clement J.and Frey
M.(2002). guidance Manual for Monitoring Distribution System Water Quality. AWWA
RF and CRS PROAOUA.Denver
Knobeloch, L., and M. Proctor. (2001). "Eight blue babies." WMJ. 100(8).
Knocke W. Personal Communication. What are typical water treatment plant raw water
temperatures? (18 Dec. 2000).
Kobayashi, J. (1957). On geographical relationship between the chemical nature of river
water and death rate from apoplexy. Berichte des Ohara Instituts für landwirtschaftliche
Biologie Okyama University 11: 12-21.
Kolter R. (2010). Biofilms in lab and nature: a molecular geneticist‘s voyage to microbial
ecology. Int Microbiol 13:1-7.
Kondro, W. (2000). E coli outbreak deaths spark judicial inquiry in Canada. Lancet,
355:2058.
Korhonen, MH, Järvinen, RMK, Sarkkinen, ES, Uusitupa, MIJ. (2000). Effects of a salt-
restricted diet on the intake of other nutrients. The American Journal of Clinical Nutrition,
72, 414 – 420.
Krieg, N., and Holt, J., eds. (1984). Bergey's Manual of Systematic Bacteriology. Volume
1. Baltimore: Williams and Wilkins. p. 141-164.
Lahti K. , (1993). Microbial quality of drinking water in some finnish distribution systems.
Water Science and Technology. 27; 151.
Lake Victoria Environmental Management Program(LVEMP). (2002). Water quality
management and sustainability: the experience of Lake Victoria Environmental
Management Project.
115
LeChevallier, M.W. and W.D. Norton,(1991). ―Giardia and Cryptosporidium in raw and
finished water,‖ Journal of the American Water Works Association, 87:54-68.
LeClerc, H. April 22-24, (2002). Relationships Between Bacteria and Pathogens in
Drinking Water. NSF International/WHO Symposium on HPC Bacteria in Drinking Water:
Public Health Implications? Geneva, Switzerland.
Leclerc, H., Devriese, L.A. and Mossel, D.A.A. (1996). Taxonomical changes in intestinal
(faecal) enterococci and streptococci: consequences on their use as indicators of faecal
contamination in drinking water. Journal of Applied Bacteriology 81, 459–466. Murray,
B.E. (1995) Editorial response: what can we do about.
Lee, Christine M., Lin, Tiffany Y.,Lin, Chu-Ching, Kohbodi, Golenaz A., Bhatt,
Anita,Lee, Robin, Jay, Jennifer A. (2006). "Persistence of fecal indicator bacteria in Santa
Monica Bay beachSediments." Elsevier,2593-2602.
Lee, Y.W., Dahab, M.F., Bogardi, I., (1991). Nitrate risk management under uncertainty.
Journal of Water Resources Planning and Management 118 (2), 151–165
Lerga T M And Osullivan C K (2008). Rapid determination of total hardness in water
using fluorescent molecular aptamer beacon. Analytica Chimice Acta,610:105-111
Lewis, E. L. (1980). The practical salinity scale and its antecedents. IEEE J. Oceanic Eng.
, 5, 3–8.
Lewis, R.J. (1997). Hawley‘s condensed chemical dictionary. 13th edition. Van Nostrand
Reinhold, New York, NY.
Lide, D.R. (2004). CRC handbook of chemistry and physics. 85th edition. CRC Press,
Boca Raton, FL.
Liguori G . Cavallotti I. Arnese A. Amiranda C. Anastasi D. Angelillo I F.(2010).
Microbiological quality of drinking water from dispensers in Italy. BMC Microbiology
10:19.
Linke, W.F. (1965). Solubilities of inorganic and metal organic compounds. American
Chemical Society, Washington, DC [cited in Environment Canada, 1985].
Lockhart EE, Tucker CL, Merritt MC.(1955). The effect of water impurities on the flavour
of brewed coffee. Food research, 1955, 20:598.
Lyczak JB, Cannon CL, Pier GB. (2000). Establishment of Pseudomonas aeruginosa
infection: lessons from a versatile opportunist. Microbes Infect 2:1051-1060.
Mao, X., Prommer, H., Barry, D.A., Langevin, C.D., Panteleit, B., Li, L., (2006). Three--
dimensional model for multi-component reactive transport with variable density
groundwater flow. Environmental Modelling and Software 21 (5), 615–628.
Margat, J. (2008). Les eaux souterraines dans le monde. Paris, BGRM/Editions UNESCO.
Marty, J.L., Olive, D., Asano, Y., (1997). Measurement of BOD:correlation between 5-day
BOD and commercial BOD biosensor values. Environ. Technol. 18, 333–337.
116
Mayo Foundation for Medical Education and Research (MFMER). (2008). Sodium: are
you getting too much? Retrieved from:
http://www.mayoclinic.com/health/sodium/NU00284.
Mayur Milan Kale and Indu Mehrotra .(2009). International Journal of Civil and
Environmental Engineering 1:1 Rapid Determination of Biochemical Oxygen Demand.
McCutcheon, S. C. Martin, J. L., Barnwell Jr T. O. (1983). Water quality. In Handbook of
Hydrology. New York: McGraw-Hill Inc.
McGinnis, M. R. (1996), Micology. In: Baron, S. (Ed.). Medical Microbiology. 4th ed.
Texas: Galveston.
Mead, P.S., et al., (1999). ―Food-related illness and death in the United States,‖ Emerging
Infectious Diseases, 5(5): 607-625.
Melad K A (2002). : Evaluation of ground water pollution with waste water
microorganisms in Gaza Strip, Palestine. Ain Shams University, Cairo, Egypt.
Melad K A (2002). : Evaluation of ground water pollution with wast water
microorganisms in Gaza Strip ,Palestine. Ain Shams University, Cairo, Egypt.
Metcalf and Eddy Inc. (2000). Integrated Aquifer Management Plan: Final Report. Gaza
Coastal Aquifer Management Program, USAID Contract No. 294-C-00-99-00038-00.
Miller, R. L.; Bradford, W. L.; Peters, N. E. (1988). Specific conductance: theoretical
considerations and application to analytical quality control; U. S. Geol. Surv. Water-
Supply Pap. 2311.
Ministry of National Economy, (2011). .Department of Industrial Development,Detect
registration of factories and manufacturing facilities in the Gaza Strip
Mitchell, R.J., Babcock, R.S., Gelinas, S., Nanus, L., Stansey, E., (2003). Nitrate
distribution and sources identification in the Abbotsford-Sumas aquifer, Northwestern
Washington State. Environmental Quality 32, 789–800.
Monjerezi M .Ngongondo C.(2012). Quality of Groundwater Resources in Chikhwawa,
Lower Shire Valley, Malawi. Water Qual Expo Health, 4:39–53
Morales EC.(1978). Chemical quality of deep well waters in Cavite, Philippines. Water
quality bulletin, 12(1):43 45.
Morin P V. Gauthier S S. and Block J C.(1999). Bacterial Resistance to Chlorine through
Attachment to Particles and Pipe Surfaces in Drinking Water Distribution systes. Biofilms
in the Aquatic Environment.Royal Socitey of Chemistry. Cambridge UK.
Morris, Christopher, ed.,(1992 ). Academic PressDictionary of Science and Technology,
Academic Press,.
Morris, R., and R. Levin, (1995). ―Estimating the incidence of waterborne infectious
disease related to drinking water in the United States,‖ In Reichard, et al., eds., Assessing

117
and managing health risks from drinking water contamination: Approaches and
applications, International Association of Hydrological Sciences Press, Great Britain.
Mosaferi M, M . Hajizadeh, Y. Ostadrahimi Ar, Md . Hashemi Asl ,A. (2007). Importance
of Water Quality Control in Food Safety, Case Study: Drinking, Dairy and Caning
Industries of East Azerbaijan ,Tabriz University of Medical Sciences , Vol. 29 No. 1.
Mullenborn, C., U. Steiner, M. Ludwig and E.C. Oerke.( 2008). Effect of fungicides on the
complex of Fusarium species and saprophytic fungi colonizing wheat kernels. European
Journal of Plant Pathology, 120(2): 157-166.
Nanan, D., White, F., Azam, I., Afsar, H. And Hozhabri, S., (2003). Evaluation of water,
sanitation, hygiene education intervention on diarrhea in northern Pakistan. Wld. Hlth. Org.
Bull. Geneva, 81:160 – 165.
National Health and Medical Research Council and Agriculture and Resource Management
Council of Australia and New Zealand. Commonwealth of Australia. (NHMRC-
ARMCANZ). (1996). Australian Drinking Water Guidelines. National Water Quality
Management Strategy.
National Institutes of Health.(NIH). (1994). Manual of Microbiologic Monitoring of
Laboratory Animals. 151-154.
National Research Council of Canada (NRCC). (1977). The effects of alkali halides in the
Canadian environment. Associate Committee on Scientific Criteria for Environmental
Quality, National Research Council of Canada, Ottawa (Publication NRCC No. 15019).
National Resources Council.(NRC).(2006). Drinking Water Distribution Systems:
Assessing and Reducing Risks. Prepublication copy. Washington D.C.
National Water Awareness Campaign.(NWAC). (2003). Water Pollution The Gaia Atlas of
Planet Management.
Nazim, S., S. Dawar, M. Tariq and M.J. Zaki. (2008). Quantitative estimation of mycoflora
in drinking water and fruit juices of Karachi. Pak. J. Bot., 40(3): 1263-1268.
Neimi RH, Heikkl MP, Lahti K, Kalso S, Neimel SI. (2001). Comparison methodsfor
determining the number of species and distribution of coliform bacteria. J Appl Microbiol.
90:850-8.
Nielsen, P. H., Thomsen, T. R., and Nielsen, J. L.(2004). ―Bacterial Composition of
Activated Sludge – Importance for Floc and Sludge Properties‖. Water Science and
Technology, Vol. 49, No. 10, 2004, 51-58.
Niewolak, S. (1998). "Total Viable Count and Concentration of Enteric BActeria in
Bottom Sediments from the Czarna Hancza River, Northeast Poland." Polish Journal of
Environmental Studies Vol. 7, No. 5, 293-306.
Nolan BT (2001). Relating nitrogen sources and aquifer susceptibility to nitrate in shallow
groundwater’s of the United States. Ground Water, 39, 290-299.

118
Okpokwasili, G.C., Akujobi, T.C.,(1996). Bacteriological indicators of tropical water
quality. Environ. Tax. Water Qual. Int. J. 11, 77–81.
Organisation for Economic Co-operation and Development OECD (2001), Environmental
Outlook,
Othman A. Rabeh S .Fayez M. Monib M. Hegazi N.(2012). El-Salam canal is a potential
project reusing the Nile Delta drainage water for Sinai desert agriculture: Microbial and
chemical water quality. Cairo University, Giza, Egypt.Journal of Advanced Research, 3,
99–108
Palestinian Central Bureau of Statistics,(2009). Environmental Survey for Health Care Centers, 2009. Ramallah- Palestine
Palestinian standard of drinking water (2005). Palestinian Standard No. 41. The Palestinian
Authority.
Palestinian Water Authority (PWA) and Coastal Municipalities Water Utility (CMWU)
(2009). database communications from Ahmed al Yaqoub and Rebhy Sheik, PWA,
February; Messerschmid: "Wassernotstand im Gazastreifen" in:
INAMO(informationssstelle naher & mittlerer osten)No.53,Fruehjahr (Jahrgang 14) p.
Palestinian Water Authority. (2007). study of water quality of drinking wells in Gaza Strip.
Palestinian Water Authority. (2002). ―Impact of the water crisis in the Gaza Strip‖.
Palestinian Water Authority Report. Palestinian Water Authority, Gaza.
Pandy, B.; Missra, S..; Yadav, S. and Sharma, P. (1998). An of Water Quality of Purnia in
Relation to its Impact on Public Health. Journal of environment and Pollution 5(4) P:259-263.
Pangborn RM and Bertolero LL. (1972). Influence of Temperature on Taste Intensity and
Degree of Liking of Drinking Water. Journal American Water Works Association. 64: 511-
515.
Panicker, S. and Ravindra, P. (1997). Avian Fauna and the Elevated Fecal Coliform Bacterial
Count in Aquatic Environment of Central Kerala. Indian Journal of Microbiology. 37, 133- 137
Paterson, R.R.M. and Lima, N.,( 2005). Fungal contamination of drinking water. In Water
Encyclopedia, Lehr, J., Keeley, J., Lehr, J. and Kingery III, T.B. (eds.), John Whiley and
Sons.
Paterson, R.R.M., Hageskal, G., Skaar, I. and Lima, N.,( 2009). Occurrence, problems,
analysis and removal of filamentous fungi in drinking water. In Fungicides: Chemistry,
Environmental. Impacts and Health Effects, De Costa, P. And Bezerra, P. (eds.), Nova
Science Publishers, Inc
Paterson, R.R.M., Venâncio, A. and Lima, N., (2007). Why do food and drink smell like
earth? In Communicating current research and educational topics and trends in applied
microbiology, Méndez-Vilas, A. (ed.), Formatex, 2007.
Pawlowicz, R.(2008). Calculating the conductivity of natural waters. Limnol. Oceanogr.:
Methods 6, 489–501.

119
Payment, P. (1999). Heterotrophic bacteria. In: AWWA manual of water supply practices.
AWWA M48. Waterborne pathogens. American Water Works Association, Denver, CO.
Penka D . Gatseva M. and Mariana D (2008). High-nitrate levels in drinking water may be
a risk factor for thyroid dysfunction in children and women living in rural Bulgarian areas
International Journal of Hygiene and Environmental Health ,211:555-559.
Pereira, V.J., Basîlio, M.C., Fernandes, D., Domingues, M., Paiva, J.M., Benoliel, M.J.,
Crespo, M.T. and San Romão, M.V., (2009). Occurrence of filamentous fungi and yeasts in
three different drinking water sources. Water Research, 43: 3813-3819.
Petrucio, M. M.; Medeiros, A. O.; Rosa, C. A. and Barbosa, F. A. R. B. (2005), Trophic
state and microorganisms community of major sub-basins of midle Rio Doce Basin,
Southeast Brasil. Brazilian Archives of Biology and Technology, 48, 625-633
Phelan DJ.(1987). Water levels, chloride concentrations, and pumpage in the coastal
aquifers of Delaware and Maryland. US Geological Survey, (USGS Water Resources
Investigations Report 87 4229; Dialog Abstract No. 602039).
Phiri, O; Mumba, P; Moyo, B H Z; and Kadewa, W(2005). Assessment of the impact of
industrial effluents on water quality of receiving rivers in urban areas of Malawi.
International Journal of Environmental Science and Technology (3): 237-244.
Pinto, B., Pierotti, R., Canale, G., and Reali, D. (1999). Characterization of faecal
streptococci as indicators of faecal pollution and distribution in the environment. Letters in
Applied Microbiology. 29(4):258-263
Pogoda, J.M., and S. Preston-Martin. (2001). "Maternal cured meat consumption during
pregnancy and risk of paediatric brain tumour in offspring: potentially harmful levels of
intake." Public Health Nutr. 4(2):183-189.
Pommepuy, M., J. F. Guillaud, E. Dupray, A. Derrien, F. Le Guyader, and M. Cormier.
(1992). Enteric Bacteria Survival Factors. Water Science Technology 25 (12):93-103.
Praet, E., Reuter, V., Gaillard, T., Vasel, J.-L., (1995). Bioreactors and biomembranes for
biochemical oxygen demand estimation. Trends Anal. Chem. 14 (7), 371–378.
Prevention and Control of Legionella.(2002).(including Legionnaires‘ Disease) in Food
Factories, Doc. 24.
Prévost, M., Rompré, A., Baribeau, H., Coallier, J., and Lafrance, P. (1997) Service lines:
their effect on microbiological quality. J. Am. Water Works Assoc., 89(7): 78–91.
Rajković, M.B.(2003) Neke neorganske supstance koje se mogu naći u vodi za piće i
posledice po zdravlje ljudi. Hem. Ind. (Beograd) 57, 1 .
Ranson I .Jincharadze E. and.Shatirishvili I. (2012). Case Study Involving schools in
developing community basedWater Safety Plans for small-scale water supply systems in4
villages of Chokhatauri Municipality, Georgia . World Water Day - 22 March
Region of Waterloo Public Health. (2007). Fact sheet: drinking water, sodium and your
health, in Waterloo Region. Retrieved from:
120
http://chd.region.waterloo.on.ca/web/health.nsf/0/802C4278C3E2C63885256B14006407A
4/$file/SodiumDrinkingWater_fs.pdf?openelement.
Rompré, A., Servais, P., Baudart, J., de-Roubin, M. & Laurent, P. (2002). Detection and
enumeration of coliforms in drinking water: current methods and emerging approaches.
Journal of Microbiological Method. 49: 31-54.
Royal, Weld. (2000). ―High and Dry.‖ Industry Week 249 (15): 24-30.
Rubenowitz E, Axelsson G, Rylander R.(1996). Magnesium in drinking water and death
from acute myocardial infarction. Am J Epidemiol. 143:456-62.
Rude, R.K. (1998). Magnesium deficiency: a cause of heterogenous disease in humans. J.
Bone Miner. Res. 13: 749-758.
Rusin P. A., Rose J. B., Gerba C. P.(1997). Health signify cance of pigmented bacteria in
drinking water. Wat. Sci. Tech. 35, 21.
Sami, H.M. and Ibrahim, S.J. (2001). Artificial infiltration of ground water .Sixth
International Water Technology conference , IWTC 2001,Alexandria, Egypt
Sanchez-Echaniz, J., et al. (2001). "Methemoglobinemia and consumption of vegetables in
infants." Pediatrics 107(5):1024-1028.
Santhi, C., Srinivasan, R., Arnold, J.G., Williams, J.R., (2006). A modeling approach to
evaluate the impacts of water quality management plans implemented in a watershed in
Texas. Environmental Modelling and Software 21 (8), 1141–1157.
Saris, N.-E.L., Mervaala, E., Karppanen, H., Khawaja, J.A., Lewenstam, A. (2000).
Magnesium. An update on physiological, clinical and analytical aspects. Clin. Chim. Acta
294: 1-26.
Schleifer, K.H., and Kilpper-Balz, R. (1984). Transfer of Streptococcus faecalis and
Streptococcus faecium to the genus Enterococcus nom. rev. as Enterococcus faecalis
comb. nov. and Enterococcus faecium comb. nov. International Journal of Systematic
Bacteriology. 34:31-34.
Scott, T.M., Salina, P., Portier, K.M., Rose, J.B., Tamplin, M.L., Farrah, S.R., Koo, A.,
Lukasik, J.,( 2003). Geographical variation in ribotype profiles of Escherichia coli isolates
from human, swim, poultry, beef and dairy cattle in Florida. Appl. Environ. Microbiol. 69
(2), 1089–1092.
Sebastian, A., et al. (1994). Improved mineral balance and skeletal metabolism in
postmenopausal women treated with potassium bicarbonate. New England Journal of
Medicine, Vol. 330, June 23, , pp. 1776-81
Servais, P.; Billen, G.; Laurent, P.; Lévi, Y. and Randon, G. (1992), Studies of BDOC and
bacterial dynamics in the drinking water distribution systems of the Northern Parisian
suburds. Revue des Sciences
Shaheen, N. (2004). Personal communication from N. Shaheen, Groundwater Management
Saskatchewan Watershed. Authority, October 6.
121
Shamrukh, M., Corapcioglu, M.Y., Hassona, F.A.A., (2001). Modeling the effect of
chemical fertilizers on ground water quality in the Nile Valley Aquifer, Egypt. Ground
Water 39 (1), 59–67.
Shash, M.S., M.M. Kamel, R.S. Al-Wasify and F.A. Samhan, (2010). Rapid detection and
enumeration of coliforms and Escherichia coli in River Nile using membrane filtration
technique. Environmental Biotechnology 6(1): 6-10.
Sheykhi V . Moore F. (2012). Geochemical Characterization of Kor River Water Quality,
Fars Province, Southwest Iran. Water Qual Expo Health,4:25–38
Shomar B, Yahya A, Müller G.(2004). Potential use of treated wastewater and sludge in
the agricultural sector of the Gaza Strip. J Clean Technol Environ Policy ;6:128–37.
Shomara B. Osenbrückb K. Yahyaa A. (2008). Elevated nitrate levels in the groundwater
of the Gaza Strip:Distribution and sources. environment 398:164–174
Shuval, H., Adin, A., Fattal, B., Rawitz, E. and Yekutiel, P. (1986). Wastewater irrigation
in developing countries: health effects and technical solutions. World Bank, Washington,
DC. Technical paper No.
Siebert, S., Burke, J. Faures, J., Frenken, K., Hoogeveen, J., D ll, P. and Portmann, T.
(2010). Groundwater use for irrigation – a global inventory. Hydrology and Earth System
Sciences., Vol. 14, pp. 1863–80.
Souza, A. D. G. and Tundisi, J. G. (2003), Water quality in watershed of Jaboatão River
(Pernambuco, Brazil): a case study. Brazilian Archives of Biology and Technology, 46,
711-721.
Stevens, M., N. Ashbolt, and D. Cunliffe.( 2001). Microbial Indicators of Water Quality:
An NHMRC Discussion Paper. National Health and Medical Research Council. Canberra,
Australia.
Stover CK, Pham XQ, Erwin AL et al. (2000).Complete genome sequence of
Pseudomonas aeruginosa PA01, an opportunistic pathogen. Nature .406: 959–964.
Stumm W. and Morgan J. J. (1981). Aquatic chemistry. New York: John Wiley and Sons.
Suffett, I.H., Corado, A., Chou, D., McGuire, M.J.M., Butterworth, S., (1996). AWWA taste
and odor survey. J. Am. Water Works Assoc. 88 (4), 168–180.
Sulieman A E . Yousif Y O . and El-Hardallou S B.(2010). Quality evaluation of some
Sebeel water samples in Khartoum state . Fourteenth International Water Technology
Conference .Cairo, Egypt, pp.853-862.
Tait, N.G., Davison, R.M., Leharne, S.A., Lerner, D.N., (2008). Borehole Optimisation
System (BOS) – a case study assessing options for abstraction of urban groundwater in
Nottingham, UK. Environmental Modelling and Software 23 (5), 611–621.
Tartory, (2009). Microbiological Assessment of Marketed Drinking Water in Gaza City,
Palestine . Al Aquds University –Palestine.
122
General Principles of Food Hygiene(2006) – Code of Practice provides general guidance
on this topic. (http://www.cfis.agr.ca/english/regcode/gpfh/gpfhc_e.shtml).
Topley, W.W.C. (1997) Topley and Wilson‘s Microbiology and Microbial Infections.
Balows, A.(Ed). 9th Edition, Arnold Publishers.
Trends in Food Science & Technology. (2005). see front matter q 2004 Published by
Elsevier Ltd. doi:10.1016/j.tifs.2004.10.002 . Desalination 16 162–165
UNEP, (2003). Desk Study on the Environment in the Occupied Palestinian Territories.
United Nations Environment Programme, Nairobi, Kenya.
United Nations Environment Programme Environmental (2009) Assessment of the Gaza
Strip following the escalation of hostilities ISBN: 978-92-807-3041-8 Job No.:
DEP/1190/GE.
United Nations World Water.(2012). Development Report 4Volume Published in 2012 by
the United Nations Educational, Scientific and Cultural Organization 7, place de Fontenoy,
75352 Paris 07 SP, France .
United States . Environmental Protection Agency. (2005). Health Water Series: Filtration
Facts. http://www.epa.gov/safewater/faq/pdfs/fs_healthseries_filtration.pdf.
United States Agency for Toxic Substances and Diseases Registry.( 2001). "Case Studies
in Environmental Medicine: Nitrate/Nitrite Toxicity."
http://www.atsdr.cdc.gov/HEC/CSEM/nitrate/docs/nitrate_nitrite.pdf.
United States Environmental Protection Agency. (1991). "Reregistration Eligibility
Decision: Inorganic Nitrate/Nitrite (Sodium and Potassium Nitrates)."
http://www.epa.gov/oppsrrd1/REDs/old_reds/4052red.pdf.
United States Environmental Protection Agency Ground Water and Drinking Water.
(2006). "Consumer Factsheet on: Nitrates/Nitrites." http://www.epa.gov/safewater/dwh/c-
ioc/nitrates.html.
Van Burik, J. A. and Magee, P. T. (2001), Aspects od fungal pathogenesis en humans.
Annual Review of Microbiology., 55, 743-772.
Vasanthavigar M, Srinivasamoorthy K, Rajiv Ganthi R, Vijayaraghavan K, Sarma VS
(2010 ). Characterisation and quality assessment of groundwater with a special emphasis
on irrigation utility: Thirumanimuttar Sub-basin, Tamil Nadu, India. Arabian Journal of
Geosciences 1–14.
Viero A F .(2002). Removal of hardness and COD from retanning treated effluent by
membrane process . Desalination ,149:145-149.
Viessman Jr. and Hammer. (1993). Water Supply and Pollution Control (5th
Edition).
Chapter 9, pg. 312. Harper Collins College Publishers. New York, NY.

123
Volkmer, B.G., et al. (2005). "Influence of nitrate levels in drinking water on urological
malignancies: a community-based cohort study." BJU.Int 95(7):972-976.
Warburton DW, Harrison B, Crawford C, Foster R, Fox C, Gour L et al.( 1998). A further
review of the microbiological quality of bottled water sold inCanada: 1992-1997 survey
results. Int J Food Microbiol.39: 221-6.
Warburton, DW. and Peterkin, PI. (1993). Enumeration of Pseudomonas aeruginosa in
prepacked ice and water in sealed containers by the hydrophobic grid membrane
filter(HGMF)technique(MFLP-61B).In: Compendium of Analytical Methods (vol 3),
Polyscience Publication Inc., Montreal, Canada.Aquachem.
http://www.aquachem.ie/ser_analytical.html
Warburton, DW., Dodds, KL., Burke, R., Johnston, R. and Laffey, PJ. (1992). A review of
the microbiological quality of bottled water sold in Canada between 1981 and 1989. Can. J.
Microbiol., 38, 12 -19.
Ward, M.H., et al. (2000). "Dietary exposure to nitrite and nitrosamines and risk of
nasopharyngeal carcinoma in Taiwan." Int.J.Cancer 86(5):603-609.
Warris, A., Gaustad, P., Meis, J.F.G.M., Voss, A., Verweij, P.E. and Abrahamsen, T.G.
(2001). Recovery of filamentous fungi from water in a paediatric bone marrow
transplantation unit. J Hosp Infect 47, 143–148.
Warris, A., Voss, A., Abrahamsen, T.G. and Verweij, P.E. (2002). Contamination of
hospital water with Aspergillus fumgatus and other moulds. Clin Infect Dis 34, 1159–1160.
Water Saving factsheet .(2008). Contact Ai Group‘s Energy and Sustainable Business
Helpdesk on 1300 733 752 or at [email protected] or visit the Ai Group
website at www.aigroup.com.au.(2008).
West Bank And Gaza (2009). Assessment Of Restrictions On Palestinian Water Sector
Development Middle East and North Africa Region Sustainable DevelopmentSector Note
Report No. 47657-GZ.
Whitman, Richard L., Nevers, Meredith B., Korinek, Ginger C. and Byappanahall,
Muruleedhara N. (2004)."Solar and Temporal Effects on Escherichia coli Concentration at
a Lake Michigan No. 7, 4276-4285.Swimming Beach." Applied and Environmental
Microbiology Vol. 70,
World Health Organization. WHO (1980). Guidelines on health aspects of water
desalination. ETS/80.4. World Health Organization, Geneva.
World Health Organization. WHO. (2003). World Health Report .( 2003). Shaping our
future. World Health Organisation. ISBN 9241562439 http://www.who.int/whr/en/
Wolf, J., Beusen, A.H.W., Groenendijk, P., Kroon, T., Ro¨ tter, R., van Zeijts, H., (2003).
The integrated modeling system STONE for calculating nutrient emissions from
agriculture in the Netherlands. Environmental Modelling and Software 18 (7), 597–617.
Wolfe, A.H., Patz, J.A., (2002). Reactive nitrogen and human health: acute and longterm
implications. Ambio 31 (2), 120–125.

124
Workshop ( 2006). Applied techniques for water and wastewater quality control, Prof.
Basheir Mohammed Elhassan, Nationl center for research environment and natural
resource reasrch institute ,21st -26
th January , Khartoum ,Sudan, 236p.
World Health Organization(WHO). (2008). Guidelines for drinking-water quality.
Geneva, World Health Organization. First And Second Addenda to Third Edition Volume 1
Recommendations
World Health Organization, (WHO). (2008). Guidelines for drinking water quality
(electronic resource): incorporating 1st and 2nd addenda. Vol. 1, Recommendations - 3rd
ed.; World Health Organization,Geneva,
World Health Organization , (WHO). (1986). Working Group. Health impact of acidic
deposition. Science of the total environment, 52:157-187.
World Health Organization . (WHO). (1997) Guidelines for drinking water quality. Vol
3. 2nd ed. Surveillance and control of community supplies. Geneva:WHO .
World Health Organization. (WHO). (2004). Guidelines for drinking-water quality, 3rd
ed., World Health Organization, Geneva.
World Health Organization. (WHO). (2004). Guidelines for Drinking water quality,
Volume 1: 3rd edition, WHO Press, Switzerland.
World Health Organization. (2006). "International Program on Chemical Safety,
Environmental Health Criteria 5: Nitrates, Nitrites, and N-Nitroso Compounds."
World Health Organization. (WHO). (2006). Guidelines for Drinking water quality,
Volume 1: 3rd edition, WHO Press, Switzerland.
World Health Organization. (WHO). (2002). Heterotrophic Plate Count Measurement in
Drinking Water Safety Management. Report of an Expert Meeting.Distribution System
Indicators of Drinking Water Quality
World Health Organization. (WHO). (1980). Guidelines on health aspects of water
desalination. ETS/80.4. World Health Organization, Geneva.
World Health Organization. (WHO). (2003). World Health Report .( 2003). Shaping our
future. World Health Organisation. ISBN 9241562439 http://www.who.int/whr/en/
World Water Assessment Programme (WWAP).( 2009). Waterin a Changing World.
World Water Development Report 3. Paris/London, UNESCO Publishing/Earthscan.
Wujie . Zhufei and Xujing (2011). The Influence of Water Quality on Food Quality and
the Treatment of Water for Food Processing. Procedia Environmental Sciences 10 : 2671
– 2676
Yagoub and Ahmed (2010). Microbiological evaluation of the quality of tap water
distributed at Khartoum State. Science Alert.
125
Yang, Ch.Y., Cheng, M.F., Tsai, S.S., Hsieh, Y.L. (1998). Calcium, magnesium, and
nitrate in drinking water and gastric cancer mortality. Japanese journal of cancer research.
89: 124-130.
Yang, Ch.Y., Chiu, H.F. (1999 ). Calcium and magnesium in drinking water and risk of
death from rectal hypertension. American Journal of Hypertension. 12: 894-899.
Yassin M M. Amr S S. and Al-Najar H M.(2006). Assessment of microbiological water
quality and its relation to human health in Gaza Governorate, Gaza Strip . Public Health
120:pp.1177-87
Zaitlina, B and Watson S,B. (2006). Actinomycetes in relation to taste and odour in
drinking water: Myths, tenets and truths. Water Research 40:1741-1753.
Zielina M .(2010). Measurement of suspended particles in water filtration . Fourteenth
International Water Technology Conference, Cairo, Egypt,pp.105-113.
Zoeteman BCJ.(1980). Sensory assessment of water quality. New York, NY, Pergamon
Press.

126


