Microbial Food-Web Drivers in Tropical Reservoirs · Microbial Food-Web Drivers in Tropical...
16
MICROBIOLOGY OF AQUATIC SYSTEMS Microbial Food-Web Drivers in Tropical Reservoirs Carolina Davila Domingues 1 & Lucia Helena Sampaio da Silva 1 & Luciana Machado Rangel 1 & Leonardo de Magalhães 1 & Adriana de Melo Rocha 2 & Lúcia Meirelles Lobão 3 & Rafael Paiva 3 & Fábio Roland 3 & Hugo Sarmento 4 Received: 3 February 2016 /Accepted: 13 November 2016 # Springer Science+Business Media New York 2016 Abstract Element cycling in aquatic systems is driven chief- ly by planktonic processes, and the structure of the planktonic food web determines the efficiency of carbon transfer through trophic levels. However, few studies have comprehensively evaluated all planktonic food-web components in tropical re- gions. The aim of this study was to unravel the top-down controls (metazooplankton community structure), bottom-up controls (resource availability), and hydrologic (water resi- dence time) and physical (temperature) variables that affect different components of the microbial food web (MFW) car- bon stock in tropical reservoirs, through structural equation models (SEM). We conducted a field study in four deep Brazilian reservoirs (Balbina, Tucuruí, Três Marias, and Funil) with different trophic states (oligo-, meso-, and eutro- phic). We found evidence of a high contribution of the MFW (up to 50% of total planktonic carbon), especially in the less- eutrophic reservoirs (Balbina and Tucuruí). Bottom-up and top-down effects assessed through SEM indicated negative interactions between soluble reactive phosphorus and phototrophic picoplankton (PPP), dissolved inorganic nitro- gen, and heterotrophic nanoflagellates (HNF). Copepods pos- itively affected ciliates, and cladocerans positively affected heterotrophic bacteria (HB) and PPP. Higher copepod/ cladoceran ratios and an indirect positive effect of copepods on HB might strengthen HB-HNF coupling. We also found low values for the degree of uncoupling (D) and a low HNF/ HB ratio compared with literature data (mostly from temperate regions). This study demonstrates the importance of evaluat- ing the whole size spectrum (including microbial compart- ments) of the different planktonic compartments, in order to capture the complex carbon dynamics of tropical aquatic ecosystems. Keywords Carbon stock . Structure equation models . Grazing . Degree of uncoupling Introduction Inland waters play an important role in the global carbon cycle, being extremely active in the transport, mineralization, and storage of carbon [1]. Tropical freshwaters are particularly im- portant for global biogeochemical cycles, as they are responsi- ble for approximately 60% of the total carbon emissions from inland waters [2]. In addition to enhanced carbon emissions associated with high temperatures, low-latitude lakes and res- ervoirs usually stratify for longer periods, and hypolimnetic waters remain warm, creating optimal conditions for anoxia [3], and develop high concentrations of CO 2 and CH 4 that may later enter the atmosphere [4, 5]. A recent study reported that carbon emissions in tropical reservoirs were negatively correlated with age and latitude, and these emissions were particularly high in the tropical Amazon region [6]. Electronic supplementary material The online version of this article (doi:10.1007/s00248-016-0899-1) contains supplementary material, which is available to authorized users. * Carolina Davila Domingues [email protected] 1 Museu Nacional, Laboratório de Ficologia, Universidade Federal do Rio de Janeiro, Rio de Janeiro 20940-040, Brazil 2 Laboratório de Limnologia, Universidade Federal do Rio de Janeiro, Rio de Janeiro 21940-590, Brazil 3 Laboratório de Ecologia Aquática, Universidade Federal de Juiz de Fora, Juiz de Fora, Minas Gerais 36036-900, Brazil 4 Departamento de Hidrobiologia, Laboratório de Processos Microbianos e Biodiversidade, Universidade Federal de São Carlos, São Carlos 13565-905, Brazil Microb Ecol DOI 10.1007/s00248-016-0899-1
Transcript of Microbial Food-Web Drivers in Tropical Reservoirs · Microbial Food-Web Drivers in Tropical...
MICROBIOLOGY OFAQUATIC SYSTEMS
Microbial Food-Web Drivers in Tropical Reservoirs
Carolina Davila Domingues1 & Lucia Helena Sampaio da Silva1 &
Luciana Machado Rangel1 & Leonardo de Magalhães1 & Adriana de Melo Rocha2 &
Lúcia Meirelles Lobão3 & Rafael Paiva3 & Fábio Roland3 & Hugo Sarmento4
Received: 3 February 2016 /Accepted: 13 November 2016# Springer Science+Business Media New York 2016
Abstract Element cycling in aquatic systems is driven chief-ly by planktonic processes, and the structure of the planktonicfood web determines the efficiency of carbon transfer throughtrophic levels. However, few studies have comprehensivelyevaluated all planktonic food-web components in tropical re-gions. The aim of this study was to unravel the top-downcontrols (metazooplankton community structure), bottom-upcontrols (resource availability), and hydrologic (water resi-dence time) and physical (temperature) variables that affectdifferent components of the microbial food web (MFW) car-bon stock in tropical reservoirs, through structural equationmodels (SEM). We conducted a field study in four deepBrazilian reservoirs (Balbina, Tucuruí, Três Marias, andFunil) with different trophic states (oligo-, meso-, and eutro-phic). We found evidence of a high contribution of the MFW(up to 50% of total planktonic carbon), especially in the less-eutrophic reservoirs (Balbina and Tucuruí). Bottom-up andtop-down effects assessed through SEM indicated negative
interactions between soluble reactive phosphorus andphototrophic picoplankton (PPP), dissolved inorganic nitro-gen, and heterotrophic nanoflagellates (HNF). Copepods pos-itively affected ciliates, and cladocerans positively affectedheterotrophic bacteria (HB) and PPP. Higher copepod/cladoceran ratios and an indirect positive effect of copepodson HB might strengthen HB-HNF coupling. We also foundlow values for the degree of uncoupling (D) and a low HNF/HB ratio comparedwith literature data (mostly from temperateregions). This study demonstrates the importance of evaluat-ing the whole size spectrum (including microbial compart-ments) of the different planktonic compartments, in order tocapture the complex carbon dynamics of tropical aquaticecosystems.
Keywords Carbon stock . Structure equationmodels .
Grazing . Degree of uncoupling
Introduction
Inland waters play an important role in the global carbon cycle,being extremely active in the transport, mineralization, andstorage of carbon [1]. Tropical freshwaters are particularly im-portant for global biogeochemical cycles, as they are responsi-ble for approximately 60% of the total carbon emissions frominland waters [2]. In addition to enhanced carbon emissionsassociated with high temperatures, low-latitude lakes and res-ervoirs usually stratify for longer periods, and hypolimneticwaters remain warm, creating optimal conditions for anoxia[3], and develop high concentrations of CO2 and CH4 thatmay later enter the atmosphere [4, 5]. A recent study reportedthat carbon emissions in tropical reservoirs were negativelycorrelated with age and latitude, and these emissions wereparticularly high in the tropical Amazon region [6].
Electronic supplementary material The online version of this article(doi:10.1007/s00248-016-0899-1) contains supplementary material,which is available to authorized users.
* Carolina Davila [email protected]
1 Museu Nacional, Laboratório de Ficologia, Universidade Federal doRio de Janeiro, Rio de Janeiro 20940-040, Brazil
2 Laboratório de Limnologia, Universidade Federal do Rio de Janeiro,Rio de Janeiro 21940-590, Brazil
3 Laboratório de Ecologia Aquática, Universidade Federal de Juiz deFora, Juiz de Fora, Minas Gerais 36036-900, Brazil
4 Departamento de Hidrobiologia, Laboratório de ProcessosMicrobianos e Biodiversidade, Universidade Federal de São Carlos,São Carlos 13565-905, Brazil
Microb EcolDOI 10.1007/s00248-016-0899-1

The mechanisms that lead to these high emissions in trop-ical reservoirs are complex, as they involve multiple factorsincluding stratification, primary production, community res-piration, nutrient loading, food-web structure, and others. Inlarge reservoirs, cycling of the main elements is driven chieflyby the planktonic food web, which can regenerate and transferthese elements to higher trophic levels [7, 8]. The food-webstructure may influence and alter carbon transfer and emis-sions in freshwater systems [9–11]. Tropical aquatic systemshave some particular food-web configurations, but compre-hensive studies on all planktonic food-web components areextremely rare [12, 13].
Aquatic food webs in warm lakes are expected to have asmaller biomass of large-bodied zooplankton compared totemperate systems because high temperatures affect organismphysiology either directly or indirectly by increasing fish pre-dation on zooplankton [14–17]. In tropical regions, omnivo-rous fish are more frequent and high biomasses of small-sizedand young-of-the-year fish prevail throughout the year,exerting higher predation pressure on large-bodied zooplank-ton, especially large cladocerans [16, 18]. Consequently, zoo-plankton in warm lakes is expected to be small-bodied, with ahigh proportion of protozooplankton (ciliates andnanoflagellates), which might impact bacterioplanktonthrough high grazing pressure [12, 19]. Metazooplanktoncomposition has strong direct and indirect (cascading) effectson the microbial food web (MFW) [20]. Large daphnids arekeystone species in temperate systems, as they alter the MFWthrough their large impact on protozooplankton [21]. A char-acteristic of tropical aquatic food webs is the absence (or gen-erally low abundance) of large daphnids [22].
Among the components of the microbial food web,protozooplankton (ciliates and heterotrophic nanoflagellates)is a key compartment, contributing to carbon and energy fluxbecause these plankters can grow faster than phytoplankton[23, 24]. Heterotrophic nanoflagellates (HNF) play a particu-larly important role in aquatic microbial communities throughpredation on the smaller size fractions of planktonic commu-nities (phototrophic picoplankton—PPP, and heterotrophicbacteria—HB), channeling picoplanktonic production to thehigher trophic levels [23]. One way of measuring this impactis to study the degree of uncoupling (D) between HNF andtheir prey [25]. Previous studies have reported that rotifers andsmall cladocerans efficiently control HNF populations, andnegatively affect the degree of coupling between HNF andthe bacterial community [26–28]; while copepods can en-hance the efficiency of the HB-HNF coupling mechanisms[20]. A recent study comparing tropical and temperate HNF-HB abundance showed lower numbers in tropical systems,and the lack of coupling was explained by predation onHNF by ciliates and small cladocerans [29].
In addition, despite the indications of a weak [30] or absent[29] relationship between HB abundance and chlorophyll-a in
different tropical freshwater systems, a recent study in largeAfrican lakes reported a high degree of HB—primary produc-tion coupling, with a high percentage of dissolved primaryproduction (extracellular organic carbon released by phyto-plankton) [31]. Moreover, a recent meta-analysis revealed thatbacterial remineralization rates per bacterial production unit intropical freshwaters are at least twofold higher than in temper-ate regions [32]. For these reasons, it is important to elucidatethe strength of the MFW in tropical aquatic systems, particu-larly its contribution to biomass stocks and fate. Since micro-bial metabolism has major impacts on carbon pathways andultimately on gas exchange with the atmosphere [12, 32],microbes might comprise an important fraction of the plank-tonic carbon stock in these systems. Trophic status is also animportant characteristic of the system that might influenceplanktonic trophic structure and can determine if MFW is acarbon sink or link [21, 33, 34]. In a trophic-state gradient, allplanktonic components should increase their biomass inmore-eutrophic systems [33], while the contribution of theMFW to total planktonic carbon should decrease [21].
The aim of this study was to elucidate the roles of top-down(i.e., metazooplankton community structure), bottom-up (re-source availability), and abiotic variables as controls on dif-ferent microbial food-web compartments in tropical reser-voirs. We monitored key components of the planktonic micro-bial and classical food webs in four tropical reservoirs withdifferent metazooplankton community structures, covering arange of trophic states (productivity gradient), and analyzedfood-web interactions using structural equation models(SEM). We hypothesized that the microbial food-web compo-nents contribute considerably to the carbon pool in these trop-ical systems, especially in the less-productive ones, whereheterotrophy is expected to predominate over autotrophy.
Material and Methods
Study Sites
Sampling was conducted in four deep tropical hydroelectricreservoirs in Brazil (Fig. 1), with different morphologies, hy-drodynamics, and trophic states (Table 1), in three differentbiomes: Amazonia (Balbina, Tucuruí), Cerrado (Três Marias),and Atlantic Forest (Funil). The Amazonian reservoirs aresituated in different regions of northern Brazil: BalbinaReservoir is located in a mainly forested area of the centralAmazon (79.0% [35]; Table 1) and is fed by a black-waterriver (Uatumã basin), while Tucuruí is located in the easternAmazon, fed by a clear-water river (Tocantins/Araguaia ba-sin). The drainage basin surrounding Tucuruí is extensivelydeforested, with vast agricultural areas (51.6% [35], Table 1).Três Marias Reservoir is located on the Central BrazilianPlateau (São Francisco basin) where the main vegetation is
C. D. Domingues et al.

the Cerrado (Brazilian savanna) domain, which, however, hasalso been extensively altered for agriculture (70.5% [35],Table 1). Funil Reservoir in southeastern Brazil drains adensely populated area (Paraíba do Sul basin, 5.6% urban area[35], Table 1), receiving a high nutrient load [36]. This is aeutrophic reservoir with recurrent intense blooms of thecyanobacteria Dolichospermum circinale (Rabenhorst exBornet et Flahault) Wacklin, Hoffmann et Komárek,Cylindrospermopsis raciborskii (Woloszyńska) Seenayya etSubba Raju, and Microcystis aeruginosa (Kützing) Kützing[36, 37]. Balbina, Tucuruí, and Três Marias are large dendriticreservoirs, while Funil has a more-compact flooded area. TheAmazonian reservoirs Balbina and Tucuruí are of nearly the
same age of impoundment (∼30 years), while Três Marias andFunil were established ∼50 years ago, and the four reservoirsare monomictic with a hypoxic hypolimnion [36, 38–40].
Sampling and Data Analysis
Physical, chemical, and biological variables of the fourwaterbodies were recorded at three sampling points of thereservoirs (including one point near the dam), during fourperiods of the year in 2011 and 2012, totaling 12 measure-ments per reservoir. The sampling period comprised the hy-drological pulses in the Amazonian Balbina and Tucuruí res-ervoirs, and two rainy and two dry seasons in Três Marias and
Table 1 General features of thetwo Amazonian (Balbina andTucuruí) and two non-Amazonian(Três Marias and Funil) reservoirs
Reservoir Balbina Tucuruí Três Marias Funil
Biome Amazon Amazon Cerrado Atlantic ForestLatitude 01°52′19.9″N 03°51′20.9″S 18°20″S 22°31′42.5″SLongitude 059°28′49.7″W 049°37′23.4″W 045°25″W 044°33′49.2″WState Amazonas Pará Minas Gerais Rio de JaneiroMain river Uatumã Tocantins/Araguaia São Francisco Paraíba do SulYear of impoundment 1987 1984 1962 1969Maximum depth (m) 51 721 752 703
Mean air temperature (°C) 26.4 26.9 22.8 18.4Annual precipitation (mm) 2510 2290 1248 1487Watershed area (km2) 70,6004 758,0001 50,7322 16,8003
Reservoir surface area (km2) 23005 24301 10406 403
Volume (km3) 17.55 45.51 15.3 0.93
Generated electricity (MW) 2507 83707 3967 1807
Land use (%)8
Forest 79 12.2 8.2 25.2Agriculture 1.3 51.6 70.5 62.5Urban 0.0 0.1 1.2 5.6
Fish species Piscivores9 Piscivores9 Piscivores10 Detritivores, omnivores,pscivores11
1, [41]; 2, Brito unpublished data; 3, [42]; 4, [43]; 5, [44]; 6, [45]; 7, [46]; 8, [35]; 9, [47]; 10, [48]; 11, [49]
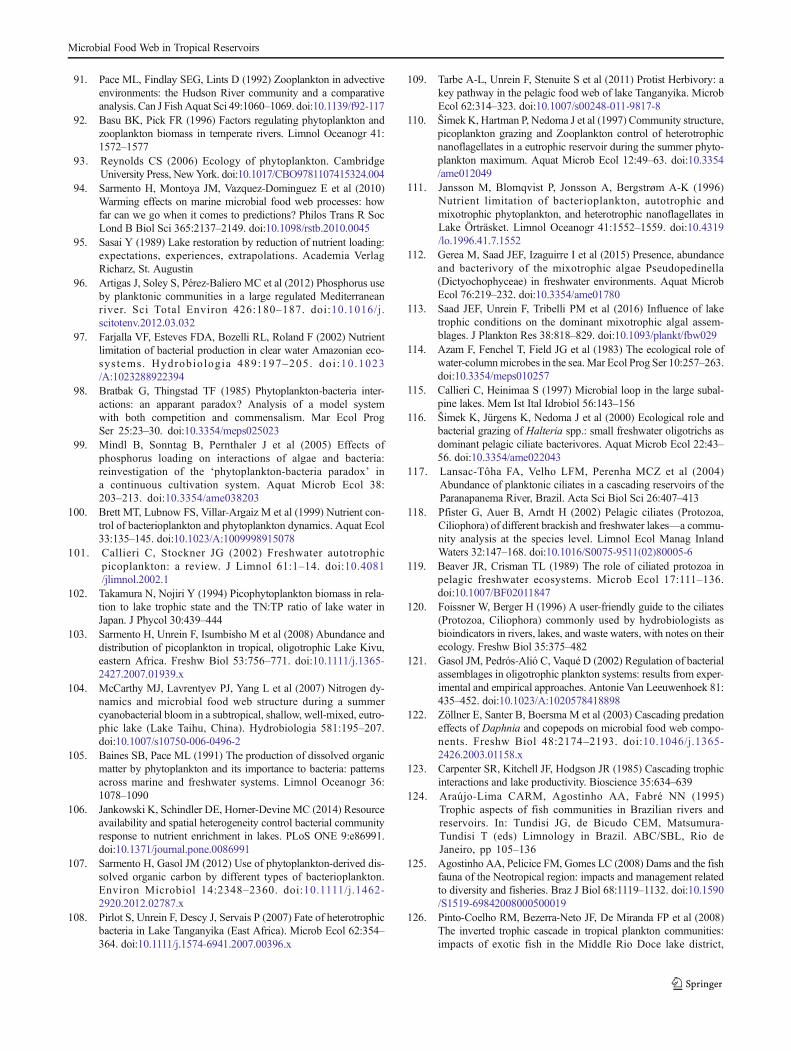
Fig. 1 Map and location of theAmazonian Balbina (a) andTucuruí (b) reservoirs, and thenon-Amazonian Três Marias (c)and Funil (d) reservoirs. Dotsindicate locations of samplingstations. Dams are indicated byarrows
Microbial Food Web in Tropical Reservoirs

Funil reservoirs.Water temperature (WT) and pHwere obtain-ed with a YSI 6920 multiparameter probe (Yellow SpringsInstruments, USA). The euphotic zone (Zeu) was measuredas 2.7× Secchi disk extinction depth [50]. Integrated samplesfrom the surface were taken using a 1.5-m-long tube sampler.Total phosphorus (TP), total nitrogen (TN), soluble reactivephosphorus (SRP), dissolved inorganic nitrogen (DIN), anddissolved organic carbon (DOC) were also measured fromthe integrated samples. TP and TN were estimated from un-filtered water samples, while DOC, SRP, and DIN (the sum ofammonium, nitrate, and nitrite) were filtered through glass-fiber filters (GF/C Whatman) and analyzed according toWetzel and Likens [51]. The reservoir trophic states wereassessed based on subsurface median concentrations of TP,according to Nürnberg [52]. Water residence time (RT, indays) was estimated considering the inflow discharge andthe reservoir volume on daily basis, from data provided bythe Brazilian National Electricity Regulatory Agency(ANEEL). The RT for each sampling period was calculatedas the mean during the preceding month.
Water samples for picoplankton (PPP and HB),protozooplankton (HNF and ciliates), and phytoplankton forquantitative analysis were collected using the same tube sam-pler, while samples of metazooplankton (rotifers, cladocerans,calanoid copepods, cyclopoid copepods, copepodites, andnauplii) were collected by vertical hauls of a plankton net with50-μm mesh, in the euphotic zone. For phytoplankton andciliates, 100-mL samples were preserved with neutralLugol’s and acid Lugol (2% final concentration) iodine solu-tions, respectively. For PPP and HNF, 100-mL samples werepreserved with 10% glutaraldehyde (1% final concentration),and for HB, 10-mL samples were preserved in formalin at 2%final concentration. The metazooplankton 100-mL concen-trates were preserved in 4% buffered formaldehyde.
Phytoplankton (Phyto) and ciliate (Cili) populations wereconcentrated by sedimentation and enumerated in randomfields [53] for phytoplankton under an inverted microscope(Zeiss Oberkochen Axiovert 10, Carl Zeiss, Germany) at×400 magnification [54], and all of a 10-mL chamber inphase-contrast illumination for ciliates. Phytoplankton taxo-nomic classes are according to Van den Hoeck et al. [55],except for cyanobacteria [56, 57]. Phytoplankters were iden-tified to species as far as possible, according to appropriateliterature, and ciliates were assigned to morphotypes. In gen-eral, at least 30 cells of each species or morphotype weremeasured directly under the microscope. Biovolume(mm3 L−1) for the two communities was estimated by multi-plying the density of each species by the mean volume of itscells [58]. The carbon content (μg C L−1) for each planktoncomponent was estimated. The carbon content of phytoplank-ton species was obtained from the biovolume through a con-version formula [59], and that of ciliates through a conversionfactor of 140 fg μm−3 [60] after a correction factor of 1.4 [61].
For PPP and HB enumeration, 10 and 2 mL, respectively,were filtered through 0.2 μm black polycarbonate filters(Millipore) and stained with DAPI (4,6 diamidino-2-phenylindole) [62]. The filters were mounted on microscopeslides with immersion oil, and the picoplankton abundancewas estimated with the aid of an epifluorescence microscope(Zeiss Axio Observer A1, Carl Zeiss, Germany) at ×1000magnification, by counting 200 cells, or 30 random fields incases of low abundance [63, 64]. The blue excitation lightfilter set (EX BP 450-490, BS FT 510, EM LP 515) was usedto quantify picocyanobacteria and picoeukaryotic cells, whilethe green excitation light filter set (H 546/12 BS FT 580 EMLP 590) was used only for picocyanobacteria. HBwere visibleunder ultraviolet (UV) excitation (filter set: EXBP 365/12, BSFT 395 EM LP 397). PPP cells were measured directly underan epifluorescence microscope; the biovolume was calculatedfrom the geometric formula for a prolate spheroid or sphere,and the carbon content was estimated using a conversion fac-tor of 200 fg C μm−3 [65]. HB biomass was estimated fromapplication of the major and minor axis measurements of cellsin the formula proposed by Massana et al. [66], and biomassconversion according to Norland [67].
For HNF enumeration, 10 mL was filtered through 0.8 μmpolycarbonate filters (Millipore) stained with DAPI, and theresidue was mounted on microscope slides with immersionoil. The cells were counted with an epifluorescence micro-scope (Zeiss Axio Observer A1, Carl Zeiss, Germany) at×1000 magnification using the UV filter set; the photosynthet-ic flagellates were distinguished with the blue and green filtersets. HNF cells were measured directly under theepifluorescence microscope. Biovolume was calculated fromgeometric formulas, using a conversion factor of 220 fgC μm−3 [68] for the carbon content.
The metazooplankton community (Metazoo) was enumer-ated using either a Sedgwick-Rafter chamber under a micro-scope (for rotifers, nauplii, and cladocerans) or in open cham-bers under a stereomicroscope (for copepodites and adult co-pepods). At least 250 individuals and 100 of the more abun-dant species were counted. Densities (individuals per liter)were estimated based on the volume of water that passedthrough the net. The organisms were classified in largegroups: rotifers, cladocerans, calanoid and cyclopoid cope-pods, nauplii, and copepodites. Cladoceran and copepod bio-masses were measured from the dry weight of 20 individualsafter they were oven-dried for 24 h at 60 °C. Rotifer biomasswas estimated from the median weight of each species asgiven in the literature [51], multiplied by its density in eachsample [51], and the biomass of nauplii according to allome-tric formulas [69]. The carbon content (μg C L−1) of allmetazooplanktonic components was estimated as 50% ofdry weight [70]. In order to determine if the reservoirs haddifferent metazooplanktonic community structures, and theirinfluence on microbial food-web components (especially on
C. D. Domingues et al.
HNF and HB) and/or phytoplankton, we calculated the ratioof copepods to cladocerans (COP/CLAD) for each reservoir.
Statistical Analysis
Variables were tested for differences among reservoirs usingone-way ANOVA and a post hoc Tukey test (p < 0.05). Weassumed marginally significant p values between 0.05 and0.07. Data were Log(x + 1) transformed to achieve a normaldistribution. We used SEM to detect direct and indirect effectsof bottom-up and top-down factors for planktonic componentsand abiotic variables (Online Resource Table A1). Biotic com-ponents and abiotic variables in each sampling were used inthe analysis. The goodness-of-fit of the model was testedusing a Chi-square test and Bollen-Stine bootstrap, due tothe small sample size (n = 48, [71]). A non-significant chi-square test indicates that there is no deviation between theobserved covariance matrix and the proposed model inSEM, and the model can be accepted. We used the followingindexes to decide if the model showed a good fit: (i) a RootMean Square Error of Approximation (RMSEA) equal to orhigher than 0.07 [72]; (ii) Standardized Root Mean SquareResidual (SRMR) less than 0.05; (iii) Comparative Fit Index(CFI) equal to or higher than 0.96; and (iv) Tucker-LewisIndex (TLI) equal to or lower than 0.96 [73]. Akaike’sInformation Criterion (AIC) was used to determine the mostparsimonious model. The SEM graphs were constructed usingCytoScape Software. The ANOVA and SEM analyses wereperformed with the Blavaan^ package ([74], http://www.jstatsoft.org/v48/i02/) in R 3.0.3 (RDevelopment Core Team).
We calculated the degree of uncoupling (D) between HB-HNF according to specific empirical models from the litera-ture (below), predicted by a model for observed HB abun-dance (cell mL−1; equation 6 in [24]):
D ¼ −2:55þ 1:04# Log HBð Þ−Log HNFð Þ
Results
Water Residence Time and Abiotic Variables
The median water residence times (RT) were significantlyhigher in Balbina (662 days) and Três Marias (410 days;F(3,44) = 47.31, p < 0.0001) than in Tucuruí (77 days) andFunil (34 days) reservoirs (Table 2). Water temperature(WT) was significantly higher (F(3,42) = 74.18, p < 0.0001) inthe Amazonian reservoirs (Balbina, median = 30.8 °C; andTucuruí, 30.2 °C), compared to Três Marias and Funil, and aslightly acidic median pH (6.3) was recorded in Balbina. DOCconcentrations were also significantly higher in Funil(median = 5.33 mg L−1, F(3,41) = 10.23, p < 0.0001; Table 2).
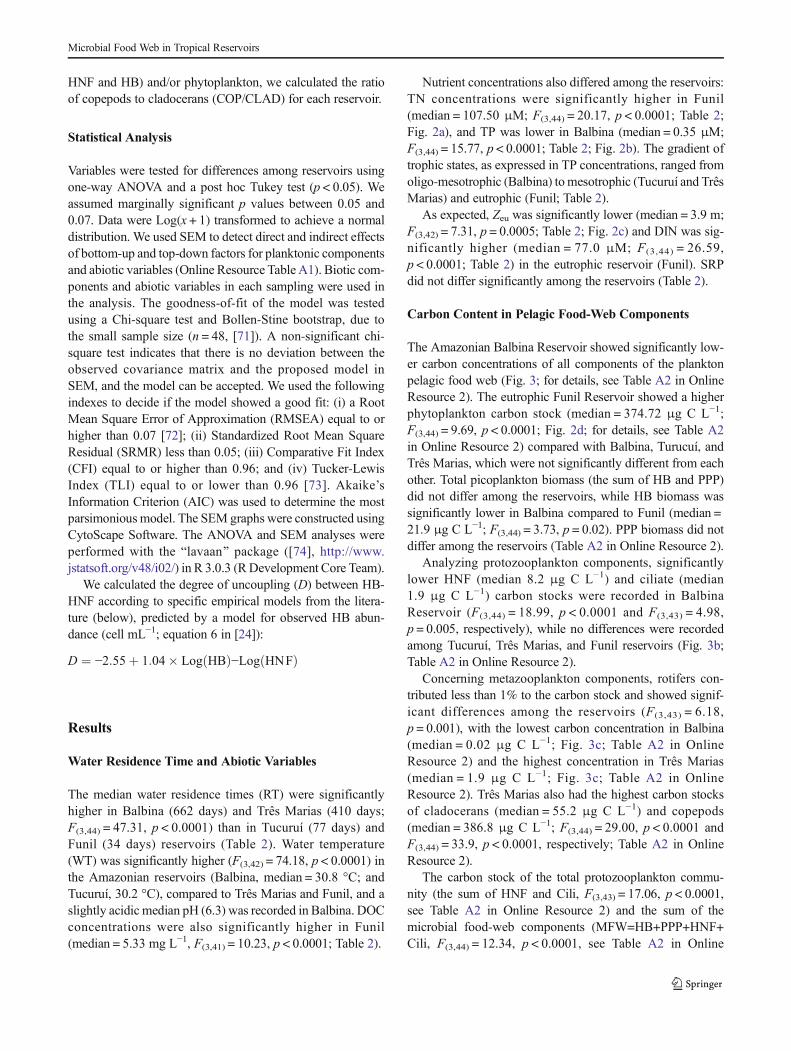
Nutrient concentrations also differed among the reservoirs:TN concentrations were significantly higher in Funil(median = 107.50 μM; F(3,44) = 20.17, p < 0.0001; Table 2;Fig. 2a), and TP was lower in Balbina (median = 0.35 μM;F(3,44) = 15.77, p < 0.0001; Table 2; Fig. 2b). The gradient oftrophic states, as expressed in TP concentrations, ranged fromoligo-mesotrophic (Balbina) tomesotrophic (Tucuruí and TrêsMarias) and eutrophic (Funil; Table 2).
As expected, Zeu was significantly lower (median = 3.9 m;F(3,42) = 7.31, p = 0.0005; Table 2; Fig. 2c) and DIN was sig-nificantly higher (median = 77.0 μM; F(3,44) = 26.59,p < 0.0001; Table 2) in the eutrophic reservoir (Funil). SRPdid not differ significantly among the reservoirs (Table 2).
Carbon Content in Pelagic Food-Web Components
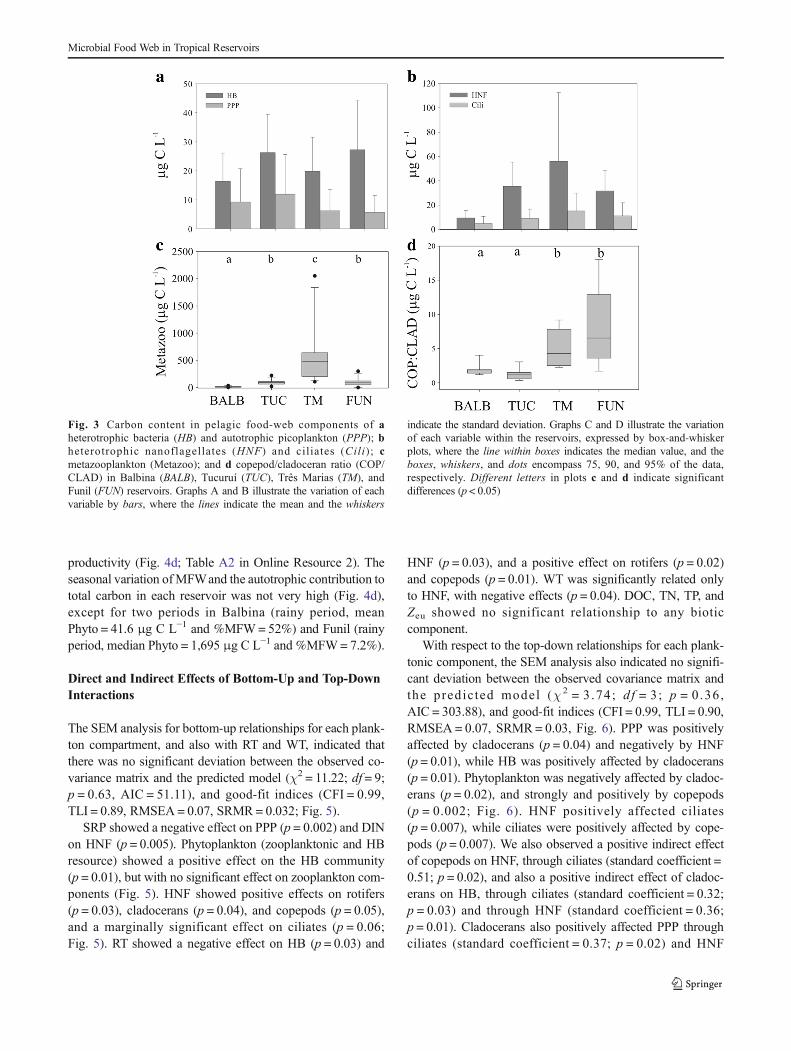
The Amazonian Balbina Reservoir showed significantly low-er carbon concentrations of all components of the planktonpelagic food web (Fig. 3; for details, see Table A2 in OnlineResource 2). The eutrophic Funil Reservoir showed a higherphytoplankton carbon stock (median = 374.72 μg C L−1;F(3,44) = 9.69, p < 0.0001; Fig. 2d; for details, see Table A2in Online Resource 2) compared with Balbina, Turucuí, andTrês Marias, which were not significantly different from eachother. Total picoplankton biomass (the sum of HB and PPP)did not differ among the reservoirs, while HB biomass wassignificantly lower in Balbina compared to Funil (median =21.9 μg C L−1; F(3,44) = 3.73, p = 0.02). PPP biomass did notdiffer among the reservoirs (Table A2 in Online Resource 2).
Analyzing protozooplankton components, significantlylower HNF (median 8.2 μg C L−1) and ciliate (median1.9 μg C L−1) carbon stocks were recorded in BalbinaReservoir (F(3,44) = 18.99, p < 0.0001 and F(3,43) = 4.98,p = 0.005, respectively), while no differences were recordedamong Tucuruí, Três Marias, and Funil reservoirs (Fig. 3b;Table A2 in Online Resource 2).
Concerning metazooplankton components, rotifers con-tributed less than 1% to the carbon stock and showed signif-icant differences among the reservoirs (F(3,43) = 6.18,p = 0.001), with the lowest carbon concentration in Balbina(median = 0.02 μg C L−1; Fig. 3c; Table A2 in OnlineResource 2) and the highest concentration in Três Marias(median = 1.9 μg C L−1; Fig. 3c; Table A2 in OnlineResource 2). Três Marias also had the highest carbon stocksof cladocerans (median = 55.2 μg C L−1) and copepods(median = 386.8 μg C L−1; F(3,44) = 29.00, p < 0.0001 andF(3,44) = 33.9, p < 0.0001, respectively; Table A2 in OnlineResource 2).
The carbon stock of the total protozooplankton commu-nity (the sum of HNF and Cili, F(3,43) = 17.06, p < 0.0001,see Table A2 in Online Resource 2) and the sum of themicrobial food-web components (MFW=HB+PPP+HNF+Cili, F(3,44) = 12.34, p < 0.0001, see Table A2 in Online
Microbial Food Web in Tropical Reservoirs
Resource 2) were significantly lower in Balbina, as was themetazooplankton (the sum of copepods, cladocerans, androtifers; median = 11.38 μg C L−1; F(3,44) = 31.78,p < 0.0001). The highest metazooplankton carbon stockswere observed in Três Marias (median = 479.58 μg C L−1;Fig. 3c; Table A2 in Online Resource 2). The Amazonianreservoirs Balbina and Tucuruí showed lower COP/CLADratios compared to Três Marias and Funil (F(3,43) = 16.87,p < 0.0001; Fig. 3d; Table A2 in Online Resource 2).
The carbon contributions of phytoplankton, zooplankton,and MFW components varied among the waterbodies, but
always with a higher contribution of phytoplankton(Fig. 4a). MFW components contributed approximately 30%of the total carbon stock of planktonic biota in the Amazonianreservoirs, a significantly higher proportion compared to TrêsMarias and Funil (∼10%; p < 0.0001, F(3,44) = 8.98; Fig. 4b;Table A2 in Online Resource 2). The MFW/Metazoo ratiowas more variable among the reservoirs and was significantlyhigher in Balbina and lower in Três Marias (F(3,44) = 20.26,p < 0.0001; Fig. 4c; Table A2 in Online Resource 2). We ob-served an inverse relationship between the contribution ofMFW and the total autotrophic carbon pool, as a proxy of
Fig. 2 Gradients of a totalnitrogen; b total phosphorus; ceuphotic zone; and dphytoplankton carbon content intwo Amazonian Balbina (BALB)and Tucuruí (TUC) and two non-Amazonian Três Marias (TM) andFunil (FUN) reservoirs. Thevariation of each variable withinthe reservoirs is expressed bybox-and-whisker plots, where theline within boxes indicates themedian value, the boxesencompass 25 and 75% and thewhiskers 10 and 90%, while thedots encompass 95% of the data.Different letters inside the plotsindicate statistically significantdifferences (p < 0.05)
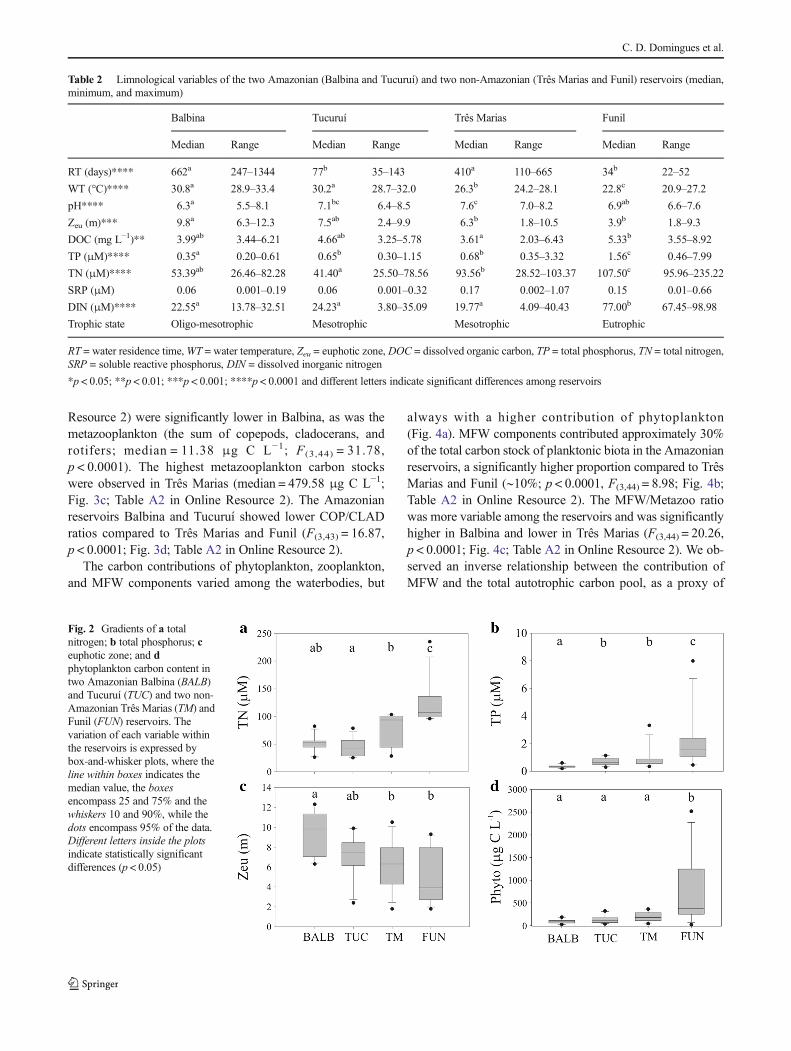
Table 2 Limnological variables of the two Amazonian (Balbina and Tucuruí) and two non-Amazonian (Três Marias and Funil) reservoirs (median,minimum, and maximum)
Balbina Tucuruí Três Marias Funil
Median Range Median Range Median Range Median Range
RT (days)**** 662a 247–1344 77b 35–143 410a 110–665 34b 22–52
WT (°C)**** 30.8a 28.9–33.4 30.2a 28.7–32.0 26.3b 24.2–28.1 22.8c 20.9–27.2
pH**** 6.3a 5.5–8.1 7.1bc 6.4–8.5 7.6c 7.0–8.2 6.9ab 6.6–7.6
Zeu (m)*** 9.8a 6.3–12.3 7.5ab 2.4–9.9 6.3b 1.8–10.5 3.9b 1.8–9.3
DOC (mg L−1)** 3.99ab 3.44–6.21 4.66ab 3.25–5.78 3.61a 2.03–6.43 5.33b 3.55–8.92
TP (μM)**** 0.35a 0.20–0.61 0.65b 0.30–1.15 0.68b 0.35–3.32 1.56c 0.46–7.99
TN (μM)**** 53.39ab 26.46–82.28 41.40a 25.50–78.56 93.56b 28.52–103.37 107.50c 95.96–235.22
SRP (μM) 0.06 0.001–0.19 0.06 0.001–0.32 0.17 0.002–1.07 0.15 0.01–0.66
DIN (μM)**** 22.55a 13.78–32.51 24.23a 3.80–35.09 19.77a 4.09–40.43 77.00b 67.45–98.98
Trophic state Oligo-mesotrophic Mesotrophic Mesotrophic Eutrophic
RT = water residence time,WT = water temperature, Zeu = euphotic zone, DOC = dissolved organic carbon, TP = total phosphorus, TN = total nitrogen,SRP = soluble reactive phosphorus, DIN = dissolved inorganic nitrogen
*p < 0.05; **p < 0.01; ***p < 0.001; ****p < 0.0001 and different letters indicate significant differences among reservoirs
C. D. Domingues et al.
productivity (Fig. 4d; Table A2 in Online Resource 2). Theseasonal variation ofMFWand the autotrophic contribution tototal carbon in each reservoir was not very high (Fig. 4d),except for two periods in Balbina (rainy period, meanPhyto = 41.6 μg C L−1 and %MFW= 52%) and Funil (rainyperiod, median Phyto = 1,695 μg C L−1 and %MFW= 7.2%).
Direct and Indirect Effects of Bottom-Up and Top-DownInteractions
The SEM analysis for bottom-up relationships for each plank-ton compartment, and also with RT and WT, indicated thatthere was no significant deviation between the observed co-variance matrix and the predicted model (χ2 = 11.22; df = 9;p = 0.63, AIC = 51.11), and good-fit indices (CFI = 0.99,TLI = 0.89, RMSEA = 0.07, SRMR= 0.032; Fig. 5).
SRP showed a negative effect on PPP (p = 0.002) and DINon HNF (p = 0.005). Phytoplankton (zooplanktonic and HBresource) showed a positive effect on the HB community(p = 0.01), but with no significant effect on zooplankton com-ponents (Fig. 5). HNF showed positive effects on rotifers(p = 0.03), cladocerans (p = 0.04), and copepods (p = 0.05),and a marginally significant effect on ciliates (p = 0.06;Fig. 5). RT showed a negative effect on HB (p = 0.03) and
HNF (p = 0.03), and a positive effect on rotifers (p = 0.02)and copepods (p = 0.01). WT was significantly related onlyto HNF, with negative effects (p = 0.04). DOC, TN, TP, andZeu showed no significant relationship to any bioticcomponent.
With respect to the top-down relationships for each plank-tonic component, the SEM analysis also indicated no signifi-cant deviation between the observed covariance matrix andthe predic ted model (χ2 = 3.74; df = 3; p = 0.36,AIC = 303.88), and good-fit indices (CFI = 0.99, TLI = 0.90,RMSEA = 0.07, SRMR = 0.03, Fig. 6). PPP was positivelyaffected by cladocerans (p = 0.04) and negatively by HNF(p = 0.01), while HB was positively affected by cladocerans(p = 0.01). Phytoplankton was negatively affected by cladoc-erans (p = 0.02), and strongly and positively by copepods(p = 0.002; Fig. 6). HNF positively affected ciliates(p = 0.007), while ciliates were positively affected by cope-pods (p = 0.007). We also observed a positive indirect effectof copepods on HNF, through ciliates (standard coefficient =0.51; p = 0.02), and also a positive indirect effect of cladoc-erans on HB, through ciliates (standard coefficient = 0.32;p = 0.03) and through HNF (standard coefficient = 0.36;p = 0.01). Cladocerans also positively affected PPP throughciliates (standard coefficient = 0.37; p = 0.02) and HNF
Fig. 3 Carbon content in pelagic food-web components of aheterotrophic bacteria (HB) and autotrophic picoplankton (PPP); bheterotrophic nanoflagellates (HNF) and ciliates (Cili); cmetazooplankton (Metazoo); and d copepod/cladoceran ratio (COP/CLAD) in Balbina (BALB), Tucuruí (TUC), Três Marias (TM), andFunil (FUN) reservoirs. Graphs A and B illustrate the variation of eachvariable by bars, where the lines indicate the mean and the whiskers
indicate the standard deviation. Graphs C and D illustrate the variationof each variable within the reservoirs, expressed by box-and-whiskerplots, where the line within boxes indicates the median value, and theboxes, whiskers, and dots encompass 75, 90, and 95% of the data,respectively. Different letters in plots c and d indicate significantdifferences (p < 0.05)
Microbial Food Web in Tropical Reservoirs
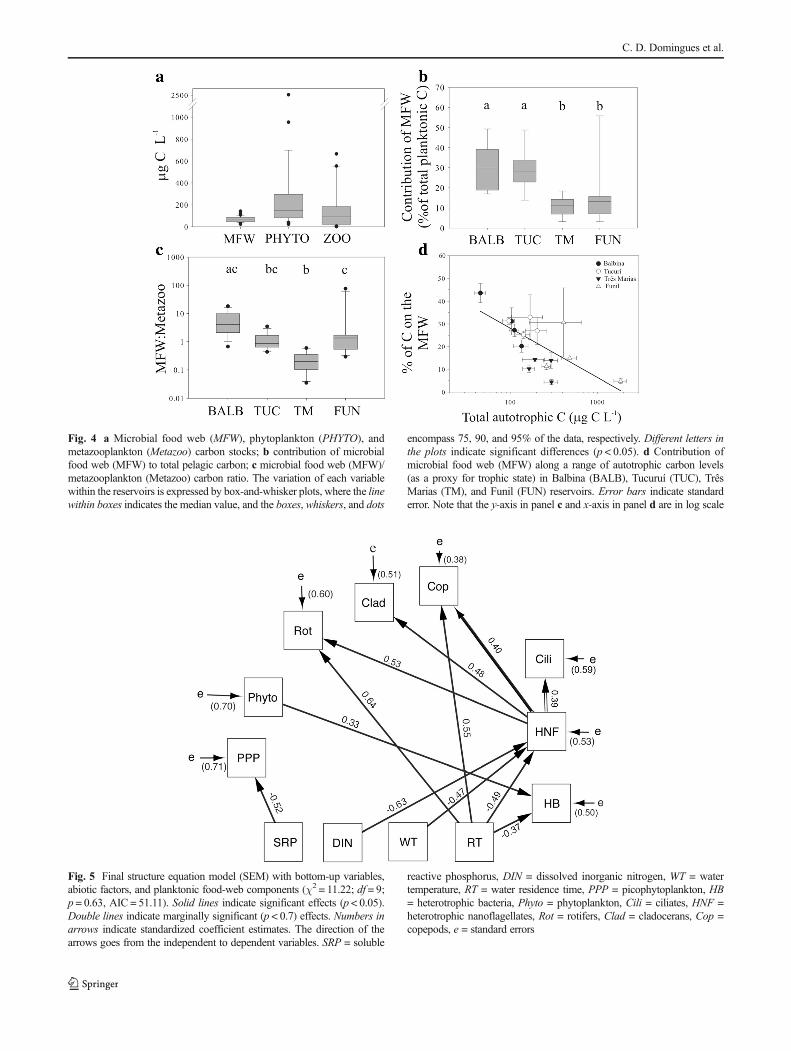
Fig. 5 Final structure equation model (SEM) with bottom-up variables,abiotic factors, and planktonic food-web components (χ2 = 11.22; df = 9;p = 0.63, AIC = 51.11). Solid lines indicate significant effects (p < 0.05).Double lines indicate marginally significant (p < 0.7) effects. Numbers inarrows indicate standardized coefficient estimates. The direction of thearrows goes from the independent to dependent variables. SRP = soluble
reactive phosphorus, DIN = dissolved inorganic nitrogen, WT = watertemperature, RT = water residence time, PPP = picophytoplankton, HB= heterotrophic bacteria, Phyto = phytoplankton, Cili = ciliates, HNF =heterotrophic nanoflagellates, Rot = rotifers, Clad = cladocerans, Cop =copepods, e = standard errors
Fig. 4 a Microbial food web (MFW), phytoplankton (PHYTO), andmetazooplankton (Metazoo) carbon stocks; b contribution of microbialfood web (MFW) to total pelagic carbon; c microbial food web (MFW)/metazooplankton (Metazoo) carbon ratio. The variation of each variablewithin the reservoirs is expressed by box-and-whisker plots, where the linewithin boxes indicates the median value, and the boxes, whiskers, and dots
encompass 75, 90, and 95% of the data, respectively. Different letters inthe plots indicate significant differences (p < 0.05). d Contribution ofmicrobial food web (MFW) along a range of autotrophic carbon levels(as a proxy for trophic state) in Balbina (BALB), Tucuruí (TUC), TrêsMarias (TM), and Funil (FUN) reservoirs. Error bars indicate standarderror. Note that the y-axis in panel c and x-axis in panel d are in log scale
C. D. Domingues et al.
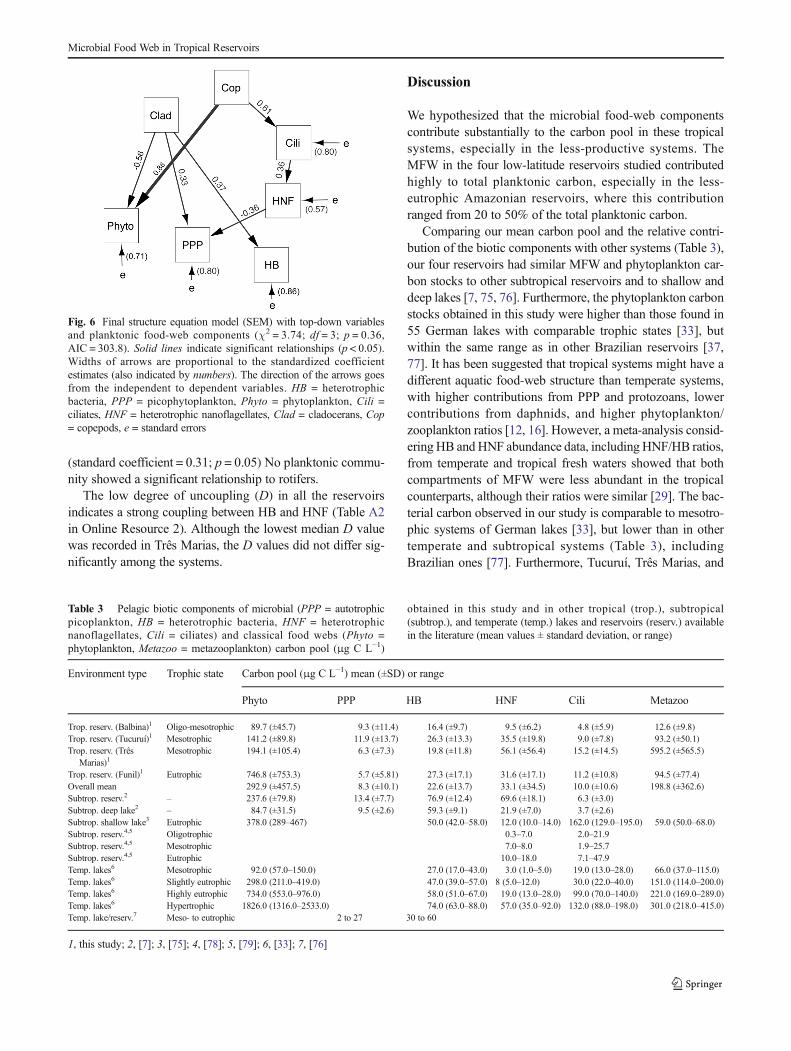
(standard coefficient = 0.31; p = 0.05) No planktonic commu-nity showed a significant relationship to rotifers.
The low degree of uncoupling (D) in all the reservoirsindicates a strong coupling between HB and HNF (Table A2in Online Resource 2). Although the lowest median D valuewas recorded in Três Marias, the D values did not differ sig-nificantly among the systems.
Discussion
We hypothesized that the microbial food-web componentscontribute substantially to the carbon pool in these tropicalsystems, especially in the less-productive systems. TheMFW in the four low-latitude reservoirs studied contributedhighly to total planktonic carbon, especially in the less-eutrophic Amazonian reservoirs, where this contributionranged from 20 to 50% of the total planktonic carbon.
Comparing our mean carbon pool and the relative contri-bution of the biotic components with other systems (Table 3),our four reservoirs had similar MFW and phytoplankton car-bon stocks to other subtropical reservoirs and to shallow anddeep lakes [7, 75, 76]. Furthermore, the phytoplankton carbonstocks obtained in this study were higher than those found in55 German lakes with comparable trophic states [33], butwithin the same range as in other Brazilian reservoirs [37,77]. It has been suggested that tropical systems might have adifferent aquatic food-web structure than temperate systems,with higher contributions from PPP and protozoans, lowercontributions from daphnids, and higher phytoplankton/zooplankton ratios [12, 16]. However, a meta-analysis consid-ering HB andHNF abundance data, including HNF/HB ratios,from temperate and tropical fresh waters showed that bothcompartments of MFW were less abundant in the tropicalcounterparts, although their ratios were similar [29]. The bac-terial carbon observed in our study is comparable to mesotro-phic systems of German lakes [33], but lower than in othertemperate and subtropical systems (Table 3), includingBrazilian ones [77]. Furthermore, Tucuruí, Três Marias, and
Fig. 6 Final structure equation model (SEM) with top-down variablesand planktonic food-web components (χ2 = 3.74; df = 3; p = 0.36,AIC = 303.8). Solid lines indicate significant relationships (p < 0.05).Widths of arrows are proportional to the standardized coefficientestimates (also indicated by numbers). The direction of the arrows goesfrom the independent to dependent variables. HB = heterotrophicbacteria, PPP = picophytoplankton, Phyto = phytoplankton, Cili =ciliates, HNF = heterotrophic nanoflagellates, Clad = cladocerans, Cop= copepods, e = standard errors
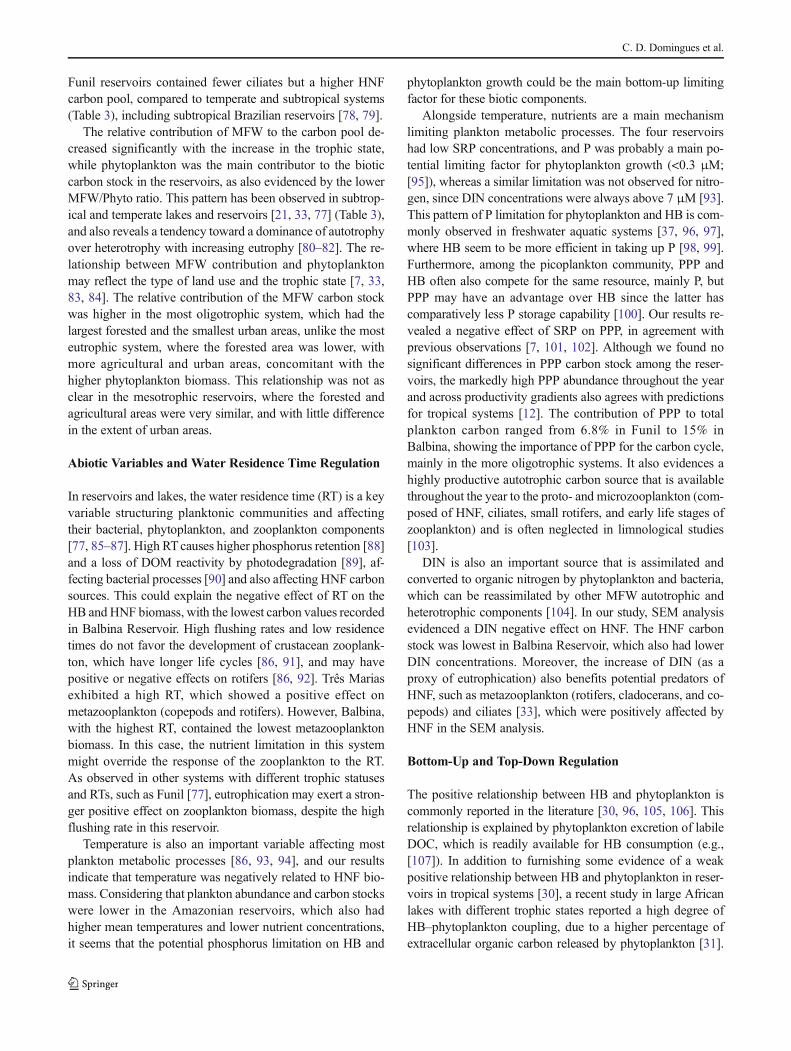
Table 3 Pelagic biotic components of microbial (PPP = autotrophicpicoplankton, HB = heterotrophic bacteria, HNF = heterotrophicnanoflagellates, Cili = ciliates) and classical food webs (Phyto =phytoplankton, Metazoo = metazooplankton) carbon pool (μg C L−1)
obtained in this study and in other tropical (trop.), subtropical(subtrop.), and temperate (temp.) lakes and reservoirs (reserv.) availablein the literature (mean values ± standard deviation, or range)
Environment type Trophic state Carbon pool (μg C L−1) mean (±SD) or range
Phyto PPP HB HNF Cili Metazoo
Trop. reserv. (Balbina)1 Oligo-mesotrophic 89.7 (±45.7) 9.3 (±11.4) 16.4 (±9.7) 9.5 (±6.2) 4.8 (±5.9) 12.6 (±9.8)Trop. reserv. (Tucuruí)1 Mesotrophic 141.2 (±89.8) 11.9 (±13.7) 26.3 (±13.3) 35.5 (±19.8) 9.0 (±7.8) 93.2 (±50.1)Trop. reserv. (Três
Marias)1Mesotrophic 194.1 (±105.4) 6.3 (±7.3) 19.8 (±11.8) 56.1 (±56.4) 15.2 (±14.5) 595.2 (±565.5)
Trop. reserv. (Funil)1 Eutrophic 746.8 (±753.3) 5.7 (±5.81) 27.3 (±17.1) 31.6 (±17.1) 11.2 (±10.8) 94.5 (±77.4)Overall mean 292.9 (±457.5) 8.3 (±10.1) 22.6 (±13.7) 33.1 (±34.5) 10.0 (±10.6) 198.8 (±362.6)Subtrop. reserv.2 – 237.6 (±79.8) 13.4 (±7.7) 76.9 (±12.4) 69.6 (±18.1) 6.3 (±3.0)Subtrop. deep lake2 – 84.7 (±31.5) 9.5 (±2.6) 59.3 (±9.1) 21.9 (±7.0) 3.7 (±2.6)Subtrop. shallow lake3 Eutrophic 378.0 (289–467) 50.0 (42.0–58.0) 12.0 (10.0–14.0) 162.0 (129.0–195.0) 59.0 (50.0–68.0)Subtrop. reserv.4,5 Oligotrophic 0.3–7.0 2.0–21.9Subtrop. reserv.4,5 Mesotrophic 7.0–8.0 1.9–25.7Subtrop. reserv.4,5 Eutrophic 10.0–18.0 7.1–47.9Temp. lakes6 Mesotrophic 92.0 (57.0–150.0) 27.0 (17.0–43.0) 3.0 (1.0–5.0) 19.0 (13.0–28.0) 66.0 (37.0–115.0)Temp. lakes6 Slightly eutrophic 298.0 (211.0–419.0) 47.0 (39.0–57.0) 8 (5.0–12.0) 30.0 (22.0–40.0) 151.0 (114.0–200.0)Temp. lakes6 Highly eutrophic 734.0 (553.0–976.0) 58.0 (51.0–67.0) 19.0 (13.0–28.0) 99.0 (70.0–140.0) 221.0 (169.0–289.0)Temp. lakes6 Hypertrophic 1826.0 (1316.0–2533.0) 74.0 (63.0–88.0) 57.0 (35.0–92.0) 132.0 (88.0–198.0) 301.0 (218.0–415.0)Temp. lake/reserv.7 Meso- to eutrophic 2 to 27 30 to 60
1, this study; 2, [7]; 3, [75]; 4, [78]; 5, [79]; 6, [33]; 7, [76]
Microbial Food Web in Tropical Reservoirs
Funil reservoirs contained fewer ciliates but a higher HNFcarbon pool, compared to temperate and subtropical systems(Table 3), including subtropical Brazilian reservoirs [78, 79].
The relative contribution of MFW to the carbon pool de-creased significantly with the increase in the trophic state,while phytoplankton was the main contributor to the bioticcarbon stock in the reservoirs, as also evidenced by the lowerMFW/Phyto ratio. This pattern has been observed in subtrop-ical and temperate lakes and reservoirs [21, 33, 77] (Table 3),and also reveals a tendency toward a dominance of autotrophyover heterotrophy with increasing eutrophy [80–82]. The re-lationship between MFW contribution and phytoplanktonmay reflect the type of land use and the trophic state [7, 33,83, 84]. The relative contribution of the MFW carbon stockwas higher in the most oligotrophic system, which had thelargest forested and the smallest urban areas, unlike the mosteutrophic system, where the forested area was lower, withmore agricultural and urban areas, concomitant with thehigher phytoplankton biomass. This relationship was not asclear in the mesotrophic reservoirs, where the forested andagricultural areas were very similar, and with little differencein the extent of urban areas.
Abiotic Variables and Water Residence Time Regulation
In reservoirs and lakes, the water residence time (RT) is a keyvariable structuring planktonic communities and affectingtheir bacterial, phytoplankton, and zooplankton components[77, 85–87]. High RTcauses higher phosphorus retention [88]and a loss of DOM reactivity by photodegradation [89], af-fecting bacterial processes [90] and also affecting HNF carbonsources. This could explain the negative effect of RT on theHB and HNF biomass, with the lowest carbon values recordedin Balbina Reservoir. High flushing rates and low residencetimes do not favor the development of crustacean zooplank-ton, which have longer life cycles [86, 91], and may havepositive or negative effects on rotifers [86, 92]. Três Mariasexhibited a high RT, which showed a positive effect onmetazooplankton (copepods and rotifers). However, Balbina,with the highest RT, contained the lowest metazooplanktonbiomass. In this case, the nutrient limitation in this systemmight override the response of the zooplankton to the RT.As observed in other systems with different trophic statusesand RTs, such as Funil [77], eutrophication may exert a stron-ger positive effect on zooplankton biomass, despite the highflushing rate in this reservoir.
Temperature is also an important variable affecting mostplankton metabolic processes [86, 93, 94], and our resultsindicate that temperature was negatively related to HNF bio-mass. Considering that plankton abundance and carbon stockswere lower in the Amazonian reservoirs, which also hadhigher mean temperatures and lower nutrient concentrations,it seems that the potential phosphorus limitation on HB and
phytoplankton growth could be the main bottom-up limitingfactor for these biotic components.
Alongside temperature, nutrients are a main mechanismlimiting plankton metabolic processes. The four reservoirshad low SRP concentrations, and P was probably a main po-tential limiting factor for phytoplankton growth (<0.3 μM;[95]), whereas a similar limitation was not observed for nitro-gen, since DIN concentrations were always above 7 μM [93].This pattern of P limitation for phytoplankton and HB is com-monly observed in freshwater aquatic systems [37, 96, 97],where HB seem to be more efficient in taking up P [98, 99].Furthermore, among the picoplankton community, PPP andHB often also compete for the same resource, mainly P, butPPP may have an advantage over HB since the latter hascomparatively less P storage capability [100]. Our results re-vealed a negative effect of SRP on PPP, in agreement withprevious observations [7, 101, 102]. Although we found nosignificant differences in PPP carbon stock among the reser-voirs, the markedly high PPP abundance throughout the yearand across productivity gradients also agrees with predictionsfor tropical systems [12]. The contribution of PPP to totalplankton carbon ranged from 6.8% in Funil to 15% inBalbina, showing the importance of PPP for the carbon cycle,mainly in the more oligotrophic systems. It also evidences ahighly productive autotrophic carbon source that is availablethroughout the year to the proto- and microzooplankton (com-posed of HNF, ciliates, small rotifers, and early life stages ofzooplankton) and is often neglected in limnological studies[103].
DIN is also an important source that is assimilated andconverted to organic nitrogen by phytoplankton and bacteria,which can be reassimilated by other MFW autotrophic andheterotrophic components [104]. In our study, SEM analysisevidenced a DIN negative effect on HNF. The HNF carbonstock was lowest in Balbina Reservoir, which also had lowerDIN concentrations. Moreover, the increase of DIN (as aproxy of eutrophication) also benefits potential predators ofHNF, such as metazooplankton (rotifers, cladocerans, and co-pepods) and ciliates [33], which were positively affected byHNF in the SEM analysis.
Bottom-Up and Top-Down Regulation
The positive relationship between HB and phytoplankton iscommonly reported in the literature [30, 96, 105, 106]. Thisrelationship is explained by phytoplankton excretion of labileDOC, which is readily available for HB consumption (e.g.,[107]). In addition to furnishing some evidence of a weakpositive relationship between HB and phytoplankton in reser-voirs in tropical systems [30], a recent study in large Africanlakes with different trophic states reported a high degree ofHB–phytoplankton coupling, due to a higher percentage ofextracellular organic carbon released by phytoplankton [31].
C. D. Domingues et al.

The positive relationship evidenced in the SEM analysis alsosupports this view of close HB–phytoplankton coupling intropical systems.
PPP is an important food item and carbon source for pe-lagic ciliates and HNF, which can supply higher trophic levels[76, 108, 109]. Some studies have reported higher ciliate andHNF clearance rates on PPP (herbivory) than on HB(bactivory) [109, 110]. The authors of these studies arguedthat herbivory represents a more efficient means of energytransfer from primary producers to other parts of the foodweb and has important biogeochemical implications becauseof the autotrophic origin of the carbon versus recycled organiccarbon. Considering that we found a significant fraction ofplanktonic carbon in protozooplankton, especially HNF, andalso a negative relationship with PPP, it is probable that graz-ing rates on PPP were considerably high. Moreover,mixotrophy among phytoplankton also has been shown tobe an important outcome explaining HB and autotrophicpicoplankton losses in freshwater systems [111–113]. The car-bon stock of potentially mixotrophic flagellates in the phyto-plankton (mostly chrysophyceans, dinoflagellates, andcryptomonads) represented less than 20% of the total phyto-plankton carbon stock in our study (6.3% in Funil, 8.9% inBalbina, 13.5% in Tucurui, and 20% in Três Marias) and didnot differ significantly among the reservoirs. Ciliates are alsoimportant predators of picoplanktonic (autotrophic and het-erotrophic) production and a link between matter and energyflux in the planktonic metabolism, and may exceed HNF pre-dation [110, 114–116]. The mainmorphotype groups that con-tributed to total ciliate carbon in these reservoirs werePros toma t ida , O l igo t r i ch i a , Hymenos toma t ida ,Pleurostomatida, Peritrichia, and Gymnostomatida (data notshown), which are planktonic organisms [117–119]. Fooditems for each group are variable [120], but in generalOligotrichia, Peritrichia, and Hymenostomatida are mainlypicoplanktivorous (autotrophic or heterotrophic), whilePleurostomatida, Gymnostomatida, and Protosmatida are om-nivorous, herbivorous, or raptorial feeders [76, 116].Nevertheless, no relationship was evidenced by the SEM anal-ysis. Unfortunately, we could not estimate the species of cili-ates and HNF, nor the real effect of bactivory or herbivory ofmixotrophic flagellates on the picoplanktonic community,since for this, direct measurements of grazing rates would benecessary. However, we speculate that not only the HB com-munity but also the PPP components were probably affectedby the predation pressure of the protozoan community.
The HB carbon stock was significantly lower in Balbinathan in Tucuruí, and did not differ between the other reser-voirs. HB abundance generally varies less than other plank-tonic food-web components across environments [121], inde-pendently of the zooplankton community structure [122]. Inmost oligotrophic environments, HB abundance tends to bemore top-down regulated by HNF, while bottom-up or
controlled by metazoan predation in more eutrophic systems[121]. Since Balbina is the least eutrophic system studied, andshowed a high relative contribution of MFWcomponents(%MFW) and cladocerans (low COP/CLAD ratio), the HBcommunity might be experiencing a stronger top-down regu-lation in this reservoir than in the more eutrophic ones.
Zooplankton can also interact directly through predationwith different trophic levels of MFW [12].We did not observea high contribution of rotifers to the consumer community inany of the four reservoirs. Although fish can control zooplank-ton and influence the size structure of the planktonic commu-nity [34, 123], few species of fishes occupy the upper layers oflimnetic areas and deep layers of large reservoirs, and most ofthe ichthyofauna occurs in the littoral zone [124, 125].Nevertheless, the main feeding guilds of fishes in these reser-voirs are the piscivores (in all reservoirs and especially in TrêsMarias), detritivores, and omnivores (especially in Funil)[47–49]. A fish community composed mainly of piscivoreswill strongly impact other fish, and consequently the zoo-plankton and phytoplankton structure [123], including reduc-tion of cladocerans and dominance of cyanobacteria [126].
With respect to the other metazooplankton groups, we ob-served two clear clusters of COP/CLAD ratios, with highervalues in Três Marias and Funil reservoirs, which can estab-lish different relationships between the classical and MFW.Copepods are selective feeders, preferring larger prey thanthe picoplankton spectrum [20], and may not be as effectivein HNF predation [127]. On the other hand, cladocerans areeffective predators on phytoplankton [93] and transport ener-gy more efficiently through a direct link between the MFWand the classical food chain [128, 129]. Our analysis captureda positive direct effect of copepods on ciliates and phytoplank-ton biomass, and also an indirect positive effect on HNF.Likewise, cladocerans had positive direct and indirect effectson HB and PPP, but a negative effect on phytoplankton.Previous studies have reported positive relationships betweenphytoplankton and zooplankton in reservoirs [37, 130]. In agradient of ultraoligotrophic to mesotrophic conditions,calanoid copepods, rotifers, copepodites, and nauplii becamemore effective than cladocerans in consuming protozoans,particularly ciliates [7, 131]. Moreover, laboratory experi-ments with Daphnia and copepods also found that copepodsstrongly impact ciliates [122]. All these studies concord withthe results obtained in our models of the coupling betweenmetazoans and protozoans.
Usually, the degree of HNF-HB uncoupling (D) is expectedto be higher in daphnid-dominated than in copepod-dominated systems [26]. In this study, we did not observesignificant differences in D values among the reservoirs, butour results showed rather low values compared to other stud-ies [28, 121], especially in Três Marias where the highestcopepod biomass was recorded. Conversely, HNF/HB carbonratios equal to or higher than 1.0 were recorded in 50% of our
Microbial Food Web in Tropical Reservoirs

samples, especially in reservoirs with higher COP/CLAD ra-tios. These values were more frequent than in similar reportsfrom temperate lakes [26]. These observations suggest astrong HNF-HB coupling in tropical reservoirs. Despite this,we found no significant direct effect of HNF on HB, whichmay be influenced by the low variances of HB and HNFamong the reservoirs. However, the positive relationship be-tween copepods and ciliates and the significant positive indi-rect effect of copepods on HNF through ciliates provide em-pirical evidence for the higher relative importance of HNF incopepod-dominated food webs [122, 128, 132].
We also observed a positive relationship between HNF andciliates, which can be explained by the overlap of controllingfactors on the two communities, either by source supply or bypredation [7, 33, 133]. Furthermore, the recycled nutrientsprovided by protozoans (mainly N, P, and DOC) probablystimulate bacterial growth [132]. This constant nutrient andcarbon recycling, allied to the fact that bacterial respirationrates per bacterial production unit in tropical freshwaters areat least twofold higher in the tropics [32], may contribute tothe CO2 supersaturation that is commonly observed in tropicalreservoirs [4].
In summary, the high contribution of the MFW, especiallyHNF, to the carbon pool, and the strong HNF-HB coupling asmeasured by the low D values support the view that MFWcomponents may participate actively in the metabolic processin tropical reservoirs. Besides, the MFW may be directly andindirectly influenced through different pathways by cladoc-erans and copepods. The biotic pelagic components of classi-cal and MFWwere more closely related to resources (inferredfrom the lowest AIC model test), configuring an importantbottom-up mechanism. The food-web structure, especiallytop predators, can alter the efficiency of energy transferthrough trophic levels [9, 12, 121]. In turn, the MFWexhibitsmany pathways and intermediate trophic levels, which maycontribute to a higher energy loss through respiration [108].High plankton respiration rates and inefficient food webs [32,134] may help to account for the large greenhouse gas emis-sions in tropical reservoirs [4, 6]. Therefore, this study dem-onstrates the importance of evaluating the whole size spec-trum (including the microbial compartments) of the differentplanktonic compartments, in order to better capture the com-plex carbon-flux dynamics of tropical aquatic ecosystems.
Acknowledgments We are grateful to Gladson Rezende Marques forlaboratory analyses, and to Carlos Henrique Eckhardt Duque-Estrada andRamôn Pereira de Souza for fieldwork assistance. We are also grateful toInácio Domingos (Universidade Federal do Rio de Janeiro) and RobertoDias (Universidade Federal de Juiz de Fora) for assistance in determiningmorphotypes in the ciliate community, and to Janet Reid for Englishreview. This study was funded by the Centrais Elétricas do Norte doBrasil S/A (ELETRONORTE). We also thank the Electrical EnergyResearch Center (Cepel), Eletrobrás Amazonas Energia, EletrobrásEletronorte/Tucuruí staff, Waimiri-Atroari Program, and UatumãBiological Reserve (REBio-Uatumã) for logistical support in Balbina
and Tucuruí reservoirs. C.D.D. is grateful to the Brazilian NationalCouncil for Scientific and Technological Development (CNPq) for aPhD fellowship. H.S.’s work was supported by CNPq and theFoundation for Research Support of the State of São Paulo (FAPESP,process 2014/14139-3).
References
1. Cole JJ, Prairie YT, Caraco NF et al (2007) Plumbing the globalcarbon cycle: integrating inland waters into the terrestrial carbonbudget. Ecosystems 10:171–184. doi:10.1007/s10021-006-9013-8
2. Aufdenkampe AK, Mayorga E, Raymond PA et al (2011)Riverine coupling of biogeochemical cycles between land,oceans, and atmosphere. Front Ecol Environ 9:53–60.doi:10.1890/100014
3. Lewis WM Jr (2010) Biogeochemistry of tropical lakes. VerhInternat Verein Limnol 30:1595–1603
4. Tranvik LJ, Downing JA, Cotner JB et al (2009) Lakes and reser-voirs as regulators of carbon cycling and climate. LimnolOceanogr 54:2298–2314. doi:10.4319/lo.2009.54.6_part_2.2298
5. Kosten S, Roland F, Da Motta Marques DML et al (2010)Climate-dependent CO2 emissions from lakes. GlobBiogeochem Cycles 24, GB2007. doi:10.1029/2009GB003618
6. Barros NO, Cole JJ, Tranvik LJ et al (2011) Carbon emission fromhydroelectric reservoirs linked to reservoir age and latitude. NatGeosci 4:593–596. doi:10.1038/ngeo1211
7. Burns CW, Galbraith LM (2007) Relating planktonic microbialfoodweb structure in lentic freshwater ecosystems to water qualityand land use. J Plankton Res 29:127–139. doi:10.1093/plankt/fbm001
8. Kilham P, Kilham SS (1990) Endless summer: internal loadingprocesses dominate nutrient cycling in tropical lakes. FreshwBiol 23:379–390. doi:10.1111/j.1365-2427.1990.tb00280.x
9. Schindler DE, Carpenter SR, Cole JJ et al (1997) Influence of foodweb structure on carbon exchange between lakes and the atmo-sphere. Science 277:248–251. doi:10.1126/science.277.5323.248
10. Atwood TB, Hammill E, Greig HS et al (2013) Predator-inducedreduction of freshwater carbon dioxide emissions. Nat Geosci 6:191–194. doi:10.1038/ngeo1734
11. Müller-Navarra DC (2008) Food web paradigms: the biochemicalview on trophic interactions. Int Rev Hydrobiol 93:489–505.doi:10.1002/iroh.200711046
12. Sarmento H (2012) New paradigms in tropical limnology: theimportance of the microbial food web. Hydrobiologia 686:1–14.doi:10.1007/s10750-012-1011-6
13. Sarmento H, Amado AM, Descy J-P (2013) Climate change intropical fresh waters (comment on the paper BPlankton dynamicsunder different climatic conditions in space and time^ by deSenerpont Domis et al., 2013). Freshw Biol 58:2208–2210.doi:10.1111/fwb.12140
14. Iglesias C, Mazzeo N, Meerhoff M et al (2011) High predation isof key importance for dominance of small-bodied zooplankton inwarm shallow lakes: evidence from lakes, fish exclosures andsurface sediments. Hydrobiologia 667:133–147. doi:10.1007/s10750-011-0645-0
15. Kruk C, Segura AM, Peeters ETHM et al (2012) Phytoplanktonspecies predictability increase towards warmer regions. LimnolOceanogr 57:1126–1135. doi:10.4319/lo.2012.57.4.1126
16. Fernando CH (1994) Zooplankton, fish and fisheries in tropicalfreshwaters. Hydrobiologia 272:105–123. doi:10.1007/BF00006516
C. D. Domingues et al.
17. Lewis WM Jr (1996) Tropical lakes: how latitude makes a differ-ence. In: Schiemer F, Boland KT (eds) Perspect Trop Limnol. SPBAcademic Publishing, Amsterdam, pp 43–64
18. Jeppesen E, Meerhoff M, Holmgren K et al (2010) Impacts ofclimate warming on lake fish community structure and potentialeffects on ecosystem function. Hydrobiologia 646:73–90.doi:10.1007/s10750-010-0171-5
19. Jeppesen E, Meerhoff M, Jacobsen BA et al (2007) Restoration ofshallow lakes by nutrient control and biomanipulation—the suc-cessful strategy varies with lake size and climate. Hydrobiologia581:269–285. doi:10.1007/s10750-006-0507-3
20. Sommer U, Sommer F (2006) Cladocerans versus copepods: thecause of contrasting top-down controls on freshwater and marinephytoplankton. Oecologia 147:183–194. doi:10.1007/s00442-005-0320-0
21. Porter KG, Paerl HW, Hodson R et al (1988) Microbial interac-tions in lake food webs. In: Carpenter SR (ed) Complex interactlake communities. Springer, New York, pp 209–227
22. Dumont HJ (1994) On the diversity of the Cladocera in the tropics.Hydrobiologia 272:27–38. doi:10.1007/BF00006510
23. Sherr EB, Sherr BF (2002) Significance of predation by protists inaquatic microbial food webs. Antonie Van Leeuwenhoek 81:293–308. doi:10.1023/A:1020591307260
24. Sherr EB, Sherr BF (1994) Bacterivory and herbivory: key roles ofphagotrophic protists in pelagic food webs. Microb Ecol 28:223–235. doi:10.1007/BF00166812
25. Gasol JM (1994) A framework for the assessment of top-down vsbottom-up control of heterotrophic nanoflagellate abundance. MarEcol Prog Ser 113:291–300. doi:10.3354/meps113291
26. Gasol JM, Simons AM, Kalff J (1995) Patterns in the top-downversus bottom-up regulation of heterotrophic nanoflagellates intemperate lakes. J Plankton Res 17:1879–1903. doi:10.1093/plankt/17.10.1879
27. Tadonléké RD, Pinel-Alloul B, Bourbonnais N, Pick FR (2004)Factors affecting the bacteria-heterotrophic nanoflagellate rela-tionship in oligo-mesotrophic lakes. J Plankton Res 26:681–695.doi:10.1093/plankt/fbh060
28. Fermani P, Diovisalvi N, Torremorell A et al (2013) The microbialfood web structure of a hypertrophic warm-temperate shallowlake, as affected by contrasting zooplankton assemblages.Hydrobiologia 714:115–130. doi:10.1007/s10750-013-1528-3
29. Segóvia BT, Domingues CD, Meira BR et al (2016) Couplingbetween heterotrophic nanoflagellates and bacteria in freshwaters:does latitude make a difference? Front Microbiol 7:1–11.doi:10.3389/fmicb.2016.00114
30. Roland F, Lobão LM, Vidal LO et al (2010) Relationships be-tween pelagic bacteria and phytoplankton abundances in contrast-ing tropical freshwaters. Aquat Microb Ecol 60:261–272.doi:10.3354/ame01429
31. Morana C, Sarmento H, Descy J-P et al (2014) Production ofdissolved organic matter by phytoplankton and its uptake by het-erotrophic prokaryotes in large tropical lakes. Limnol Oceanogr59:1364–1375. doi:10.4319/lo.2014.59.4.1364
32. Amado AM, Meirelles-Pereira F, Vidal LDO et al (2013) Tropicalfreshwater ecosystems have lower bacterial growth efficiency thantemperate ones. Front Microbiol 21(4):167. doi:10.3389/fmicb.2013.00167
33. Auer B, Elzer U, Arndt H (2004) Comparison of pelagic foodwebs in lakes along a trophic gradient and with seasonal aspects:influence of resource and predation. J Plankton Res 26:697–709.doi:10.1093/plankt/fbh058
34. Stockner JG, Porter KG (1988) Microbial food webs in freshwaterplanktonic ecosystems. In: Carpenter SR (ed) Complex interact.Lake communities. Springer-Verlag New York Inc, pp 70–83
35. Agência Nacional de Energia Elétrica A (2014) ProjetoBALCAR: Emissões de Gases de Efei to Estufa em
Reservatórios de Centrais Hidrelétricas. ANEEL - AgênciaNacional de Energia Elétrica, Rio de Janeiro
36. Soares MCS, Marinho MM, Huszar VLM et al (2008) The effectsof water retention time and watershed features on the limnology oftwo tropical reservoirs in Brazil. Lakes Reserv Res Manag 13:257–269. doi:10.1111/j.1440-1770.2008.00379.x
37. Rangel LM, da Silva LHS, Rosa PG et al (2012)Phytoplankton biomass is mainly controlled by hydrologyand phosphorus concentrations in tropical hydroelectric res-ervoirs. Hydrobiologia 693:13–28. doi:10.1007/s10750-012-1083-3
38. Kemenes A, Forsberg BR, Melack JM (2011) CO2 emissionsfrom a tropical hydroelectric reservoir (Balbina, Brazil). JGeophys Res Biogeosci 116, G03004. doi:10.1029/2010JG001465
39. Tundisi JG, Santos MA, Menezes CFS (2005) Tucurui reservoir:experience and lessons learned brief. (Lake BasinManag Initiat 1–20.) Available at: www.worldlakes.org/uploads/26_Tucurui_Reservoir_27February2006.pdf
40. Esteves FDA, Amorim JC, Cardoso EL, Barbosa FAR (1985)Caracterização limnológica preliminar da represa de Três Marias(MG) com base em alguns parâmetros ambientais básicos. CiêncCult 37:608–617
41. La Rovere EL, Mendes FE (2000) Tucuruí Hydropower ComplexTucuruí Hydropower Complex, Brazil, A WCD case study pre-pared as an input to the World Commission on Dams, Cape Town
42. Soares MCS, Marinho MM, Azevedo SMFO et al (2012)Eutrophication and retention time affecting spatial heterogeneityin a tropical reservoir. Limnologica 42:197–203. doi:10.1016/j.limno.2011.11.002
43. da Silva CC, Ferreira EJG, de Deus CP (2008) Diet of Bryconopsalburnoides and B. caudomaculatus (Osteichthyes:Characiformes) in the region affected by Balbina HydroelectricDam (Amazon drainage, Brazil). Neotropical Ichthyol 6:237–242. doi:10.1590/S1679-62252008000200011
44. Guérin F, Abril G, Richard S et al (2006) Methane and carbondioxide emissions from tropical reservoirs: significance of down-stream rivers. Geophys Res Lett 33, L21407. doi:10.1029/2006GL027929
45. Rosas FCW, de Mattos GE, Cabral MMM (2007) The use ofhydroelectric lakes by giant otters Pteronura brasiliensis: Balbinalake in central Amazonia, Brazil. Oryx 41:520–524. doi:10.1017/S0030605307005121
46. ANEEL (Agência Nacional de Energia Elétrica) (2002) Atlas deenergia elétrica do Brasil. ANEEL, Brasília
47. Gomes LC, Fernandes R, Luiz EA (2004) Development of reser-voir fisheries management in Brazil based on imported paradigms.Acta Sci Biol Sci 26:309–315
48. Becker B, Galhardo BDOS, Macedo DR et al (2016) Influence oflimnological zones on the spatial distribution of fish assemblagesin three Brazilian reservoirs. J Limnol 75:156–168. doi:10.4081/jlimnol.2015.1266
49. Santos ABI, Terra BDF, Araújo FG (2010) Influence of the riverflow on the structure of fish assemblage along the longitudinalgradient from river to reservoir. Zoologia 27:732–740.doi:10.1590/S1984-46702010000500010
50. Cole GA (1994) Textbook of limnology. Waveland Press Inc,Long Grove, Illinois
51. Wetzel RG, Likens GE (1991) Limnological analyses. Springer,New York
52. Nürnberg GK (1996) Trophic state of clear and colored, soft- andhardwater lakes with special consideration of nutrients, anoxia,phytoplankton and fish. Lake Reservoir Manage 12:432–447.doi:10.1080/07438149609354283
53. Uhelingher V (1964) Summary for policymakers. In:Intergovernmental Panel on Climate Change (ed) Climate change
Microbial Food Web in Tropical Reservoirs
2013—physical science basis. Cambridge University Press,Cambridge, pp 1–30
54. Utermöhl H (1958) Zur Vervollkommnung der quantitativenPhytoplankton-Methodik. Mitt Int Ver Theor Angew Limnol 9:1–38
55. Van den Hoeck C, Mann DG, Jahns HM (1997) Algae. An intro-duction to phycology. Cambridge University Press, Cambridge
56. Komárek J, Anagnostidis K (1999) Cyanoprokaryota I. TeilChroococcales. I. In: Ettl H, Gärtner G, Heynig H, MollenhauerD (eds) Süsswasserflora von Mitteleuropa. Gustav Fischer,Stuttgart, p 548
57. Komárek J, Anagnostidis K (2005) Cyanoprocaryota. 2.Oscillatoriales. In: Ettl H, Gärtner G, Heynig H, MollenhauerD (eds) Süsswasserflora von Mittleuropa. Gustav Fisher,Stuttgart, p 759
58. Hillebrand H, Dürselen C-D, Kirschtel D et al (1999) Biovolumecalculation for pelagic and benthic microalgae. J Phycol 35:403–424. doi:10.1046/j.1529-8817.1999.3520403.x
59. Rocha O, Duncan A (1985) The relationship between cell carbonand cell volume in freshwater algal species used in zooplanktonicstudies. J Plankton Res 7:279–294
60. Putt M, Stoecker DK (1989) An experimentally determined car-bon: volume ratio for marine Boligotrichous^ ciliates from estua-rine and coastal waters. Limnol Oceanogr 34:1097–1103.doi:10.4319/lo.1989.34.6.1097
61. Muller H, Geller W (1993) Maximum growth rates of aquaticciliated protozoa: the dependence on body size and temperaturereconsidered. Arch Hydrobiol 126:315–327
62. Porter KG, Feig YS (1980) The use of DAPI for identifying andcounting aquatic microflora. Limnol Oceanogr 25:943–948
63. Maclsaac EA, Stockner GS (1993) Enumeration of phototrophicpicoplankton by autoflorescence microscopy. In: Kemp PF, SherrBF, Sherr EB, Cole JJ (eds) The handbook of methods in aquaticmicrobial ecology. Lewis Publishers, Boca Raton, pp 187–197
64. Kirchman DL (1993) Statistical analysis of direct counts of micro-bial abundance. In: Kemp PF, Sherr BF, Sherr EB, Cole JJ (eds)The handbook of methods in aquatic microbial ecology. LewisPublishers, Boca Raton, pp 117–120
65. Weisse T (1993) Dynamics of autotrophic picoplankton in marineand freshwater ecosystems. In: Jones JG (ed) Advances in micro-bial ecology. Plenum Press, New York, pp 327–370
66. Massana R, Gasol JM, Bjørnsen PK (1997) Measurement of bac-terial size via image analysis of epifluorescence preparations: de-scription of an inexpensive system and solutions to some of themost common problems. Sci Mar 61:397–407. doi:10.1017/CBO9781107415324.004
67. Norland S (1993) The relationship between biomass and volumeof bacteria. In: Kemp PF, Sherr BF, Sherr EB, Cole JJ (eds) Thehandbook of methods in aquatic microbial ecology. LewisPublishers, Boca Raton, pp 303–307
68. Borsheim KY, Bratbak G (1987) Cell volume to cell carbon con-version factors for a bacterivorous Monas sp. enriched from sea-water. Mar Ecol Prog Ser 36:171–175. doi:10.3354/meps036171
69. Culver DA, Boucherle MM, Bean DJ, Fletcher JW (1985)Biomass of freshwater crustacean zooplankton from length–weight regressions. Can J Fish Aquat Sci 42:1380–1390.doi:10.1139/f85-173
70. Latja R, Salomen K (1978) Carbon analysis for determination ofindividual biomasses of planktonic animals. Verh Internat VereinLimnol 20:2556–2560
71. Bollen KA, Stine RA (1992) Bootstrapping goodness-of-fit mea-sures in structural equation models. Sociol Methods Res 21:205–229. doi:10.1177/0049124192021002004
72. Steiger JH (2007) Understanding the limitations of global fit as-sessment in structural equation modeling. Personal Individ Differ42:893–898. doi:10.1016/j.paid.2006.09.017
73. Hu L, Bentler PM (1999) Cutoff criteria for fit indexes in covari-ance structure analysis: conventional criteria versus new alterna-tives. Struct Equ Model Multidiscip J 6:1–55. doi:10.1080/10705519909540118
74. Rosseel Y (2014) Structural Equation Modeling with lavaan.1–128
75. Havens KE, Beaver JR, East TL (2007) Plankton biomasspartitioning in a eutrophic subtropical lake: comparison with re-sults from temperate lake ecosystems. J Plankton Res 29:1087–1097. doi:10.1093/plankt/fbm083
76. Šimek K, Macek M, Pern J et al (1996) Can freshwater planktonicciliates survive on a diet of picoplankton? J Plankton Res 18:597–613. doi:10.1093/plankt/18.4.597
77. Silva LHS, Huszar VLM, Marinho MM et al (2014) Drivers ofphytoplankton, bacterioplankton, and zooplankton carbon bio-mass in tropical hydroelectric reservoirs. Limnologica 48:1–10.doi: 10.1016/j.limno.2014.04.004
78. Pereira DG, Velho LFM, Pagioro TA, Lansac-Tôha FA (2005)Abundância de nanoflagelados heterotróficos no plâncton dereservatórios com distintos graus de trofia. Acta Sci Biol Sci 27:43–50
79. Velho LFM, Pereira DG, Pagioro TA et al (2005) Abundance,biomass and size structure of planktonic ciliates in reservoirs withdistinct trophic states. Acta Limnol Bras 17:361–371
80. Gaedke U, Kamjunke N (2006) Structural and functional proper-ties of low- and high-diversity planktonic food webs. J PlanktonRes 28:707–718. doi:10.1093/plankt/fbl003
81. del Giorgio PA, Gasol JM (1995) Biomass distribution in fresh-water plankton communities. Am Nat 146:135–152
82. Cotner JB, Biddanda BA (2002) Small players, large role: micro-bial influence on biogeochemical processes in pelagic aquatic eco-systems. Ecosystems 5:105–121. doi:10.1007/s10021-001-0059-3
83. Katsiapi M, Mazaris AD, Charalampous E, Moustaka-Gouni M(2012) Watershed land use types as drivers of freshwater phyto-plankton structure. Hydrobiologia 698:121–131. doi:10.1007/s10750-012-1095-z
84. Galbraith LM, Burns CW (2010) Drivers of ciliate and phyto-plankton community structure across a range of water bodies insouthern New Zealand. J Plankton Res 32:327–339. doi:10.1093/plankt/fbp134
85. Lindström ES, Agterveld MPK, Zwart G (2005) Distribution oftypical freshwater bacterial groups is associated with pH, temper-ature, and lake water retention time. Appl Environ Microbiol 71:8201–8206. doi:10.1128/AEM.71.12.8201
86. Obertegger U, Flaim G, Braioni MG et al (2007) Water res-idence time as a driving force of zooplankton structure andsuccession. Aquat Sci 69:575–583. doi:10.1007/s00027-007-0924-z
87. Beaver JR, Jensen DE, Casamatta DA et al (2013) Response ofphytoplankton and zooplankton communities in six reservoirs ofthe middle Missouri River (USA) to drought conditions and amajor flood event. Hydrobiologia 705:173–189. doi:10.1007/s10750-012-1397-1
88. Straškraba M (1999) Retention time as a key variable of reservoirlimnology. In: Tundisi TG, Straškraba M (eds) Theoreticalreservervoir ecology and its applications. Brazilian Academyand Backhuys Publishers, São Carlos, pp 358–410
89. Mari X, Rochelle-Newall E, Torréton J-P et al (2007) Water resi-dence time: a regulatory factor of the DOM to POM transfer effi-c iency. Limnol Oceanogr 52:808–819. doi :10.4319/lo.2007.52.2.0808
90. Amaral JHF, Suhett AL, De Melo S, Farjalla VF (2013) Seasonalvariation and interaction of photodegradation and microbial me-tabolism of DOC in black water Amazonian ecosystems. AquatMicrob Ecol 70:157–168. doi:10.3354/ame01651
C. D. Domingues et al.
91. Pace ML, Findlay SEG, Lints D (1992) Zooplankton in advectiveenvironments: the Hudson River community and a comparativeanalysis. Can J Fish Aquat Sci 49:1060–1069. doi:10.1139/f92-117
92. Basu BK, Pick FR (1996) Factors regulating phytoplankton andzooplankton biomass in temperate rivers. Limnol Oceanogr 41:1572–1577
93. Reynolds CS (2006) Ecology of phytoplankton. CambridgeUniversity Press, NewYork. doi:10.1017/CBO9781107415324.004
94. Sarmento H, Montoya JM, Vazquez-Dominguez E et al (2010)Warming effects on marine microbial food web processes: howfar can we go when it comes to predictions? Philos Trans R SocLond B Biol Sci 365:2137–2149. doi:10.1098/rstb.2010.0045
95. Sasai Y (1989) Lake restoration by reduction of nutrient loading:expectations, experiences, extrapolations. Academia VerlagRicharz, St. Augustin
96. Artigas J, Soley S, Pérez-Baliero MC et al (2012) Phosphorus useby planktonic communities in a large regulated Mediterraneanriver. Sci Total Environ 426:180–187. doi:10.1016/j.scitotenv.2012.03.032
97. Farjalla VF, Esteves FDA, Bozelli RL, Roland F (2002) Nutrientlimitation of bacterial production in clear water Amazonian eco-sys tems. Hydrobiologia 489:197–205. doi :10.1023/A:1023288922394
98. Bratbak G, Thingstad TF (1985) Phytoplankton-bacteria inter-actions: an apparant paradox? Analysis of a model systemwith both competition and commensalism. Mar Ecol ProgSer 25:23–30. doi:10.3354/meps025023
99. Mindl B, Sonntag B, Pernthaler J et al (2005) Effects ofphosphorus loading on interactions of algae and bacteria:reinvestigation of the ‘phytoplankton-bacteria paradox’ ina continuous cultivation system. Aquat Microb Ecol 38:203–213. doi:10.3354/ame038203
100. Brett MT, Lubnow FS, Villar-Argaiz M et al (1999) Nutrient con-trol of bacterioplankton and phytoplankton dynamics. Aquat Ecol33:135–145. doi:10.1023/A:1009998915078
101. Callieri C, Stockner JG (2002) Freshwater autotrophicpicoplankton: a review. J Limnol 61:1–14. doi:10.4081/jlimnol.2002.1
102. Takamura N, Nojiri Y (1994) Picophytoplankton biomass in rela-tion to lake trophic state and the TN:TP ratio of lake water inJapan. J Phycol 30:439–444
103. Sarmento H, Unrein F, Isumbisho M et al (2008) Abundance anddistribution of picoplankton in tropical, oligotrophic Lake Kivu,eastern Africa. Freshw Biol 53:756–771. doi:10.1111/j.1365-2427.2007.01939.x
104. McCarthy MJ, Lavrentyev PJ, Yang L et al (2007) Nitrogen dy-namics and microbial food web structure during a summercyanobacterial bloom in a subtropical, shallow, well-mixed, eutro-phic lake (Lake Taihu, China). Hydrobiologia 581:195–207.doi:10.1007/s10750-006-0496-2
105. Baines SB, Pace ML (1991) The production of dissolved organicmatter by phytoplankton and its importance to bacteria: patternsacross marine and freshwater systems. Limnol Oceanogr 36:1078–1090
106. Jankowski K, Schindler DE, Horner-Devine MC (2014) Resourceavailability and spatial heterogeneity control bacterial communityresponse to nutrient enrichment in lakes. PLoS ONE 9:e86991.doi:10.1371/journal.pone.0086991
107. Sarmento H, Gasol JM (2012) Use of phytoplankton-derived dis-solved organic carbon by different types of bacterioplankton.Environ Microbiol 14:2348–2360. doi:10.1111/j.1462-2920.2012.02787.x
108. Pirlot S, Unrein F, Descy J, Servais P (2007) Fate of heterotrophicbacteria in Lake Tanganyika (East Africa). Microb Ecol 62:354–364. doi:10.1111/j.1574-6941.2007.00396.x
109. Tarbe A-L, Unrein F, Stenuite S et al (2011) Protist Herbivory: akey pathway in the pelagic food web of lake Tanganyika. MicrobEcol 62:314–323. doi:10.1007/s00248-011-9817-8
110. Šimek K, Hartman P, Nedoma J et al (1997) Community structure,picoplankton grazing and Zooplankton control of heterotrophicnanoflagellates in a eutrophic reservoir during the summer phyto-plankton maximum. Aquat Microb Ecol 12:49–63. doi:10.3354/ame012049
111. Jansson M, Blomqvist P, Jonsson A, Bergstrøm A-K (1996)Nutrient limitation of bacterioplankton, autotrophic andmixotrophic phytoplankton, and heterotrophic nanoflagellates inLake Örträsket. Limnol Oceanogr 41:1552–1559. doi:10.4319/lo.1996.41.7.1552
112. Gerea M, Saad JEF, Izaguirre I et al (2015) Presence, abundanceand bacterivory of the mixotrophic algae Pseudopedinella(Dictyochophyceae) in freshwater environments. Aquat MicrobEcol 76:219–232. doi:10.3354/ame01780
113. Saad JEF, Unrein F, Tribelli PM et al (2016) Influence of laketrophic conditions on the dominant mixotrophic algal assem-blages. J Plankton Res 38:818–829. doi:10.1093/plankt/fbw029
114. Azam F, Fenchel T, Field JG et al (1983) The ecological role ofwater-columnmicrobes in the sea.Mar Ecol Prog Ser 10:257–263.doi:10.3354/meps010257
115. Callieri C, Heinimaa S (1997) Microbial loop in the large subal-pine lakes. Mem Ist Ital Idrobiol 56:143–156
116. Šimek K, Jürgens K, Nedoma J et al (2000) Ecological role andbacterial grazing of Halteria spp.: small freshwater oligotrichs asdominant pelagic ciliate bacterivores. Aquat Microb Ecol 22:43–56. doi:10.3354/ame022043
117. Lansac-Tôha FA, Velho LFM, Perenha MCZ et al (2004)Abundance of planktonic ciliates in a cascading reservoirs of theParanapanema River, Brazil. Acta Sci Biol Sci 26:407–413
118. Pfister G, Auer B, Arndt H (2002) Pelagic ciliates (Protozoa,Ciliophora) of different brackish and freshwater lakes—a commu-nity analysis at the species level. Limnol Ecol Manag InlandWaters 32:147–168. doi:10.1016/S0075-9511(02)80005-6
119. Beaver JR, Crisman TL (1989) The role of ciliated protozoa inpelagic freshwater ecosystems. Microb Ecol 17:111–136.doi:10.1007/BF02011847
120. Foissner W, Berger H (1996) A user-friendly guide to the ciliates(Protozoa, Ciliophora) commonly used by hydrobiologists asbioindicators in rivers, lakes, and waste waters, with notes on theirecology. Freshw Biol 35:375–482
121. Gasol JM, Pedrós-Alió C, Vaqué D (2002) Regulation of bacterialassemblages in oligotrophic plankton systems: results from exper-imental and empirical approaches. Antonie Van Leeuwenhoek 81:435–452. doi:10.1023/A:1020578418898
122. Zöllner E, Santer B, Boersma M et al (2003) Cascading predationeffects of Daphnia and copepods on microbial food web compo-nents. Freshw Biol 48:2174–2193. doi:10.1046/j.1365-2426.2003.01158.x
123. Carpenter SR, Kitchell JF, Hodgson JR (1985) Cascading trophicinteractions and lake productivity. Bioscience 35:634–639
124. Araújo-Lima CARM, Agostinho AA, Fabré NN (1995)Trophic aspects of fish communities in Brazilian rivers andreservoirs. In: Tundisi JG, de Bicudo CEM, Matsumura-Tundisi T (eds) Limnology in Brazil. ABC/SBL, Rio deJaneiro, pp 105–136
125. Agostinho AA, Pelicice FM, Gomes LC (2008) Dams and the fishfauna of the Neotropical region: impacts and management relatedto diversity and fisheries. Braz J Biol 68:1119–1132. doi:10.1590/S1519-69842008000500019
126. Pinto-Coelho RM, Bezerra-Neto JF, De Miranda FP et al (2008)The inverted trophic cascade in tropical plankton communities:impacts of exotic fish in the Middle Rio Doce lake district,
Microbial Food Web in Tropical Reservoirs
Minas Gerais, Brazil. Braz J Biol 68:1025–1037. doi:10.1590/S1519-69842008000500010
127. Jürgens K,Wickham SA, Rothhaupt KO, Santer B (1996) Feedingrates of macro- and microzooplankton on heterotrophicnanoflagellates. Limnol Oceanogr 41:1833–1839
128. Jürgens K, Jeppesen E (2000) The impact of metazooplankton onthe structure of the microbial food web in a shallow, hypertrophiclake. J Plankton Res 22:1047–1070. doi:10.1093/plankt/22.6.1047
129. Burns CW, Schallenberg M (1996) Relative impacts of copepods,cladocerans and nutrients on the microbial food web of a meso-trophic lake. J Plankton Res 18:683–714. doi:10.1093/plankt/20.8.1501
130. Bonecker CC, NagaeMY, Bletller MCM et al (2007) Zooplanktonbiomass in tropical reservoirs in southern Brazil. Hydrobiologia579:115–123. doi:10.1007/s10750-006-0391-x
131. Burns CW, Schallenberg M (2001) Calanoid copepods versus cla-docerans: consumer effects on protozoa in lakes of different tro-phic status. Limnol Oceanogr 46:1558–1565. doi:10.4319/lo.2001.46.6.1558
132. Jürgens K, Matz C (2002) Predation as a shaping force for thephenotypic and genotypic composition of planktonic bacteria.Antonie Van Leeuwenhoek 81:413–434. doi:10.1023/A:1020505204959
133. Auer B, Arndt H (2001) Taxonomic composition and biomass ofheterotrophic flagellates in relation to lake trophy and season.Freshw Biol 46:959–972. doi:10.1046/j.1365-2427.2001.00730.x
134. Brown JH, Gillooly JF, Allen AP et al (2004) Toward a metabolictheory of ecology. Ecology 85:1771–1789. doi:10.1890/03-9000
C. D. Domingues et al.