Micro-air-gap based intrinsic Fabry–Perot interferometric fiber-optic ...
7
Micro-air-gap based intrinsic Fabry–Perot interferometric fiber-optic sensor Xiaopei Chen, Fabin Shen, Zhuang Wang, Zhenyu Huang, and Anbo Wang A simple intrinsic Fabry–Perot interferometric (IFPI) sensor is developed. The sensor is fabricated by two micro air gaps as reflective mirrors in a fiber to form a Fabry–Perot cavity. Theoretical and experimental studies of the sensor are described. Experimental results show that high resolution and high sensitivity can be achieved. Two structures of micro-air-gap-based IFPI sensors offer more applications than other IFPI sensors. © 2006 Optical Society of America OCIS codes: 060.0060, 060.2370, 120.2230. 1. Introduction Intrinsic Fabry–Perot interferometric (IFPI) sensors are well known for their applications in harsh envi- ronment and distributed sensing. A typical IFPI sen- sor consists of two partial reflectors inside the fiber. The fiber between the two reflectors is used as the sensing device. It is called an all-fiber sensor because the light never leaves the fiber. Unlike extrinsic Fabry–Perot interferometric (EFPI) sensors, IFPI sensors have a relative flexible length of the Fabry– Perot (FP) cavity. A long FP cavity length generally makes the IFPI sensor more sensitive to the pertur- bations to be measured. The reflectance of the inter- nal reflectors can be properly controlled to realize sensor multiplexing. Compared with EFPI sensors, IFPI sensors are usually more difficult or need more expensive equip- ment to fabricate. So far, three main methods to fab- ricate the internal reflectors of IFPI sensors have been reported. Lee and Taylor 1 introduced an IFPI sensor by producing a pair of thin-film internal mir- rors inside a fiber. 2 TiO 2 or Al thin films are coated on the cleaved fiber end faces by vacuum deposition, sputtering or electron-beam evaporation. Two fibers with one having a reflective coating are then fusion spliced to form an internal mirror. Tsai and Lin 3 introduced an IFPI sensor by splicing two fibers with different core diameters. In the fabrication, the fibers need to be polished by using four different polishing films to obtain high-quality end faces. 3 The Fabry– Perot (FP) cavity is formed between the interface of two fibers and the end face of the sensing fiber. The third type is UV-induced IFPI sensors. 4 An excimer laser is used to introduce a refractive index change in the core of photosensitive fibers. Two adjacent index changed points form a FP cavity. In this paper, we demonstrate a simple process to fabricate micro-air- gap-based IFPI sensors by differential wet chemical etching and fusion splicing. 2. Sensor Fabrication The fabrication process of the micro-air-gap-based IFPI sensor consists of three steps: wet chemical etching, fusion splicing, and cleave. The following subsections provide a detailed description of these steps. A. Wet Chemical Etching Differential wet chemical etching is widely used in fabrication of fiber tips for photon-scanning tunnel microscopes. 5–7 It takes advantage of different etch- ing rates between the fiber core and the fiber clad- ding. Both sharpened and hollowed structures can be formed on a fiber end by using a suitable buffered acid solution. In the fabrication of our sensors, we used the buffered hydrofluoric acid (BHF), which is a mixture of hydrofluoric acid (HF, 50% per weight), ammonium fluoride (NH 4 F, 40% per weight), and deionized (DI) water (H 2 O). The volume ratio of these components can be used to control the etching speed of different materials. The fiber used is Corning SMF-28, whose core is made out of Ge-doped silica The authors are with the Bradley Department of Electrical and Computer Engineering, Center for Photonics Technology, Virginia Polytechnic Institute and State University, Blacksburg, Virginia 24061-0111. X. Chen’s e-mail address is [email protected]. Received 3 February 2006; revised 5 April 2006; accepted 27 April 2006; posted 28 April 2006 (Doc. ID 67721). 0003-6935/06/307760-07$15.00/0 © 2006 Optical Society of America 7760 APPLIED OPTICS Vol. 45, No. 30 20 October 2006
Transcript of Micro-air-gap based intrinsic Fabry–Perot interferometric fiber-optic ...
Micro-air-gap based intrinsic Fabry–Perot interferometricfiber-optic sensor
Xiaopei Chen, Fabin Shen, Zhuang Wang, Zhenyu Huang, and Anbo Wang
A simple intrinsic Fabry–Perot interferometric (IFPI) sensor is developed. The sensor is fabricated by twomicro air gaps as reflective mirrors in a fiber to form a Fabry–Perot cavity. Theoretical and experimentalstudies of the sensor are described. Experimental results show that high resolution and high sensitivitycan be achieved. Two structures of micro-air-gap-based IFPI sensors offer more applications than otherIFPI sensors. © 2006 Optical Society of America
OCIS codes: 060.0060, 060.2370, 120.2230.
1. Introduction
Intrinsic Fabry–Perot interferometric (IFPI) sensorsare well known for their applications in harsh envi-ronment and distributed sensing. A typical IFPI sen-sor consists of two partial reflectors inside the fiber.The fiber between the two reflectors is used as thesensing device. It is called an all-fiber sensor becausethe light never leaves the fiber. Unlike extrinsicFabry–Perot interferometric (EFPI) sensors, IFPIsensors have a relative flexible length of the Fabry–Perot (FP) cavity. A long FP cavity length generallymakes the IFPI sensor more sensitive to the pertur-bations to be measured. The reflectance of the inter-nal reflectors can be properly controlled to realizesensor multiplexing.
Compared with EFPI sensors, IFPI sensors areusually more difficult or need more expensive equip-ment to fabricate. So far, three main methods to fab-ricate the internal reflectors of IFPI sensors havebeen reported. Lee and Taylor1 introduced an IFPIsensor by producing a pair of thin-film internal mir-rors inside a fiber.2 TiO2 or Al thin films are coated onthe cleaved fiber end faces by vacuum deposition,sputtering or electron-beam evaporation. Two fiberswith one having a reflective coating are then fusionspliced to form an internal mirror. Tsai and Lin3
introduced an IFPI sensor by splicing two fibers withdifferent core diameters. In the fabrication, the fibersneed to be polished by using four different polishingfilms to obtain high-quality end faces.3 The Fabry–Perot (FP) cavity is formed between the interface oftwo fibers and the end face of the sensing fiber. Thethird type is UV-induced IFPI sensors.4 An excimerlaser is used to introduce a refractive index change inthe core of photosensitive fibers. Two adjacent indexchanged points form a FP cavity. In this paper, wedemonstrate a simple process to fabricate micro-air-gap-based IFPI sensors by differential wet chemicaletching and fusion splicing.
2. Sensor Fabrication
The fabrication process of the micro-air-gap-basedIFPI sensor consists of three steps: wet chemicaletching, fusion splicing, and cleave. The followingsubsections provide a detailed description of thesesteps.
A. Wet Chemical Etching
Differential wet chemical etching is widely used infabrication of fiber tips for photon-scanning tunnelmicroscopes.5–7 It takes advantage of different etch-ing rates between the fiber core and the fiber clad-ding. Both sharpened and hollowed structures can beformed on a fiber end by using a suitable bufferedacid solution. In the fabrication of our sensors, weused the buffered hydrofluoric acid (BHF), which is amixture of hydrofluoric acid (HF, 50% per weight),ammonium fluoride (NH4F, 40% per weight), anddeionized (DI) water (H2O). The volume ratio of thesecomponents can be used to control the etching speedof different materials. The fiber used is CorningSMF-28, whose core is made out of Ge-doped silica
The authors are with the Bradley Department of Electrical andComputer Engineering, Center for Photonics Technology, VirginiaPolytechnic Institute and State University, Blacksburg, Virginia24061-0111. X. Chen’s e-mail address is [email protected].
Received 3 February 2006; revised 5 April 2006; accepted 27April 2006; posted 28 April 2006 (Doc. ID 67721).
0003-6935/06/307760-07$15.00/0© 2006 Optical Society of America
7760 APPLIED OPTICS � Vol. 45, No. 30 � 20 October 2006
borrego
Typewritten Text
Optical Society of America. Xiaopei Chen, Fabin Shen, Zhuang Wang, Zhenyu Huang, and Anbo Wang, "Micro-air-gap based intrinsic Fabry-Perot interferometric fiber-optic sensor," Appl. Opt. 45, 7760-7766 (2006). doi: 10.1364/ao.45.007760
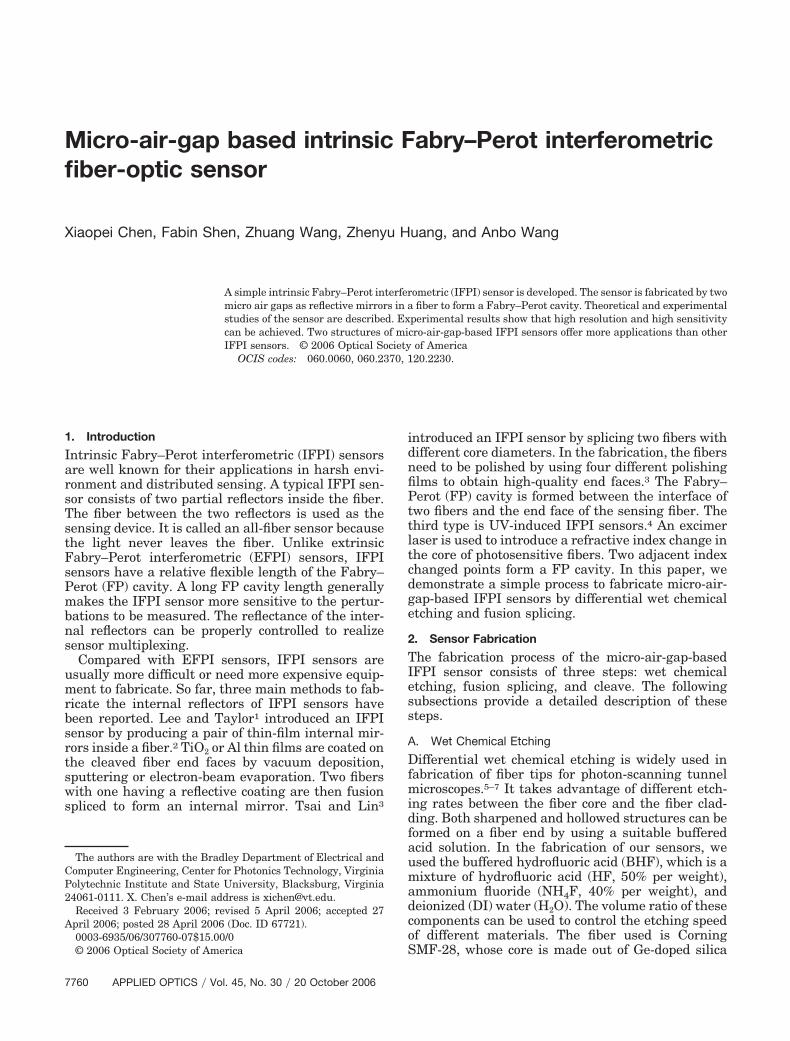
�SiO2 � GeO2�, and its cladding is pure silica �SiO2�.When a Ge-doped fiber is etched in BHF with a vol-ume ratio of NH4F:HF:H2O � X:1:1; if X � 1.7, thecore is etched faster than the cladding5; therefore, ahollowed pit is formed in the center of the fiber. Thedifferential etching process and the results are shownin Fig. 1.
Wet chemical etching is a single step process witha potential of batch fabrication. Two related issuesneed special attention during the sensor fabrication.The first is that the diameter of the cladding may bereduced too fast if the concentration of BHF is high.Small diameters may present difficulties to the align-ment of the fiber for fusion splicing (next step). Thesecond issue is that the etching may cause serioussurface roughness. Both problems can be overcome byusing the proper concentration of both HN4F andHF, while keeping the volume ratio of HN4F to HFgreater than 1.7.5
B. Fusion Splicing
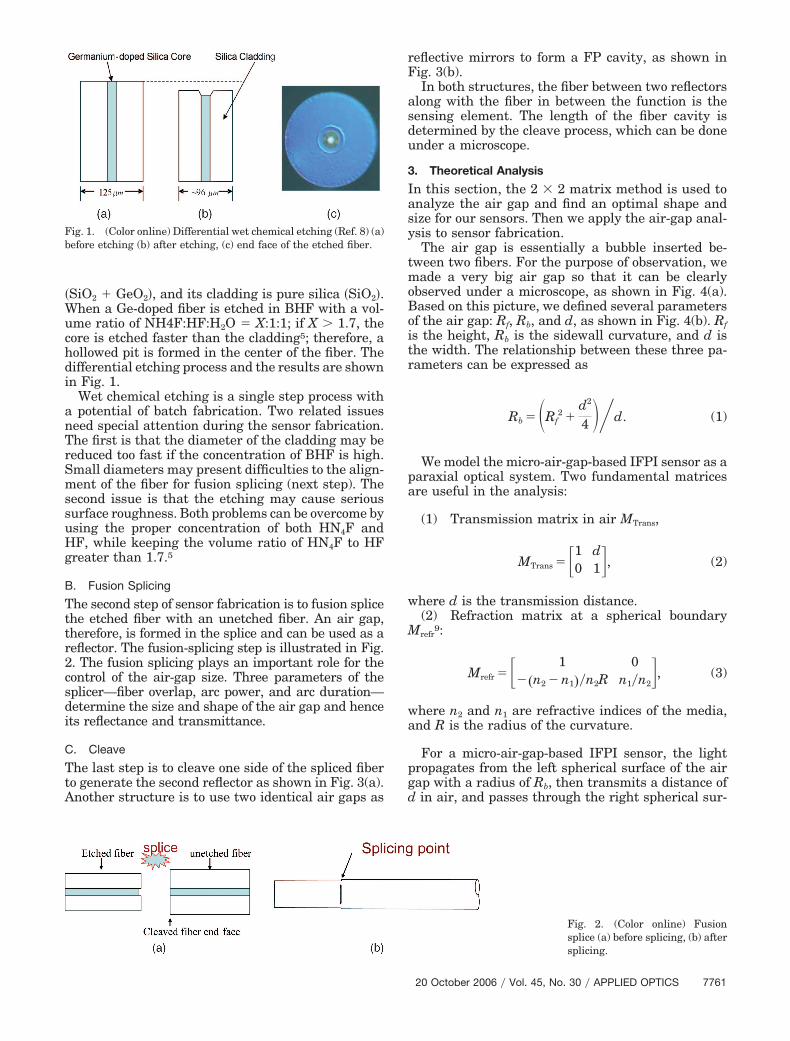
The second step of sensor fabrication is to fusion splicethe etched fiber with an unetched fiber. An air gap,therefore, is formed in the splice and can be used as areflector. The fusion-splicing step is illustrated in Fig.2. The fusion splicing plays an important role for thecontrol of the air-gap size. Three parameters of thesplicer—fiber overlap, arc power, and arc duration—determine the size and shape of the air gap and henceits reflectance and transmittance.
C. Cleave
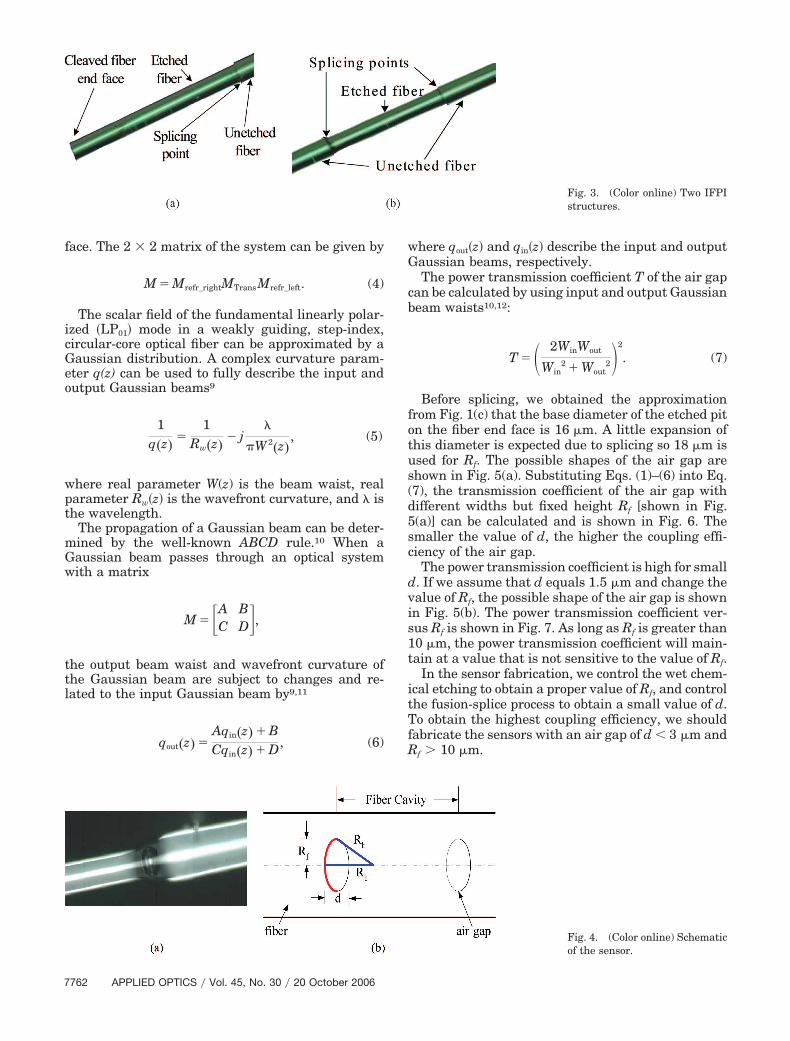
The last step is to cleave one side of the spliced fiberto generate the second reflector as shown in Fig. 3(a).Another structure is to use two identical air gaps as
reflective mirrors to form a FP cavity, as shown inFig. 3(b).
In both structures, the fiber between two reflectorsalong with the fiber in between the function is thesensing element. The length of the fiber cavity isdetermined by the cleave process, which can be doneunder a microscope.
3. Theoretical Analysis
In this section, the 2 � 2 matrix method is used toanalyze the air gap and find an optimal shape andsize for our sensors. Then we apply the air-gap anal-ysis to sensor fabrication.
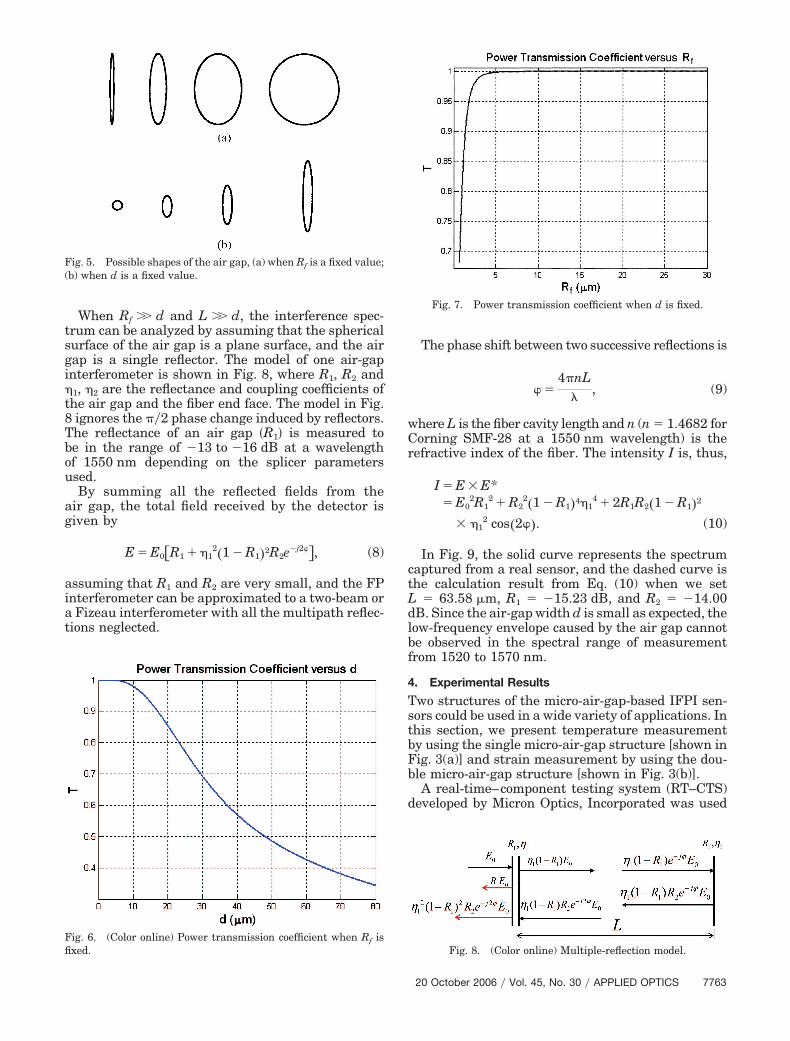
The air gap is essentially a bubble inserted be-tween two fibers. For the purpose of observation, wemade a very big air gap so that it can be clearlyobserved under a microscope, as shown in Fig. 4(a).Based on this picture, we defined several parametersof the air gap: Rf, Rb, and d, as shown in Fig. 4(b). Rf
is the height, Rb is the sidewall curvature, and d isthe width. The relationship between these three pa-rameters can be expressed as
Rb � �Rf2 �
d2
4 ��d. (1)
We model the micro-air-gap-based IFPI sensor as aparaxial optical system. Two fundamental matricesare useful in the analysis:
(1) Transmission matrix in air MTrans,
MTrans � �1 d0 1�, (2)
where d is the transmission distance.(2) Refraction matrix at a spherical boundary
Mrefr9:
Mrefr � � 1 0��n2 � n1��n2R n1�n2
�, (3)
where n2 and n1 are refractive indices of the media,and R is the radius of the curvature.
For a micro-air-gap-based IFPI sensor, the lightpropagates from the left spherical surface of the airgap with a radius of Rb, then transmits a distance ofd in air, and passes through the right spherical sur-
Fig. 1. (Color online) Differential wet chemical etching (Ref. 8) (a)before etching (b) after etching, (c) end face of the etched fiber.
Fig. 2. (Color online) Fusionsplice (a) before splicing, (b) aftersplicing.
20 October 2006 � Vol. 45, No. 30 � APPLIED OPTICS 7761
face. The 2 � 2 matrix of the system can be given by
M � Mrefr_rightMTransMrefr_left. (4)
The scalar field of the fundamental linearly polar-ized �LP01� mode in a weakly guiding, step-index,circular-core optical fiber can be approximated by aGaussian distribution. A complex curvature param-eter q(z) can be used to fully describe the input andoutput Gaussian beams9
1q�z�
�1
Rw�z�� j
�
�W2�z�, (5)
where real parameter W(z) is the beam waist, realparameter Rw�z� is the wavefront curvature, and � isthe wavelength.
The propagation of a Gaussian beam can be deter-mined by the well-known ABCD rule.10 When aGaussian beam passes through an optical systemwith a matrix
M � �A BC D�,
the output beam waist and wavefront curvature ofthe Gaussian beam are subject to changes and re-lated to the input Gaussian beam by9,11
qout�z� �Aqin�z� � BCqin�z� � D, (6)
where qout�z� and qin�z� describe the input and outputGaussian beams, respectively.
The power transmission coefficient T of the air gapcan be calculated by using input and output Gaussianbeam waists10,12:
T � � 2WinWout
Win2 � Wout
2�2
. (7)
Before splicing, we obtained the approximationfrom Fig. 1(c) that the base diameter of the etched piton the fiber end face is 16 �m. A little expansion ofthis diameter is expected due to splicing so 18 �m isused for Rf. The possible shapes of the air gap areshown in Fig. 5(a). Substituting Eqs. (1)–(6) into Eq.(7), the transmission coefficient of the air gap withdifferent widths but fixed height Rf [shown in Fig.5(a)] can be calculated and is shown in Fig. 6. Thesmaller the value of d, the higher the coupling effi-ciency of the air gap.
The power transmission coefficient is high for smalld. If we assume that d equals 1.5 �m and change thevalue of Rf, the possible shape of the air gap is shownin Fig. 5(b). The power transmission coefficient ver-sus Rf is shown in Fig. 7. As long as Rf is greater than10 �m, the power transmission coefficient will main-tain at a value that is not sensitive to the value of Rf.
In the sensor fabrication, we control the wet chem-ical etching to obtain a proper value of Rf, and controlthe fusion-splice process to obtain a small value of d.To obtain the highest coupling efficiency, we shouldfabricate the sensors with an air gap of d � 3 �m andRf � 10 �m.
Fig. 3. (Color online) Two IFPIstructures.
Fig. 4. (Color online) Schematicof the sensor.
7762 APPLIED OPTICS � Vol. 45, No. 30 � 20 October 2006
When Rf �� d and L �� d, the interference spec-trum can be analyzed by assuming that the sphericalsurface of the air gap is a plane surface, and the airgap is a single reflector. The model of one air-gapinterferometer is shown in Fig. 8, where R1, R2 and1, 2 are the reflectance and coupling coefficients ofthe air gap and the fiber end face. The model in Fig.8 ignores the ��2 phase change induced by reflectors.The reflectance of an air gap �R1� is measured tobe in the range of �13 to �16 dB at a wavelengthof 1550 nm depending on the splicer parametersused.
By summing all the reflected fields from theair gap, the total field received by the detector isgiven by
E � E0R1 � 12�1 � R1�2R2e
�j2, (8)
assuming that R1 and R2 are very small, and the FPinterferometer can be approximated to a two-beam ora Fizeau interferometer with all the multipath reflec-tions neglected.
The phase shift between two successive reflections is
�4�nL
�, (9)
where L is the fiber cavity length and n (n � 1.4682 forCorning SMF-28 at a 1550 nm wavelength) is therefractive index of the fiber. The intensity I is, thus,
I � E � E*� E0
2R12 � R2
2�1 � R1�414 � 2R1R2�1 � R1�2
� 12 cos�2�. (10)
In Fig. 9, the solid curve represents the spectrumcaptured from a real sensor, and the dashed curve isthe calculation result from Eq. (10) when we setL � 63.58 �m, R1 � �15.23 dB, and R2 � �14.00dB. Since the air-gap width d is small as expected, thelow-frequency envelope caused by the air gap cannotbe observed in the spectral range of measurementfrom 1520 to 1570 nm.
4. Experimental Results
Two structures of the micro-air-gap-based IFPI sen-sors could be used in a wide variety of applications. Inthis section, we present temperature measurementby using the single micro-air-gap structure [shown inFig. 3(a)] and strain measurement by using the dou-ble micro-air-gap structure [shown in Fig. 3(b)].
A real-time–component testing system (RT–CTS)developed by Micron Optics, Incorporated was used
Fig. 5. Possible shapes of the air gap, (a) when Rf is a fixed value;(b) when d is a fixed value.
Fig. 6. (Color online) Power transmission coefficient when Rf isfixed.
Fig. 7. Power transmission coefficient when d is fixed.
Fig. 8. (Color online) Multiple-reflection model.
20 October 2006 � Vol. 45, No. 30 � APPLIED OPTICS 7763
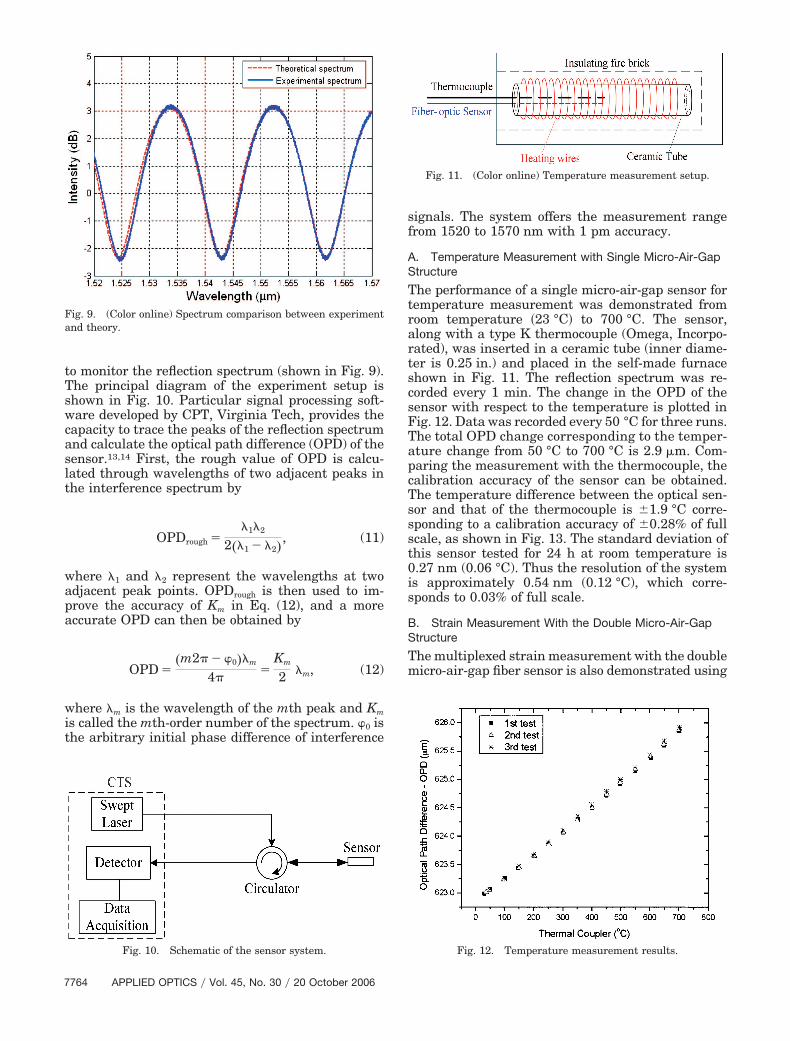
to monitor the reflection spectrum (shown in Fig. 9).The principal diagram of the experiment setup isshown in Fig. 10. Particular signal processing soft-ware developed by CPT, Virginia Tech, provides thecapacity to trace the peaks of the reflection spectrumand calculate the optical path difference (OPD) of thesensor.13,14 First, the rough value of OPD is calcu-lated through wavelengths of two adjacent peaks inthe interference spectrum by
OPDrough ��1�2
2��1 � �2�, (11)
where �1 and �2 represent the wavelengths at twoadjacent peak points. OPDrough is then used to im-prove the accuracy of Km in Eq. (12), and a moreaccurate OPD can then be obtained by
OPD ��m2� � 0��m
4��
Km
2 �m, (12)
where �m is the wavelength of the mth peak and Km
is called the mth-order number of the spectrum. 0 isthe arbitrary initial phase difference of interference
signals. The system offers the measurement rangefrom 1520 to 1570 nm with 1 pm accuracy.
A. Temperature Measurement with Single Micro-Air-GapStructure
The performance of a single micro-air-gap sensor fortemperature measurement was demonstrated fromroom temperature �23 °C� to 700 °C. The sensor,along with a type K thermocouple (Omega, Incorpo-rated), was inserted in a ceramic tube (inner diame-ter is 0.25 in.) and placed in the self-made furnaceshown in Fig. 11. The reflection spectrum was re-corded every 1 min. The change in the OPD of thesensor with respect to the temperature is plotted inFig. 12. Data was recorded every 50 °C for three runs.The total OPD change corresponding to the temper-ature change from 50 °C to 700 °C is 2.9 �m. Com-paring the measurement with the thermocouple, thecalibration accuracy of the sensor can be obtained.The temperature difference between the optical sen-sor and that of the thermocouple is �1.9 °C corre-sponding to a calibration accuracy of �0.28% of fullscale, as shown in Fig. 13. The standard deviation ofthis sensor tested for 24 h at room temperature is0.27 nm (0.06 °C). Thus the resolution of the systemis approximately 0.54 nm (0.12 °C), which corre-sponds to 0.03% of full scale.
B. Strain Measurement With the Double Micro-Air-GapStructure
The multiplexed strain measurement with the doublemicro-air-gap fiber sensor is also demonstrated using
Fig. 9. (Color online) Spectrum comparison between experimentand theory.
Fig. 10. Schematic of the sensor system.
Fig. 11. (Color online) Temperature measurement setup.
Fig. 12. Temperature measurement results.
7764 APPLIED OPTICS � Vol. 45, No. 30 � 20 October 2006
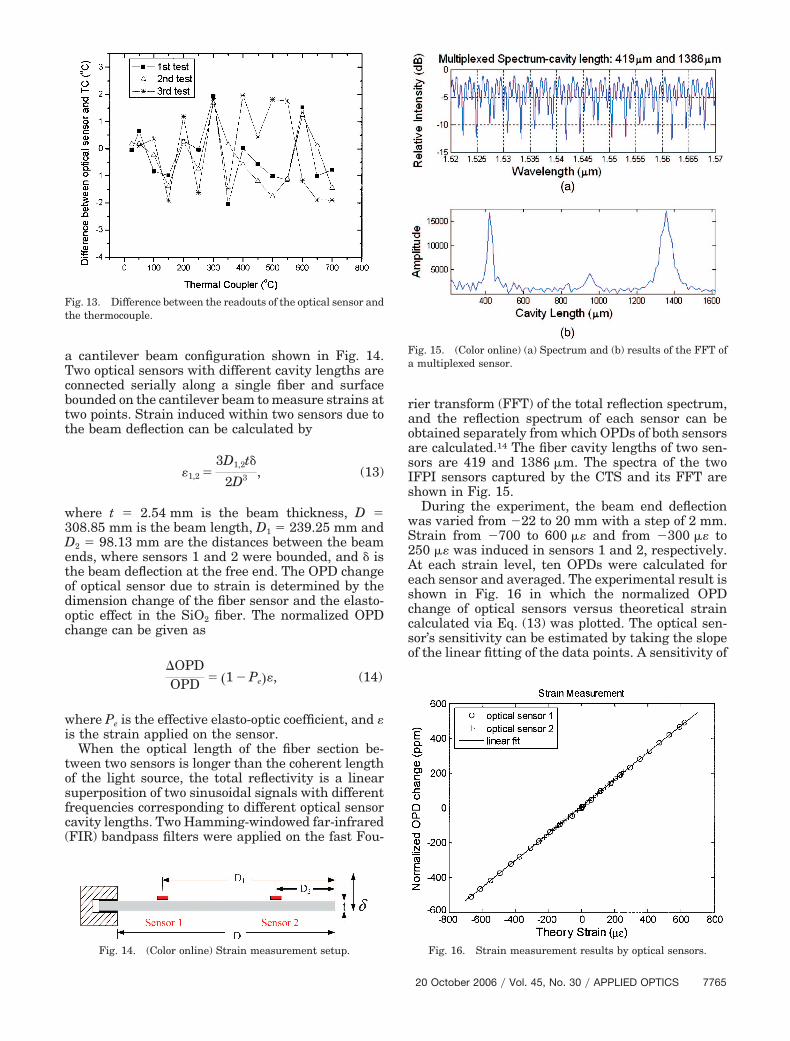
a cantilever beam configuration shown in Fig. 14.Two optical sensors with different cavity lengths areconnected serially along a single fiber and surfacebounded on the cantilever beam to measure strains attwo points. Strain induced within two sensors due tothe beam deflection can be calculated by
1,2 �3D1,2t�
2D3 , (13)
where t � 2.54 mm is the beam thickness, D �308.85 mm is the beam length, D1 � 239.25 mm andD2 � 98.13 mm are the distances between the beamends, where sensors 1 and 2 were bounded, and � isthe beam deflection at the free end. The OPD changeof optical sensor due to strain is determined by thedimension change of the fiber sensor and the elasto-optic effect in the SiO2 fiber. The normalized OPDchange can be given as
�OPDOPD � �1 � Pe� , (14)
where Pe is the effective elasto-optic coefficient, and is the strain applied on the sensor.
When the optical length of the fiber section be-tween two sensors is longer than the coherent lengthof the light source, the total reflectivity is a linearsuperposition of two sinusoidal signals with differentfrequencies corresponding to different optical sensorcavity lengths. Two Hamming-windowed far-infrared(FIR) bandpass filters were applied on the fast Fou-
rier transform (FFT) of the total reflection spectrum,and the reflection spectrum of each sensor can beobtained separately from which OPDs of both sensorsare calculated.14 The fiber cavity lengths of two sen-sors are 419 and 1386 �m. The spectra of the twoIFPI sensors captured by the CTS and its FFT areshown in Fig. 15.
During the experiment, the beam end deflectionwas varied from �22 to 20 mm with a step of 2 mm.Strain from �700 to 600 � and from �300 � to250 � was induced in sensors 1 and 2, respectively.At each strain level, ten OPDs were calculated foreach sensor and averaged. The experimental result isshown in Fig. 16 in which the normalized OPDchange of optical sensors versus theoretical straincalculated via Eq. (13) was plotted. The optical sen-sor’s sensitivity can be estimated by taking the slopeof the linear fitting of the data points. A sensitivity of
Fig. 13. Difference between the readouts of the optical sensor andthe thermocouple.
Fig. 14. (Color online) Strain measurement setup.
Fig. 15. (Color online) (a) Spectrum and (b) results of the FFT ofa multiplexed sensor.
Fig. 16. Strain measurement results by optical sensors.
20 October 2006 � Vol. 45, No. 30 � APPLIED OPTICS 7765
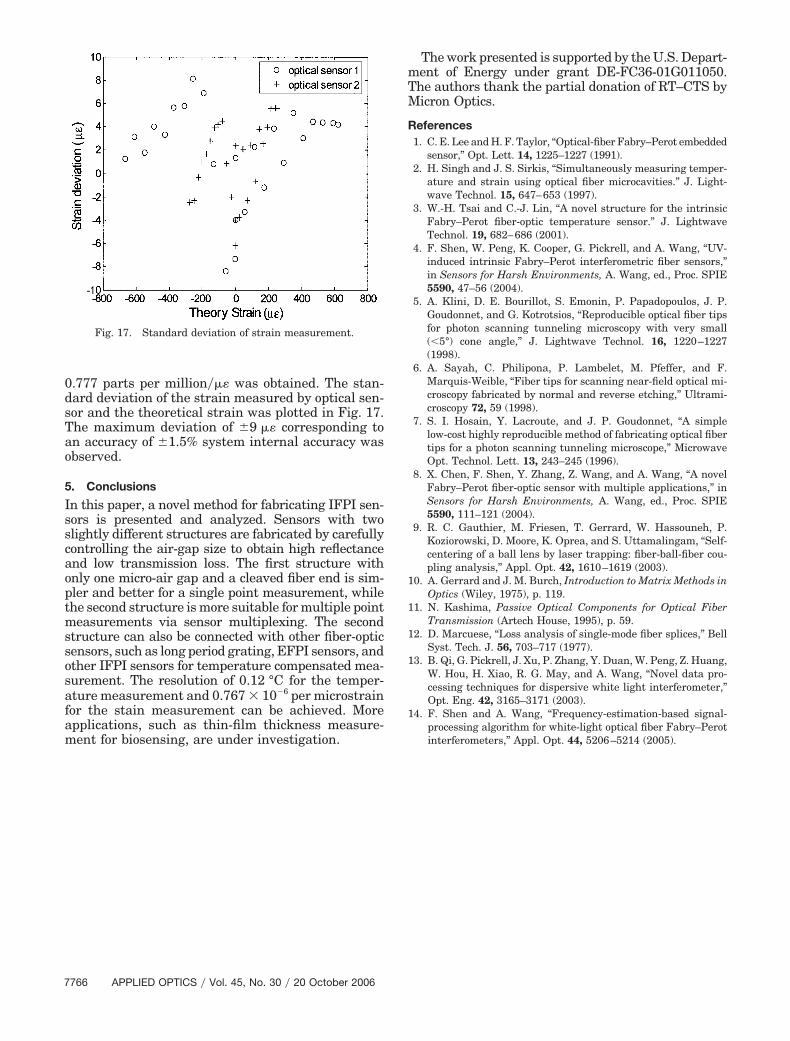
0.777 parts per million�� was obtained. The stan-dard deviation of the strain measured by optical sen-sor and the theoretical strain was plotted in Fig. 17.The maximum deviation of �9 � corresponding toan accuracy of �1.5% system internal accuracy wasobserved.
5. Conclusions
In this paper, a novel method for fabricating IFPI sen-sors is presented and analyzed. Sensors with twoslightly different structures are fabricated by carefullycontrolling the air-gap size to obtain high reflectanceand low transmission loss. The first structure withonly one micro-air gap and a cleaved fiber end is sim-pler and better for a single point measurement, whilethe second structure is more suitable for multiple pointmeasurements via sensor multiplexing. The secondstructure can also be connected with other fiber-opticsensors, such as long period grating, EFPI sensors, andother IFPI sensors for temperature compensated mea-surement. The resolution of 0.12 °C for the temper-ature measurement and 0.767 � 10�6 per microstrainfor the stain measurement can be achieved. Moreapplications, such as thin-film thickness measure-ment for biosensing, are under investigation.
The work presented is supported by the U.S. Depart-ment of Energy under grant DE-FC36-01G011050.The authors thank the partial donation of RT–CTS byMicron Optics.
References1. C. E. Lee and H. F. Taylor, “Optical-fiber Fabry–Perot embedded
sensor,” Opt. Lett. 14, 1225–1227 (1991).2. H. Singh and J. S. Sirkis, “Simultaneously measuring temper-
ature and strain using optical fiber microcavities.” J. Light-wave Technol. 15, 647–653 (1997).
3. W.-H. Tsai and C.-J. Lin, “A novel structure for the intrinsicFabry–Perot fiber-optic temperature sensor.” J. LightwaveTechnol. 19, 682–686 (2001).
4. F. Shen, W. Peng, K. Cooper, G. Pickrell, and A. Wang, “UV-induced intrinsic Fabry–Perot interferometric fiber sensors,”in Sensors for Harsh Environments, A. Wang, ed., Proc. SPIE5590, 47–56 (2004).
5. A. Klini, D. E. Bourillot, S. Emonin, P. Papadopoulos, J. P.Goudonnet, and G. Kotrotsios, “Reproducible optical fiber tipsfor photon scanning tunneling microscopy with very small(�5°) cone angle,” J. Lightwave Technol. 16, 1220–1227(1998).
6. A. Sayah, C. Philipona, P. Lambelet, M. Pfeffer, and F.Marquis-Weible, “Fiber tips for scanning near-field optical mi-croscopy fabricated by normal and reverse etching,” Ultrami-croscopy 72, 59 (1998).
7. S. I. Hosain, Y. Lacroute, and J. P. Goudonnet, “A simplelow-cost highly reproducible method of fabricating optical fibertips for a photon scanning tunneling microscope,” MicrowaveOpt. Technol. Lett. 13, 243–245 (1996).
8. X. Chen, F. Shen, Y. Zhang, Z. Wang, and A. Wang, “A novelFabry–Perot fiber-optic sensor with multiple applications,” inSensors for Harsh Environments, A. Wang, ed., Proc. SPIE5590, 111–121 (2004).
9. R. C. Gauthier, M. Friesen, T. Gerrard, W. Hassouneh, P.Koziorowski, D. Moore, K. Oprea, and S. Uttamalingam, “Self-centering of a ball lens by laser trapping: fiber-ball-fiber cou-pling analysis,” Appl. Opt. 42, 1610–1619 (2003).
10. A. Gerrard and J. M. Burch, Introduction to Matrix Methods inOptics (Wiley, 1975), p. 119.
11. N. Kashima, Passive Optical Components for Optical FiberTransmission (Artech House, 1995), p. 59.
12. D. Marcuese, “Loss analysis of single-mode fiber splices,” BellSyst. Tech. J. 56, 703–717 (1977).
13. B. Qi, G. Pickrell, J. Xu, P. Zhang, Y. Duan, W. Peng, Z. Huang,W. Hou, H. Xiao, R. G. May, and A. Wang, “Novel data pro-cessing techniques for dispersive white light interferometer,”Opt. Eng. 42, 3165–3171 (2003).
14. F. Shen and A. Wang, “Frequency-estimation-based signal-processing algorithm for white-light optical fiber Fabry–Perotinterferometers,” Appl. Opt. 44, 5206–5214 (2005).
Fig. 17. Standard deviation of strain measurement.
7766 APPLIED OPTICS � Vol. 45, No. 30 � 20 October 2006