Michigan Rural Health Profile · of the population in rural counties had some college education in...
113
Michigan Rural Health Profile: A Report on the Health Trends and Resources of Rural Michigan 1990-2005 www.michigan.gov/ruralhealth
Transcript of Michigan Rural Health Profile · of the population in rural counties had some college education in...

Michigan Rural Health Profile:
A Report on the Health Trends and Resources of Rural Michigan
1990-2005
www.michigan.gov/ruralhealth

Produced August 2008
Permission is granted for the reproduction of this publication provided that the reproductions contain appropriate reference to the source. Suggested citation: TL Wightman, IA Horste, E Speckman-Randall, LA Stratton, and LD Barnett. August 2008. Michigan Rural Health Profile: A Report on the Health Trends and Resources of Rural Michigan 1990-2005. Lansing, MI: Michigan Department of Community Health, Bureau of Health Policy, Planning, and Access, Health Planning and Access to Care Section. This project was financed in part through a grant from the U.S. Department of Health and Human Services, Health Resources and Services Administration, Office of Rural Health Policy. The opinions, findings, and conclusions expressed in this publication do not necessarily reflect the opinions or policies of the Federal Office of Rural Health Policy. MDCH is an equal opportunity employer, services & program provider.

Michigan Rural Health Profile - i
Table of Contents Acknowledgements and Credits ii Executive Summary iii
I. Introduction 1 II. Rural Definitions 2 III. State Characteristics 11 IV. Health Status 33 V. Health Resources 73 VI. Conclusion 94
Appendix A: Acronyms 95 Appendix B: List of Tables, Figures, and Maps 97

Michigan Rural Health Profile - ii
Acknowledgements and Credits The Health of Rural Michigan Profile Report was written as a contributing report for Michigan’s Strategic Opportunities for Rural Health Improvement 2008-2012 planning effort. Funding for this report came from the State Office of Rural Health Program which is funded by the Office of Rural Health Policy, Health Resources and Services Administration, Department of Health and Human Services. Special thanks to the staff of the Division of Health Records and Health Statistics under the supervision of Glenn Copeland. They provided data to calculate the rates used in this report, along with helping with the age-adjustment calculations for the different definitions of rural. Other offices that contributed data to this report include: Bureau of Epidemiology, Chronic Disease Epidemiology Section Bureau of Epidemiology, HIV/STD/Blood Borne Infections Surveillance Section Bureau of Epidemiology, Epidemiology Section Bureau of Epidemiology, Surveillance Section Bureau of Epidemiology, Division of Immunization Bureau of Health Policy, Planning, and Access, EMS and Trauma Systems Section Bureau of Health Policy, Planning, and Access, Health Planning and Access to Care Section Bureau of Health Policy, Planning, and Access, Health Policy Section Bureau of Health Professions, Licensing Division Bureau of Health Systems, CON Health Facilities Evaluation Section Bureau of Medicaid Program Operations and Quality Assurance, Data Management Division This document was written by:
Traci Wightman, Rural Health Planning Analyst, Health Policy, Regulation, and Professions Administration, Health Planning and Access to Care Section, Michigan Department of Community Health
Contributing authors include:
Lonnie Barnett Ian Horste Ellen Speckman-Randall Lisa Stratton
To print copies of the Michigan Rural Health Profile visit: http://www.michigan.gov/ruralhealth For additional information on this document, please contact the Health Planning and Access to Care Section at (517) 241-2966 or [email protected].

Michigan Rural Health Profile - iii
Executive Summary Beginning in April 2007, Michigan Department of Community Health (MDCH) and Michigan Center for Rural Health (MCRH) rolled out a collaborative initiative to update the State Rural Health Plan (SRHP) through the Michigan’s Strategic Opportunities for Rural Health Improvement (MI-SORHI) planning effort. As a background resource to guide the process, the information for the Michigan Rural Health Profile (MRHP) was compiled. The MRHP provides data on demographics, socio-economics, health indicators, and available health resources in rural Michigan.
To the extent possible, data in this report is aggregated and examined using U.S. Office of Management and Budget (US OMB) definitions of metropolitan, micropolitan and rural counties as shown in Figure 1.
Figure 1: Michigan Counties with Metropolitan, Micropolitan, and Rural Designations per the US OMB Definition

Michigan Rural Health Profile - iv
State Characteristics For the purpose of this report, rural Michigan is defined as all counties not in metropolitan counties, according to the US OMB. This area includes 57 counties, most of which are in northern Michigan. Rural Michigan accounts for about 19% of the state’s population, 75% of the state’s landmass, and has an average population density of 45 people per square mile. In 2005, Michigan’s population was estimated at over 10 million people. With the exception of the Upper Peninsula, all areas of Michigan saw population growth. In some regions growth was as high as fifteen percent, which is not attributed entirely to an increase in births or decrease in deaths. The annual birth rate has been decreasing in Michigan for a long time, while the annual death rate has been increasing. In some areas around rural Michigan, the annual birth and death rates are equal, which means that the growth is due to net migration.
Figure 2: Population Distribution by Age for Metropolitan, Micropolitan, and Rural Michigan, 1990
Figure 3: Population Distribution by Age for Metropolitan, Micropolitan, and Rural Michigan, 2005
0.0% 1.0% 2.0% 3.0% 4.0% 5.0% 6.0% 7.0% 8.0% 9.0%
Under 55-9
10-1415-1920-2425-2930-3435-3940-4445-4950-5455-5960-6465-6970-7475-7980-84
85 +
Age
Gro
up in
Yea
rs
Percentage of Area Population
Rural
Micropolitan
Metropolitan
0.0% 1.0% 2.0% 3.0% 4.0% 5.0% 6.0% 7.0% 8.0% 9.0%
Under 55-9
10-1415-1920-2425-2930-3435-3940-4445-4950-5455-5960-6465-6970-7475-7980-84
85 +
Age
Gro
up in
Yea
rs
Percentage of Area Population
Rural
Micropolitan
Metropolitan
The population of Michigan is aging (see Figures 2 and 3). The median age in 1990 was the 30-34 age group category for metropolitan, micropolitan and rural counties. By 2005, the median age was within the 35-39 age group for metropolitan and micropolitan counties and the 40-44 age group for rural counties. From 1990 to 2005, the percent of the population aged 45 to 59 increased by at least 50%, while the percent of the population aged 80 years or older increased by as much as 85% throughout Michigan. This trend is especially exaggerated in rural Michigan. During the same time period, the percent of the population aged 10 and under decreased by 10-15%, and it decreased for those aged 25 to 40 by as much as 20%. In 2000, 16.6% of the state population (for those aged 25 or older) had less than a high school diploma (or GED equivalent), which is an improvement from 1990, when 25% of the state population had less than a high school diploma. Rural county residents tend to have less education than residents in metropolitan and micropolitan counties. In 2000, 19.3% of rural county residents had not completed high school (or the equivalent), compared to the 16.5% of

Michigan Rural Health Profile - v
metropolitan county residents and 15.5% of micropolitan county residents. A lower percentage of the population in rural counties had some college education in 2000 (40.6%) compared to metropolitan county residents (53.8%) and micropolitan county residents (47.9%) (see Figures 4 and 5).
Rural counties in Michigan have higher percentages of poverty and unemployment than metropolitan counties. In 2006, Michigan’s unemployment rate was approximately seven percent, while in rural counties it was closer to nine percent. According to the 2000 US Census, about 25% of the population in metropolitan counties was below 200% of the Federal Poverty Level (FPL), while micropolitan counties had about 28% of the population under 200% FPL, and rural counties had about 32%. In other words, less than a fourth of the population was below 200% FPL in metropolitan counties, while almost a third of the population was below 200% FPL in rural counties.
Figure 4: Educational Attainment in Michigan, 1990 Census
Figure 5: Educational Attainment in Michigan, 2000 Census
0.0%
10.0%
20.0%
30.0%
40.0%
50.0%
60.0%
70.0%
80.0%
90.0%
Less thanHigh School
% Highschool or
More
% Somecollege or
More
% Bachelorsor More
% PostGraduateDegree
United States Michigan Metropolitan Micropolitan Rural
0.0%
10.0%
20.0%
30.0%
40.0%
50.0%
60.0%
70.0%
80.0%
90.0%
Less than HighSchool
% High Schoolor More
% SomeCollege or
More
% Bachelors orMore
% Post GradDegree
United States Michigan Metropolitan Micropolitan Rural
Michigan Rural Health Profile - vi
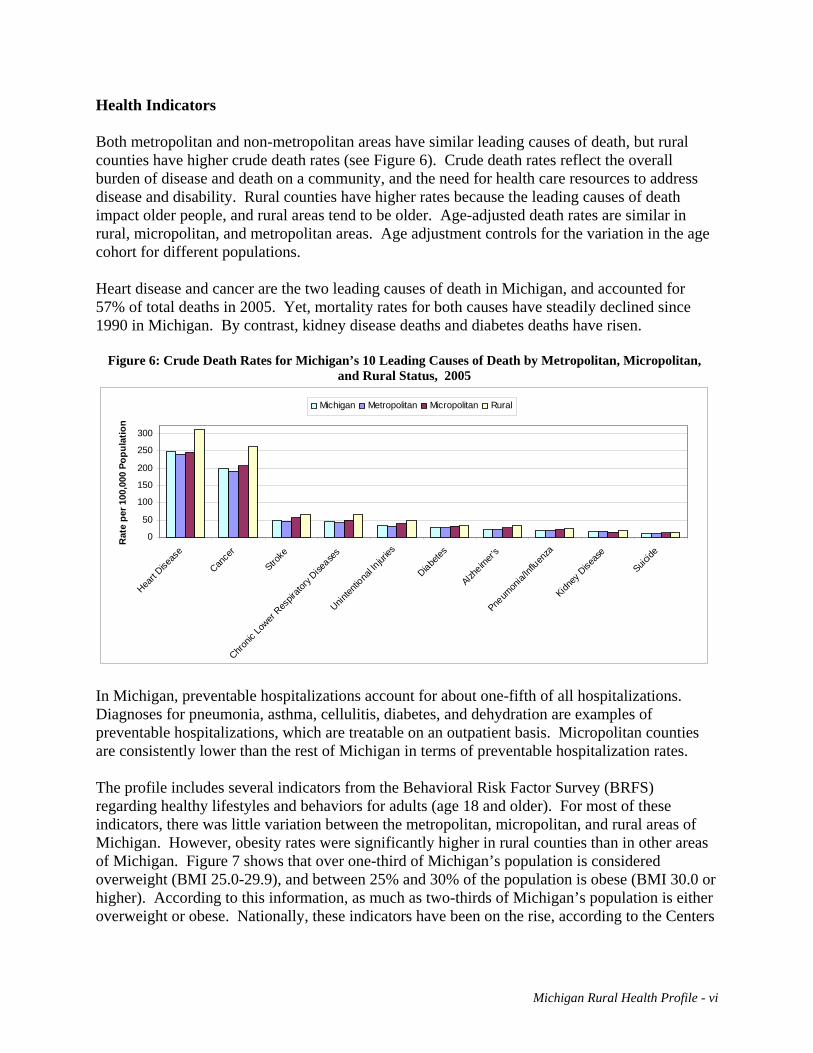
Health Indicators Both metropolitan and non-metropolitan areas have similar leading causes of death, but rural counties have higher crude death rates (see Figure 6). Crude death rates reflect the overall burden of disease and death on a community, and the need for health care resources to address disease and disability. Rural counties have higher rates because the leading causes of death impact older people, and rural areas tend to be older. Age-adjusted death rates are similar in rural, micropolitan, and metropolitan areas. Age adjustment controls for the variation in the age cohort for different populations. Heart disease and cancer are the two leading causes of death in Michigan, and accounted for 57% of total deaths in 2005. Yet, mortality rates for both causes have steadily declined since 1990 in Michigan. By contrast, kidney disease deaths and diabetes deaths have risen.
Figure 6: Crude Death Rates for Michigan’s 10 Leading Causes of Death by Metropolitan, Micropolitan, and Rural Status, 2005
0
50
100
150
200
250
300
Heart D
iseas
e
Cance
r
Stroke
Chronic
Lower
Respir
atory
Disease
s
Uninten
tiona
l Injur
ies
Diabetes
Alzheim
er's
Pneum
onia/
Influen
za
Kidney
Dise
ase
Suicide
Rat
e pe
r 100
,000
Pop
ulat
ion
Michigan Metropolitan Micropolitan Rural
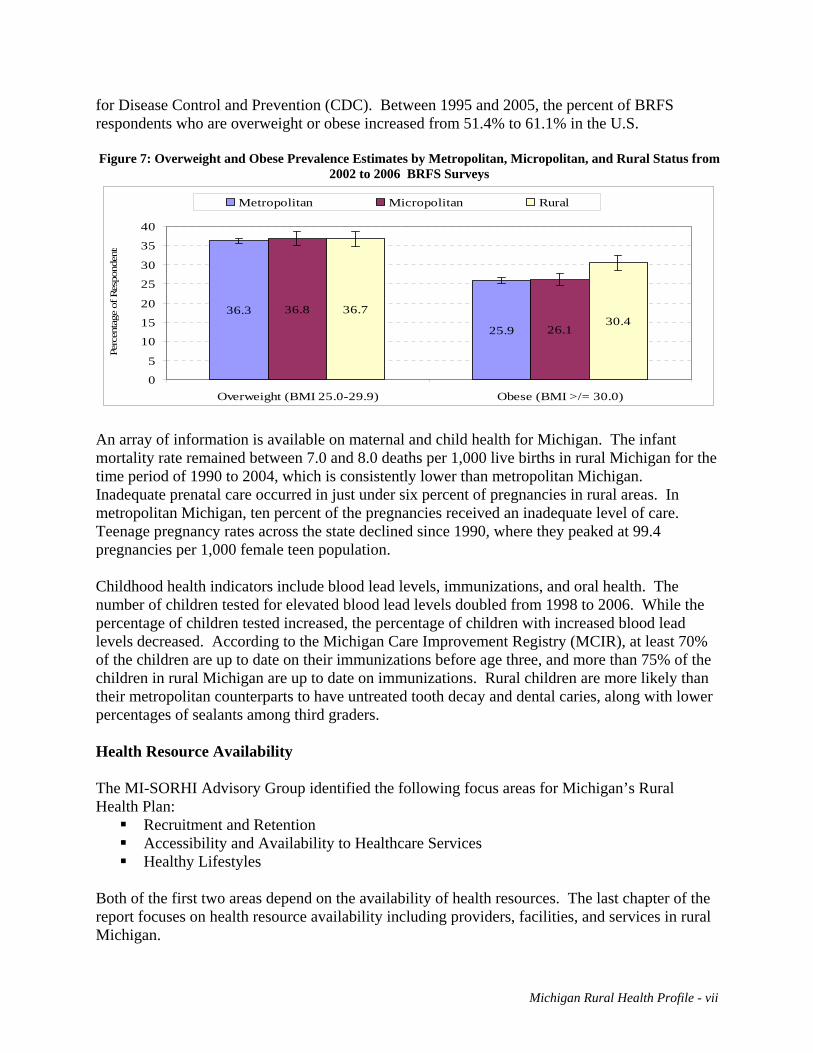
In Michigan, preventable hospitalizations account for about one-fifth of all hospitalizations. Diagnoses for pneumonia, asthma, cellulitis, diabetes, and dehydration are examples of preventable hospitalizations, which are treatable on an outpatient basis. Micropolitan counties are consistently lower than the rest of Michigan in terms of preventable hospitalization rates. The profile includes several indicators from the Behavioral Risk Factor Survey (BRFS) regarding healthy lifestyles and behaviors for adults (age 18 and older). For most of these indicators, there was little variation between the metropolitan, micropolitan, and rural areas of Michigan. However, obesity rates were significantly higher in rural counties than in other areas of Michigan. Figure 7 shows that over one-third of Michigan’s population is considered overweight (BMI 25.0-29.9), and between 25% and 30% of the population is obese (BMI 30.0 or higher). According to this information, as much as two-thirds of Michigan’s population is either overweight or obese. Nationally, these indicators have been on the rise, according to the Centers
Michigan Rural Health Profile - vii
for Disease Control and Prevention (CDC). Between 1995 and 2005, the percent of BRFS respondents who are overweight or obese increased from 51.4% to 61.1% in the U.S. Figure 7: Overweight and Obese Prevalence Estimates by Metropolitan, Micropolitan, and Rural Status from
2002 to 2006 BRFS Surveys
36.3
25.9
36.8
26.1
36.730.4
0
5
10
15
20
25
30
35
40
Overweight (BMI 25.0-29.9) Obese (BMI >/= 30.0)
Perc
enta
ge o
f Res
pond
ents
Metropolitan Micropolitan Rural
An array of information is available on maternal and child health for Michigan. The infant mortality rate remained between 7.0 and 8.0 deaths per 1,000 live births in rural Michigan for the time period of 1990 to 2004, which is consistently lower than metropolitan Michigan. Inadequate prenatal care occurred in just under six percent of pregnancies in rural areas. In metropolitan Michigan, ten percent of the pregnancies received an inadequate level of care. Teenage pregnancy rates across the state declined since 1990, where they peaked at 99.4 pregnancies per 1,000 female teen population. Childhood health indicators include blood lead levels, immunizations, and oral health. The number of children tested for elevated blood lead levels doubled from 1998 to 2006. While the percentage of children tested increased, the percentage of children with increased blood lead levels decreased. According to the Michigan Care Improvement Registry (MCIR), at least 70% of the children are up to date on their immunizations before age three, and more than 75% of the children in rural Michigan are up to date on immunizations. Rural children are more likely than their metropolitan counterparts to have untreated tooth decay and dental caries, along with lower percentages of sealants among third graders. Health Resource Availability The MI-SORHI Advisory Group identified the following focus areas for Michigan’s Rural Health Plan:
Recruitment and Retention Accessibility and Availability to Healthcare Services Healthy Lifestyles
Both of the first two areas depend on the availability of health resources. The last chapter of the report focuses on health resource availability including providers, facilities, and services in rural Michigan.

Michigan Rural Health Profile - viii
Michigan has a shortage of healthcare providers, as evidenced by the number of Health Professional Shortage Areas (HPSAs) designated by HRSA in 2007. In rural Michigan, 52 of 57 non-metropolitan counties have primary medical care HPSAs (91%); 39 counties have dental health care HPSAs (68%), and 41 counties have mental health HPSAs (72%). To alleviate the shortage of providers, there is a need for about 450 additional provider Full-time Equivalents (FTEs). Rural Michigan needs an additional 185 providers, which accounts for 40% of the unmet need statewide. According to the Council of Graduate Medical Education (COGME), a physician ratio of greater than 300 per 100,000 population is needed to meet future demand. In Michigan in 2007, there were 272.9 physicians per 100,000 population, which is less than sufficient (see Figure 8). Rural Michigan only has about half the number of physicians that will be needed. This shortage will be compounded by the fact that 34% of the active physicians practicing in Michigan plan to retire within the next ten years, according to the most recent physician survey report published by Michigan Department of Community Health (2006).
Figure 8: Licensed Physicians and Physician Assistants per 100,000 Population, 2007
222.0
150.3
95.0
50.9 53.8
36.3 40.626.7 27.1 28.1
21.4
243.7
0
25
50
75
100
125
150
175
200
225
250
Michigan Metro Micro Rural
MD DO PA
Different types of out-patient primary care clinics are available in Michigan. In some counties, out-patient clinics are the only available health care facilities. In these areas, out-patient facilities are crucial for primary medical care and responsive EMS is critical for patient survival in the event of an emergency. Safety net facilities providing care to underserved populations throughout Michigan include Free Clinics, Federally Qualified Health Centers, Rural Health Clinics, and Local Health Departments. Currently, there are 313 safety net clinics throughout rural Michigan providing care. This includes 156 federally designated Rural Health Clinics, 43 Federally Qualified Health Center

Michigan Rural Health Profile - ix
(FQHC) sites, and 16 Free Clinics. Many of these charge based on the patient’s ability to pay using a sliding fee scale. One-third of the state’s acute care hospitals are located in rural Michigan, including the 34 designated Critical Access Hospitals. All of the hospitals provide basic hospital care and most are equipped with an Emergency Room, but only a handful of the hospitals provide more advanced services, and the most advanced services (such as an organ transplant) are only offered in large hospitals in metropolitan Michigan. Between 2002 and 2004, Michigan residents averaged 4 million (3,915,885) Emergency Room (ER) visits a year. Rural Michigan accounted for 20 percent of the total annual number of ER visits in Michigan. Overall, one in five patients in the ER is under the age of fifteen. Conclusions Several factors contribute to the lack of access to or availability of healthcare services in rural Michigan, including lack of resources, sparse population, geographic isolation, providers not taking new patients, a patient’s inability to pay for services, and providers not accepting types of coverage. Provider shortage also plays a role in the lack of services, along with reimbursement issues, long waits for appointments, and long distances to travel for services. All of these factors contribute to access problems in rural Michigan. Some areas of non-metropolitan Michigan are growing rapidly, including areas in the northern Lower Peninsula. This can cause problems with an infrastructure that may not be able to handle the growth. While the population is increasing in many areas, the age demographic is changing, because the population as a whole is getting older. The population increase in these areas is due to in-migration of an older population group. And there is out-migration of the younger age groups.

Introduction Beginning in April 2007, Michigan Department of Community Health (MDCH) and Michigan Center for Rural Health (MCRH) collaborated on updating the State Rural Health Plan (SRHP) through the Michigan’s Strategic Opportunities for Rural Health Improvement (MI-SORHI) planning effort. A 13-member Advisory Group was established, with representatives from various organizations, trade associations, and rural regions. The Advisory Group began assessing the health status in Michigan’s rural areas. Using this information, they identified the top three rural health issues to be addressed in the MI-SORHI Plan. As a background resource to guide the process, information for the Michigan Rural Health Profile (MRHP) was compiled. The MRHP provides data on demographics, socio-economics, health indicators, and available health resources in rural Michigan. Select data from the report were presented to the MI-SORHI Advisory Group. The chapters in this report address the following:
Defining Rural – the federal government has several different definitions of “rural”, which includes the Office of Management and Budget (US OMB) definition of Metropolitan Statistical Areas, Micropolitan Statistical Areas, and Rural Areas (MMR), which are used for the purpose of this report.
State Characteristics – this includes geographic, demographic, and socio-economic
characteristics throughout Michigan.
Health Status – uses indicators identified in Michigan’s Critical Health Indicators Report, but includes additional data.
Health Resources – includes health facility and manpower statistics of rural Michigan.
Michigan Rural Health Profile – 1

Defining Rural There is no single, universally preferred definition of “rural;” a variety of definitions have been created for various purposes. Some definitions are built around geographical units such as the county, zip code or census tract. Others combine geographic units with population or provider characteristics to insure intended rural areas are targeted. The two most widely used definitions come from the United States Census Bureau and the Office of Management and Budget (US OMB). U.S. Office of Management & Budget: Metropolitan & Micropolitan Statistical Areas
Office of Management and Budget (US OMB) Bulletin No. 07-01, issued December 18, 2006, established “metropolitan statistical area” and “micropolitan statistical area” as the US OMB classification system. US OMB defines a metropolitan statistical area as “at least one urbanized area with a minimum of 50,000 inhabitants, and the adjacent territory that has a high degree of economic and social integration with that core, as measured by commuting ties.” A micropolitan statistical area is defined as “at least one urban cluster of at least 10,000, but less than 50,000 population, plus adjacent territory that has a high degree of social and economic integration with
Map RD-1: Metropolitan, Micropolitan, and Rural Counties per the US OMB Definition
Michigan Rural Health Profile – 2

the core, as measured by commuting ties.” The areas that area not classified as either metropolitan or micropolitan are defined as rural. Map RD-1 shows the metropolitan, micropolitan, and rural status of Michigan.
Using counties as the geographical boundary is advantageous because county borders tend to be stable over time. Also, counties have clear jurisdictional lines for political entities, making it easier to assign programs to specific areas and to track progress. The use of a county as a population unit can have its disadvantages, too. County size can vary substantially, particularly in the north. Resources for a smaller county may be stretched if they have to cover the geographical area of a much larger county. Population size also varies across the state within county borders. The most populous counties have the smallest land area, resulting in much larger population densities. Large populations can tax these resources, resulting in resource shortages. Finally, larger counties may consist of populous urban areas with isolated or semi-isolated rural areas, creating a problem for programs aimed at assisting rural areas. These rural or isolated areas in the larger county would not qualify for programming that uses county boundaries as the population unit.
According to US OMB Bulletin No. 07-01, this “classification includes about 93 percent of the U.S. population – about 83 percent in metropolitan statistical areas and about 10 percent in micropolitan statistical areas. Of 3,141 counties in the United States, 1,092 will be in the 363 metropolitan statistical areas in the United States and 693 counties will be in the 576 micropolitan statistical areas (1,356 counties will remain outside the classification).”i
iiTable RD-1: US OMB Designation by County Population# of Michigan
Counties Size Metropolitan Micropolitan Rural
500,000 + 4 4 -- -- 100,000 – 500,000 16 15 1 -- 50,000 – 100,000 15 6 7 2 Less than 50,000 48 1 15 32 Total 83 26 (31%) 23 (28%) 34 (41%)
Table RD-1 shows the population range for each of Michigan’s counties, based on how they are designated by the US OMB as Metropolitan Statistical Areas, Micropolitan Statistical Areas, or Rural. Many of the counties are given the metropolitan, micropolitan, or rural status consistent with that county’s population. For example, all four of Michigan’s counties that have more than 500,000 residents are in Metropolitan Statistical Areas along with 15 of the 16 counties with populations between 100,000 and 500,000. For example, a single county with metropolitan status also has a population of less than 50,000, but it is counted in a Metropolitan Statistical Area due to its proximity to an urban center. This particular county is highly agricultural, and does not necessarily have access to the infrastructure or resources of the neighboring, more populated counties.
Michigan Rural Health Profile – 3
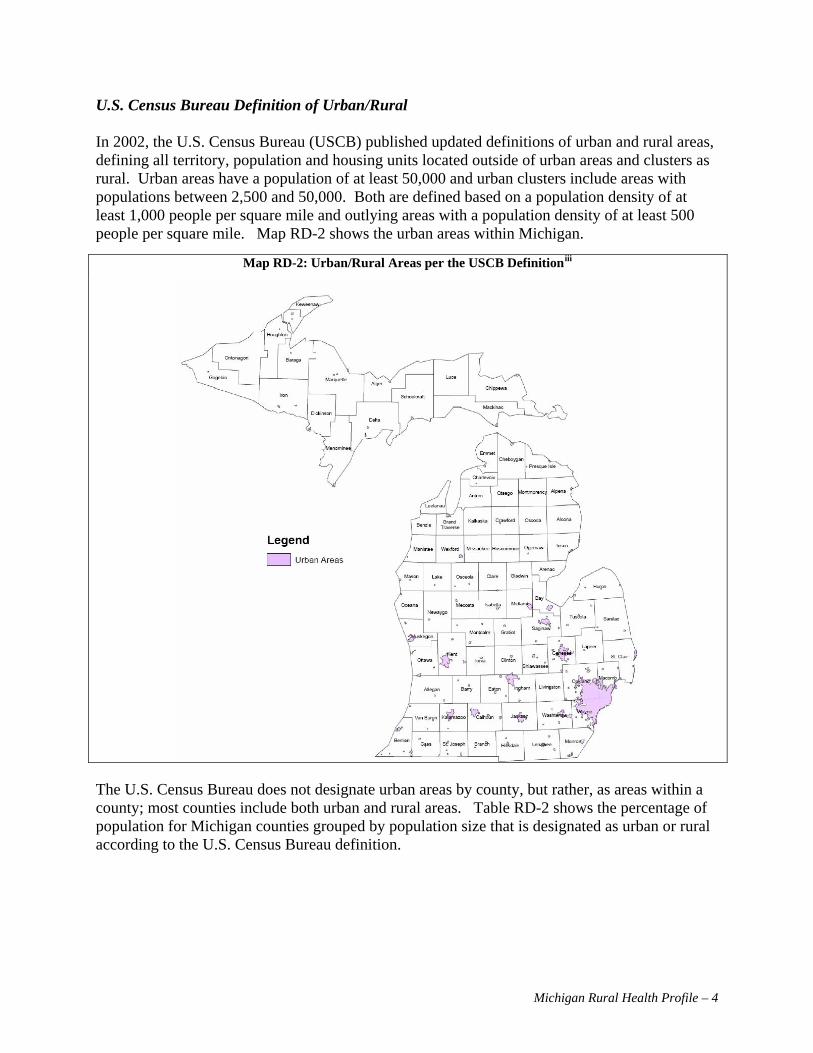
U.S. Census Bureau Definition of Urban/Rural In 2002, the U.S. Census Bureau (USCB) published updated definitions of urban and rural areas, defining all territory, population and housing units located outside of urban areas and clusters as rural. Urban areas have a population of at least 50,000 and urban clusters include areas with populations between 2,500 and 50,000. Both are defined based on a population density of at least 1,000 people per square mile and outlying areas with a population density of at least 500 people per square mile. Map RD-2 shows the urban areas within Michigan.
iiiMap RD-2: Urban/Rural Areas per the USCB Definition
The U.S. Census Bureau does not designate urban areas by county, but rather, as areas within a county; most counties include both urban and rural areas. Table RD-2 shows the percentage of population for Michigan counties grouped by population size that is designated as urban or rural according to the U.S. Census Bureau definition.
Michigan Rural Health Profile – 4

ivTable RD-2: US Census Bureau Definition of Urban vs. Rural Classification by County Population
Total Rural Population
The four largest counties in Michigan each have a population of more than 500,000 people and together contain 46 percent of the state’s entire population, according to the 2000 Census. However, these counties have up to 15 percent of their population in rural areas. Among counties with a population between 100,001 and 500,000 (16 of 83), all, except one (Allegan) have less than 50 percent of their population settled in rural areas, while Allegan has 70 percent of its population in rural areas. Of the 15 counties that have between 50,001 and 100,000 people, Marquette and Midland are the only two counties with less than half of their population in rural areas. In Michigan’s 48 counties with less than 50,000 residents, only four have more than half of their populations in urban areas.
Geography Total population Total Urban Population % Rural % Urban
Michigan Total 9,938,444 7,419,457 75% 2,518,987 25% 1,140,321 307,921 4% 832,400 33% <50,000 (48) 1,039,341 396,997 5% 642,344 26% 50,000-100,000 (15) 3,140,980 2,283,170 31% 857,810 34% 100,000-500,000 (16) 4,617,802 4,431,369 60% 186,433 7% 500,000+ (4)
Michigan Rural Health Profile – 5

Federal Office of Rural Health Policy The Federal Office of Rural Health Policy (FORHP) utilizes a definition of rural that combines both the USCB and US OMB definitions. The FORHP classifications are called Rural Urban Commuting Areas, or RUCAs. This tends to be more inclusive, and may even include isolated rural areas in metropolitan counties, depending on the degree of integration that area has with the urban center. Map RD-3 shows the RUCAs for Michigan. They are based on census tracts, and on this map the tracts with the same RUCA number are combined to form larger areas. For ORHP purposes, any area with a score of 4 (Large Town) or higher are defined as “rural”. Much of Michigan's health status indicators are only available by county and cannot be separated out by smaller units, such as census tracts, so this classification can present a problem.
Michigan Rural Health Profile – 6

vMap RD-3: Rural Urban Commuting Areas (RUCAs) per the ORHP Definition
Michigan Rural Health Profile – 7

Definitions of Rural Used in the Report Metropolitan vs. Non-Metropolitan Counties To the extent possible, data in this report will be aggregated and examined using U.S. Office of Management and Budget (US OMB) definitions of metropolitan, micropolitan and rural counties. Map RD-4 has the counties shaded based on their designation under the US OMB definition. The dark shaded counties are the Metropolitan counties, the lighter counties are Micropolitan, and those without shading are rural counties.
Map RD-4: Michigan Counties with Metropolitan, Micropolitan, and Rural Designations per the US OMB Definition
Michigan Rural Health Profile – 8

Michigan’s State of the State Survey Regions Additionally, Michigan will be looked at and compared by geographic regions. Many counties, particularly in rural areas of the state, do not have large enough samples to effectively make single-county comparisons, therefore, data are aggregated in groupings of 10 to 20 counties. The regions used in this report are defined by the State of the State Survey (SOSS), minus the Detroit region, which is included in the southeast Michigan region.
Map RD-5: State of the State Survey Regions in Michigan
*NOTE: Only 6 of the 7 SOSS regions are shown; for this report, Detroit City and Southeast Michigan have been combined.
In some cases, data in this report was not available by US OMB or SOSS regions and it was necessary to incorporate data that relied on other definitions of “rural”. In all cases, an attempt was made to delineate the definition of rural that was used.
Michigan Rural Health Profile – 9

Regional Overlap Map RD-6 shows where the SOSS regions overlap the counties designated as metropolitan, micropolitan, and rural. In general, the further south the region is, the higher the percentage of metropolitan counties. No metropolitan counties are in the Northern Lower or Upper Peninsula regions. Less than half of the counties are metropolitan in the central regions (East and West). Almost all of the counties in the southern regions are metropolitan.
Map RD-6: How State of the State Survey Regions Overlap the OMB designation of Metropolitan, Micropolitan, and Rural Counties in Michigan
*NOTE: Only 6 of the 7 SOSS regions are shown; for this report, Detroit City and Southeast Michigan have been combined.
Michigan Rural Health Profile – 10

i US OMB Bulletin No. 07-01: Update of Statistical Area Definitions and Guidance on Their Uses. ii Source: U.S. Census Bureau. 2000 Census Statistics, SF1 Table. iii US Federal Register: 67 FR 11663-11670 iv Source: Census 2000 Urban and Rural Classification v Source: RUCA Census Tract file from ORHP that classifies each census tract. The map was modified by grouping census tracts with the same classification.
Michigan Rural Health Profile – 11

State Characteristics
Geography Michigan is one of the most recognizable states in the union, composed of two peninsulas, one of which is shaped like a mitten. The state covers 58,000 square miles, according to the Michigan Department of Environmental Quality (DEQ), with 2,147 miles of shoreline along the Great Lakes and 11,000 inland lakes and ponds. The Upper Peninsula (UP) peaks at 550 feet above sea level. The Hiawatha National Forest spans the southern portion of the UP and the Ottawa National Forest and Porcupine Mountain Wilderness State Park occupy the western section. The Upper and Lower Peninsulas are connected at the Mackinac Bridge, which is a five-mile long suspension bridge spanning the Straits of Mackinac, where the waters of Lake Huron and Lake Michigan meet. Michigan is ranked 11th out of 50 in landmass, but only ranked 22nd in terms of useable land. Michigan’s neighbors include Wisconsin (connected to the western part of the Upper Peninsula), Illinois, Indiana, and Ohio. Michigan shares a border with Canada, and has U.S. Customs crossings in Detroit, Port Huron and Sault Ste. Marie. Aside from the border shared with Wisconsin in the Upper Peninsula, car ferries traverse Lake Michigan from Muskegon to Milwaukee and Ludington to Manitowoc. According to a faculty perspective paper published by Michigan State University, Managing Land Use Change and Michigan’s Future:
Between 1982 and 1997, the state’s developed land acreage increased by more than 30 percent, primarily in rural areas. Farmland acreage decreased by almost 1.5 million acres (13.3 percent) over the same period. The rate of land development can be partially explained by the spread of low-density residential, commercial and business developments into traditionally rural areas. Between 1980 and 2000, Michigan’s population grew by only 6.9 percent. Average population density was at 3.8 persons per acre in the early 1980s and dropped to 2.8 persons per acre by the late 1990s.i
From southeast to northwest Michigan, the approximate travel distance is 600 miles. The geography, climate and population are vastly different in those two locations. Climate Along with Michigan’s unique geography comes unique weather patterns. While Michigan receives the winter winds from the north, they tend not to be a brutal as those in Minnesota or Wisconsin. The Great Lakes moderate these winds, but bring lake-effect snow. Michigan tends to be more moderate in temperature than its western neighbors, but the weather may be less predictable. It is not unheard of for a single spring day to bring snow, sleet, rain, sun, and tornadoes. A common expression is: “if you don’t like the weather, wait five minutes because it will change” has truth behind it, but also has implications for the health of Michigan’s residents.
Michigan Rural Health Profile – 11

Demographics Michigan has a diverse mix of immigrants throughout the state. Many parts of Michigan were originally settled by Caucasians of European decent, particularly in the rural areas. Over the last century, migrant and seasonal farm workers came to work in the agricultural industry, with many settling permanently in Michigan. Native American reservations were also established throughout rural Michigan. The manufacturing industry attracted families from the eastern seaboard and the south. Large numbers of people from the Mediterranean and Middle East settled in Michigan’s urban areas. Michigan’s universities also bring in international students and professors from every region of the world. Population The 2006 Population Estimates from the U.S. Census Bureau estimate that Michigan has a total population of 10,095,643, which is an increase of 1.6% from the 2000 Census. Michigan remains the eighth largest state in terms of population and accounts for 3.4% of the total population of the United States. Michigan is ranked 44th in population growth. The fastest growing states increased by at least 10 percent, with Nevada being the fastest growing, increasing by 24.9 percent since 2000. As compared to other large states, Michigan grew faster than Ohio, which had a 1.1 percent growth rate, and Pennsylvania which grew by 1.3 percent. Other large states with greater population increases include Florida, which had a 13.2 percent population growth, Texas with a 12.3 percent increase, and California which grew 7.6 percent. The other states larger than Michigan which grew at faster rates include New York with a 1.7 percent growth rate, and Illinois, which increased by 3.3 percent. Detroit is the largest city in Michigan with about 900,000 residents. Wayne County, which includes Detroit, has about two million people and the Tri-County Area (Macomb, Oakland, and Wayne Counties) in the southeast corner of the state, has about four million residents. This area has a population density of 639 people per square mile, with the Detroit urban area having 3,019.5 people per square mile according to U.S. Census, 2000 data. Metro Detroit is also included in the Detroit–Warren–Livonia Metropolitan Statistical Area which includes the following six counties in the southeast area of the state: Lapeer, Livingston, Macomb, Oakland, St. Clair and Wayne. Metropolitan Michigan, as defined by the Office of Management and Budget, consists of 26 counties, all of which are in the lower part of the Lower Peninsula. The metropolitan counties have a total population of 8,220,348, which is about 81% of the state’s population. These 26 counties account for 29 percent of the state’s land mass, and have an overall population density of almost 500 people per square mile. Nine of the metropolitan counties (almost a third) have a population density of less than 200 people per square mile. Wayne County with 3,195 people per square mile, Macomb County with 1,724 people per square mile, and
Table SC-1: Population Density of the Metropolitan, Micropolitan, and Rural Areas of Michigan based on the
2006 US Census Bureau Population Estimates
Area Census 2000
Pop Est. 2006
Pop Density (2006)
Area (sqmi)
Michigan 9,938,444 10,095,643 173.8 58100.1 Metro 8,099,288 8,220,348 494.7 16616.2 Micro 1,039,466 1,081,694 65.8 16428.0 Rural 799,690 793,601 31.7 25055.9
Michigan Rural Health Profile – 12

Oakland County, with 1,338 people per square mile have the highest population densities in the state. Non-metropolitan Michigan includes the other 57 counties, which are designated either micropolitan or rural. Micropolitan areas consist of 22 counties scattered through out the state. Nine of the micropolitan counties are on the outskirts of a metropolitan core in southern Michigan and the rest are around larger towns in northern Michigan, including Traverse City, Alpena, Sault Ste. Marie, Marquette-Escanaba, and Houghton-Hancock. All other counties are rural. The eastern central part of Michigan (the thumb area of the mitten) is entirely rural. Rural counties fill in the central areas away from the larger towns in the north, and line the shores of Lakes Huron, Michigan, and Superior. None of the non-metropolitan counties has a population density of greater than 200 people per square mile. Grand Traverse County leads the way with a density of 173 people per square mile and six other micropolitan counties have population densities between 100 and 200 people per square mile, most of which are adjacent to a metropolitan county. Seven counties have densities between 50 and 100 people per square mile, and the other eight counties have less than 50 people per square mile. Of the micropolitan counties, Keweenaw has the lowest population density of 3.9 people per square mile. Aggregated, the micropolitan counties have a population density of only 66 people per square mile, which is about eight times less than metropolitan statistical area counties as a whole. Individually, all rural counties have a population density of fewer than 89 people per square mile. Nine counties have population densities of greater than 50 people per square mile, with six of these being adjacent to a Metropolitan Statistical Area. Four counties have single digit population densities of nine people per square mile or fewer, but only three of these counties qualify as frontier according to the definition from the Office of Rural Health Policy (population density of less than 7 people/sqmi). Aggregated, rural counties have a population density of 32 people per square mile, which is half that of the micropolitan aggregate density and sixteen times lower than metropolitan areas’ aggregate density. The State of the State Survey Regions are groupings of contiguous counties. There are seven regions, as shown in Map RD-6, included in the survey, but for the purposes of this report, the seventh region (Detroit City) is combined with southeastern Michigan. The six regions in this report are: East Central Michigan (EC), Northern Lower Peninsula (NLP), Southeastern Michigan (SE), Southwestern Michigan (SW), Upper Peninsula (UP), and West Central Michigan (WC). The regions listed in Table SC-2 are ranked by population. The southeast, with the highest ranking, has 55 percent of the state’s population. The west central and southwest regions have the next highest rankings, with fairly comparable percentages of the state’s population. The east central and two northern areas are collectively home to only 17 percent of the state’s population.
Michigan Rural Health Profile – 13

Table SC-2: Population Density of the State of the State Survey Regions of Michigan based on the 2006 US Census Bureau Population Estimates
Census 2000 Pop Estimate 2006 % Pop 2006 Pop Density
(2006) % SQMI
Michigan 9,938,444 10,095,643 173.8
Southeast 5,456,428 5,512,205 55% 826.4 11%
West Central 1,470,684 1,544,844 15% 173.7 15%
Southwest 1,362,541 1,374,607 14% 210.8 11%
East Central 858,582 861,036 9% 105.9 14%
Northern Lower Peninsula 472,593 490,798 5% 44.2 19%
Upper Peninsula 317,616 312,153 3% 18.6 29%
The population can be examined in several different ways. The following sections will look at population change patterns within the state by race, age, education level, and income. Population Change From 1990 to 2005, Michigan saw a net increase in population of 8.7 percent. While Metropolitan Michigan grew by 7.8 percent, Micropolitan and Rural areas grew by 11.8 percent and 14.6 percent respectively.
Table SC-3: Population Change of the Metropolitan, Micropolitan, and Rural Areas of Michigan from 1990-2005 US Census Bureau Population Estimates
Area Census 1990
% Michigan Population
1990
Population Estimate
2005
% Michigan Population
2005
Population Difference 1990-2005
% Population
Change 1990-2005
Michigan 9,311,319 10,120,860 809,541 8.7%
Metropolitan 7,645,570 82.1% 8,239,620 81.4% 594,050 7.8%
Micropolitan 969,490 10.4% 1,083,443 10.7% 113,953 11.8%
Rural 696,259 7.5% 797,797 7.9% 101,538 14.6%
Several factors are involved in annual population change: births, deaths, emigration and immigration. Population growth due to births has declined in several areas, but longer life expectancies counter this factor. If there is an economic downturn in an area, there may be emigration as the workforce seeks jobs elsewhere, or if an area caters to retirees, that area may expand. Population Age The following Figures (SC-1& SC-2) show the age distribution for Metropolitan, Micropolitan, and Rural Michigan in five-year age increments. Each age grouping has no more than nine percent of the population in any area. In 1990, half of the population for both Metropolitan and Micropolitan Michigan is under the age of 30 and under the age of 35 for Rural Michigan. This
Michigan Rural Health Profile – 14

trend changes by 2005, where the halfway mark for the population increases to 35 for Metropolitan and Micropolitan Michigan, and Rural Michigan has half of its population at or under 40 years of age.
Figure SC-1: Population Distribution by Age for Metropolitan, Micropolitan, and Rural Michigan, 1990
0.0% 1.0% 2.0% 3.0% 4.0% 5.0% 6.0% 7.0% 8.0% 9.0%
Under 55-9
10-1415-1920-2425-2930-3435-3940-4445-4950-5455-5960-6465-6970-7475-7980-84
85 +
Age
Gro
up in
Yea
rs
Percentage of Area Population
Rural
Micropolitan
Metropolitan
Figure SC-2: Population Distribution by Age for Metropolitan, Micropolitan, and Rural Michigan, 2005
0.0% 1.0% 2.0% 3.0% 4.0% 5.0% 6.0% 7.0% 8.0% 9.0%
Under 55-9
10-1415-1920-2425-2930-3435-3940-4445-4950-5455-5960-6465-6970-7475-7980-84
85 +
Age
Gro
up in
Yea
rs
Percentage of Area Population
Rural
Micropolitan
Metropolitan
Michigan Rural Health Profile – 15

Figure SC-3 shows the pattern of change from 1990 to 2005. The age groups that had the largest changes during that time were between ages 40 to 64; some of these groups increased in population by as much as 70% in that time frame. The other area that had a large change in population was 80-84 and 85+. The 80-84 age group increased by almost 50% in all areas, and the 85+ group increased by as much as 80%.
Figure SC-3: Percent Population Change from 1990 to 2005 in Metropolitan, Micropolitan, and Rural Michigan
-30.0% -20.0% -10.0% 0.0% 10.0% 20.0% 30.0% 40.0% 50.0% 60.0% 70.0% 80.0% 90.0%
Under 5
5-9
10-14
15-19
20-24
25-29
30-34
35-39
40-44
45-49
50-54
55-59
60-64
65-69
70-74
75-79
80-84
85 +
RuralMicropolitanMetropolitan
Michigan Rural Health Profile – 16

Race & Ethnicity Figure SC-4 is the Race and Ethnic Distribution for the U.S. and Michigan from the 2000 U.S. Census. The categories for this distribution include: White (Caucasian), Black, American Indian/Alaskan Native (AIAN), Asian, Native Hawaiian/Pacific Islander (NHPI), Other, and Multi-racial (Multi). The ethnicity categories are Hispanic or Non-Hispanic.
Figure SC-4: Race/Ethnic Distribution for U.S. and Michigan, 2000: With a close up of non-White categories
0.0%
10.0%
20.0%
30.0%
40.0%
50.0%
60.0%
70.0%
80.0%
90.0%
White Black AIAN Asian NHPI Other Multi Hispanic
US Michigan
0.0%
2.0%
4.0%
6.0%
8.0%
10.0%
12.0%
14.0%
16.0%
Black AIAN Asian NHPI Other Multi Hispanic
Figure SC-5: Minority Race Distribution in Metropolitan,
Micropolitan, and Rural Michigan, 2000 Census Figure SC-4 shows the breakdown by race, and includes an inset of non-White categories. Comparing Michigan to the United States as a whole, Michigan has a slightly different racial composition. About 80% of Michigan’s population is White, another 14% is Black, and then everyone else makes up the remaining six percent of the population. Also, Michigan has a lower percentage of Hispanics, by almost ten percent.
0%
10%
20%
30%
40%
50%
60%
70%
80%
90%
100%
Metropolitan Micropolitan Rural
Multi
OtherAIAN
Black
Michigan Rural Health Profile – 17
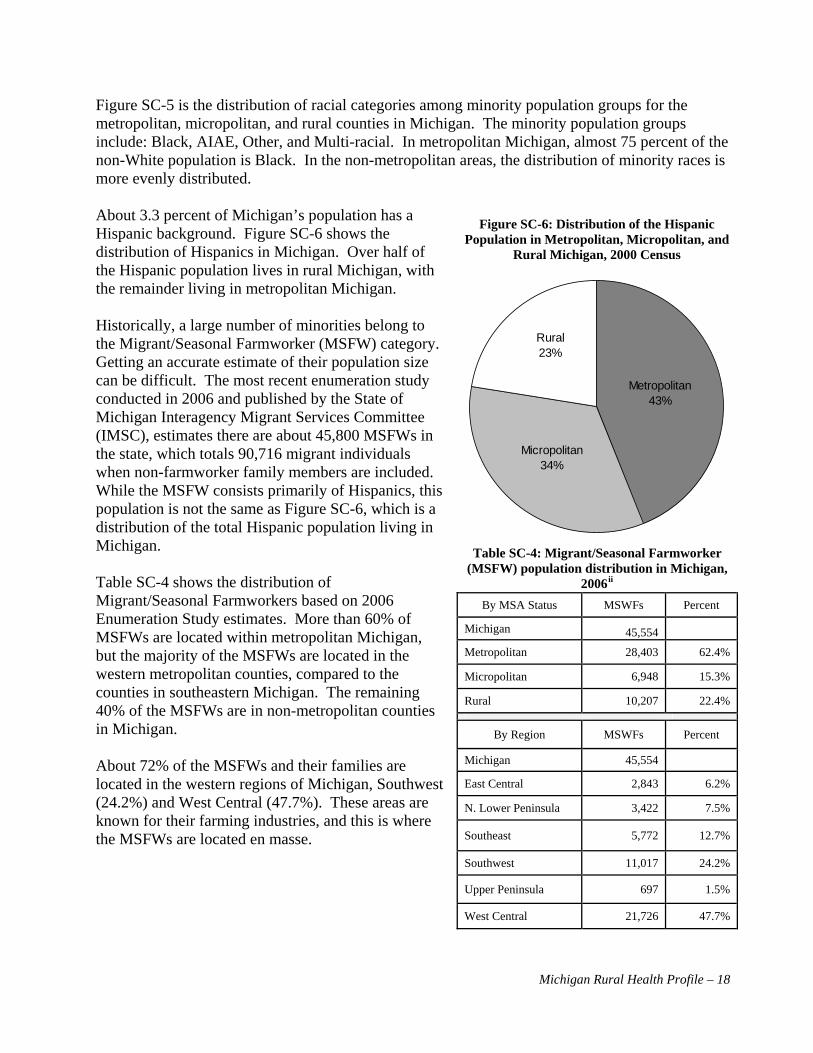
Figure SC-5 is the distribution of racial categories among minority population groups for the metropolitan, micropolitan, and rural counties in Michigan. The minority population groups include: Black, AIAE, Other, and Multi-racial. In metropolitan Michigan, almost 75 percent of the non-White population is Black. In the non-metropolitan areas, the distribution of minority races is more evenly distributed. About 3.3 percent of Michigan’s population has a Hispanic background. Figure SC-6 shows the distribution of Hispanics in Michigan. Over half of the Hispanic population lives in rural Michigan, with the remainder living in metropolitan Michigan.
Figure SC-6: Distribution of the Hispanic Population in Metropolitan, Micropolitan, and
Rural Michigan, 2000 Census
Historically, a large number of minorities belong to the Migrant/Seasonal Farmworker (MSFW) category. Getting an accurate estimate of their population size can be difficult. The most recent enumeration study conducted in 2006 and published by the State of Michigan Interagency Migrant Services Committee (IMSC), estimates there are about 45,800 MSFWs in the state, which totals 90,716 migrant individuals when non-farmworker family members are included. While the MSFW consists primarily of Hispanics, this population is not the same as Figure SC-6, which is a distribution of the total Hispanic population living in Michigan.
Metropolitan43%
Rural23%
Micropolitan34%
Table SC-4: Migrant/Seasonal Farmworker (MSFW) population distribution in Michigan,
2006ii Table SC-4 shows the distribution of Migrant/Seasonal Farmworkers based on 2006 Enumeration Study estimates. More than 60% of MSFWs are located within metropolitan Michigan, but the majority of the MSFWs are located in the western metropolitan counties, compared to the counties in southeastern Michigan. The remaining 40% of the MSFWs are in non-metropolitan counties in Michigan.
By MSA Status MSWFs Percent
Michigan 45,554
Metropolitan 28,403 62.4%
Micropolitan 6,948 15.3%
Rural 10,207 22.4%
By Region MSWFs Percent
Michigan 45,554 About 72% of the MSFWs and their families are located in the western regions of Michigan, Southwest (24.2%) and West Central (47.7%). These areas are known for their farming industries, and this is where the MSFWs are located en masse.
East Central 2,843 6.2%
N. Lower Peninsula 3,422 7.5%
Southeast 5,772 12.7%
Southwest 11,017 24.2%
Upper Peninsula 697 1.5%
West Central 21,726 47.7%
Michigan Rural Health Profile – 18

Gender Figure SC-7: Male-to-Female Ratio in Metropolitan, Micropolitan, and Rural Michigan, 1990-2005
0.90
0.92
0.94
0.96
0.98
1.00
1.02
1990 1992 1994 1996 1998 2000 2002 2004
Mal
e to
Fem
ale
Ratio
Metropolitan
Micropolitan
Rural
As shown in Figure SC-7, the male-to-female ratio is pretty close to 1:1 in rural Michigan. In metropolitan Michigan, there were as much as six to seven percent more females than males in the 1990s, but that is now closer to a four percent difference. Overall, there are about three percent more females than males in the state, with most of the gender disparity in metropolitan Michigan.
Figure SC-8: Male-to-Female Ratio in SOSS regions of Michigan, 1990-2005
When comparing the trends of the male-to-female ratio by SOSS region (Figure SC-8), all areas have a larger percentage of women than men, except the Upper Peninsula, which has about six percent more men than women. The rates of change have been fairly constant for all regions.
0.85
0.90
0.95
1.00
1.05
1.10
1990 1992 1994 1996 1998 2000 2002 2004
Mal
e to
Fem
ale
Rat
io
East Central Northern Lower Peninsula SoutheastSouthwest Upper Peninsula West Central
Michigan Rural Health Profile – 19

Marriage/Divorce The marital status of Michigan residents is similar to that of the rest of the United States according to 2000 Census data. Almost 55 percent of the population was in the category of “now married”. About a quarter of the population had never been married. The data also show that about 15% of the population was either divorced or widowed at the time of the Census. A limitation to this data is that it does not look at multiple marriages, only marriage at the time of the Census, so there is no information on remarriage.
In looking at the gender data in Table SC-5, about 81 percent of persons who are widowed are female, and 19 percent are male. The “Never Married” category is not quite so disparate, with 54 percent of the never married being male, and 46 percent female. Proportionately, the national and state data are very comparable. All of the categories are within one percentage point of each other.
Figure SC-9: Marital Status in Michigan and the US, 2000 Census
0.0%
10.0%
20.0%
30.0%
40.0%
50.0%
60.0%
Never Married Now Married Widowed Divorced
United States Michigan
Table SC-5: Marital Status by Gender in Michigan and the United States, 2000 Census
United States Michigan Total Male Female Total Male Female
Never Married 59,913,370 54% 46% 2,162,860 54% 46%
Now Married 125,000,493 50% 50% 4,300,090 50% 50%
Widowed 14,674,500 18% 82% 513,010 19% 81%
Divorced 21,560,308 43% 57% 799,643 44% 56%
Figure SC-10: Comparison of Marriage versus Divorce Trend in Michigan, 1990-2005
0.0
5.0
10.0
15.0
20.0
25.0
1990 1992 1994 1996 1998 2000 2002 2004
Rat
e pe
r 1,0
00 p
eopl
e (n
ot in
cide
nce)
Marriage Rate Divorce RateTo visually compare Michigan’s marriage and divorce rates over time (Figure SC-10), the annual divorce rate is about half of the annual marriage rate. Metropolitan and rural Michigan trends closely follow statewide trends; therefore, these categories were not added to Figure SC-10.
Michigan Rural Health Profile – 20
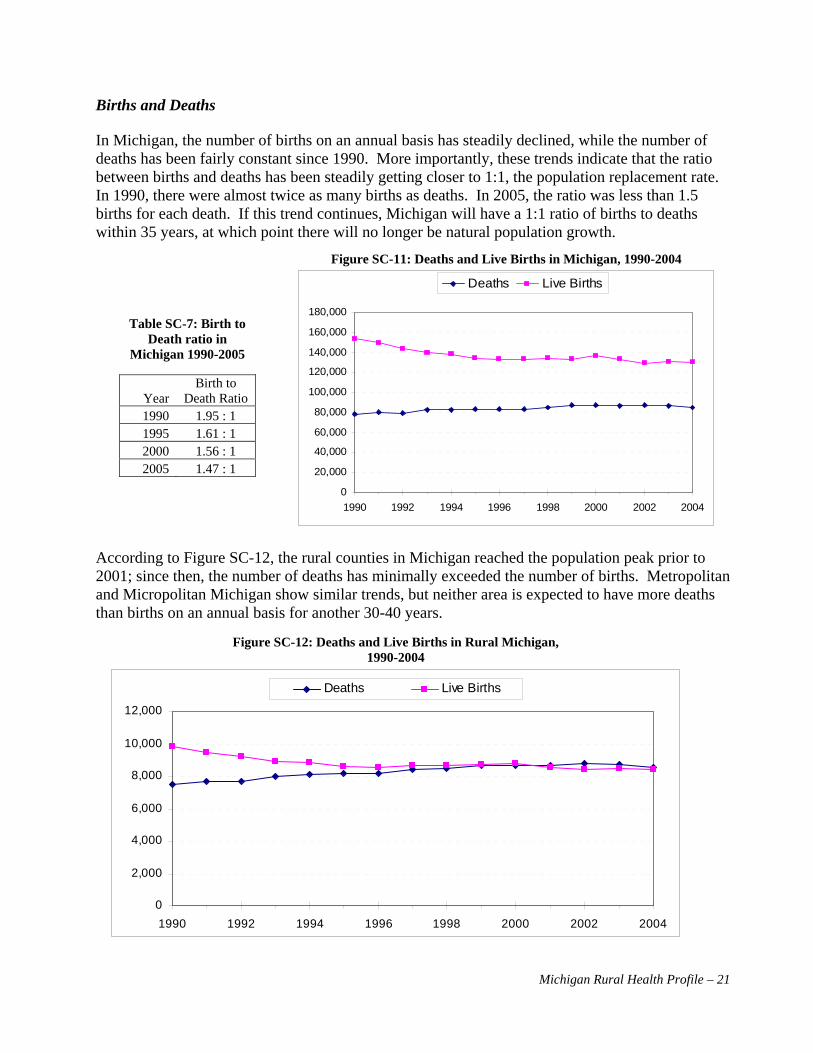
Births and Deaths In Michigan, the number of births on an annual basis has steadily declined, while the number of deaths has been fairly constant since 1990. More importantly, these trends indicate that the ratio between births and deaths has been steadily getting closer to 1:1, the population replacement rate. In 1990, there were almost twice as many births as deaths. In 2005, the ratio was less than 1.5 births for each death. If this trend continues, Michigan will have a 1:1 ratio of births to deaths within 35 years, at which point there will no longer be natural population growth.
Figure SC-11: Deaths and Live Births in Michigan, 1990-2004
0
20,000
40,000
60,000
80,000
100,000
120,000
140,000
160,000
180,000
1990 1992 1994 1996 1998 2000 2002 2004
Deaths Live Births
Table SC-7: Birth to Death ratio in
Michigan 1990-2005
Birth to Death Ratio Year
1990 1.95 : 1 1995 1.61 : 1 2000 1.56 : 1 2005 1.47 : 1
According to Figure SC-12, the rural counties in Michigan reached the population peak prior to 2001; since then, the number of deaths has minimally exceeded the number of births. Metropolitan and Micropolitan Michigan show similar trends, but neither area is expected to have more deaths than births on an annual basis for another 30-40 years.
Figure SC-12: Deaths and Live Births in Rural Michigan, 1990-2004
0
2,000
4,000
6,000
8,000
10,000
12,000
1990 1992 1994 1996 1998 2000 2002 2004
Deaths Live Births
Michigan Rural Health Profile – 21

Infant Deaths Between 1990 and 2004, one baby out of every 34 in Michigan died either before birth or within the first year of life. The categories of infant morality are neonatal, perinatal, and infant. Neonatal deaths happen within the first seven days after birth. Perinatal deaths occur between eight and 30 days after birth, and infant deaths take place between one month and one year of life. Overall, infant death in Michigan decreased by 27 percent from 1990 to 2004, with deaths of children between the ages of one and twelve months of age decreasing by almost 40 percent over 15 years. The highest occurrence of infant death is in newborns between the ages of eight and 30 days of age. Fetal deaths have remained steady over the past 15 years, and account for about 20 percent, or about 800 deaths.
Figure SC-13: Infant and Fetal Deaths in Michigan, 1990-2004
0
200
400
600
800
1,000
1,200
1,400
1,600
1,800
2,000
1990 1992 1994 1996 1998 2000 2002 2004
Perinatal Deaths
Infant Deaths
Neonatal Deaths
Fetal Deaths
For the years between 1990 and 2004, metropolitan Michigan has had the highest infant mortality rate in the state. The IMR is calculated per 1,000 live births, but due to the small numbers in Non-Metropolitan Michigan, the rates are calculated as a three-year rolling average. Since 1990 the overall IMR has declined in all areas, with Micropolitan and Rural Michigan comparable for the 2000 to 2004 averages. Overall, the Micropolitan and Rural Michigan IMRs have decreased from eight to almost six deaths per 1,000 births. The IMR for Michigan’s metropolitan counties has decreased from 11 to almost eight deaths per 1,000 live births.
Michigan Rural Health Profile – 22

Figure SC-14: Infant Mortality Rates in Metropolitan, Micropolitan, and Rural Michigan, 3-Year Rolling Average 1990-2004iii
0.0
2.0
4.0
6.0
8.0
10.0
12.0
90-92 91-93 92-94 93-95 94-96 95-97 96-98 97-99 98-00 99-01 00-02 01-03 02-04
Years
Rate
Per
1,0
00 L
ive
Birth
s
Michigan Metropolitan Micropolitan Rural
Fertility Rates
Figure SC-15: Fertility Rates in the U.S. and Michigan, 1910-2005
0.0
20.0
40.0
60.0
80.0
100.0
120.0
140.0
1910 1920 1930 1940 1950 1960 1970 1980 1990 1995 2000 2005
United States Michigan
Figure SC-15 shows the fertility rates in Michigan and the United States for 1910 through 2005 per 1,000 women, 15-44 years of age. The only time Michigan’s rates did not closely follow the national trends was prior to 1920. During the Post-World War II baby boom (1945-1960), Michigan’s rate slightly outpaced that of the rest of the nation. Since 1980, Michigan’s rate has remained slightly below the national rate.iv
Michigan Rural Health Profile – 23

Michigan Rural Health Profile – 24
Birth by Age of Mother A breakdown of the number of births by age of mother indicates that as many as 75% of babies born from 1990 to 2004 were to mothers aged 20-34 years. However, a trend during this 15 year period found fewer children born to mothers younger than 20 and a larger percentage to mothers over the age of 34, and even past the age of 40.
Annually, the total number of births decreased from 1990 to 2004 by 15%. Even with the decrease in the number of live births, there was a decrease in the percentage of births to women in all age cohorts of less than 30 years. Thus, there was a decrease in the real number of births to the women in these cohorts. From 1990 to 2004, women aged 30-34 years increased in the percentage distribution of live births, but in terms of the actual number, there was a slight decrease. For the other two age cohorts (35-39 and 40+) there was an increase in the total number of births. In fact, the age group of 40+ more than doubled in that time.
Table SC-9 shows the change in birth rate per 1,000 live births by age of mother between the 1991-1995 average and the 2001-2005 average. Regardless of region, all <15, 15-19, and 20-24 age groups experienced a reduction in the rate of live births per 1,000 women per year. In rural Michigan, the largest decrease in birth rate was seen in the 20-24 age group (-33.0). In micropolitan Michigan, the largest decrease in birth rate was for the 15-19 age group (-11.9) followed closely by the 20-24 age group (-11.8). And in metropolitan Michigan, the largest decrease in birth rate was seen in the 15-19 age group (-21.2). The largest increase in birth rate for
Table SC-8: Annual Distribution of Births by Age of Mother, 1990-2004v
Age of Mother
Total
% < 15 % 15-19 % 20-24 % 25-29 % 30-34 % 35-39 % 40+
1990 153,080 0.3% 13.2% 26.1% 31.7% 20.9% 6.8% 0.9% 1995 134,169 0.3% 12.3% 24.1% 28.8% 23.6% 9.3% 1.6% 2000 136,048 0.2% 10.4% 24.4% 28.6% 23.9% 10.6% 2.0%
2004 129,710 0.2% 9.4% 24.1% 28.4% 24.5% 11.0% 2.4%
Table SC-9: Change in Rate 1991-1995 to 2001-2005 by Age of Mother Age of Mother Metropolitan Micropolitan Rural Michigan
<15 -0.7 -0.1 -0.2 -0.6
15-19 -21.2 -11.9 -19.1 -20.1
20-24 -5.5 -11.8 -33.0 -7.4
25-29 4.4 -0.2 2.2 3.9
30-34 14.8 17.3 10.3 14.8
35-39 10.4 7.6 5.1 9.8
40+ 2.7 1.5 1.6 2.5

all three regions was seen in the 30-34 age group with increases of 14.8, 17.3, and 10.3 for metropolitan, micropolitan, and rural Michigan respectively Death Rate
Table SC-10: Death Rates by Area
% of State Population
% Total Deaths
Death Rate (per 1,000) Region # of Counties Area Population Total Deaths
Michigan 83 9,938,444 86,785 8.7
Metropolitan 26 8,099,288 81.5% 68,487 78.9% 8.5
Micropolitan 23 1,053,944 10.6% 9,585 11.0% 9.1
Rural 34 785,212 7.9% 8,708 10.0% 11.1
As evidenced by Table SC-10, less than eight percent of the population lives in rural Michigan, however ten percent of deaths occur in those areas. Rural Michigan has a much older population compared with the rest of the state. As Figure SC-3 showed earlier in this section, rural Michigan has experienced over an 80% growth in its 85 and older population. Death by Age Looking at the age distribution of deaths in 2004, the older age groups have a higher percentage of the deaths, as is expected. Almost 80% of the deaths for 2004 occurred in the oldest three age groups (65-74, 75-84, and 85+).
Figure SC-16: Age Distribution of Deaths as a Percent of total Deaths for Metropolitan, Micropolitan, and Rural Michigan, 2004
0.0%
5.0%
10.0%
15.0%
20.0%
25.0%
30.0%
35.0%
Under 1 1 - 14 15 - 24 25 - 34 35 - 44 45 - 54 55 - 64 65 - 74 75 - 84 85 +
Metropolitan Micropolitan Rural
Michigan Rural Health Profile – 25

Educational Levels Information on educational attainment is collected in each Census. The following two Figures, SC-17 and SC-18 are from the 1990 and 2000 Census, respectively. The data collected regarding educational attainment is for all persons aged 25 and older at the time of the Census, and it was the attainment at the time of the Census.
Figure SC-17: Educational Attainment in Michigan, 1990 Census
0.0%
10.0%
20.0%
30.0%
40.0%
50.0%
60.0%
70.0%
80.0%
90.0%
Less than HighSchool
% High school orMore
% Some college orMore
% Bachelors orMore
% Post GraduateDegree
United States Michigan Metropolitan Micropolitan Rural
According to the 2000 Census, more than four out of five Michigan residents have a high school diploma. From the 1990 Census to the 2000 Census, rural counties in Michigan increased from about 70% to 80% of the population having attained at least a high school education. In 1990, the micropolitan counties had the highest percentage of attainment of a high school education, compared to the other categories, including statewide and nationwide. In 2000, the percentage of the population completing high school increased in all categories, and the rest of Michigan almost caught up with micropolitan counties. Otherwise, attainment at each educational level is similar in Michigan to that of the rest of the nation; it also does not vary greatly within the state although there is a larger percentage of attainment in metropolitan Michigan, with the lowest percentage of attainment in rural counties.
Michigan Rural Health Profile – 26

Figure SC-18: Educational Attainment in Michigan, 2000 Census
0.0%
10.0%
20.0%
30.0%
40.0%
50.0%
60.0%
70.0%
80.0%
90.0%
Less than High School % High School or More % Some College orMore
% Bachelors or More % Post Grad Degree
United States Michigan Metropolitan Micropolitan Rural
Both in Michigan and nationally, there is a drop-off in the pursuit of education after graduation from high school. Roughly half of Michigan’s population attended college, but only about 50% of those students went on to attain a bachelor’s degree, or in the case of rural Michigan, only about a third received a bachelor’s degree. Industry Michigan’s industries are as varied and diverse as the land. Automotive manufacturing was a staple in southern Michigan in the last century, being home to the Big Three (Ford, General Motors, and DaimlerChrysler). Other high tech industries associated with research and development have spawned off from manufacturing, as well as from Michigan’s research universities, with two of the Big Ten universities (Michigan State University and the University of Michigan) and Wayne State University being located in southern Michigan. Areas to the north have large pockets of agriculture, forestry/logging, and mining. Another large industry throughout Michigan is health care, which is currently one of the fastest growing sectors of the economy. According to the 2002 Economic Census, Michigan’s main industries (based on annual revenue) are manufacturing, wholesale trade, and retail trade. The top three industries employing the most workers are manufacturing, retail trade, and health care and social assistance, which is consistent when broken out into rural and metropolitan Michigan. Table SC-11 shows the totals for Michigan’s industry by area for number of establishments, amount of sales, annual payroll, and number of employees. The percentage of each category by area is fairly consistent with metropolitan Michigan, with at least 80% of the total.
Michigan Rural Health Profile – 27
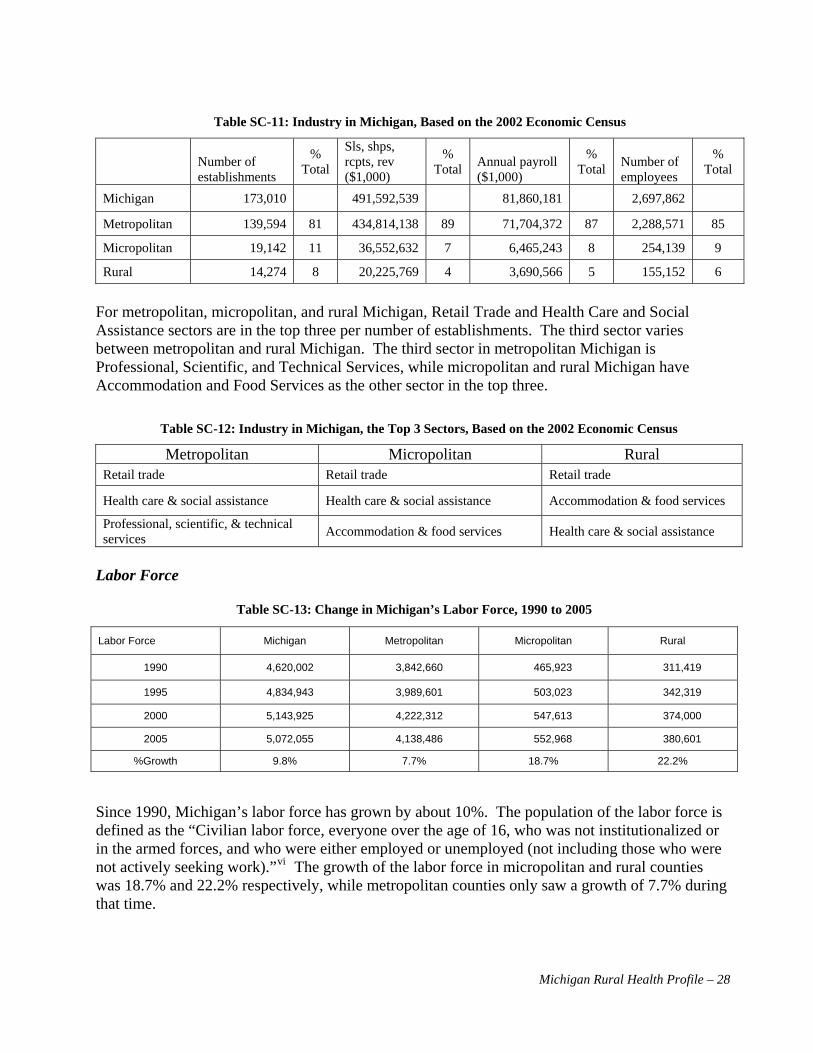
Table SC-11: Industry in Michigan, Based on the 2002 Economic Census
Sls, shps, rcpts, rev ($1,000)
% Total
% Total
% Total
% Total Number of
employees Annual payroll ($1,000)
Number of establishments
Michigan 173,010 491,592,539 81,860,181 2,697,862 Metropolitan 139,594 81 434,814,138 89 71,704,372 87 2,288,571 85
Micropolitan 19,142 11 36,552,632 7 6,465,243 8 254,139 9
Rural 14,274 8 20,225,769 4 3,690,566 5 155,152 6
For metropolitan, micropolitan, and rural Michigan, Retail Trade and Health Care and Social Assistance sectors are in the top three per number of establishments. The third sector varies between metropolitan and rural Michigan. The third sector in metropolitan Michigan is Professional, Scientific, and Technical Services, while micropolitan and rural Michigan have Accommodation and Food Services as the other sector in the top three.
Table SC-12: Industry in Michigan, the Top 3 Sectors, Based on the 2002 Economic Census
Metropolitan Micropolitan Rural Retail trade Retail trade Retail trade
Health care & social assistance Health care & social assistance Accommodation & food services
Professional, scientific, & technical services Accommodation & food services Health care & social assistance
Labor Force
Table SC-13: Change in Michigan’s Labor Force, 1990 to 2005
Labor Force Michigan Metropolitan Micropolitan Rural
1990 4,620,002 3,842,660 465,923 311,419
1995 4,834,943 3,989,601 503,023 342,319
2000 5,143,925 4,222,312 547,613 374,000
2005 5,072,055 4,138,486 552,968 380,601
%Growth 9.8% 7.7% 18.7% 22.2%
Since 1990, Michigan’s labor force has grown by about 10%. The population of the labor force is defined as the “Civilian labor force, everyone over the age of 16, who was not institutionalized or in the armed forces, and who were either employed or unemployed (not including those who were not actively seeking viwork).” The growth of the labor force in micropolitan and rural counties was 18.7% and 22.2% respectively, while metropolitan counties only saw a growth of 7.7% during that time.
Michigan Rural Health Profile – 28

Figure SC-19: Labor Force as a percentage of total population in Metropolitan, Micropolitan, and Rural Michigan, 1990-2005
20.0%
30.0%
40.0%
50.0%
60.0%
1990 1992 1994 1996 1998 2000 2002 2004
Metropolitan
Micropolitan
Rural
Michigan’s labor force is about 50% of the total population, with Rural Michigan’s percentage slightly lower at about 47%. The labor force, as a percentage of total population, has been fairly stable over time, with the exception of rural Michigan increasing by ten percent from 1990 to 1992. Unemployment Michigan’s jobless rate has remained fairly high in recent years. Metropolitan and micropolitan counties had unemployment rates around 7.0 (6.7% and 6.6% respectively), while rural counties had an aggregate jobless rate of 8.3. All areas follow similar trends, but rural counties tend to have higher unemployment rates.
Figure SC-20: The Jobless Rate in Metropolitan, Micropolitan, and Rural Michigan, 1990-2005
0
2
4
6
8
10
12
14
1990 1992 1994 1996 1998 2000 2002 2004 2006
Jobl
ess
Rat
e
Michigan Metropolitan Micropolitan Rural
Michigan Rural Health Profile – 29

Poverty Every year, the US Department of Health and Human Services publishes an annual federal poverty level guideline. This guideline is used to determine eligibility for medical and living assistance programs from the federal, state and, and local governments. Figure SC-21 shows the percent of the total population below 200% Federal Poverty Level (FPL), based on the 2000 US Census Data. The Figure compares the United States, State of Michigan, and metropolitan, micropolitan, and rural Counties. For the United States as a whole, almost 30% of the population is below the 200% FPL mark. In Michigan, about 25% percent of the state is below that level. Rural Michigan has a higher percentage of population below 200% FPL, at 32% of the population. Metropolitan Michigan was below 25%, and Micropolitan Michigan has about 27% of its population below 200% FPL.
Figure SC-21: Percent of the Population below the 200% Federal Poverty Level, 2000 Census.
0.0%
5.0%
10.0%
15.0%
20.0%
25.0%
30.0%
35.0%
United States Michigan Metropolitan Micropolitan Rural
Health Insurance Without health insurance, many patients may opt to not get the preventative care they need, and may not seek care until their condition is more difficult and complicated to treat. These patients could incur large medical bills or seek treatment in an Emergency Room, which is far more expensive than a primary care setting. After initial treatment, the patient may not get the follow-up care they need, and end up back in the Emergency Room. This continuous cycle can place a heavy burden on the health care system, especially in cases of uncompensated care. There are a few types of health insurance sources available to individuals: through their employer (if available), privately purchased, and through public assistance programs (if eligible). Getting an accurate estimate of how many insured and uninsured individuals there are can be difficult despite national studies and research available. Nationally, it is estimated that about 17% of the population is uninsured. The percent of the population in each state without health insurance varies according to the report on the Characteristics of the Uninsured (2006), but ranged from 9.5 to 27.7 percent among the individual states. Figure SC-22 shows the Sources of Health Insurance and Number of Uninsured by Urban or Rural Area, which is based on Current Population Survey (CPS) estimates, and shows the 2003-2005 average. The definition is different than the metropolitan, micropolitan and rural areas, as used above, and is not comparable; also the calculations are based on the non-elderly population aged 64 years or younger, so this does not include Medicare.
Michigan Rural Health Profile – 30

Figure SC-22: Sources of Health Insurance and Number Uninsured in Michigan by Urban/Rural, Current
Population Survey Data Files, Employee Benefit Research Institute, 2003-2005
0
10
20
30
40
50
60
70
80
Urban 68.8 6.5 13.8 2.7 12.8
Rural 71 5.5 18.7 4.0 12.3
Employer-based Individually Purchased Medicaid Other Public Uninsured
In Michigan, only about 12.5% of the population was uninsured, which is lower than the national average (17.5% in 2004). A little more than 70% of the population has insurance provided through their employer, which has been higher in Michigan compared to the national average (63.2% in 2004) since 1987 (Characteristics of the Uninsured, 2006). Figure SC-22 shows that there is little difference between the urban and rural areas of Michigan for the percent of the uninsured population. In fact, the only category that shows a large difference is Medicaid, which is being utilized by about five percent more of the population in rural areas.
Between 1999 and 2004, Medicaid enrollment increased by 26%. In rural Michigan, enrollment increased by 36.5% in that time.
Table SC-14: Michigan Medicaid Enrollment Rates per 1,000 personsvii
Year Michigan Metropolitan Rural 1999 107.5 105.5 To be eligible for Medicaid as a low-income
family, the family household income had to be below $29,025 in 2005, or 1.5 times the federal poverty level. According to a fact sheet developed by the American Academy of Pediatricians about Michigan Medicaid, there are an estimated 168,542 children (6.3%) who were uninsured in Michigan, yet about 89,382 of these children were eligible for Medicaid and not enrolled in it.
116.2 2000 107.3 105.2 116.6 2001 112.2 109.2 125.6 2002 121.5 117.4 139.6 2003 128.2 123.6 148.3 2004 135.5 130.3 158.7
% Change +26.04% +23.51% +36.57%
Michigan Rural Health Profile – 31

Trends Since 1990, some areas within Michigan have grown rapidly. While the northern Lower Peninsula has had rather large growth rates, much of the Upper Peninsula has seen a decline in population. Michigan’s population has been getting older, with an increase in the median age between 1990 and 2000. The older age cohorts have grown much more quickly than the younger cohorts. Throughout Michigan, the birth rate is declining and death rates are increasing, both of which lead to the slow down of population growth. The socioeconomic status of Michigan differs in the rural areas compared to metropolitan areas. Overall, there are higher levels of unemployment and poverty in rural Michigan. This has been caused by mines closing, manufacturers moving, and the lack of access to jobs in the metropolitan areas. Rural Michigan has lower levels of educational attainment, which may be due in part to the older population residing in these areas. A lack of jobs for those who pursue higher education results in people migrating to metropolitan areas to get appropriate jobs. Changes in the demographic and socio-economic indicators of Michigan will change the needs of the population and demands on the health care system. Now that the characteristics of Michigan have been described, the following sections will compare the health status of the metropolitan and rural populations, and take a look at the resources available in rural Michigan. i Perspective Papers. Michigan’s Opportunities and Challenges: MSU Faculty Perspectives. Managing Land Use Change and Michigan’s Future. http://web1.msue.msu.edu/iac/transition/papers/ManLandUse.pdf ii Source: Migrant/Seasonal Farmworkers Enumeration Study, 2006 iii Source: Michigan Resident Death, Birth and Fetal Death Files, Vital Records and Health Data Development Section, MDCH Population, Michigan Information Center, Michigan Department of Management & Budget, 1990-2004 iv The sources for this data come from the 1910-2005 Michigan Residents Birth Files, Division for Vital Records and Health Statistics, Michigan Department of Community Health and the U.S. Census Populations With Bridged Race Categories Monthly Vital Statistics Report at the National Center For Health Statistics. v Source: 1990-2004 Michigan Resident Birth Files, Vital Records and Health Data Development Section, MDCH vi Labor Market Information: Glossary of Terms. Michigan Department of Labor and Economic Growth. http://www.milmi.org/admin/uploadedPublications/1027_glossary_terms.htm vii Source: Medicaid Enrollment in the State of Michigan, 1999-2004. Issue Paper to the Michigan Senate, March 2005, by David Fosdick
Michigan Rural Health Profile – 32

Michigan Rural Health Profile – 33
Health Status Critical Health Indicators Report The Health Status information for this report is based largely on the Critical Health Indicators (CHI) report, which describes the health of Michigan’s population and establishes a method for monitoring improvement. The report is organized by 17 health topics, and their 42 related measures or indicators. The set of topics and indicators from the CHI report was developed through collaboration of various areas at the Michigan Department of Community Health. For this report, data are presented in terms of metropolitan, micropolitan, and rural status, aggregated from county level statistics. Leading Causes of Death Michigan’s ten leading causes of death are Heart Disease, Cancer, Stroke, Chronic Lower Respiratory Disease (CLRD), Accidents (Unintentional Injuries), Diabetes, Alzheimer’s, Pneumonia/Influenza, Kidney Disease, and Suicide. Figure HS-1: Crude Death Rates for Michigan’s 10 Leading Causes of Death in Metropolitan, Micropolitan,
and Rural Areas, 2005
0
50
100
150
200
250
300
Heart D
iseas
e
Cance
r
Stroke
CLRD
Uninten
tiona
l Injur
ies
Diabetes
Alzheim
er's
Pneum
onia/
Influen
za
Kidney
Dise
ase
Suicide
Rat
e pe
r 100
,000
Pop
ulat
ion
Michigan Metropolitan Micropolitan Rural
Figures HS-1 and HS-2 show both the crude and age-adjusted death rates for 2005, respectively. Crude death rates show rural counties at much higher rates of heart disease and cancer per 100,000 persons, as compared to metropolitan and micropolitan counties. Figure HS-2 shows age-adjusted death rates, which compensate for differences in age breakdown of the different populations.

Figure HS-2 Age-Adjusted Death Rates for Michigan’s 10 Leading Causes of Death in Metropolitan,
Micropolitan, and Rural Areas, 2005
0
50
100
150
200
250
Heart D
isease
Cancer
Stroke
CLRD
Acciden
ts
Diabete
s
Alzheim
er's
Pneumon
ia/Inf
luenza
Kidney
Disease
Suicide
Michigan Metropolitan Micropolitan Rural
Of note is the relative decrease in death rates through age-adjustment for most causes in rural counties. For example, in terms of crude rates, rural counties had notably higher heart disease death rates than metropolitan or micropolitan counties. With age-adjustment, metropolitan Michigan has the highest heart disease death rate. The relative decrease in rural death rates from crude to age-adjusted illustrates the difference in age from rural to metropolitan and micropolitan areas and the impact age has on relative morbidity and mortality rates.
In looking at the top two leading causes of death, heart disease and cancer, there is a similarity in the proportion of the death rates. Heart disease and cancer account for about 52% of the deaths in 2005. After cancer (second ranked), there is a significant drop off to the next cause of death, stroke.
Table HS-1 Cause of Death as a percent Total Deaths for Michigan
After age-adjustment, it is still clear that Heart Disease is the leading cause of death throughout the state, with almost 250 deaths per 100,000 population. It accounts for 29% of total deaths for 2005. Comparing metropolitan, micropolitan, and rural Michigan, there is a fairly large range in the death rates. Metropolitan Michigan is at 236 deaths per 100,000 people, while micropolitan Michigan is
208 deaths per 100,000 people. The regional variation is 28 deaths per 100,000 people, which is the largest variation between geographic areas of all of the leading causes of death.
in 2005 ALL CAUSES 86,780
1 Heart Disease 29% 2 Cancer 23% 3 Stroke 6% 4 CLRD 5% 5 Accidents 4% 6 Diabetes 3% 7 Alzheimer’s Disease 3% 8 Pneumonia & Influenza 2% 9 Kidney Disease 2%
10 Suicide 1%
Cancer is the second leading cause of death at almost 200 people per 100,000 population. For this set of data, all types of cancer are combined, but these data will be broken out further by leading cancer types. Chart HS-1 illustrates that there is less regional variation among cancer
Michigan Rural Health Profile – 34
WightmanT
Rectangle

Michigan Rural Health Profile – 35
deaths than heart disease, but even with age-adjustment, rural Michigan carries a larger burden of cancer-related deaths than metropolitan Michigan. Among the other top eight causes of death, another category that shows a notable variation by region is Accidents (or Unintentional Injuries). Rural Michigan clearly has the largest portion of deaths caused by accidents; the death rate is almost 1.5 times higher in rural Michigan compared to metropolitan Michigan. The following sections discuss age group cohorts for the leading causes of death. To clarify, the leading causes of death categories are based on the State of Michigan leading causes of death for the total population. The age cohorts are as follows: Under 20, 20-44, 45-74, and 75 and Over.
Figure HS-3: Crude Death Rates Among the Population Below Age 20 for Michigan’s Leading Causes of Death in Metropolitan, Micropolitan, and Rural Areas in 2005
0
5
10
15
20
25
Heart D
isease
Cancer
Stroke
CLRD
Uninten
tional
Injur
ies
Diabete
s
Alzheim
er's
Pneumonia
/Influ
enza
Kidney D
isease
Suicide
Rate
per
100
,000
Pop
ulat
ion
Michigan Metropolitan Micropolitan Rural
For the age cohort of persons less than 20, the causes of death most notable among Michigan’s overall leading causes include Accidents (Unintentional Injuries), Suicide, Cancer, and Heart Disease. The other categories are negligible at less than 1 death per 100,000 persons. Deaths for persons less than 20 account for 2.1% of all Michigan deaths in 2005. Of these top four categories, the only area that exceeds a rate of five deaths per 100,000 persons is Accidents/Unintentional Injuries. This cause reaches almost 25 deaths per 100,000 persons in rural Michigan, while the statewide rate is 13 deaths per 100,000 persons. Another way to look at Accidents is that the death rates for individuals less than 20 years of age are almost 2.5 times higher in Rural Michigan than in Metropolitan Michigan. In rural Michigan, Accidents kill at a rate almost five times higher for this age group than for all other causes of death.

Michigan Rural Health Profile – 36
Figure HS-4: Crude Death Rates Among the Population Age 20 to 44 for Michigan’s Leading Causes of
Death in Metropolitan, Micropolitan, and Rural Areas in 2005
05
101520253035404550
Heart D
isease
Cance
r
Strok
e
CLRDUnin
tentio
nal In
juries
Diabete
sAlzh
eimer'
s
Pneu
monia/
Influe
nza
Kidney
Dise
ase
Suici
de
Rate
per
100
,000
Pop
ulat
ion
Michigan Metropolitan Micropolitan Rural
As shown in Figure HS-4, the top four leading causes of death (among Michigan’s leading causes) for 20 to 44 year olds are accidents, suicide, cancer, and heart disease. After accidents, the death rates for the next three causes are fairly similar. Rural Michigan again carries the greatest burden of accident, suicide, and heart disease deaths proportionately. Accident death rates in Rural Michigan are almost 1.6 times greater than the state rates. In this age cohort, 22 to 44 years old, there is less deviation from the statewide average between metropolitan, micropolitan and rural counties among cancer, stroke, CLRD, diabetes, and kidney disease deaths. Rural Michigan is similar to the state for cancer, stroke, and kidney disease, and has lower death rates for CLRD and diabetes. Micropolitan Michigan is about one-third lower for heart disease death rates and has lower rates for deaths caused by stroke, pneumonia/influenza, and suicide than the rest of the state. Compared to the under 20 group, the 20-44 group has more deaths in a year, and accounted for 5.6% of the total deaths in Michigan for 2005. For this age group, deaths due to accidents are higher than any other cause. The state rate is almost twice that of cancer. Five of the other six causes show up with less than five deaths per 100,000 persons.
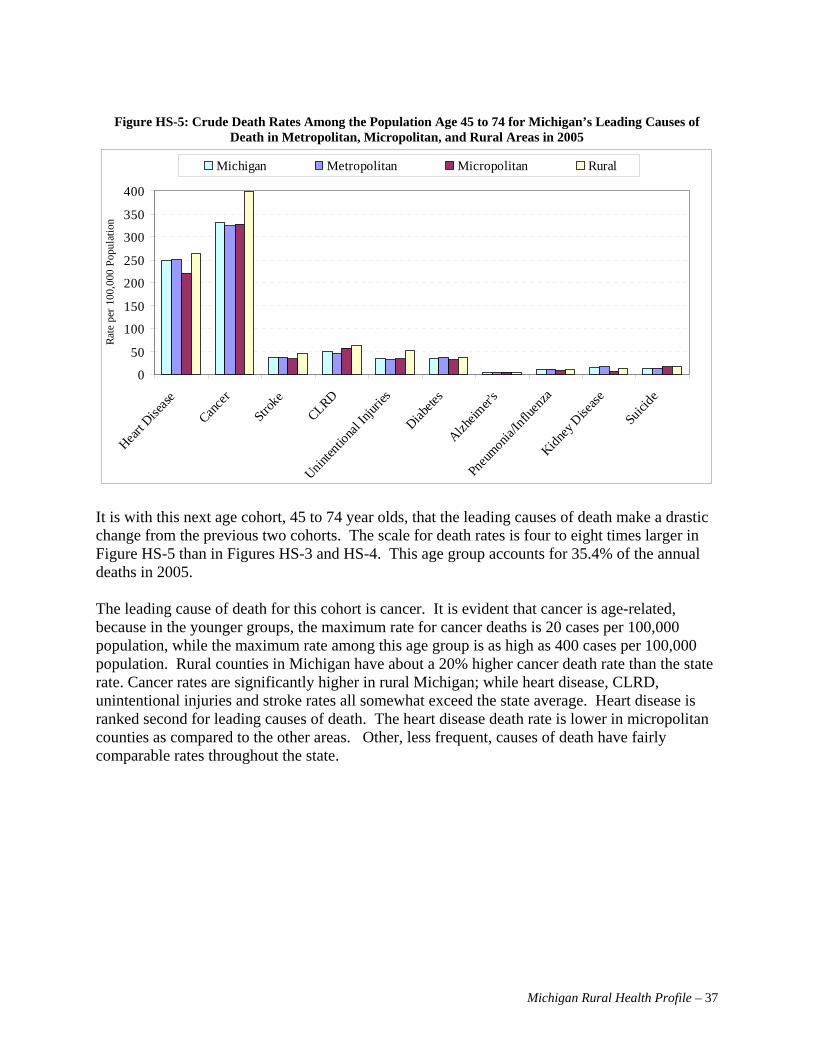
Michigan Rural Health Profile – 37
Figure HS-5: Crude Death Rates Among the Population Age 45 to 74 for Michigan’s Leading Causes of
Death in Metropolitan, Micropolitan, and Rural Areas in 2005
0
50
100
150
200
250
300
350
400
Heart D
isease
Cance
r
Strok
e
CLRDUnin
tentio
nal In
juries
Diabete
sAlzh
eimer'
s
Pneu
monia/
Influe
nza
Kidney
Dise
ase
Suici
de
Rate
per
100
,000
Pop
ulat
ion
Michigan Metropolitan Micropolitan Rural
It is with this next age cohort, 45 to 74 year olds, that the leading causes of death make a drastic change from the previous two cohorts. The scale for death rates is four to eight times larger in Figure HS-5 than in Figures HS-3 and HS-4. This age group accounts for 35.4% of the annual deaths in 2005. The leading cause of death for this cohort is cancer. It is evident that cancer is age-related, because in the younger groups, the maximum rate for cancer deaths is 20 cases per 100,000 population, while the maximum rate among this age group is as high as 400 cases per 100,000 population. Rural counties in Michigan have about a 20% higher cancer death rate than the state rate. Cancer rates are significantly higher in rural Michigan; while heart disease, CLRD, unintentional injuries and stroke rates all somewhat exceed the state average. Heart disease is ranked second for leading causes of death. The heart disease death rate is lower in micropolitan counties as compared to the other areas. Other, less frequent, causes of death have fairly comparable rates throughout the state.
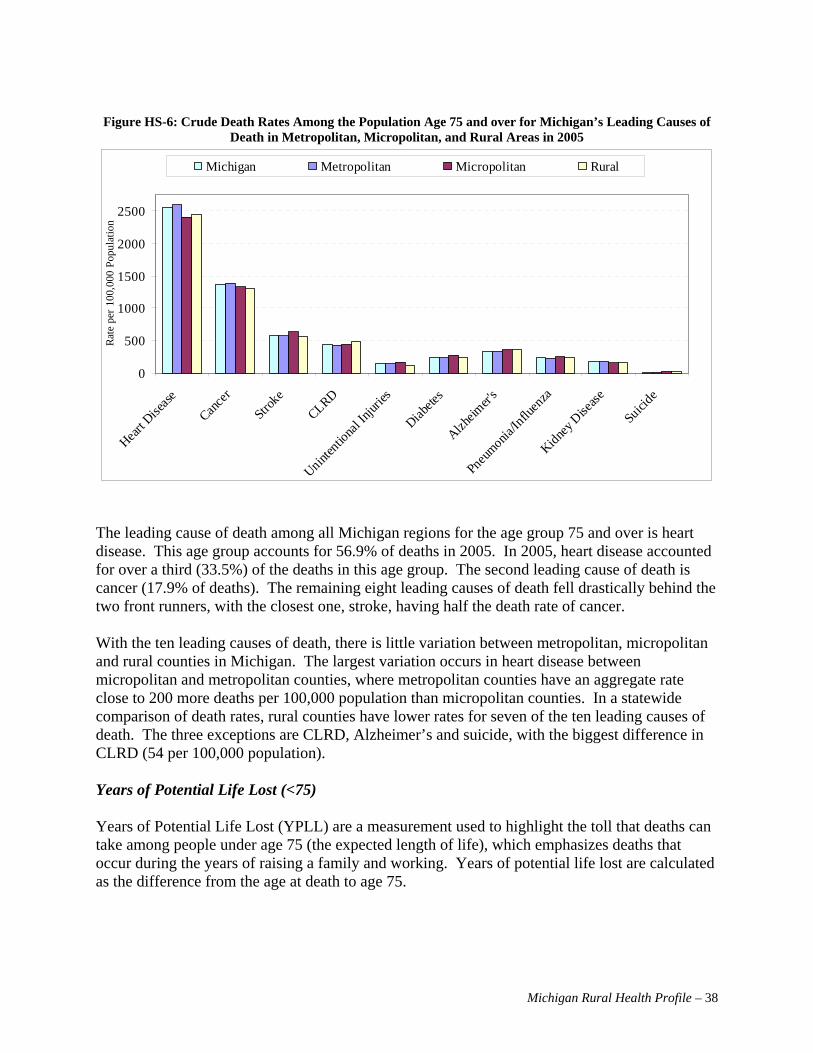
Michigan Rural Health Profile – 38
Figure HS-6: Crude Death Rates Among the Population Age 75 and over for Michigan’s Leading Causes of
Death in Metropolitan, Micropolitan, and Rural Areas in 2005
0
500
1000
1500
2000
2500
Heart D
isease
Cance
r
Stroke
CLRD
Uninten
tiona
l Injur
ies
Diabete
s
Alzheim
er's
Pneum
onia/In
fluen
za
Kidney D
isease
Suicide
Rate
per
100
,000
Pop
ulat
ion
Michigan Metropolitan Micropolitan Rural
The leading cause of death among all Michigan regions for the age group 75 and over is heart disease. This age group accounts for 56.9% of deaths in 2005. In 2005, heart disease accounted for over a third (33.5%) of the deaths in this age group. The second leading cause of death is cancer (17.9% of deaths). The remaining eight leading causes of death fell drastically behind the two front runners, with the closest one, stroke, having half the death rate of cancer. With the ten leading causes of death, there is little variation between metropolitan, micropolitan and rural counties in Michigan. The largest variation occurs in heart disease between micropolitan and metropolitan counties, where metropolitan counties have an aggregate rate close to 200 more deaths per 100,000 population than micropolitan counties. In a statewide comparison of death rates, rural counties have lower rates for seven of the ten leading causes of death. The three exceptions are CLRD, Alzheimer’s and suicide, with the biggest difference in CLRD (54 per 100,000 population). Years of Potential Life Lost (<75) Years of Potential Life Lost (YPLL) are a measurement used to highlight the toll that deaths can take among people under age 75 (the expected length of life), which emphasizes deaths that occur during the years of raising a family and working. Years of potential life lost are calculated as the difference from the age at death to age 75.

Michigan Rural Health Profile – 39
Figure HS-7: Rate of Years of Potential Life Lost Below Age 75 Due to Selected Causes of Death in
Metropolitan, Micropolitan, and Rural Areas in 2005
0
300
600
900
1200
1500
1800
2100
Maligna
nt Neo
plasm
s
Heart
Diseas
e
Acciden
ts
Suicide
Congen
ital A
bnorm
alitie
s
Diabete
s
CLRD
Cerebrov
ascu
lar di
sease
s
Liver
Diseas
e
Kidney D
iseas
e
Influenz
a and P
neum
onia
Septic
emia
Rat
er p
er 1
00,0
00 P
opul
atio
n Be
low
75
Year
s of
Age Michigan Metropolitan Micropolitan Rural
For 2005, the rate of years of potential life lost was highest throughout the state due to cancer, heart disease and accidents, however, rates of premature death in rural areas of Michigan for these three causes exceeded metropolitan and micropolitan area rates. Rural areas also experienced the highest YPLL due to all other listed causes of death except diabetes and kidney disease. Cancer and heart disease are commonly thought of as diseases that increase with age. Since the YPLL is thought to be a measure of impact on the younger population, higher rates for these causes of death illustrate the magnitude of these deaths. It is possible that the response to accidents is getting better, and fewer people are dying due to accidents. Or, the sheer volume of individuals dying from cancer and heart disease is so high in the older population that it outranks the other categories. Individuals may be dying at younger ages from complications of heart disease. Or the reason cancer and heart disease outrank the other causes of death may be due to a combination of issues.
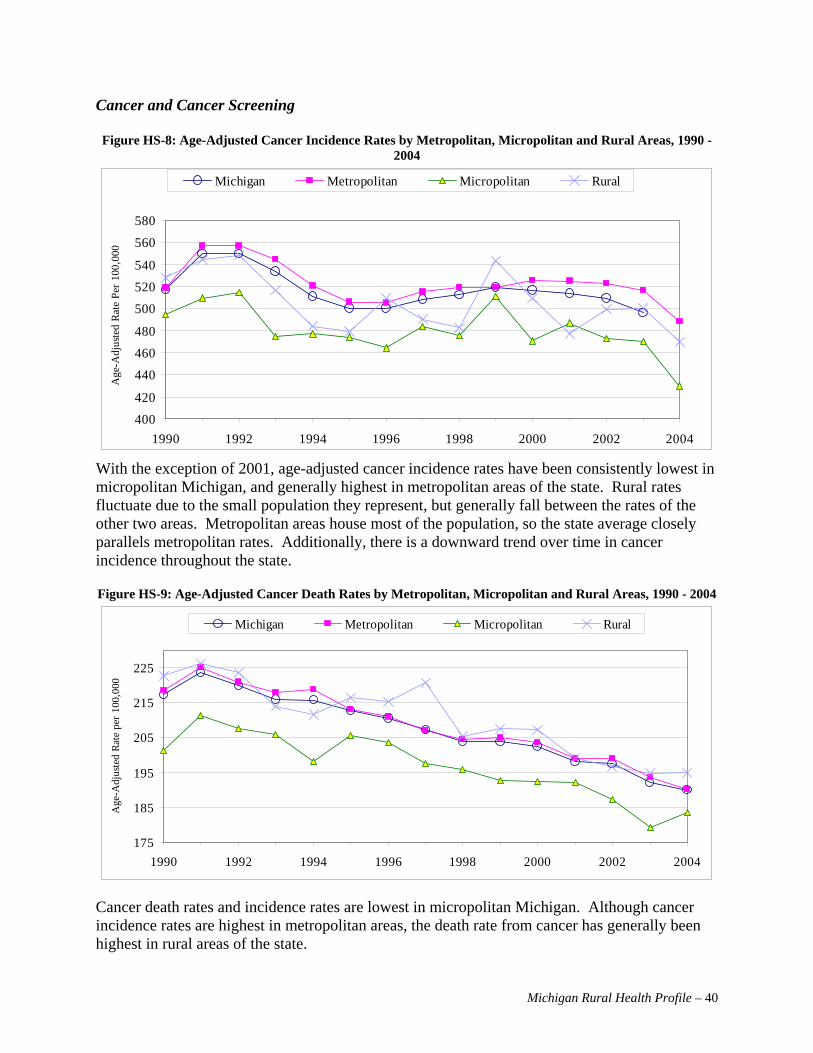
Michigan Rural Health Profile – 40
Cancer and Cancer Screening Figure HS-8: Age-Adjusted Cancer Incidence Rates by Metropolitan, Micropolitan and Rural Areas, 1990 -
2004
400
420
440
460
480
500
520
540
560
580
1990 1992 1994 1996 1998 2000 2002 2004
Age
-Adj
uste
d Ra
te P
er 1
00,0
00
Michigan Metropolitan Micropolitan Rural
With the exception of 2001, age-adjusted cancer incidence rates have been consistently lowest in micropolitan Michigan, and generally highest in metropolitan areas of the state. Rural rates fluctuate due to the small population they represent, but generally fall between the rates of the other two areas. Metropolitan areas house most of the population, so the state average closely parallels metropolitan rates. Additionally, there is a downward trend over time in cancer incidence throughout the state. Figure HS-9: Age-Adjusted Cancer Death Rates by Metropolitan, Micropolitan and Rural Areas, 1990 - 2004
175
185
195
205
215
225
1990 1992 1994 1996 1998 2000 2002 2004
Age
-Adj
uste
d Ra
te p
er 1
00,0
00
Michigan Metropolitan Micropolitan Rural
Cancer death rates and incidence rates are lowest in micropolitan Michigan. Although cancer incidence rates are highest in metropolitan areas, the death rate from cancer has generally been highest in rural areas of the state.

Michigan Rural Health Profile – 41
There have been significant reductions in cancer death rates since 1990. The reduction in death rates exceeds the reduction in incidence rates, which point to improved chances of survival for cancer sufferers. Figure HS-10: Age-Adjusted Breast Cancer Incidence Rates by Metropolitan, Micropolitan and Rural Areas,
1990 - 2004
110
115
120
125
130
135
140
145
150
1990 1992 1994 1996 1998 2000 2002 2004
Age
-Adj
uste
d Ra
te P
er 1
00,0
00
Michigan Metropolitan Micropolitan Rural
Due to the small population in non-metropolitan areas of the state, rates of breast cancer incidence are unpredictable, but generally appear to be lowest in rural Michigan and highest in metropolitan areas of the state. Figure HS-10 demonstrates a reduction in the incidence of breast cancer over time.
Figure HS-11: Age-Adjusted Breast Cancer Death Rates by Metropolitan, Micropolitan and Rural Areas, 1990 - 2004.
15
20
25
30
35
40
1990 1992 1994 1996 1998 2000 2002 2004
Age
-Adj
uste
d Ra
te p
er 1
00,0
00
Michigan Metropolitan Micropolitan Rural
Breast cancer death rates decreased by approximately one-quarter between 1990 and 2004 and the death rates are significantly lower than incidence rates, which may be due to better detection

Michigan Rural Health Profile – 42
and/or enhanced treatment options. Although unstable, breast cancer death rates are generally lowest in micropolitan and rural areas of the state.
Figure HS-12: Age-Adjusted Colorectal Cancer Incidence Rates by Metropolitan, Micropolitan and Rural
Areas, 1990 - 2004
40
45
50
55
60
65
70
75
1990 1992 1994 1996 1998 2000 2002 2004
Age
-Adj
uste
d Ra
te P
er 1
00,0
00
Michigan Metropolitan Micropolitan Rural
Incidence rates for colorectal cancer tend to be highest in rural Michigan, followed by metropolitan areas of the state. As with other types of cancer, rates were lower in all areas of the state in 2004 than they were in the early 1990s. Once again, variation in rates is due to the small number of cases in various areas of the state. Figure HS-13: Age-Adjusted Colorectal Cancer Death Rates by Metropolitan, Micropolitan and Rural Areas,
1990 - 2004
15
17
19
21
23
25
27
29
1990 1992 1994 1996 1998 2000 2002 2004
Age
-Adj
uste
d Ra
te p
er 1
00,0
00
Michigan Metropolitan Micropolitan Rural

Michigan Rural Health Profile – 43
Death rates due to colorectal cancer decreased almost 30 percent between 1990 and 2004 and, on a statewide basis, claimed approximately 18 lives per 100,000 individuals in 2004. Rural areas generally had the highest death rates, with micropolitan areas having the lowest rates. Figure HS-14: Age-Adjusted Lung Cancer Incidence Rates by Metropolitan, Micropolitan and Rural Areas,
1990 - 2004
55
60
65
70
75
80
85
90
1990 1992 1994 1996 1998 2000 2002 2004
Age
-Adj
uste
d Ra
te P
er 1
00,0
00
Michigan Metropolitan Micropolitan Rural
Lung cancer incidence is consistently lower in micropolitan Michigan and generally highest in the rural areas. Unlike other types of cancer, there has not been a steady and significant downward trend in incidence over time. Figure HS-15: Age-Adjusted Lung Cancer Death Rates by Metropolitan, Micropolitan and Rural Areas, 1990
- 2004
5052545658606264666870
1990 1992 1994 1996 1998 2000 2002 2004
Age
-Adj
uste
d Ra
te p
er 1
00,0
00
Michigan Metropolitan Micropolitan Rural

Michigan Rural Health Profile – 44
Lung cancer death rates are substantially higher in rural Michigan than elsewhere in the state, with death rates being lowest in micropolitan areas. As with incidence, the reduction in death rate has not been significant over time.
Figure HS-16: Age-Adjusted Prostate Cancer Incidence Rates by Metropolitan, Micropolitan and Rural Areas, 1990 - 2004
140
160
180
200
220
240
260
280
300
1990 1992 1994 1996 1998 2000 2002 2004
Age
-Adj
uste
d Ra
te P
er 1
00,0
00
Michigan Metropolitan Micropolitan Rural
The incidence of prostate cancer follows a similar pattern across the state, peaking in 1992, falling consistently until 1996 and then rising until 1999. Since 2002, incidence rates have again fallen. Incidence rates across the state are similar in 2004 to what they were in 1990. Prostate cancer incidence rates have fairly consistently been lowest in micropolitan Michigan and highest in metropolitan areas of the state, with rural Michigan falling between the two extremes.
Figure HS-17: Age-Adjusted Prostate Cancer Death Rates by Metropolitan, Micropolitan and Rural Areas, 1990 - 2004
20
25
30
35
40
45
50
1990 1992 1994 1996 1998 2000 2002 2004
Age
-Adj
uste
d Ra
te p
er 1
00,0
00
Michigan Metropolitan Micropolitan Rural

Michigan Rural Health Profile – 45
Although Figure HS-17 does not demonstrate a reduction in the incidence of prostate cancer, this figure shows a steady decline in death rates, perhaps due to earlier diagnosis and better treatment options. By region, death rates parallel incidence rates.
Figure HS-18: Age-Adjusted Invasive Cancer Incidence Rates by Metropolitan, Micropolitan and Rural Areas from 2002 to 2004
400
450
500
550
Age
-Adj
uste
d Ra
te p
er 1
00,0
00
Metropolitan Micropolitan Rural
Looking at the years 2002 to 2004, incidence rates for all types of cancer were highest in metropolitan Michigan, followed by rural areas; micropolitan Michigan had an eleven percent lower incidence rate for all types of cancer than metropolitan areas and a seven percent lower rate than rural areas of the state. Figure HS-19: Age-Adjusted Breast Cancer Incidence Rates by Metropolitan, Micropolitan and Rural Areas
from 2002 to 2004
100
105
110
115
120
125
130
Age
-Adj
uste
d Ra
te p
er 1
00,0
00
Metropolitan Micropolitan Rural

Michigan Rural Health Profile – 46
Breast cancer incidence rates were lowest in micropolitan areas of the state, but due to the large confidence intervals, it is difficult to do a direct comparison of all areas in Michigan.
Figure HS-20: Age-Adjusted Colorectal Cancer Incidence Rates by Metropolitan, Micropolitan and Rural Areas from 2002 to 2004
40
42
44
46
48
50
52
54
56
58
Age
-Adj
uste
d Ra
te p
er 1
00,0
00
Metropolitan Micropolitan Rural
Colorectal cancer incidence rates were lower in micropolitan areas than in metropolitan and rural areas. Due to the confidence interval, it is difficult to say whether there is a difference between metropolitan and rural areas. Figure HS-21: Age-Adjusted Lung Cancer Incidence Rates by Metropolitan, Micropolitan and Rural Areas
from 2002 to 2004
60
62
64
66
68
70
72
74
76
78
80
Age
-Adj
uste
d Ra
te p
er 1
00,0
00
Metropolitan Micropolitan Rural

Michigan Rural Health Profile – 47
The lowest rates for lung cancer were found in micropolitan areas of Michigan, with a rate that very slightly exceeds the rate for metropolitan Michigan. Due to the confidence interval, it is difficult to determine whether there is a difference between metropolitan and rural areas.
Figure HS-22: Age-Adjusted Prostate Cancer Incidence Rates by Metropolitan, Micropolitan and Rural
Areas from 2002 to 2004
150
155
160
165
170
175
180
185
190
195
200
Age
-Adj
uste
d Ra
te p
er 1
00,0
00
Metropolitan Micropolitan Rural
The incidence of prostate cancer was much higher in metropolitan areas than elsewhere in the state, with a 17 percent lower rate in micropolitan than in metropolitan areas.
Figure HS-23: Prevalence Estimates of Selected Cancer Screening Indicators by Metropolitan, Micropolitan, and Rural Areas from 2002, 2004 and 2006 BRFS
55.4
84.0
58.6 54.6
21.1
51.6
59.2
84.0
57.9 57.4
20.2
48.6
53.3
79.2
58.852.3
18.7
46.4
0.0
10.0
20.0
30.0
40.0
50.0
60.0
70.0
80.0
90.0
100.0
Had mammogramand clinical breastexam in past year
(among womenaged 40+)
Had Pap test withinpast 3 years
(among womenaged 18+)
Had PSA test inpast year (amongmen aged 50+)
Had digital rectalexam in past year(among men aged
50+)
Had blood stool testin past year (among
adults aged 50+)
Had sigmoidoscopyor colonoscopy in
past 5 years(among adults aged
50+)
Per
cent
age
of R
espo
nden
ts
Metropolitan Micropolitan Rural

Michigan Rural Health Profile – 48
Cancer screening leads to earlier detection and perhaps better outcomes. So, it is disconcerting that rural residents take advantage of cancer screening procedures less frequently than others, as evidenced by rural Michigan having lower rates for mammograms, Paps, digital rectal exams, stool tests, and sigmoidoscopies or colonoscopies (Figure HS-23). Mortality Heart Disease
Figure HS-24: Age-Adjusted Heart Disease Death Rate by Metropolitan, Micropolitan and Rural Areas, 1991 - 2005
175
195
215
235
255
275
295
315
335
355
375
1991 1993 1995 1997 1999 2001 2003 2005
Age-
Adju
sted
Rat
e pe
r 100
,000
Michigan Metropolitan Micropolitan Rural
As Figure HS-24 demonstrates, heart disease death rates have been consistently lower in micropolitan Michigan over the fifteen year time period than in other areas of the state. Conversely, metropolitan areas have had the highest heart disease death rates, except for 1997-1999, where rural Michigan had the highest heart disease death rates. However, during this fifteen year period, the statewide heart disease death rate has declined 31.6%, from 338.1 per 100,000 to 231.1 per 100,000.

Michigan Rural Health Profile – 49
Kidney Disease
Figure HS-25: Age-Adjusted Kidney Disease Death Rates in Metropolitan, Micropolitan, and Rural Areas, 1991 - 2005
6
8
10
12
14
16
18
1991 1993 1995 1997 1999 2001 2003 2005
Age-
Adju
sted
Rat
e Pe
r 100
,000
Michigan Metropolitan Micropolitan Rural
An important factor to consider when examining kidney disease mortality data is that in 1999, the coding of underlying causes of death was changed, making rates prior to 1999 and those from 1999 to the present difficult to compare. Essentially, the statewide increase in rates from 1998 to 1999 was due to the new classification scheme and not a real increase in kidney disease deaths (see Figure HS-25). Death rates due to kidney disease have consistently been lowest in micropolitan areas of the state, and since 1999, highest in metropolitan Michigan. Rates in non-metropolitan areas of the state are much more erratic due to the small number of cases. Diabetes
Figure HS-26: Age-Adjusted Diabetes Related Death Rates by Metropolitan, Micropolitan, and Rural Areas, 1991 - 2005
70
75
80
85
90
95
1991 1993 1995 1997 1999 2001 2003 2005
Age-
Adju
sted
Rat
e Pe
r 100
,000
Pop
ulat
ion
Michigan Metropolitan Micropolitan Rural

Michigan Rural Health Profile – 50
As seen in Figure HS-26, diabetes death rates are highest in micropolitan areas of the state, followed by fluctuating rates in rural Michigan, due at least in part to the small population in rural areas. Metropolitan areas of the state have the lowest rates of diabetes deaths. Accidents/Unintentional Injuries
Figure HS-27: 2005 Age Specific Death Rates Due to Accidents by Metropolitan, Micropolitan and Rural Areas
0
25
50
75
100
125
150
175
All Ages Under 20 20-44 45-74 75 +Age Group in Years
Rate
per
100
,000
pop
ulat
ion
Michigan Metropolitan Micropolitan Rural
The accidental death rate is higher in rural areas of the state for all age groups except for those aged 75+, for which rural Michigan has the lowest rate (see Figure HS-27). For many age groups, the rural rate of accidental deaths is double the statewide rate. Suicide
Figure HS-28: Crude Suicide Death Rates in Michigan, 1991-2005
0.0
2.0
4.0
6.0
8.0
10.0
12.0
14.0
16.0
18.0
1991 1993 1995 1997 1999 2001 2003 2005
Rat
e pe
r 100
,000
pop
ulat
ion
Michigan Metropolitan Micropolitan Rural

Michigan Rural Health Profile – 51
Between 1991 and 2005, the state as a whole had about 1,000 deaths a year that were caused by suicide (see Figure HS-28). Metropolitan areas account for about 75% of the annual suicides and the remaining 25% of the suicides are split evenly between the micropolitan and rural areas of Michigan. Rural areas in Michigan carry a disproportionate percentage of all Michigan suicide deaths. This is illustrated by the higher suicide death rates in these areas.
Another way to look at suicide is by age group. Figure HS-29 shows suicide rates by age for each area of the state. These age-specific rates are per 100,000 population. For all age categories, metropolitan areas have a suicide rate lower than that of the state average. Rural area rates tend to be higher than the rest of Michigan, except for the age 45-74 category, where the micropolitan area rate is higher. Overall, non-metropolitan Michigan is higher than the state rate, except for micropolitan areas in the age 20-44 category. Comparing the age groups shows that the under 20 category has the lowest suicide rates. The state rate is about the same for the other three categories, but the rate in metropolitan areas shows a small decrease in older age groups, while the death rate for micropolitan areas increases as the age group increases. The highest overall rate for suicides is the age 20-44 group in rural Michigan at about 18 deaths per 100,000 population, with the 75+ age group a close second.
Figure HS-29: 2005 Age Specific Suicide Death Rates by Metropolitan, Micropolitan and Rural Areas
0.02.04.06.08.0
10.012.014.016.018.020.0
All Ages Under 20 20-44 45-74 75 +Age Group in Years
Rate
per
100
,000
Pop
ulat
ion
Michigan Metropolitan Micropolitan Rural

Michigan Rural Health Profile – 52
Homicide
Figure HS-30: Crude Homicide Death Rates by Metropolitan, Micropolitan and Rural Areas, 1991 - 2005
0
2
4
6
8
10
12
14
16
1991 1993 1995 1997 1999 2001 2003 2005
Metro Micro Rural Michigan
Figure HS-30 depicts the crude homicide rates for metropolitan, micropolitan, rural Michigan, and the statewide average. For the past fifteen years, the homicide rates in metropolitan Michigan have been about four times higher than those of rural and metropolitan Michigan, and even as much as five times higher than in the early 1990s. Homicide rates have declined over this fifteen year period, especially in metropolitan Michigan, which has seen a 44% decline in its homicide rate. Hospitalizations Preventable Hospital Trends
Figure HS-31: Preventable Hospitalizations as a Rate of Total Hospitalizations in Metropolitan, Micropolitan, and Rural Areas, 1991-2005
0
5000
10000
15000
20000
25000
1991 1993 1995 1997 1999 2001 2003 2005Rat
e pe
r 10
0,00
0 To
tal D
isch
arge
s
Michigan Metropolitan Micropolitan Rural

Michigan Rural Health Profile – 53
Figure HS-31 shows the rate of preventable hospitalizations per 100,000 total hospitalizations by metropolitan, micropolitan, and rural areas from 1991-2005. Preventable hospitalizations are “diagnoses for which timely and effective outpatient care can help to reduce the risks of hospitalization. Examples of such diagnoses are pneumonia, asthma, cellulitis, diabetes, dehydration, etc. High hospitalization rates for such conditions in a community may indicate: 1) A lack or failure of prevention efforts, 2) A primary care resource shortage, 3) Poor performance of primary health care delivery systems, or 4) Other factors that create barriers to obtaining timely and effective care”D
iD.
The overall rate for preventable hospitalizations has stayed relatively constant over the 15-year time period. Micropolitan areas have seen only a two percent increase, and rural areas experienced a relatively small increase of five percent. However, metropolitan areas had a larger increase of about 15% (from 17,677 to 20,437 discharges) during the same time period. Previously, rural areas had the highest rate of preventable hospitalizations until 2001, when metropolitan areas started to rank first in this category. The rates in micropolitan areas have been consistently lower by approximately two percent. Total Hospitalizations
Figure HS-32: 2005 Hospitalization Rates in Metropolitan, Micropolitan, and Rural Areas
0
500
1000
1500
2000
2500
Cance
r
Cerebro
vasc
ular D
iseas
es
Delive
ries
Heart D
iseas
es
Infec
tious
Dise
ases
Injury
and P
oison
ing
Newbo
rns
Osteoa
rthros
is
Pneum
onia
Psych
oses
Metropolitan Micropolitan Rural
Figure HS-32 shows the metropolitan, micropolitan and rural hospitalization rates per 100,000 for 2005. Discrepancies exist between the hospital utilization rates of these three areas. Rural residents are more likely to be hospitalized for cancer, cerebrovascular disease, heart disease, injury and poisoning, osteoarthrosis, and pneumonia. Of the aforementioned, heart disease hospitalization rates in rural Michigan are 31% higher than those of metropolitan Michigan. Metropolitan residents, on the other hand, are more likely to be hospitalized for deliveries, newborns, and psychoses.

Michigan Rural Health Profile – 54
The “State Characteristics” chapter of this report notes that rural Michigan’s 85+ population has grown by over 80%, while the under 10 population has decreased by about 10%. The hospitalization rates appear to correspond with those findings. Because rural areas experienced a larger growth in their elderly population than the micropolitan and metropolitan areas, this may help explain why illnesses associated with the elderly, such as heart disease, pneumonia, etc, have higher hospitalization rates. Behavioral Risk Factors The Behavioral Risk Factor Survey (BRFS) is a nationwide survey asking respondents about their risk factors associated with premature morbidity and mortality among adults (aged 18 and older)D
iiD. The information is collected through telephone surveys every other year. Due to small
sample sizes, the data in this report is aggregated from the three survey years of 2002, 2003, and 2005. The information presented relates to obesity, nutrition, physical activity, alcohol and tobacco use, and blood cholesterol. Obesity, nutrition, and physical activity will be addressed in the “Healthy Lifestyles” focus of Michigan’s Rural Health Plan. Obesity
Figure HS-33: Overweight and Obese Prevalence Estimates in Metropolitan, Micropolitan, and Rural Area, 2002 - 2006 BRFS
36.3
25.9
36.8
26.1
36.730.4
0
5
10
15
20
25
30
35
40
Overweight (BMI 25.0-29.9) Obese (BMI >/= 30.0)
Perc
enta
ge o
f Res
pond
ents
Metropolitan Micropolitan Rural
Adult obesity is defined as having a Body Mass Index (BMI) of 30 or more, while overweight adults have a BMI between 25.0 and 29.9. Slightly more than one-third of Michigan residents are overweight, with fairly even rates in all areas of the state. However, although more than one in four residents throughout the state is obese, obesity rates are even higher in rural areas by more than four percentage points, as shown in Figure HS-33. In total, close to two-thirds of Michigan residents are either overweight or obese. In 1995, 37.2% of all Michigan residents were overweight, while 18.2% were obese. In 2005, the percentage of overweight Michigan residents had decreased by 0.9%, while the percentage of

Michigan Rural Health Profile – 55
obese residents rose by eight percent. These changes indicate that over time, the number of overweight Michigan residents has remained relatively constant, but the number of obese residents has increased dramatically. This increase has been offset by a substantial decrease in the number of healthy weight residents. Physical Activity and Nutrition
Figure HS-34: Prevalence Estimates of Selected Diet and Exercises Behaviors in Metropolitan, Micropolitan, and Rural Areas from 2002-2006 BRFS
22.4
52.1
77.6
22.8
47.8
76.6
25.6
51.1
79.1
0102030405060708090
No leisure-time physicalactivity in past month
Inadequate physical activity('02, '03, '05)
Inadequate fruit and vegetableconsumption ('02, '03, '05)
Perc
enta
ge o
f Res
pond
ents
Metropolitan Micropolitan Rural
Figure HS-34 shows rates for various unhealthy behaviors are high throughout the state. Approximately one in four Michigan residents had no leisure-time physical activity the previous month, about half had inadequate physical activity, and more than three-quarters ate insufficient amounts of fruits and vegetables. Comparing two time periods shows that the amount of adequate physical activity of Michiganians as a whole has been rising. In 2001, 45.6% Michigan residents had adequate physical activity, while in 2005 that percentage rose to 49.5%. These percentages indicate that people are taking steps towards incorporating physical activity into their daily lives. Past and current vegetable consumption has stayed relatively consistent over time. In 2001, 22.8% of Michigan residents had at least five or more fruits and vegetables a day. In 2005, that percentage was 23.4%.
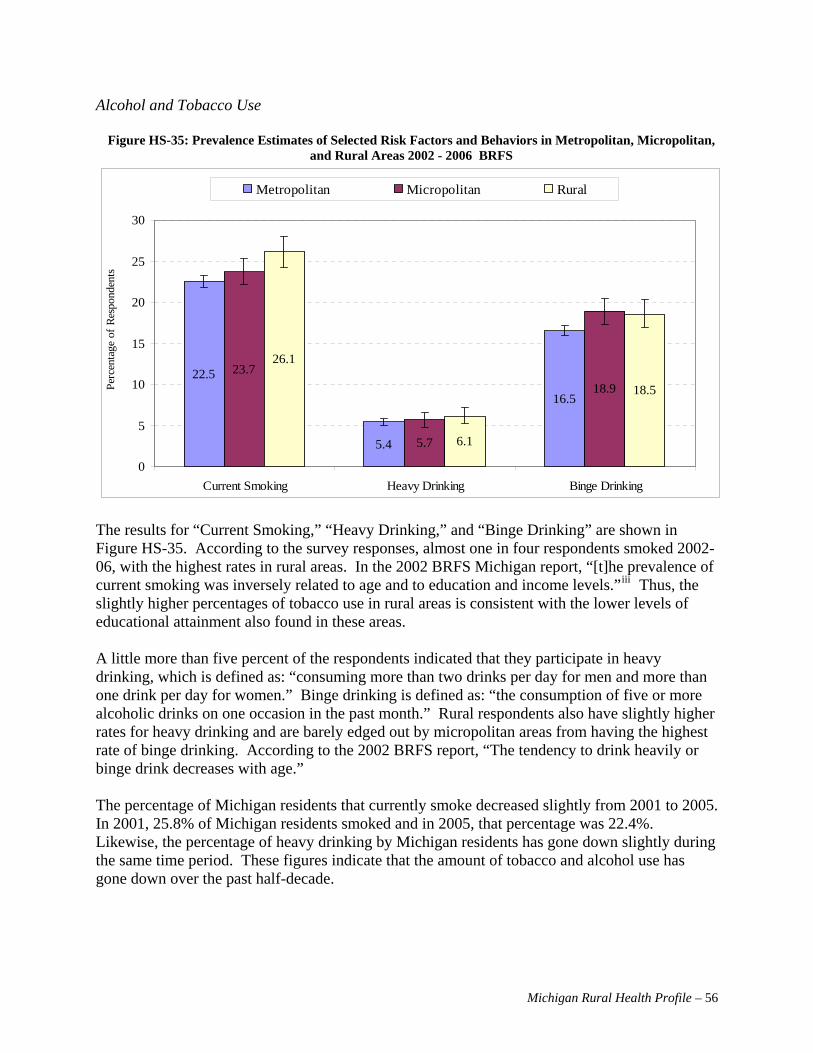
Michigan Rural Health Profile – 56
Alcohol and Tobacco Use
Figure HS-35: Prevalence Estimates of Selected Risk Factors and Behaviors in Metropolitan, Micropolitan, and Rural Areas 2002 - 2006 BRFS
22.5
5.4
16.5
23.7
5.7
18.9
26.1
6.1
18.5
0
5
10
15
20
25
30
Current Smoking Heavy Drinking Binge Drinking
Perc
enta
ge o
f Res
pond
ents
Metropolitan Micropolitan Rural
The results for “Current Smoking,” “Heavy Drinking,” and “Binge Drinking” are shown in Figure HS-35. According to the survey responses, almost one in four respondents smoked 2002-06, with the highest rates in rural areas. In the 2002 BRFS Michigan report, “[t]he prevalence of current smoking was inversely related to age and to education and income levels.”D
iiiD Thus, the
slightly higher percentages of tobacco use in rural areas is consistent with the lower levels of educational attainment also found in these areas. A little more than five percent of the respondents indicated that they participate in heavy drinking, which is defined as: “consuming more than two drinks per day for men and more than one drink per day for women.” Binge drinking is defined as: “the consumption of five or more alcoholic drinks on one occasion in the past month.” Rural respondents also have slightly higher rates for heavy drinking and are barely edged out by micropolitan areas from having the highest rate of binge drinking. According to the 2002 BRFS report, “The tendency to drink heavily or binge drink decreases with age.” The percentage of Michigan residents that currently smoke decreased slightly from 2001 to 2005. In 2001, 25.8% of Michigan residents smoked and in 2005, that percentage was 22.4%. Likewise, the percentage of heavy drinking by Michigan residents has gone down slightly during the same time period. These figures indicate that the amount of tobacco and alcohol use has gone down over the past half-decade.

Michigan Rural Health Profile – 57
Cholesterol
Figure HS-36: Prevalence Estimates of Blood Cholesterol Screening and Risk Factors by Metropolitan, Micropolitan , and Rural Areas, 2002 - 2006
80.5
38.0
78.0
38.2
78.6
43.7
0102030405060708090
Blood cholesterol ever checked ('03, '05) High blood cholesterol among those evertested ('03, '05)
Perc
enta
ge o
f Res
pond
ents
Metropolitan Micropolitan Rural
High levels of cholesterol can lead to build-up in the arteries, ultimately resulting in atherosclerosis. According to the CDC, 30%–40% of coronary heart disease and 10%–20% of strokes in the United States are attributable to high cholesterol levels, justifying the use of cholesterol as an indicator in determining the risk of heart disease and stroke. High cholesterol levels have been associated with lack of physical activity, high fat intake, smoking cigarettes, diabetes, and obesity. While there has been a significant increase cholesterol screening, it is estimated that 25 percent of all adults over age 35 had not received blood testing to check cholesterol levels in the previous five years at the time of the surveys.D
ivD The prevalence of
cholesterol screening is similar throughout Michigan; however, the incidence of elevated blood cholesterol is higher in rural Michigan than metropolitan areas by more than five percentage points (see Figure HS-36).

Michigan Rural Health Profile – 58
Maternal and Child Health Infant Mortality Rates
Figure HS-37: Infant Mortality Rates by Area in Michigan Three-Year Rolling Average, 1990 - 2004
0.0
5.0
10.0
15.0
20.0
25.0
30.0
35.0
40.0
90-92 91-93 92-94 93-95 94-96 95-97 96-98 97-99 98-00 99-01 00-02 01-03 02-04
Rat
e Pe
r 1,0
00 L
ive
Birt
hs
Michigan Metropolitan Micropolitan Rural
Infant mortality rates (Figure HS-37) were highest in metropolitan Michigan and lowest in micropolitan areas of the state, based on three-year rolling averages since 1993. Rates gradually declined between 1990 and 1995, and then leveled off in all areas.
Figure HS-38: White Infant Death Rates, Three-Year Rolling Averages by Metropolitan, Micropolitan and Rural Areas, 1991 - 2005D
vD
5.0
5.5
6.0
6.5
7.0
7.5
8.0
8.5
91-93 93-95 95-97 97-99 99-01 01-03 03-05
Dea
th R
ate
per 1
,000
Liv
e B
irth
Michigan Metropolitan Micropolitan Rural
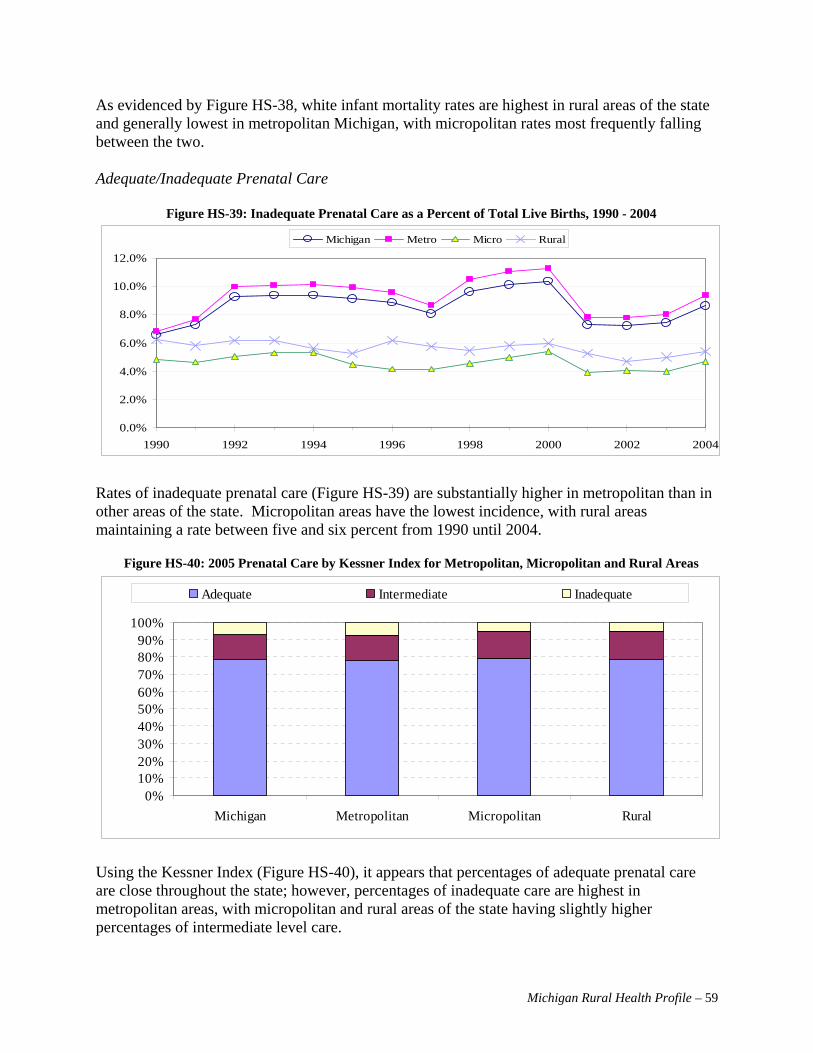
Michigan Rural Health Profile – 59
As evidenced by Figure HS-38, white infant mortality rates are highest in rural areas of the state and generally lowest in metropolitan Michigan, with micropolitan rates most frequently falling between the two. Adequate/Inadequate Prenatal Care
Figure HS-39: Inadequate Prenatal Care as a Percent of Total Live Births, 1990 - 2004
0.0%
2.0%
4.0%
6.0%
8.0%
10.0%
12.0%
1990 1992 1994 1996 1998 2000 2002 2004
Michigan Metro Micro Rural
Rates of inadequate prenatal care (Figure HS-39) are substantially higher in metropolitan than in other areas of the state. Micropolitan areas have the lowest incidence, with rural areas maintaining a rate between five and six percent from 1990 until 2004.
Figure HS-40: 2005 Prenatal Care by Kessner Index for Metropolitan, Micropolitan and Rural Areas
0%10%20%30%40%50%60%70%80%90%
100%
Michigan Metropolitan Micropolitan Rural
Adequate Intermediate Inadequate
Using the Kessner Index (Figure HS-40), it appears that percentages of adequate prenatal care are close throughout the state; however, percentages of inadequate care are highest in metropolitan areas, with micropolitan and rural areas of the state having slightly higher percentages of intermediate level care.

Michigan Rural Health Profile – 60
Low Birthweight
Figure HS-41: Low Birthweight Rates Among Singleton Births in Metropolitan, Micropolitan, and Rural Areas per 1,000 Singleton Live Births, 1991 - 2005
40
45
50
55
60
65
70
91-93 93-95 95-97 97-99 99-01 01-03 03-05
Michigan Metropolitan Micropolitan Rural
NOTE: Low birthweight babies are born weighing less than 2,500 mg As seen in Figure HS-41, rural and micropolitan areas experienced minor increases in the incidence of low birthweight single births since the early 1990s. Rates in rural areas were slightly higher than in micropolitan areas of the state. Metropolitan area rates have remained fairly constant during this time period, although they are consistently higher than elsewhere in the state. Teenage Pregnancies
Figure HS-42: Teen Pregnancy Rates in Metropolitan, Micropolitan, and Rural Areas per 1,000 Female Teen Population, 1989 - 2005
0
20
40
60
80
100
120
1989 1991 1993 1995 1997 1999 2001 2003 2005
Michigan Metropolitan Micropolitan Rural
Figure HS-42 shows that teen pregnancy rates have been higher in metropolitan than non-metropolitan areas of the state, however, a steady and significant reduction can be seen since

Michigan Rural Health Profile – 61
1990. Rates in rural areas have consistently been lower than in metropolitan Michigan, and also experienced a steady decline from 1994 to 2005. Micropolitan areas of the state have consistently had the lowest teen pregnancy rates, with a downward trend that mirrored the rest of the state beginning in 1990. In 2005, rates across the state were less than 60 pregnancies per 1,000 female teens.
Figure HS-43: Incidence of Teenagers Giving Birth as a Rate of Annual Live Births in Metropolitan, Micropolitan, and Rural Areas, 1990 - 2004.
0.0
10.0
20.0
30.0
40.0
50.0
60.0
1990 1992 1994 1996 1998 2000 2002 2004
Michigan Metro Micro Rural
Prior to 1996, metropolitan areas of Michigan had the highest rate of teen births; however, since 1997, all areas of the state have had similar rates which have steadily declined over time (Figure HS-43).
Table HS-3 Change in Pregnancy Rate by Age Group in Metropolitan, Micropolitan, and Rural Areas, 1991-1995 to 2001-2005
Age of Change in Rate 1991-1995 to 2001-2005 Mother Metropolitan Micropolitan Rural Michigan
<15 -0.7 -0.1 -0.2 -0.615-19 -21.2 -11.9 -19.1 -20.120-24 -5.5 -11.8 -33.0 -7.425-29 4.4 -0.2 2.2 3.930-34 14.8 17.3 10.3 14.835-39 10.4 7.6 5.1 9.840+ 2.7 1.5 1.6 2.5
Between 1991-95 and 2001-05, a significant shift occurred in the age at which women gave birth (Table HS-3). Dramatic reductions in excess of 20 per 1,000 population occurred in the statewide rate for teens between the ages of 15 and 19 giving birth, with the largest decrease being in metropolitan and rural areas of the state. Major reductions were seen in rural areas for women aged 20 to 24. At the other end of the spectrum, there were increases in the birth rate for women over the age of 25 throughout the state, with an increase of almost 15 percent in the rate of women aged 35 to 39 giving birth.

Michigan Rural Health Profile – 62
Blood Lead Levels in Children
Figure HS-44: Blood Lead Levels in Children Under the Age of Six, 1998 - 2006
-20,00040,00060,00080,000
100,000120,000140,000160,000
1998 1999 2000 2001 2002 2003 2004 2005 2006
# of Children Tested who were not Medicaid-Enrolled# of Children Tested who were Medicaid-Enrolled
Figure HS-44 shows that there have been consistent increases in the number of children who were tested for blood lead levels over time with most of these children being Medicaid-enrolled. Almost twice as many children were tested in 2006 as were tested in 1998.
Figure HS-45: Blood Lead Levels in Children Under the Age of Six by Metropolitan, Micropolitan and Rural Areas, 1998 - 2006
02468
101214161820
1998 2000 2002 2004 2006
Perc
enta
ge T
este
d
Michigan Metropolitan Micropolitan Rural
Substantial increases in the percentage of Michigan children tested for elevated blood lead levels have been realized statewide since 1998 (Figure HS-45). Although more testing has historically been done in metropolitan areas, testing in other areas of the state has increased. A likely reason for the original emphasis on metropolitan children may have been that more children in cities

Michigan Rural Health Profile – 63
live in older housing than elsewhere in the state and are thus most likely to suffer from lead poisoning. As the testing progressed, children who needed to be tested in metropolitan areas received the necessary evaluations, allowing testing to continue in other areas of the state where the risk may not have been as high. Figure HS-46: Percentage of Children Under Age Six Years with Venously Elevated Blood Lead Levels by
Metropolitan, Micropolitan and Rural Areas, 1998 - 2006
0123456789
1011
1998 2000 2002 2004 2006
Perc
enta
ge W
ith E
BLL
>= 1
0 ug
/dL
Michigan Metropolitan Micropolitan Rural
In contrast to Figure HS-45, which shows more children being tested for elevated blood lead levels each year, Figure HS-46 demonstrates that a steadily decreasing percentage of children are found with venously elevated lead levels each year. Oral Health Figure HS-47: Proportion of Michigan Third Grade Children with Dental Decay, Caries and Sealants from
MDCH Count Your Smiles Report, 2005 - 2006
0%
10%
20%
30%
40%
50%
60%
70%
Upper Peninsula
Northern Lower Peninsula
Southern Lower Peninsula-Rural
Southern Lower Peninsula-Urban
Wayne County
Oakland County
Macomb County
Untreated Decay Caries Sealants
Data about children’s dental health is only available by region for certain areas of the state and by county for others. Figure HS-47 shows that the greatest incidence of caries (cavities) and

Michigan Rural Health Profile – 64
untreated decay is in the Upper Peninsula, followed by most of the Lower Peninsula and Wayne County; Oakland and Macomb had significantly lower levels of both caries and untreated decay than other areas of the state. Across the state, the incidence of untreated decay is less than half that of caries. Rural areas of the southern peninsula have the lowest incidence of sealants in the state. Child Immunizations
Figure HS-48: 2007 Percent of Children Receiving 4:3:1:3:3:1 Immunization-from Michigan Care Improvement RegistryD
viD
66%
68%
70%
72%
74%
76%
78%
Metropolitan Micropolitan Rural
4:3:1:3:3:1 Immunized
In Figure HS-48, more than three out of four children in micropolitan and rural areas of the state receive appropriate immunizations before the age of three. Only seven out of ten children in metropolitan areas are reported to receive such protection.
Figure HS-49: 2007 Percent of Children Receiving 4:3:1:3:3:1 Immunization in Comparison with Total Population from Michigan Care Improvement Registry
Number of Children Immunized 2007 Michigan Care Improvment Registry
0
50,000
100,000
150,000
200,000
Metropolitan Micropolitan Rural
4:3:1:3:3:1 Immunized Total Population
Approximately 75,000 children in Michigan are not immunized, with about 50,000 of these children living in metropolitan areas of the state (Figure HS-49).

Michigan Rural Health Profile – 65
Communicable Diseases The following section looks at the incidence rates of communicable diseases in metropolitan, micropolitan, and rural areas of Michigan. In some cases, the data for rural and micropolitan areas are so small that those two categories are combined and stated as “non-metropolitan areas”. HIV/AIDS
Figure HS-50: Incidence Rate of HIV Diagnoses by Metropolitan, Micropolitan and Rural Areas, 1990 - 2005
0.0
5.0
10.0
15.0
20.0
25.0
1990 1991 1992 1993 1994 1995 1996 1997 1998 1999 2000 2001 2002 2003 2004 2005
Rat
e of
Inci
denc
e pe
r 100
,000
pop
ulat
ion
Michigan Metropolitan Micropolitan Rural
Figure HS-50 shows the rates of new HIV/AIDS cases, which is much higher in metropolitan areas, compared to other areas of the state.D
viiD The overall rate of new diagnoses declined from
1990 to 2005. Due to small numbers in the micropolitan and rural areas, the annual rates fluctuate significantly, but remains under five cases per 100,000 population. By the end of 2003, between 1,039,000 to 1,185,000 individuals were living with HIV/AIDS in the United StatesD
viiiD. Nationally, the CDC estimates that approximately 40,000 individuals
become newly infected with HIV each year, while about 17,000 infected individuals die from HIV/AIDS annually. About half of the new transmissions are diagnosed in Blacks, as compared to White (non-Hispanic), Hispanic, and Asian/Pacific Islander, and American Indian/Alaska Native (AIAN). The report also indicated that there are three times more men infected with HIV than womenD
ixD.
The CDC also reports that individuals are surviving longer with HIV/AIDS due to advances in treatment. In the 2005 CDC report, about 75% of the HIV/AIDS patients who were diagnosed in 1997 were still aliveD
xD.

Michigan Rural Health Profile – 66
STDs-Chlamydia
Table HS-4: 2005 Chlamydia Cases and Rates in Metropolitan, Micropolitan, and Rural AreasD
xiD
Area Cases
Reported in 2005
Percent Distribution
in 2005
Rate per 100,000
population Michigan 38,729 382.7 Metropolitan 36,026 93.1 437.2 Micropolitan 1,938 5.1 178.9 Rural 765 1.8 95.9 Chlamydia has the highest rate of incidence in metropolitan areas, based on the number of new cases reported in 2005, along with the incidence per 100,000 population. This disease has the lowest incidence rate in rural areas, where the rate is less than one-fourth of the metropolitan rate; the micropolitan rate is less than half of the metropolitan rate. Table HS-4 shows the number of reported cases. Map HS-1 shows the distribution of new incidence by county. Figure HS-51 shows the rate of cases in metropolitan, micropolitan, and rural counties across Michigan. Figure HS-51: 2005 Chlamydia Rates per 100,000 Population by Metropolitan, Micropolitan and Rural Areas
050
100150200250300350400450500
Michigan Metropolitan Micropolitan Rural
Inci
denc
e R
ate
per 1
00,0
00 P
opul
atio
n
Michigan Metropolitan Micropolitan Rural
Map HS-1: 2005 Chlamydia Cases Reported by County for Both Sexes- Total Cases: 38,729

Michigan Rural Health Profile – 67
STDs-Gonorrhea
Table HS-5: 2005 Gonorrhea Cases and Rates in Metropolitan, Micropolitan, and Rural AreasD
xiiD
Area Cases
Reported in 2005
Percent Distribution
in 2005
Rate per 100,000
population Michigan 17,684 174.7 Metropolitan 17,331 98.1 210.3 Micropolitan 230 1.4 21.2 Rural 123 0.7 15.4 As seen in Table HS-5, the Gonorrhea incidence rate is highest in metropolitan areas of the state with over 200 cases per 100,000 population, while micropolitan and rural areas have 21 and 15 cases per 100,000 population, respectively. In other words, metropolitan areas have 10 times the rate of incidence compared to the rest of Michigan. However, 80 percent of the population lives in metropolitan areas of the state. Map HS-1 details the distribution of cases; 20 counties had no cases of gonorrhea in 2005. Figure HS-52 shows the rate of cases in metropolitan, micropolitan, and rural counties across Michigan. Figure HS-52: 2005 Gonorrhea Rates per 100,000 Population by Metropolitan, Micropolitan and Rural Areas
0.0
50.0
100.0
150.0
200.0
250.0
Michigan Metropolitan Micropolitan Rural
Inci
denc
e R
ate
per 1
00,0
00 p
opul
atio
n
Map HS-1: 2005 Gonorrhea Cases Reported by County for Both Sexes- Total Cases: 17,684

Michigan Rural Health Profile – 68
STDs-Syphilis
There are relatively few cases of syphilis in Michigan, with most of them occurring in metropolitan areas. Nine cases of syphilis were reported in micropolitan and rural areas in 2005. Only 25 counties had a reported case of syphilis in 2005, and nine of these counties reported only a single case. Table HS-6 shows the number of reported cases. Map HS-3 shows the distribution of new incidence by county. Figure HS-53 shows the rate of cases in metropolitan, micropolitan, and rural counties. Figure HS-53: 2005 Syphilis Incidence Rates per 100,000 Population in Metropolitan, Micropolitan and Rural
Areas
0.0
1.0
2.0
3.0
4.0
5.0
6.0
7.0
Michigan Metropolitan Micropolitan Rural
Inci
denc
e R
ate
per 1
00,0
00 p
opul
atio
n
Table HS-6: 2005 Syphilis Cases and Rates in Metropolitan, Micropolitan, and Rural AreasD
xiiiD
Area Cases
Reported in 2005
Percent Distribution
in 2005
Rate per 100,000
population Michigan 488 4.8 Metropolitan 479 98.2 5.8 Micropolitan 5 1.0 <1.0 Rural 4 0.8 <1.0
Map HS-3: 2005 Syphilis Cases Reported by County for Both Sexes- Total Cases: 488

Michigan Rural Health Profile – 69
Hepatitis Figure HS-54 shows the number of hepatitis cases in Michigan from 1990-2005 (Hepatitis A, B, and C combined). The higher incidence occurs in metropolitan Michigan, which has been decreasing over time. However, the incidence is too small to show a trend over time for non-metropolitan Michigan.
Figure HS- 54 Hepatitis (A, B, and C) Cases in Michigan, 1990 - 2005
Figure HS-55 Crude Hepatitis (A, B, and C) Incidence Rates in Michigan, 1990 - 2005
0
500
1000
1500
2000
2500
3000
1990 1992 1994 1996 1998 2000 2002 2004
Metro Micro Rural
0.05.0
10.015.020.025.030.035.040.0
1990 1992 1994 1996 1998 2000 2002 2004
Metro Micro Rural
Looking at Table HS-55, the crude incidence rates in Michigan for Hepatitis in metropolitan Michigan had much higher incidence rates per population during most of that period, but in 2004, the rates for all areas dropped to less than five cases per 100,000 population. In 2005, all areas were within 0.5 point of each other and less than four cases per 100,000 population, with metropolitan at 3.6, micropolitan at 3.4, and rural Michigan at 3.9 cases. Salmonellosis According to the CDC, every year, approximately 40,000 cases of Salmonellosis are reported in the United States. Salmonella is a bacterium in the intestinal track that causes symptoms like diarrhea, fever, or abdominal cramps. More severe cases occur when the bacterium makes it into the bloodstream from the intestine, and into other body sites. Infection this severe can cause death. A certain serotype (typhimurium) may also cause Typhoid Fever. Because many cases are fairly mild and may only last four to seven days, many cases are not diagnosed or reported, increasing the actual number of infections by thirty or more times. Since 1991, Michigan’s salmonellosis cases were below 1,200 annually, and decreased to 929 in 2005. Figure HS-56 shows the rolling average of the incidence rates for the various areas in Michigan: metropolitan, micropolitan, and rural counties. All of Michigan remains below 12 cases per 100,000 population, with metropolitan and rural Michigan down to about eight cases per 100,000 population. The rolling averages are used for this report due to small numbers for micropolitan and rural Michigan, making it easier to see the overall trend for incidence rates.

Michigan Rural Health Profile – 70
Figure HS-56: 3-year rolling average for Salmonella Infection Rates for 100,000 population, 1990 - 2005
0
2
4
6
8
10
12
14
90-92 92-94 94-96 96-98 98-00 00-02 02-04
Metro Micro Rural
Chickenpox (Varicella) Figure HS-57: Chickenpox Infection Rates in Michigan
per 100,000 population from 1990-2003 Figure HS-58: Chickenpox Cases from 1990-2003
0.0
50.0
100.0
150.0
200.0
250.0
300.0
350.0
400.0
450.0
500.0
1990 1992 1994 1996 1998 2000 2002
Michigan Metro Micro Rural
0
5,000
10,000
15,000
20,000
25,000
30,000
35,000
40,000
1990 1992 1994 1996 1998 2000 2002
Metro Micro Rural
Chickenpox is a common and highly infectious disease. In 1995, the varicella (chickenpox) vaccine became available, and was recommended by the CDC as a part of the standard immunizations given to children aged 12 to 18 months. Prior to the introduction of the vaccine, about four million cases of chickenpox occurred annually in the United States, resulting in approximately 11,000 hospitalizations and 100 deaths. The incidence of chickenpox has declined substantially throughout Michigan since 1990, due, in part, to the availability of the varicella vaccine (Figure HS-58). Between 1990 and 2001, rates of chickenpox have been lower in rural Michigan than elsewhere in the state; in 2003 and 2004 the rates for all areas were fewer than 50 cases per 100,000 population (Figure HS-57).D
xivD

Michigan Rural Health Profile – 71
However, even with the decline in incidence, there is some concern that the low rates may be due to underreporting since reporting is voluntary through the schools. Tuberculosis
Figure HS-59: Tuberculosis Incidence Rates in Michigan, per 100,000 population, 1990 - 2005
Figure HS-60: Tuberculosis Death Rates in Michigan, per 100,000 population, 1990 - 2005
0.0
1.0
2.0
3.0
4.0
5.0
6.0
7.0
1990 1992 1994 1996 1998 2000 2002 2004
Rate
per
100
,000
pop
ulat
ion
Michigan Metro NonMetro
At the turn of the last century, Tuberculosis (TB) was the leading killer among communicable diseases. In 1900, TB killed at a rate of 103.3 people per 100,000 population, which was greater than the mortality rate for cancer (60.3), slightly higher than pneumonia (98.6), but not higher than heart disease (117.1). One hundred years later, TB is no longer among the leading killers, with an annual death rate of 0.2 per 100,000 population, and an incidence rate of 2.2 cases per 100,000 population (Figure HS-60).D
xvD
The number of Michigan TB cases decreased by half between 1990 and 2005, with the concentration of cases remaining significantly higher in metropolitan areas (95% of cases) than in non-metropolitan areas (five percent of cases). Preventative measures including vaccination have been effective in eliminating diseases like polio, typhoid fever, and measles in Michigan. TB, however, is still present among Michigan’s population with between 200 and 300 cases annually. The World Health Organization estimates that about one million people are infected with TB annually, and only about five percent of those cases are found in industrialized countries. An emerging threat from TB is the occurrence of drug resistant strains, extensively drug-resistant (XDR) TB and multidrug-resistant (MDR) TB. To date, only a handful of drug resistant TB cases have been documented in Michigan.
0.0
0.2
0.4
0.6
0.8
1.0
1990 1992 1994 1996 1998 2000 2002 2004
Deat
h Ra
te p
er 1
00,0
00 p
opul
atio
n
Michigan

Michigan Rural Health Profile – 72
i Definition of “Ambulatory Care Sensitive hospitalizations” or preventable hospitalizations from the Michigan Department of Community Health. http://www.michigan.gov/mdch/0,1607,7-132-2944_5324_6867---,00.html ii National Center for Chronic Disease Prevention and Health Promotion, Behavioral Risk Factor Surveillance System. Home page: http://www.cdc.gov/brfss/index.htm. April 2005. iii State of Michigan. 2002 Michigan BRFS Report, page 9. iv National Center for Chronic Disease Prevention and Health Promotion, Chronic Disease Indicators: Cholesterol screening among adults aged >= 18 years. http://apps.nccd.cdc.gov/cdi/IndDefinition.aspx?IndicatorDefinitionID=24 v Source: Michigan Resident Death, Birth and Fetal Death Files, Vital Records and Health Data Development Section, MDCH Population, Michigan Information Center, Michigan Department of Management & Budget, 1990-2004. vi The immunizations protect against: Diphtheria, Haemophilus influenza type B, Hepatitis A, Hepatitis B, Measles, Mumps, Pertussis (whooping cough), Pneumococcal disease, Polio, Rubella, Rotzvirus, Tetanus and Varicella (chickenpox). vii A note to Figure HS-50, the data for 2003 in rural areas was omitted due to the small number of cases. viii Glynn M, Rhodes P. Estimated HIV prevalence in the United States at the end of 2003. National HIV Prevention Conference; June 2005; Atlanta. Abstract T1-B1101. ix CDC. HIV/AIDS Surveillance Report, 2005. Vol. 17. Rev ed. Atlanta: US Department of Health and Human Services, CDC: 2007:1–46. x CDC. HIV/AIDS Surveillance Report, 2005. Vol. 17. Rev ed. Atlanta: US Department of Health and Human Services, CDC: 2007:1–46. xi Source: Michigan Sexually Transmitted Diseases Database, Sexually Transmitted Disease Section, Division of HIV/AIDS-STD, Michigan Department of Community Health; Table prepared by the Division for Vital Records and Health Statistics, Michigan Department of Community Health xii Source: Michigan Sexually Transmitted Diseases Database, Sexually Transmitted Disease Section, Division of HIV/AIDS-STD, Michigan Department of Community Health; Table prepared by the Division for Vital Records and Health Statistics, Michigan Department of Community Health xiii Source: Michigan Sexually Transmitted Diseases Database, Sexually Transmitted Disease Section, Division of HIV/AIDS-STD, Michigan Department of Community Health; Table prepared by the Division for Vital Records and Health Statistics, Michigan Department of Community Health xiv MMWR. Weekly. Sept 19, 2003 / 52(37); 884-885 xv Michigan Deaths, 1900-2006; TB Cases file 1990-2006.

Health Care Resource Availability Health Care Providers Michigan has a maldistribution of healthcare providers, causing shortages in areas throughout the state, as evidenced by the total number of Health Professional Shortage Areas (HPSAs) designated by Health Resources and Services Administration (HRSA) in 2007. Fifty-two of Michigan’s 57 non-metropolitan counties have primary medical care HPSAs (91%); 39 counties have dental health care HPSAs (68%), and 41 counties have mental health care HPSAs (72%). To alleviate the shortage of providers for these areas, an additional 450 provider Full-time Equivalents (FTEs) are needed: 185 primary medical care physician FTEs, 247 dentist FTEs, and 20 psychiatrist FTEs. Rural Michigan needs an additional 71 primary medical care FTEs, 100 dentist FTEs, and 14 psychiatrist FTEs, which accounts for 40% of the unmet provider need in Michigan. Medical Care Providers This section includes data on the following providers: Physicians (MD and DO), Physicians Assistants (PA), Nurse Practitioners (NP), and Registered Nurses (RN), Certified Nurse Midwives (CNM), and Licensed Practical Nurses (LPN), as seen in Figure HR-1. Allied health providers are not included in the scope of this report.
Figure HR-1: Number of Licensed Providers per 100,000 Population in Metropolitan, Micropolitan, and Rural Areas of Michigan, 2007i ii
1,044.0 1,053.8 1,031.2 959.9
245.5 211.3 384.9 409.4
222.0 243.7150.3
95.0
0
200
400
600
800
1,000
1,200
1,400
1,600
1,800
Michigan Metropolitan Micropolitan Rural
Rat
e pe
r 100
,000
Pop
ulat
ion
CNM
NP
PA
DO
MD
LPN
RN
Michigan Rural Health Profile - 73

Physicians & Physicians Assistants As stated earlier, metropolitan counties account for 80 percent of the state’s population, and with a rate of almost 300 physicians per 100,000 population, these counties have a rate double that of non-metropolitan counties.
Figure HR-2: Number of Licensed Physicians and Physicians Assistants per 100,000 Population in Metropolitan, Micropolitan, and Rural Areas of Michigan, 2007iii
222.0243.7
150.3
95.0
50.9 53.836.3 40.6
26.7 27.1 28.1 21.4
0.0
50.0
100.0
150.0
200.0
250.0
300.0
Michigan Metropolitan Micropolitan Rural
Phys
icia
n pe
r 100
,000
pop
ulat
ion
MD DO PA
In Michigan, there are 272.9 physicians per 100,000 population (222 MDs and 50.9 DOs), which is insufficient according to the Council of Graduate Medical Education (COGME)iv. A physician ratio of greater than 300 per 100,000 population will be needed to meet future demand. Non-metropolitan Michigan has almost half the number of physicians needed, with a rate of only 165 physicians per 100,000 population. This will be compounded by the fact that 34% of the active physicians practicing in Michigan plan to retire within the next ten years, according a recent physician survey published by MDCH’s Bureau of Health Professionsv. An opportunity to help fill the void for the physician shortage is the utilization of Physician Assistants (PAs). As defined by Michigan’s Public Health Code (Act 368 of 1978), a physician assistant practices “allopathic or osteopathic medicine under the supervision of an allopathic or osteopathic physician”vi. With fewer than 3,000 active PA licenses in Michigan at the beginning of 2007, PAs account for a much smaller proportion of the health care system. Of the four medicals schools in Michigan, three schools are allopathic medicine and one school is osteopathic medicine. There are also five schools offering physician assistant programs. All but one of these schools are in the lower part of the Lower Peninsula, and all of them are located in metropolitan counties except one. According to the Physician Survey, about 41 percent of active physicians in the state grew up in Michigan, while 30 percent are from other states, and 29 percent are foreign-bornvii.
Michigan Rural Health Profile - 74

Nurses and Nurse Practitioners Registered Nurses (RNs), by far, have the highest rate of providers in the state at 1,044 RNs per 100,000 population. Licensed Practical Nurses (LPNs) add another 250 providers per 100,000 population. According to the 2006 Survey of Nurses, Michigan had a total of 147,054 RNs and LPNs, with only about 123,911 (84%) of these RNs and LPNs providing direct patient care. Between 30 and 40 percent of the active RN and LPN respondents plan to retire in the next 10 years. The survey also asked about respondents who voluntarily left their position in the last two years. About 20 percent of those who left nursing said it was to retire or quit nursingviii.
Figure HR-3: Number of Licensed Nurses and Nurse Practitioners per 100,000 Population in Metropolitan, Micropolitan, and Rural Areas of Michigan, 2007ix
245.5211.3
384.9 409.4
1,031.2
29.4 30.2 28.4 22.12.5 2.6 2.5 1.8
959.91,053.81,044.0
0.0
100.0
200.0
300.0
400.0
500.0
600.0
700.0
800.0
900.0
1,000.0
1,100.0
Michigan Metropolitan Micropolitan Rural Lice
nsed
Nur
ses
and
Nur
se P
ract
ition
ers
per 1
00,0
00po
pula
tion
LPN RN NP CNM
Using more Nurse Practitioners (NPs) would also help manage the physician shortage. Nurse Practitioners account for a much smaller proportion of the health care workforce at about 30 providers per 100,000 population. These providers are registered nurses with advanced education and training. They have received special certification from the Michigan Board of Nursing. The scope of practice for NPs is left up to the board that certifies the providers, the individual’s training, and experience.
Michigan Rural Health Profile - 75

Dental Providers Dental health care is important for everyone, and not everyone has ready access to it, as reflected by the large number of counties with full county dental HPSAs in Michigan (49 of 83 counties have a full county shortage designation). An additional 26 partial county service areas are designated throughout the state. Of the 57 non-metropolitan counties, 44 counties have full county dental health care HPSA designations.
Figure HR-4: Number of Licensed Dental Providers per 100,000 Population in Metropolitan, Micropolitan, and Rural Areas of Michigan, 2007x
65.969.6
54.3
43.4
89.6
81.3
73.3
12.5 11.618.9
13.0
87.4
0.0
10.0
20.0
30.0
40.0
50.0
60.0
70.0
80.0
90.0
100.0
Michigan Metropolitan Micropolitan Rural Lice
nsed
Den
tal P
rovi
ders
per
100
,000
pop
ulat
ion
Dentist Dental Hygienist Dental Assistant
Michigan had over 7,800 active dental licenses in 2007, and of those active licenses, only about 6,666 (85%) of the providers practice in Michigan. In general, Michigan’s active dentists are found in metropolitan areas (86%), while micropolitan (9%) and rural (5%) areas have fewer providers.
Michigan Rural Health Profile - 76

Mental Health Providers Mental health care is important, but not everyone has ready access to it, as reflected by the large number of counties with full county mental health care HPSAs in Michigan (45 of 83 counties have a full county shortage designations). Of the 57 non-metropolitan counties, 40 counties have full county HPSA designations.
Figure HR-5: Number of Licensed Mental Health Providers (Non-Psychiatrists) per 100,000 Population in Metropolitan, Micropolitan, and Rural Areas of Michigan, 2007xi
22.9 25.216.6
7.8
96.0
72.6
51.4 51.756.3
41.2
7.3 7.9 6.1 2.6
131.8142.2
0.010.020.030.040.050.060.070.080.090.0
100.0110.0120.0130.0140.0150.0
Michigan Metropolitan Micropolitan Rural Lice
nsed
Men
tal H
ealth
Pro
vide
rs p
er 1
00,0
00
popu
latio
n
Psychologist Masters Social Worker Professional Counselor Marriage & Family Therapist
According to the 2007 Licensure Database, there were 21,590 non-psychiatric mental health providers (93% of total) with active licenses in Michigan. The non-psychiatrist mental health providers include: psychologists, masters social workers (MSWs), professional counselors, and marriage and family therapists (MFTs). The majority of Michigan’s active mental health providers are found in metropolitan areas (86.6%), while micropolitan (8.8%) and rural (4.6%) areas have fewer providers. The largest variation among the provider types is the MSWs. Proportionately, micropolitan areas have at least two-thirds the number of providers in all categories per 100,000 as metropolitan areas. Rural areas are proportionately closer to metropolitan and micropolitan areas in the professional counselor category. Rural Michigan has half the providers that metropolitan areas have for MSWs. For this report, it is difficult to get an accurate count of the number of psychiatrists in Michigan from the licensure data file, as specialty information for physicians is not available. According to the 2006 Physician Survey, about six percent of the active providers listed psychiatry as their primary specialty (5% adult psychiatry, 1% child and adolescent psychiatry). xii This is approximately 2,470 providers throughout Michigan, which totals about 24 psychiatrists per 100,000 population.
Michigan Rural Health Profile - 77
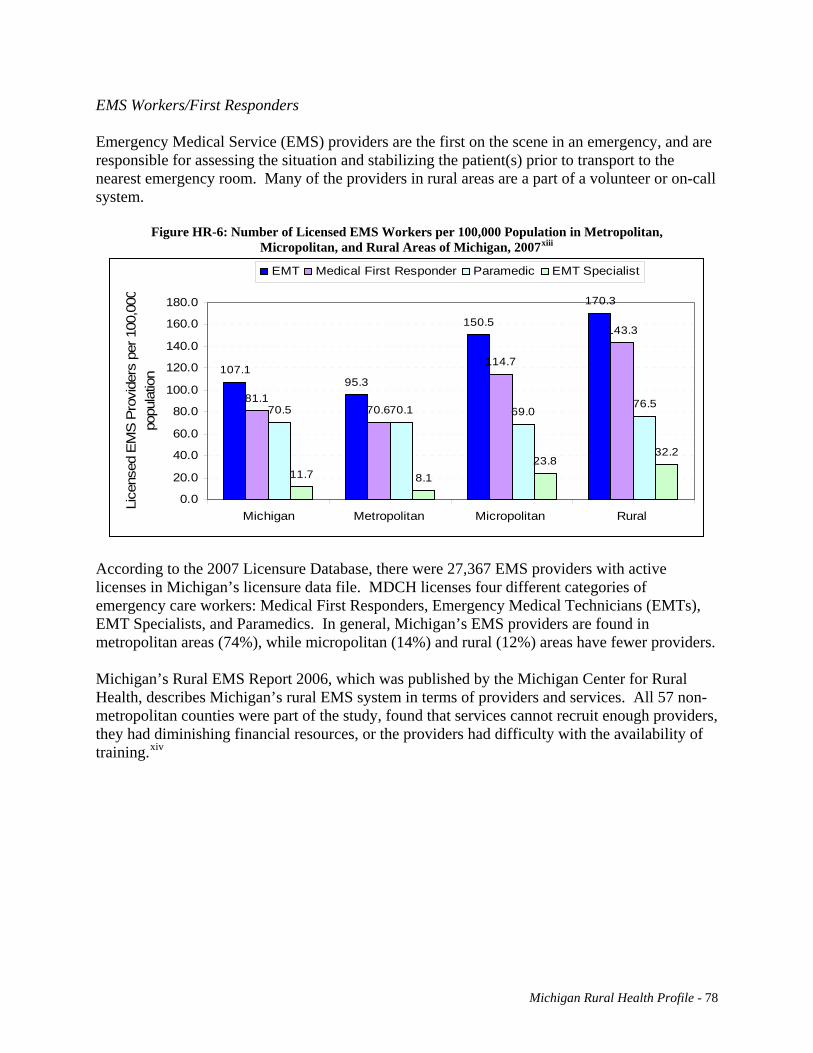
EMS Workers/First Responders Emergency Medical Service (EMS) providers are the first on the scene in an emergency, and are responsible for assessing the situation and stabilizing the patient(s) prior to transport to the nearest emergency room. Many of the providers in rural areas are a part of a volunteer or on-call system.
Figure HR-6: Number of Licensed EMS Workers per 100,000 Population in Metropolitan, Micropolitan, and Rural Areas of Michigan, 2007xiii
107.195.3
150.5
81.170.6
114.7
143.3
70.5 70.1 69.076.5
11.7 8.123.8
32.2
170.3
0.0
20.0
40.0
60.0
80.0
100.0
120.0
140.0
160.0
180.0
Michigan Metropolitan Micropolitan Rural
Lice
nsed
EM
S P
rovi
ders
per
100
,000
popu
latio
n
EMT Medical First Responder Paramedic EMT Specialist
According to the 2007 Licensure Database, there were 27,367 EMS providers with active licenses in Michigan’s licensure data file. MDCH licenses four different categories of emergency care workers: Medical First Responders, Emergency Medical Technicians (EMTs), EMT Specialists, and Paramedics. In general, Michigan’s EMS providers are found in metropolitan areas (74%), while micropolitan (14%) and rural (12%) areas have fewer providers. Michigan’s Rural EMS Report 2006, which was published by the Michigan Center for Rural Health, describes Michigan’s rural EMS system in terms of providers and services. All 57 non-metropolitan counties were part of the study, found that services cannot recruit enough providers, they had diminishing financial resources, or the providers had difficulty with the availability of training.xiv
Michigan Rural Health Profile - 78

Primary Medical Care, Mental Health, and Dental Health Professional Shortage Areas (HPSAs) As of the beginning of 2007, Michigan had more than 350 (171 primary medical care, 68 mental health, and 113 dental) areas and facilities that were either designated as Health Professional Shortage Areas (HPSAs), or were pending federal approval. The HPSA types are listed in Table HR-1.
Table HR-1: 2007 Health Professional Shortage Area Designations for Michigan
Primary Medical Care HPSAs Mental HPSAs Dental HPSAs
Counties with
HPSAs
Full/ partial County
Facility Tribal Counties
with HPSAs
Full/ partial County
Facility
Each column in Table HR-8 identifies different counts for HPSA designations, which lists the county designations, the number of designations based on partial or full county service areas, and the facility and tribal designations. Under the column heading “Counties with HPSAs,” the county counts differentiate between Geographic Area (Area) and Low-Income Population (LIP) designations. The column heading “Full/Partial County” distinguishes between the service areas, whether it is a full or partial county service area. Most facility designations are for state facilities (mental health hospital/clinic, correctional facility, etc), Federally Qualified Health Centers, and Rural Health Clinics. Private and hospital-based clinics can have facility designations as well. Primary Medical Care HPSAs Throughout the state, 66 counties have some type of Primary Medical Care HPSA, 43 of which have full county designations. Fourteen of Michigan’s 26 metropolitan counties have a Primary Medical Care HPSA designation. Most micropolitan (20 of 23) and rural (32 of 34) counties have service area designations. There are 85 facilities with a Primary Medical Care HPSA designation, and 13 tribal designations. Dental Health HPSAs Of the 83 counties in Michigan, 61 have some type of Dental Health HPSA, 49 of which have full county designations. There are 37 facilities with a Dental Health HPSA designation, and four are located in a county without a service area designation. All but two of the designations are low-income population groups, as opposed to geographic area. Half (13 of 26) of the
Counties with
HPSAs
Full/ partial County
Facility
Metropolitan (26)
4 Area 7 LIP
3 Both 12
Without
3 Full, 21 Partial 32 2
6 Area 20
Without
13 LIP 13
Without
5 Full, 5 Full, 23 1 Partial 22 Partial 24
Micropolitan (23)
17 LIP 2 Area 1 Both
3 Without
13 Full 9 Partial 25 7 14 Area,
9 Without 5 15 LIP 1 Area
7 Without
13 Full 1 Partial
15 Full 1 Partial 5
Rural (34)
20 LIP 10 Area 2 Both
2 Without
27 Full 6 Partial 28 4 27 Area 10
31 LIP 1 Area
2 Without
29 Full 7 Without 27 Full 3 Partial 8
Michigan Rural Health Profile - 79

metropolitan counties have designations, but only five are full county designations. Two-thirds (16 of 23) of micropolitan counties have a designation, and all but one are full county service areas. Most (32 of 34) rural counties have a designation, and 29 of those designations (90%) are full county service areas. Mental Health HPSAs Mental Health HPSAs are found predominantly in rural areas. Only six counties have some form of designation in metropolitan counties, five of which are full county service areas. There are 23 Mental Health HPSA facility designations in metropolitan areas, and 14 are located in counties without HPSA designations. In rural Michigan, 41 counties have Mental Health HPSA designations (72%). Of the 41 Mental Health HPSA designations, all are full county service areas but one. Benefits of HPSA designations A Health Professional Shortage Area (HPSA) is designated by the Health Resources and Services Administration (HRSA). A recruitment tool available to facilities located in shortage areas is physician placement. In Michigan, placement programs associated with HPSA designations include:
• National Health Service Corps, Scholarship & Loan Repayment (NHSC) • State Loan Repayment Program • State Conrad 30 J-1 Visa Waiver Program
The National Health Service Corps (NHSC) Program places scholars in HPSAs. The NHSC also awards loan repayment funding to qualified physicians working in shortage areas. Each year the NHSC Program places about 250 scholars and provides 2,000 loan repayment awards.
Table HR-2: Michigan’s State Loan Repayment Program Placements, 2000-2006
# Placements
% of Total Placement
# Counties Served
Avg Placement/
County
# of Counties
% Counties Served
Total 227 55 4.1 83 66.3% Metropolitan 92 40.5% 15 6.1 26 57.7% Micropolitan 43 18.9% 14 3.1
23 60.9% Rural 92 40.5% 26 3.5 34 76.4%
The Michigan State Loan Repayment Program (MSLRP) is administered by MDCH. Each year, loan repayment awards are available to primary care providers working in shortage areas. Between 2000 and 2006, MDCH awarded funding for loan repayment to 227 providers. Almost 60 percent of these providers were located in non-metropolitan Michigan. The J-1 Visa Waiver program grants up to 30 waivers a year to foreign medical graduates finishing their training on the J-1 Visa. In exchange for the waiver of their two-year return home requirement, the physician must agree to work in a federally designated shortage area for three
Michigan Rural Health Profile - 80

years.
Table HR-3: Michigan’s Conrad State 30 Placements, 1995-2007
Primary medical
care Psychiatry Sub-Specialty Total Metropolitan 170 4 28 202 Micropolitan 26 4 6 36 Rural 47 1 7 55 Multi-Site Metro-Rural 0 0
2 2 Total 243 9 43 295
Since the inception of the program, MDCH has placed 295 physicians in Michigan, including 93 physicians who served in rural areas. The majority of placements (78%) have been for primary medical care providers (family practice, general practice, internal medicine, ob-gyn, and pediatrics). Sub-specialty providers include neurologists, cardiologists, pathologists, hem/oncologists, radiologists, and specialty surgeons. Primary Medical Care (Safety-Net Clinics)
Different types of outpatient primary medical care clinics are available to Michigan’s residents; these are referred to as “Safety-Net Clinics” for the purposes of this report. In some counties, outpatient clinics are the only available health care facilities. Eight counties in the northern part of Michigan (2 Micropolitan, 6 Rural) have no hospital facilities. In these areas, outpatient facilities are crucial for primary medical care and responsive EMS is critical for patient survival in an emergency. Each of the counties without hospital services has outpatient care facilities throughout the county. The following types of facilities are safety-net providers with specific state or federal designations Local Health Departments Local health departments are funded through a State-Federal match program. All counties either have their own health department or are part of a larger district health department. Each department has one main service delivery site, but may also have additional satellite sites spread throughout the county or district. The availability of services varies with each department, but they all have a minimum level of primary medical care services they provide, such as immunizations, etc.
Michigan Rural Health Profile - 81

Federally Qualified Health Centers (FQHCs) FQHCs and FQHC Look-Alikes (FQHC-LAs) are primary care facilities and are federally designated. These facilities are required to see all patients regardless of their ability to pay. The FQHCs receive grant funding from section 330 of the Public Health Service (PHS) Act, which includes Community Health Centers, Migrant Health Centers, Health Care for the Homeless Health Centers, and School-based Health Centers. The facilities are required to have an extensive array of services available to patients, including primary medical care, dental and mental health. These facilities also provide prescription services, x-rays, lab work, and transportation to and from the facility. With the exception of some Migrant Health Centers, all FQHCs and FQHC-LAs are located in areas with Medically Underserved Area or Population designations (MUA or MUP).
In Michigan, there are 30 FQHC and FQHC-LA organizations that provide care at 156 sites. Table HR-4 shows the distribution of practice site locations by metropolitan, micropolitan, and rural county status. The vast majority of these sites are located in the metropolitan counties, with fewer than 30% of the sites located in micropolitan or rural Michigan.
Table HR-4: Michigan’s Federally Qualified Health Centers, Number of Organizations and Clinic Sites
serving Michigan. Area # Organizations # Sites Michigan 30 156 Metropolitan 25 113 Micropolitan 4 7 Rural 10 36
Map HR-2: Michigan’s Federally Qualified Health Centers (FQHCs)
Michigan Rural Health Profile - 83

Free Clinics Free Clinics are non-profit clinics that typically do not charge for services provided by physicians who volunteer their time at the clinic. These clinics serve the uninsured and underinsured patients. Michigan has 53 sites listed with the Free Clinics of Michigan organization. The services offered at the clinics vary and depend upon the expertise and specialties of the volunteering providers. Sixteen clinics of the 53 are located in non-metropolitan counties (8 micropolitan, 8 rural), and these clinics are only located in cities or towns with a hospital.
Map HR-1: Michigan’s Free Clinics
Michigan Rural Health Profile - 82

Rural Health Clinics (RHCs) The Rural Health Clinic Program was established in 1977 to address an inadequate supply of providers who serve Medicare and Medicaid beneficiaries in rural areas. The RHCs are designated by the federal government. To be eligible for certification, the site applying for RHC designation must be in a non-urbanized area of the state, as defined by the U.S. Census Bureau, and in a federally designated shortage or underserved area.
Table HR-5: Michigan’s Rural Health Clinics, Number Clinic Sites serving Michigan by SOSS Region
Region # of Clinics
% of Total
# of Facility HPSAs
Michigan 156 49 East Central 24 15.4% 8 N. Lower Peninsula 38 24.4% 20 Southeast 2 1.3% 0 Southwest 29 18.6% 7 Upper Peninsula 22 14.1% 5 West Central 41 26.3% 9
The clinics have the option of being designated as a facility HPSA, but to be so designated, they must certify that they are willing accept all patients regardless of their ability to pay, and develop a sliding fee scale that is based on the patient’s income. The clinics may be stand alone, or share space within a larger facility. They may be supported by hospitals or be an independent facility. RHCs must be located in a HPSA or Medically Underserved Area. The State of the State Survey (SOSS) regions with the largest number of clinics are West Central and Northern Lower Peninsula. However, only 49 (31%) of RHCs had received a Facility HPSA designation as of spring, 2007. Over 40% of RHCs with facility designations are located in the Northern Lower Peninsula.
Map HR-3: Michigan’s Rural Health Clinics
Michigan Rural Health Profile - 84

RHCs provide outpatient primary medical care services that would be provided in a physician’s office, and allows access to these services for Medicaid and Medicare patients. The facility must provide basic lab tests (blood glucose levels, pregnancy tests, urine tests, etc.) and act as a first responder in the event of an emergency. A RHC is required to have a physician’s assistant, nurse practitioner, or certified nurse midwife on site, seeing patients at least 50% of the time that the practice is open. xv Acute Care Across Michigan, hospitals offer varying types of services and specialized care. The number of hospital beds tends to indicate the size of a hospital and the availability of advanced services. Only the largest facilities offer programs such as open heart surgery, pediatric surgery, transplants and Level 1 trauma care.
Map HR-4: Michigan’s Hospitals
Michigan Rural Health Profile - 85

All of the facilities that are 25 beds or less are Critical Access Hospitals. Small and mid-size rural hospitals (Non-CAHs) tend to be under 100 beds. Two-thirds of Michigan’s hospitals are located in metropolitan counties. The remaining one-third are distributed in a 60-40 split among rural and micropolitan counties. Table HR-6 shows the distribution of hospitals in metropolitan, micropolitan, and rural counties of Michigan by hospital size, which is denoted by the number of licensed hospital beds.
Table HR-6: Hospital Bed Size by Number of Beds
Large Hospital (100+ Beds)
Small and Rural Hospitals
(25-100 Beds)
Critical Access Hospital
(<25 Beds) Total
Michigan 77 71 34 182
Metropolitan 67 49 6 122
Micropolitan 9 9 6 24
Rural 1 13 22 36 Critical Access Hospitals Legislation enacted as part of the Balanced Budget Act (BBA) of 1997 established a mechanism to designate Critical Access Hospitals (CAHs) through the Centers for Medicaid and Medicare Services (CMS). As CAHs, these facilities have 25 beds or less, with limited services available. In order to be designated by CMS, they must have a referral or networking agreement with larger, tertiary hospitals. A CAH must be in a rural area, and more than 35 miles from the nearest hospital or designated as a “necessary provider” (prior to December 31, 2005). They also need to provide 24-hour emergency care services for local patients. Michigan has a total of 34 CAHs providing care throughout rural Michigan. Rural Hospitals (Non-CAH facilities) Michigan’s rural non-CAH hospitals vary in size and availability of care. All of these facilities offer basic hospital care, but may also offer more advanced services like open heart surgery or trauma care. Rural tertiary hospitals offer the most advanced care of Michigan’s rural hospitals. These are the regional facilities located in the larger cities throughout rural Michigan. They network with the smaller facilities for referrals on more advanced care. Services Provided Many types of services are provided in rural Michigan hospitals. The MDCH Certificate of Need (CON) Program certifies both diagnostic and therapeutic services (16 in all) for hospitals. Table HR-7 is information collected from the Annual Statistical Questionnaire which is conducted by the CON Program.
Michigan Rural Health Profile - 86

Table HR-7: Services offered by Hospitals and Critical Access Hospitals (CAHs) in Rural Michigan
# of Hospitals Lithotripsy CT or MRI
Services
Cardiac Cath.
Services
MRT Services
Surgical Services
Trauma Level
Certified
Burn Care
Certified
Open Heart
Surgery
Facility Type
CAH 34 1 33 3 1 32 0 0 0
Rural Non-CAH 32 7 30 6 7 31 2 0 3
According to Table HR-7, most of the CAHs offer CT or MRI diagnostic services. They also offer surgical services. Only three of the CAHs offer cardiac catheterization, while only one facility offers lithotripsy. One of the facilities also offers MRT cancer treatment. The other (non-CAH) hospitals offer a full spectrum of services, except none of those hospitals are Burn Care-certified. The three largest hospitals in rural Michigan offer open heart surgical services as well. Less than a quarter of the facilities offer lithotripsy, MRT, and cardiac catheterization services, while only two of the facilities have Trauma certification. Emergency Medical Care Emergency Medical Services In non-metropolitan counties, there are 148 licensed ambulance service providers. The providers serve areas ranging from multi-county zones to single townships. There are 22 full county providers and 9 multi-county providers, as seen in Table HR-8. About half of the service providers (68 of 148) have full-time, paid staff, while the rest of the service providers have volunteer staff or another type, such as an ambulance service combined with the municipal fire service. Throughout non-metropolitan Michigan, there are 436 ground transport ambulances, two helicopters, and 64 non-transport vehicles (used for first responders). The level of care provided by an ambulance service is determined by the type of EMS professional working for the provider. To be certified for Advanced Life Support means that the service provider has licensed paramedics on staff. Emergency Medical Technicians (EMTs) are qualified to perform Basic Life Support, and EMT Specialists perform Limited Advanced Life Support. In non-metropolitan counties, only eight service providers offer limited advanced life support, while 62 service providers offer advanced life support and 78 service providers offer basic life support.
Table HR-8: Non-Metropolitan County Ambulance Service Providers Total Ambulance Service Providers: 148
Service Area: Full County 22 Partial
County 107 Multi-County 9
Service Providers with:
Volunteer Staff 60 Paid Staff 68
Other Staff Type
20
Service Provider Care Level: Basic 78 Limited
Advanced 8 Advanced 62
Non-Transport
Air Transport
Ground Transport 64 2 436 Total Vehicles:
Michigan Rural Health Profile - 87

Air Ambulance In Michigan, seven different air ambulance service sites are certified by Certificate of Need (CON), including two sites from Toledo, Ohio. The bases of operations for these services are larger hospitals, which include Munson Medical Center in Traverse City, the only service north of Saginaw. Services in Lower Michigan seem to cover all of the non-Metropolitan areas in Lower Michigan. Service in Grand Rapids flies far enough north to overlap with the service provider in Traverse City. A total of seven different air ambulance services are certified to operate in Michigan, plus two services from out of state. Areas not readily covered by air ambulance include the eastern portion in the Northern Lower Peninsula and the Upper Peninsula. Services in Wisconsin near Michigan’s border are not currently certified in Michigan. According to a table published by ADAMS (Atlas and Database of Air Medical Services) in the Air Medical Journal (July/August 2005), 66.1% of the land area in Michigan is covered by the 30-minute flight circles of the various services in Michigan. This effectively covers 95.4% of the population, based on the 2000 Census.
Table HR-9: Michigan’s Air Ambulance Coverage
Assessment of Air Medical Coverage in Michigan
10-Min Fly Circle
20-Min Fly Circle
30-Min Fly Circle
Percentage of square miles within the fly circle. Michigan has 54,446 total square miles
22.89% 49.25% 66.10%
Percentage of population within the fly circle utilizing 2000 data of 9,938,444
41.15% 89.71% 95.37%
Table HR-10: Michigan’s Air Ambulance Transports
Facility Information Pre-Hospital Transports
Inter-Facility Transports
Total Patient Transports % of Transports
AeroMed Spectrum Health 442 1,417 1,859 11.2%
Flight Care 299 1,167 1,466 8.8%
LifeNet 208 951 1,159 7.0%
Midwest Medflight 123 1,112 1,235 7.4%
North Flight 321 494 815 4.9%
ProMedica Air (Toledo) 53 1,011 1,064 6.4% Life Flight - St. Vincent (Toledo) 1,086 2,740 3,826 23.0%
Survival Flight 373 2,967 3,340 20.1%
West Michigan Air Care 330 1,541 1,871 11.2%
Total Transport 3,235
13,400 16,635
Michigan Rural Health Profile - 88

During 2004-2006, there was a reported 16,635 patient transports in Michigan. About 20% of the transports were pre-hospital (a patient was taken from an original site to a hospital). The other 80% transports were hospital-to-hospital transfers. North Flight, the sole non-metropolitan based air ambulance service provider, experienced a notably greater percent of pre-hospital transports than the other air ambulance service providers. Emergency Department From 2002 to 2004, the statewide average for Emergency Room (ER) visits was just under four million a year (3,915,885 visits). Of these visits, one-third of the patients (1.3 million) were admitted to the hospital for further treatment and/or observation. Table HR-11 shows the average number of visits for several categories, including trauma, drug-related, psychiatric, and asthma. For the purpose of the MDCH CON Annual Hospital Statistical Questionnaire, pediatric visits are all patients under 15 years of age, and adult visits include all patients aged 15 years or older. Rural Michigan accounts for 20 percent of the total annual number of ER visits in Michigan. About 80 percent of patients are adults, particularly in categories like trauma, cardiac, obstetric, and alcohol. Of the categories in the table, the top four categories for all hospital types are 1) upper respiratory infection, 2) trauma, 3) asthma, and 4) cardiac. These four categories account for one-sixth of all ER visits in rural hospitals.
Table HR-11: Non-Metropolitan Hospital Emergency Room Visits, 2002-2004 Annual Average
Total (66) CAHs (34) Micropolitan Non-
CAH (18) Rural Non-CAH
(14) ER Visits 807,246 287,040 305,076 215,130 ER Admissions 92,416 22,112 46,763 23,541
ER Visits Total Adult Total
Pediatric Total Adult Pediatric Adult Pediatric Adult Pediatric
Trauma 30,344 24,587 5,757 6,094 1,494 9,207 2,152 9,286 2,111Cardiac 22,881 22,795 86 7,328 36 9,624 32 5,843 18Obstetric 10,160 10,134 26 2,297 8 5,838 13 1,999 5Drug 991 954 37 438 18 230 13 286 6Alcohol 2,251 2,210 41 547 22 1,277 12 386 7Poisoning 8,737 6,772 1,965 2,351 813 2,552 761 1,869 391Psychiatric 14,909 14,288 621 3,994 154 6,686 312 3,608 155Asthma 24,856 18,518 6,338 7,563 2,404 6,740 2,511 4,215 1,423Upper Respiratory 57,040 33,103 23,937 12,391 8,504 11,053 9,379 9,659 6,054Other Medical 635,077 508,309 126,766 188,047 42,537 188,535 48,149 131,727 36,082Total 807,246 641,670 165,576 231,050 55,990 241,742 63,334 168,878 46,252
The ICD-9-CM Codes for these categories are as follows: • Trauma: 800.00-959.9, 987.9 (smoke inhalation), and all ED deaths including DOA • Cardiac: 410.0-415.1; 424.1-428.9 • Obstetric: 630.0-676.9 • Psychiatric: 290-302;306-316 • Asthma: 493.0-493.9 • Upper Respiratory Infection: 460-476 • Allergy: 287.0, 346.2, 360.19, 370.62, 372.14, 477.0-477.9, 495.2-495.9, 500-508, 518.3, 535.4, 558.9, 597.89, 691.8, 692.5, 692.9, 693.1, 708.0, 716.2,
995.1-995.4, 995.6
Michigan Rural Health Profile - 89

Overall, one in five patients in the ER is under the age of fifteen. More pediatric visits in rural hospitals involve upper respiratory infection and asthma than all other single categories combined. The upper respiratory infection, asthma, and trauma categories combined account for 20 percent of all pediatric visits to the ER. Long-Term Care and Adult Foster Care Long-Term Care Facilities In Michigan, there are four different long-term care facilities licensed by MDCH’s Bureau of Health Systems. These are Nursing Homes, Hospital-based Long-term Care Units (LTCUs), County Medical Care Facilities (CMCF), and Veterans Long-Term Care Facilities (VA-LTCFs).
Table HR-12: Long-Term Care Facilities in Michigan
# of LTC Bed per 100,000 population
(Aged 65+) Area/Region # Facilities % Total # Lic. Beds % Total
Michigan 465 48,208 3,831 Metropolitan 328 71% 36,032 75% 3,791 Micropolitan 70 15% 6,739 14% 4,497
Rural 67 14% 5,437 11% 3,439
Nursing homes are nursing care facilities that provide organized nursing care and treatment. A nursing home has seven or more beds to care for unrelated individuals suffering or recovering from illness, injury, or infirmity. These do not include hospitals or hospital LTC units, county medical care facilities, veteran’s facilities, hospice, or state correctional facilities. The LTCU is a nursing care facility run as a part of a hospital, and physically located at a hospital. This unit has seven or more beds to care for unrelated individuals suffering or recovering from illness, injury, or infirmity. A CMCF is a licensed nursing care facility owed by the county or a group of counties, not a hospital or other private entity. Michigan has 36 CMCFs throughout the state. All accept Medicaid and Medicare and have skilled nursing beds, which may be used just for rehabilitation purposes, for long-term care, or both. A Veteran’s Long-Term Care Facility is a nursing care facility which provides organized nursing care and medical care to veterans of the U.S. military suffering or recovering from illness, injury or infirmity.
Michigan Rural Health Profile - 90

Adult Foster Care Facilities The Michigan Department of Human Services (DHS) monitors Michigan’s Adult Foster Care (AFC) facilities. There are over 4,000 facilities licensed to provide care throughout Michigan. Table HR-13 shows how the AFC facilities are distributed throughout Michigan. Over 75 percent of these facilities are located in metropolitan areas. AFC facilities in micropolitan areas have a much higher number of beds per 100,000 population than the metropolitan or rural areas.
Map HR-5: Michigan’s Nursing Homes and County Medical Care Facilities
Table HR-13: Adult Foster Care Facilities in Michigan
# of AFC Bed per 100,000 population Area/Region
# AFC Facilitiesxvi % Total # AFC Licensed
Beds % Total (Aged 20+)
Michigan 4,712 48,914 669 Metropolitan 3,628 77% 39,234 80% 677 Micropolitan 559 12% 5,657 12% 707
Rural 525 11% 4,023 8% 564
According to the DHS website, Adult Foster Care (AFC) homes are residential settings that provide 24-hour personal care, protection, and supervision for individuals who are
Michigan Rural Health Profile - 91
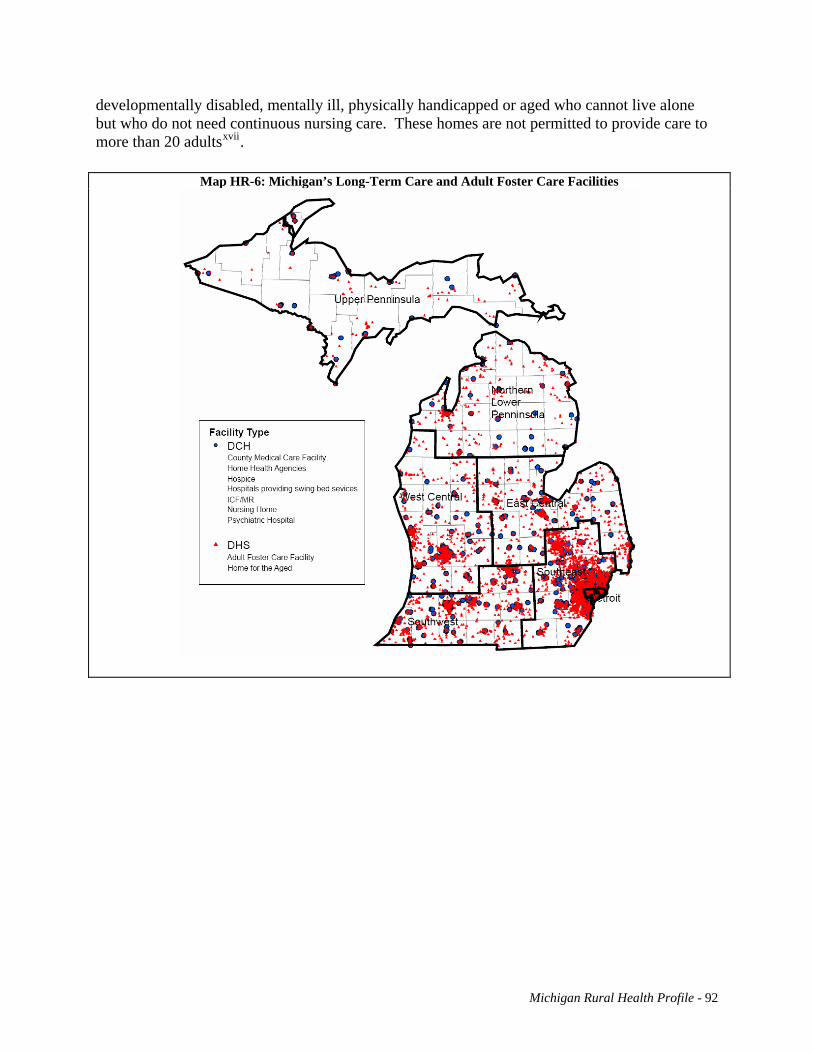
developmentally disabled, mentally ill, physically handicapped or aged who cannot live alone but who do not need continuous nursing care. These homes are not permitted to provide care to more than 20 adultsxvii.
Map HR-6: Michigan’s Long-Term Care and Adult Foster Care Facilities
Michigan Rural Health Profile - 92
i Licensed Medical Care Providers in Michigan. Licensure Database, MDCH Bureau of Health Professions. Accessed July 2007. ii Licensed Medical Care Providers in Michigan. Licensure Database, MDCH Bureau of Health Professions. Accessed July 2007. iii Licensed Medical Care Providers in Michigan. Licensure Database, MDCH Bureau of Health Professions. Accessed July 2007. ivSixteenth Report: COGME Physician Workforce Policy Guidelines for the United States, 2000-2020 (2005). v MDCH Survey of Physicians 2006. Prepared by Public Sector Consultants Inc., revised 06-15-07 vi MDCH. Bureau of Health Professions. http://www.michigan.gov/mdch/0,1607,7-132-27417_27529_27550-59188--,00.html vii MDCH Survey of Physicians 2006. Prepared by Public Sector Consultants Inc., revised 06-15-07 viii Michigan Center for Nursing Survey of Nurses 2006. ix Licensed Medical Care Providers in Michigan. Licensure Database, MDCH Bureau of Health Professions. Accessed July 2007. x Licensed Medical Care Providers in Michigan. Licensure Database, MDCH Bureau of Health Professions. Accessed July 2007. xi Licensed Medical Care Providers in Michigan. Licensure Database, MDCH Bureau of Health Professions. Accessed July 2007. xii MDCH Survey of Physicians 2006. Prepared by Public Sector Consultants Inc., revised 06-15-07 xiii Licensed Medical Care Providers in Michigan. Licensure Database, MDCH Bureau of Health Professions. Accessed July 2007. xiv MCRH. Michigan’s Rural EMS Report 2006. http://www.mcrh.msu.edu/ xv Starting a Rural Health Clinic – A How-To Manual, pgs 1-2 and 1-3. xvi DHS, Statewide Text File of Adult Foster Care Facilities, updated: 7/26/2007 http://www.michigan.gov/dhs/0,1607,7-124-5455_27716_27717-82231--,00.html xvii Michigan Department of Human Services, Adult Foster Care and Homes for the Aged. http://www.michigan.gov/dhs/0,1607,7-124-5455_27716_27717-43059--,00.html
Michigan Rural Health Profile - 93

Conclusions Several factors contribute to the lack of access to or availability of healthcare services in rural Michigan, including lack of resources, sparse population, geographic isolation, providers not taking new patients, a patient’s inability to pay for services, and providers not accepting types of coverage. Provider shortage also plays a role in the lack of services, along with reimbursement issues, long waits for appointments, and long distances to travel for services. All of these factors contribute to access problems in rural Michigan. Some areas of non-metropolitan Michigan are growing rapidly, including areas in northern Lower Peninsula. This can cause problems with infrastructure that may not be able to handle the growth. While the population is increasing in many areas, the age demographic is changing, because the population as a whole is getting older. The population increase in these areas is due to in-migration of an older population group. And there is out-migration of the younger age groups. With a larger population in the older age groups, there are also higher death rates in these areas, along with lower birth rates, since a larger proportion of the population is not in the child-bearing age group. Other issues that complicate the situation include lower rates of educational attainment for the population in these areas, which is associated with higher poverty and unemployment. This leads to increased Medicaid enrollment. Another situation that is not controllable in many parts of non-metropolitan Michigan is the transition from the manufacturing economy to tourism and service economies. When looking at the health measures throughout Michigan, we see that many trends were similar in metropolitan and non-metropolitan areas. Heart disease is the leading cause of death throughout Michigan and accounts for 29 percent of all deaths in Michigan. Heart disease and cancer together account for about 52% of all deaths in Michigan. Both of these are chronic diseases associated with older populations, and rural Michigan has a much higher crude death rate for both causes than the rest of Michigan. Many factors that contribute to heart disease are preventable. Death rates caused by diabetes, another chronic condition, are also on the rise in non-metropolitan Michigan. One of the main factors contributing to Type 2 diabetes is obesity. About 67 percent of the population in rural counties is considered either overweight or obese. Both of these conditions are heavily influenced by behaviors and are typically considered preventable. Fifty-two of Michigan’s 57 non-metropolitan counties have health professional shortage area designations. Health care provider shortages will potentially worsen in the next ten years due to the number of providers who are close to retirement, among other reasons.
Michigan’s Rural Health Profile - 94

Michigan Rural Health Profile – 95
Appendix A: Acronyms ADAMS: Atlas and Database of Air Medical Services AFC: Adult Foster Care AIAN: American Indian/Alaskan Native BBA: Balanced Budget Act of 1997 BMI: Body Mass Index BRFS: Behavioral Risk Factor Survey CAH: Critical Access Hospital CDC: Centers for Disease Control and Prevention CHI: Critical Health Indicators Report CLRD: Chronic Lower Respiratory Disease CMCF: County Medical Care Facilities CMS: Centers for Medicare and Medicaid Services CNM: Certified Nurse Midwives COGME: Council of Graduate Medical Education CON: MDCH Certificate of Need Office CPS: Current Population Survey DEQ: Michigan Department of Environmental Quality DHS: Michigan Department of Human Services DO: Doctor of Osteopathic Medicine EC: East Central Michigan ED: Emergency Department EMS: Emergency Medical Services EMT: Emergency Medical Technicians ER: Emergency Room FLEX: Medicare Rural Hospital Flexibility Program FORHP: Federal Office of Rural Health Policy FPL: Federal Poverty Level FQHC: Federally Qualified Health Center FQHC-LA: Federally Qualified Health Center Look Alike FTE: Fulltime Equivalent HIV/AIDS: Human Immunodeficiency Virus /Acquired Immune Deficiency Syndrome HPSA: Health Professional Shortage Areas HRSA: Health Resources Services Administration IMSC: State of Michigan Interagency Migrant Services Committee LIP: Low-Income Population HPSA designation LPN: Licensed Practical Nurses LTCU: Hospital based Long-term Care Units MCIR: Michigan Care Improvement Registry MCRH: Michigan Center for Rural Health MD: Medical Doctor MDCH: Michigan Department of Community Health MDR: Multidrug-Resistant Strain of Tuberculosis MFT: Marriage and Family Therapists MI-SORHI: Michigan’s Strategic Opportunities for Rural Health Improvement MMR: Metropolitan Statistical Areas, Micropolitan Statistical Areas, and Rural Area
classification MRHP: Michigan Rural Health Plan

Michigan Rural Health Profile – 96
MSFW: Migrant/Seasonal Farmworker MSLRP: Michigan State Loan Repayment Program MSU: Michigan State University MSW: Masters of Social Work MUA: Medically Underserved Area designations Multi: Multi-racial MUP: Medically Underserved Population designations NHPI: Native Hawaiian/Pacific Islander NHSC: National Health Service Corps NLP: Northern Lower Peninsula NP: Nurse Practitioners PA: Physicians Assistants PHS: Public Health Service Act RHC: Rural Health Clinic RN: Registered Nurses RUCA: Rural Urban Commuting Areas SE: Southeastern Michigan SLRP: State Loan Repayment Program SORH: State Office of Rural Health SOSS: State of the State Survey Regions SRHP: State Rural Health Plan STD: Sexually Transmitted Diseases SW: Southwestern Michigan TB: Tuberculosis UP: Upper Peninsula US OMB: U.S. Office of Management and Budget USCB: U.S. Census Bureau VA-LTCF: Veterans Long-Term Care Facilities WC: West Central Michigan XDR: Extensively drug-resistant strain of Tuberculosis YPLL: Years of Potential Life Lost

Health of Rural Michigan Report – 97
Appendix B: Tables, Maps, and Figures Executive Summary Number Title Page Figure-1 Michigan Counties with Metropolitan, Micropolitan, and Rural Designations per the US
OMB Definition ii
Figure-2 Population Distribution by Age for Metropolitan, Micropolitan, and Rural Michigan, 1990 iii Figure-3 Population Distribution by Age for Metropolitan, Micropolitan, and Rural Michigan, 2005 iii Figure-4 Educational Attainment in Michigan, 1990 Census iv Figure-5 Educational Attainment in Michigan, 2000 Census iv Figure-6 Crude Death Rates for Michigan’s 10 Leading Causes of Death by Metropolitan,
Micropolitan, and Rural Status, 2005 v
Figure-7 Overweight and Obese Prevalence Estimates by Metropolitan, Micropolitan, and Rural Status from 2002 to 2006 BRFSS Surveys
vi
Figure-8 Licensed Physicians and Physician Assistants per 100,000 Population, 2007 vii
Rural Definitions
Number Title Page Map RD-1 Metropolitan, Micropolitan, and Rural Counties per the OMB Definition 2 Table RD-1 OMB Designation by County Population 3 Map RD-2 Urban/Rural Areas per the USCB Definition 4 Table RD-2 US Census Bureau Definitions of Urban vs. Rural Classification by County Population 5 Map RD-3 Rural Urban Commuting Areas (RUCAs) per the ORHP Definition 6 Map RD-4 Michigan Counties with Metropolitan, Micropolitan, and Rural Designations per the OMB
Definition 7
Map RD-5 State of the State Survey Regions in Michigan 8 Map RD-6 How State of the State Survey Regions Overlap the OMB designation of Metropolitan,
Micropolitan, and Rural Counties in Michigan 9
State Characteristics Number Title Page Table SC-1 Population Density of the Metropolitan, Micropolitan, and Rural Areas of Michigan
Based on 2006 US Census Bureau Population Estimates 12
Table SC-2 Population Density of the State of the State Survey Regions of Michigan based on the 2006 US Census Bureau Population Estimates
14
Table SC-3 Population Change of the Metropolitan, Micropolitan, and Rural Areas of Michigan, 1990 - 2005 US Census Bureau Population Estimates
14
Figure SC-1 Population Distribution by Age for Metropolitan, Micropolitan, and Rural Michigan from 1990
15
Figure SC-2 Population Distribution by Age for Metropolitan, Micropolitan, and Rural Michigan from 2005
15
Figure SC-3 Percent Population Change, 1990 - 2005 in Metropolitan, Micropolitan, and Rural Michigan
16
Figure SC-4 Race/Ethnicity Distribution for U.S and Michigan from 2000: with a close up of the non-White categories
17

Health of Rural Michigan Report – 98
Health Status
Number Title Page Figure HS-1 Crude Death Rates for Michigan’s 10 Leading Causes of Death in Metropolitan,
Micropolitan, and Rural Areas, 2005 33
Figure HS-2 Age-Adjusted Death Rates for Michigan’s 10 Leading Causes of Death in Metropolitan, Micropolitan, and Rural Areas, 2005
34
Table HS-1 Cause of Death as a Percent of Total Deaths in 2005 34 Figure HS-3 Crude Death Rates Among the Population Below Age 20 for Michigan’s Leading
Causes of Death by Metropolitan, Micropolitan and Rural Areas, 2005 35
Figure HS-4 Crude Death Rates Among the Population Age 20 to 44 for Michigan’s Leading Cause of Death in Metropolitan, Micropolitan, and Rural Areas in 2005
36
Figure HS-5 Crude Death Rates Among the Population Age 45 to 74 for Michigan’s Leading Cause of Death in Metropolitan, Micropolitan, and Rural Areas in 2005
37
Figure HS-6 Crude Death Rates Among the Population Age 75 and over for Michigan’s Leading Cause of Death in Metropolitan, Micropolitan, and Rural Areas in 2005
38
Figure HS-7 Rate of Years of Potential Life Lost below Age 75 Due to Selected Causes of Death in 39
Figure SC-5 Minority Race Distribution in Metropolitan, Micropolitan, and Rural Michigan from 2000 Census
17
Figure SC-6 Distribution of the Hispanic Population in Metropolitan, Micrpolitan, and Rural Michigan from 2000 Census
18
Table SC-4 Migrant/Seasonal Farmworker (MSFW) population in Michigan from 2006 18 Figure SC-7 Gender Ratio in Metropolitan, Micropolitan, and Rural Michigan from 1990 to 2006 19 Figure SC-8 Gender Ratio in SOSS regions of Michigan from 1990 to 2006 19 Figure SC-9 Marital Status in Michigan and the US from 2000 Census 20 Table SC-5 Marital Status in Michigan and the United States from 2000 Census 20 Figure SC-10 Comparison of Marriage versus Divorce Trend in Michigan, 1990 - 2005 21 Figure SC-11 Deaths and Live Births in Michigan, 1990 - 2004 21 Table SC-7 Birth to Death Ratio in Michigan, 1990 - 2005 21 Figure SC-12 Deaths and Live Births in Rural Michigan, 1990 - 2004 21 Figure SC-13 Infant Deaths in Michigan, 1990 - 2004 22 Figure SC-14 Infant Mortality Rates in Metropolitan, Micropolitan, and Rural Michigan, 3-Year
Rolling Average, 1990 - 2004 23
Figure SC-15 Fertility Rates in the US and Michigan from 1910 to 2005 23 Table SC-8 Annual Distributions of Births by Age of Mother, 1990 - 2004 24 Table SC-9 Change in Rate 1991-1995 to 2001-2005 by Age of Mother 24 Table SC-10 Death Rates by Area 25 Figure SC-16 Age Distribution of Deaths as a Percent of Total Deaths for Metropolitan, Micropolitan,
and Rural Michigan in 2004 25
Figure SC-17 Educational Attainment in Michigan from 1990 Census 26 Figure SC-18 Educational Attainment in Michigan from 2000 Census 27 Table SC-11 Industry in Michigan based on the 2002 Economic Census 28 Table SC-12 Industry in Michigan, the Top 3 Sectors, based on the 2002 Economic Census 28 Table SC-13 Change in Michigan’s Labor Force, 1990 to 2005 28 Figure SC-19 Labor Force as a Percentage of Total Population in Metropolitan, Micropolitan, and Rural
Michigan, 1990 - 2005 29
Figure SC-20 The Jobless Rate in Metropolitan, Micropolitan, and Rural Michigan, 1990 - 2005 29 Figure SC-21 Percent of the Population below the 200% Federal Poverty Level, 2000 Census 30 Figure SC-22 Sources of Health Insurance and Number of Uninsured by Urban/Rural, Current
Population Survey Data Files, Employee Benefit Research Institute from 2003 to 2005 31
Table SC-14 Michigan Medicaid Enrollment Rates per 1,000 persons 31

Health of Rural Michigan Report – 99
Metropolitan, Micropolitan, and Rural Areas in 2005 Figure HS-8 Age-Adjusted Cancer Incidence Rates in Metropolitan, Micropolitan, and Rural Areas,
1990 - 2004 40
Figure HS-9 Age-Adjusted Cancer Death Rates in Metropolitan, Micropolitan, and Rural Areas, 1990 - 2004
40
Figure HS-10 Age-Adjusted Breast Cancer Incidence Rates in Metropolitan, Micropolitan, and Rural Areas, 1990 - 2004
41
Figure HS-11 Age-Adjusted Breast Cancer Death Rates in Metropolitan, Micropolitan, and Rural Areas, 1990 - 2004
41
Figure HS-12 Age-Adjusted Colorectal Cancer Incidence Rates in Metropolitan, Micropolitan, and Rural Areas, 1990 - 2004
42
Figure HS-13 Age-Adjusted Colorectal Cancer Death Rates in Metropolitan, Micropolitan, and Rural Areas, 1990 - 2004
42
Figure HS-14 Age-Adjusted Lung Cancer Incidence Rates in Metropolitan, Micropolitan, and Rural Areas, 1990 - 2004
43
Figure HS-15 Age-Adjusted Lung Cancer Death Rates by Metropolitan, Micrpolitan, and Rural Areas, 1990 - 2004
43
Figure HS-16 Age-Adjusted Prostrate Cancer Incidence Rates in Metropolitan, Micropolitan, and Rural Areas, 1990 - 2004
44
Figure HS-17 Age-Adjusted Prostrate Cancer Death Rates in Metropolitan, Micropolitan, and Rural Areas, 1990 - 2004
44
Figure HS-18 Age-Adjusted Invasive Cancer Incidence Rates in Metropolitan, Micropolitan, and Rural Areas from 2002 to 2004
45
Figure HS-19 Age-Adjusted Breast Cancer Incidence Rates in Metropolitan, Micropolitan, and Rural Areas from 2002 to 2004
45
Figure HS-20 Age-Adjusted Colorectal Cancer Incidence Rates in Metropolitan, Micropolitan, and Rural Areas from 2002 to 2004
46
Figure HS-21 Age-Adjusted Lung Cancer Incidence Rates in Metropolitan, Micropolitan, and Rural Areas from 2002 to 2004
46
Figure HS-22 Age-Adjusted Prostrate Cancer Incidence Rates in Metropolitan, Micropolitan, and Rural Areas from 2002 to 2004
47
Figure HS-23 Prevalence Estimates of Selected Cancer Screening Indicators by Metropolitan, Micropolitan , and Rural Areas from 2002, 2004 and 2006 BRFS
47
Figure HS-24 Age-Adjusted Heart Disease Death Rate in Metropolitan, Micropolitan, and Rural Areas, 1990 - 2005
48
Figure HS-25 Age-Adjusted Kidney Disease Death Rates in Metropolitan, Micropolitan, and Rural Areas, 1991 - 2005
49
Figure HS-26 Age-Adjusted Diabetes Related Death Rates in Metropolitan, Micropolitan, and Rural Areas, 1991 - 2005
49
Figure HS-27 2005 Age Specific Death Rate Due to Accidents by Metropolitan, Micropolitan, and Rural Areas
50
Figure HS-28 Crude Suicide Death Rates in Michigan, 1991-2005 50 Figure HS-29 2005 Age Specific Suicide Death Rates in Metropolitan, Micropolitan, and Rural Areas 51 Figure HS-30 Crude Homicide Death Rates in Metropolitan, Micropolitan, and Rural Areas, 1991 -
2005 52
Figure HS-31 Preventable Hospitalizations as a Rate of Total Hospitalizations in Metropolitan, Micropolitan, and Rural Areas, 1991-2005
52
Figure HS-32 2005 Hospitalization Rates in Metropolitan, Micropolitan, and Rural Areas 53 Figure HS-33 Overweight and Obese Prevalence Estimates in Metropolitan, Micropolitan, and Rural
Areas, 2002 - 2006 BRFS 54
Figure HS-34 Prevalence Estimates of Selected Diet and Exercise Behaviors in Metropolitan, Micropolitan, and Rural Areas, 2002 - 2006 BRFS
55
Figure HS-35 Prevalence Estimates of Selected Risk Factors and Behaviors by Metropolitan, Micropolitan and Rural Areas, 2002 - 2006 BRFS
56
Figure HS-36 Prevalence Estimates of Blood Cholesterol Screening and Risk Factors in Metropolitan, 57

Health of Rural Michigan Report – 100
Micropolitan, and Rural Areas, 2002 - 2006 Figure HS-37 Infant Mortality Rates by Area in Michigan Three-Year Rolling Average, 1990 - 2004 58 Figure HS-38 White Infant Death Rates, 3-Year Rolling Averages in Metropolitan, Micropolitan, and
Rural Areas, 1991 - 2005 58
Figure HS-39 Inadequate Prenatal Care as a Percent of Total Live Births, 1990 - 2004 59 Figure HS-40 2005 Prenatal Care by Kessner Index from Metropolitan, Micropolitan, and Rural Areas 59 Figure HS-41 Low Birthweight Rates Among Singleton Births in Metropolitan, Micropolitan, and
Rural Areas per 1,000 Singleton Live Births, 1991 - 2005 60
Figure HS-42 Teen Pregnancy Rates in Metropolitan, Micropolitan, and Rural Areas per 1,000 Female Teen Population, 1989 - 2005
60
Figure HS-43 Incidence of Teenagers giving Birth as a Rate of Annual Live Births in Metropolitan, Micropolitan, and Rural Areas, 1990 - 2004
61
Table HS-3 Change in Pregnancy Rate by Age-Group in Metropolitan, Micropolitan, and Rural Areas, 1991-1995 to 2001-2005
61
Figure HS-44 Blood Lead Levels in Children Under the Age of Six from 1998 to 2006 62 Figure HS-45 Blood Lead Levels in Children Under the Age of Six in Metropolitan, Micropolitan, and
Rural Areas from 1998 to 2006 62
Figure HS-46 Percentage of Children Under the Age of Six Years with Venously Elevated Blood Lead Levels in Metropolitan, Micropolitan, and Rural Areas from 1998 to 2006
63
Figure HS-47 Proportion of Michigan Third Grade Children with Dental Decay, Caries, and Sealants from MDCH “Count Your Smiles” 2005 to 2006
63
Figure HS-48 2007 Percent of Children Receiving 4:3:1:3:3:1 Immunization-from Michigan Care Improvement Registry
64
Figure HS-49 2007 Percent of Children Receiving 4:3:1:3:3:1 Immunization in Comparison with Total Population from Michigan Care Improvement Registry
64
Figure HS-50 Incidence Rate of HIV Diagnoses by Metropolitan, Micropolitan and Rural Areas, 1990 - 2005
65
Table HS-4 2005 Chlamydia Cases and Rates in Metropolitan, Micropolitan, and Rural Areas 66 Map HS-1 2005 Chlamydia Cases Reported by County fro Both Sexes- Total Cases: 38,729 66 Figure HS-51 2005 Chlamydia Rates per 100,000 Population in Metropolitan, Micropolitan, and Rural
Areas 66
Table HS-5 2005 Gonorrhea Cases and Rates in Metropolitan, Micropolitan, and Rural Areas 67 Map HS-2 2005 Gonorrhea Cases Reported by County for Both Sexes- Total Cases: 17,684 67 Figure HS-52 2005 Gonorrhea Rates per 100,000 Population in Metropolitan, Micropolitan, and Rural
Areas 67
Map HS-3 2005 Syphilis Cases Reported by County for Both Sexes- Total Cases: 488 68 Table HS-6 2005 Syphilis Cases and Rates by Metropolitan, Micropolitan, and Rural Areas 68 Figure HS-53 2005 Syphilis Rates per 100,000 Population in Metropolitan, Micropolitan, and Rural
Areas 68
Figure HS-54 Hepatitis (A, B, and C) Cases in Michigan, 1990 - 2005 69 Figure HS-55 Crude Hepatitis (A, B, and C) Incidence Rates in Michigan, 1990 - 2005 69 Figure HS-56 3-Year Rolling Average for Salmonella Infection Rates per 100,000 Population 70 Figure HS-57 Chickenpox Infection Rates in Michigan per 100,000 population from 1990 to 2003 70 Figure HS-58 Chickenpox Cases from 1990 to 2003 70 Figure HS-59 Tuberculosis Incidence Rates in Michigan per 100,000 population, 1990 - 2005 71 Figure HS-60 Tuberculosis Death Rates in Michigan per 100,000 population, 1990 - 2005 71
Health Resources
Number Title Page Figure HR-1 Number of Licensed Providers per 100,000 Population in Metropolitan, Micropolitan,
and Rural Areas of Michigan, 2007 73

Health of Rural Michigan Report – 101
Figure HR-2 Number of Licensed Physicians and Physicians Assistants per 100,000 Population in Metropolitan, Micropolitan, and Rural Areas of Michigan, 2007
74
Figure HR-3 Number of Licensed Nurses and Nurse Practitioners per 100,000 Population in Metropolitan, Micropolitan, and Rural Areas of Michigan, 2007
75
Figure HR-4 Number of Licensed Dental Providers per 100,000 Population in Metropolitan, Micropolitan, and Rural Areas of Michigan, 2007
76
Figure HR-5 Number of Licensed Mental Health Providers (Non-Psychiatrists) per 100,000 Population in Metropolitan, Micropolitan, and Rural Areas of Michigan, 2007
77
Figure HR-6 Number of Licensed EMS Workers per 100,000 Population in Metropolitan, Micropolitan, and Rural Areas of Michigan, 2007
78
Table HR-1 2007 Health Professional Shortage Area Designations for Michigan 79 Table HR-2 Michigan’s State Loan Repayment Program Placements, 2000-2006 80 Table HR-3 Michigan’s Conrad State 30 Placements, 1995-2007 81 Map HR-1: Michigan’s Free Clinics 82 Table HR-4: Michigan’s Federally Qualified Health Centers, Number of Organizations and Clinic
Sites serving Michigan. 83
Map HR-2: Michigan’s Federally Qualified Health Centers (FQHCs) 83 Table HR-5: Michigan’s Rural Health Clinics, Number Clinic Sites serving Michigan by SOSS
Region 84
Map HR-3: Michigan’s Rural Health Clinics 84 Map HR-4: Michigan’s Hospitals 85 Table HR-6: Hospital Bed Size by Number of Beds 86 Table HR-7: Services offered by Hospitals and Critical Access Hospitals (CAHs) in rural Michigan 87 Table HR-8: Non-Metropolitan County Ambulance Service Providers 87 Table HR-9: Michigan’s Air Ambulance Coverage 88 Table HR-10: Michigan’s Air Ambulance Transports 88 Table HR-11: Non-Metropolitan Hospital Emergency Room Visits, 2002-2004 Annual Average 89 Table HR-12: Long-Term Care Facilities in Michigan 90 Map HR-5: Michigan’s Nursing Homes and County Medical Care Facilities 91 Table HR-13: Adult Foster Care Facilities in Michigan 91 Map HR-6: Michigan’s Long-Term Care and Adult Foster Care Facilities 92