Metsä Group Interim report Q1–Q3 2021
24
Transcript of Metsä Group Interim report Q1–Q3 2021


Metsä Group Interim report Q1–Q3 2021Ilkka HämäläPresident and CEO
27 October 2021

• Sales EUR 4,457 million (Q1–Q3 2020: EUR 3,698 million)• Operating result* EUR 694 million (274)• Operating result* 15.6% of sales (7.4)• Return on capital employed* 16.4% (7.0) • Sales and operating result in January–September improved
mainly due to higher sales prices of pulp• Result in the comparison period was weakened by the strikes at
the Finnish mills• Exchange rate fluctuations had a negative result effect of
approximately EUR 99 million
27 October 2021 3
Excellent result for Metsä Group
Metsä Group Q1–Q3 2021
*comparable
• Average market prices of pulps were stable compared to Q2, but markedly higher than in Q3 2020
• Demand for paperboards remained strong, and their average prices increased significantly
• Metsä Board decided to invest EUR 210 million in increasing the folding boxboard capacity at the Husum mill in Sweden
• Metsä Wood announced its plan for a new EUR 200 million Kerto LVL® mill in Äänekoski
• Metsä Spring invested in the start-up company Innomost, which produces bioactive products from forest industry side streams
• Metsä Tissue announced its plan for a new tissue paper mill in the United Kingdom
27 October 2021 4
Events during the third quarter
Metsä Group Q1–Q3 2021

• Metsä Group launched a programme, implemented between 2021 and 2030, to take part in regionally relevant and effective development projects that improve biodiversity and the state of waters in Finland.
• Metsä Group expanded its ecological sustainability programme for commercial forests with measures related to safeguarding biodiversity of herb-rich forests
• European Commission started an inspection on Metsä Fibre, a subsidiary of Metsäliitto Cooperative, under EU antitrust rules as part of larger investigation of the market for wood pulp sector
27 October 2021 5
Events after the reporting period
Metsä Group Q1–Q3 2021

27 October 2021 6
1,216 1,235 1,2601,328
1,4281,477
1,386 1,419 1,4381,372 1,374
1,290 1,2531,200 1,245
1,357 1,400
1,542 1,515
0
200
400
600
800
1 000
1 200
1 400
1 600
Q1/17 Q2 Q3 Q4 Q1/18 Q2 Q3 Q4 Q1/19 Q2 Q3 Q4 Q1/20 Q2 Q3 Q4 Q1/21 Q2/21 Q3/21
Sales, quarterly EUR million
Metsä Group Q1–Q3 2021

27 October 2021 7
128119
134
185
208 210223
208
180
128110
7662
96115
94
174
242
278
0
50
100
150
200
250
300
Q1/17 Q2 Q3 Q4 Q1/18 Q2 Q3 Q4 Q1/19 Q2 Q3 Q4 Q1/20 Q2 Q3 Q4 Q1/21 Q2/21 Q3/21
EUR million
Comparable operating result, quarterlyMetsä Group Q1–Q3 2021

27 October 2021 8
Change in comparable operating resultEUR million
Comparable operating result Q1–Q3/2020 274Sales prices 508Sales volumes 83Exchange rates (after hedging) -99Change in wood raw material unit costs -4Change in raw material, energy and other variable costs unit costs -62Employee costs -52Maintenance and other fixed costs -7Change in inventories (including volume and valuation) 44Depreciation and other 8
Comparable operating result Q1–Q3/2021 694
Metsä Group Q1–Q3 2021
27 October 2021 9
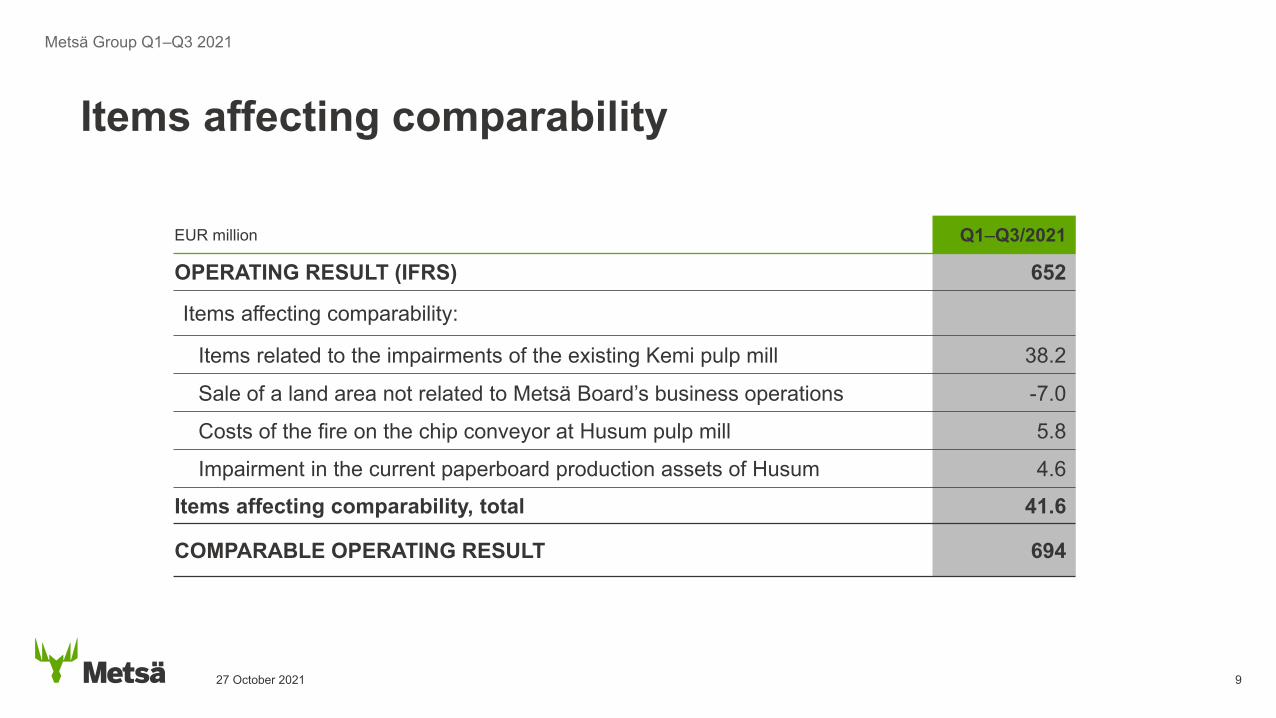
Items affecting comparability
EUR million Q1–Q3/2021
OPERATING RESULT (IFRS) 652
Items affecting comparability:
Items related to the impairments of the existing Kemi pulp mill 38.2
Sale of a land area not related to Metsä Board’s business operations -7.0
Costs of the fire on the chip conveyor at Husum pulp mill 5.8
Impairment in the current paperboard production assets of Husum 4.6
Items affecting comparability, total 41.6
COMPARABLE OPERATING RESULT 694
Metsä Group Q1–Q3 2021

27 October 2021 10
Comparable ROCE Metsä Group – Q3 2021
11.2
17.1
11.0
7.0
16.4
0
2
4
6
8
10
12
14
16
18
1-9/2017 1-9/2018 1-9/2019 1-9/2020 1-9/2021
%
Target > 12%

27 October 2021 11
Equity ratio
45.0
53.156.2 57.2
60.5
0
10
20
30
40
50
60
70
2017 2018 2019 2020 9/2021
%
Metsä Group Q1–Q3 2021

27 October 2021 12
Interest-bearing net liabilities
993
463
374
168
-66-100
100
300
500
700
900
1 100
2017 2018 2019 2020 9/2021
EUR million
Metsä Group Q1–Q3 2021

27 October 2021 13
Capital expenditure
631
274 260
401
637
0
200
400
600
800
1000
1200
2017 2018 2019 2020 9/2021
EUR million
Includes investments in leased fixed assets.
Full year estimate
Metsä Group Q1–Q3 2021
27 October 2021 14
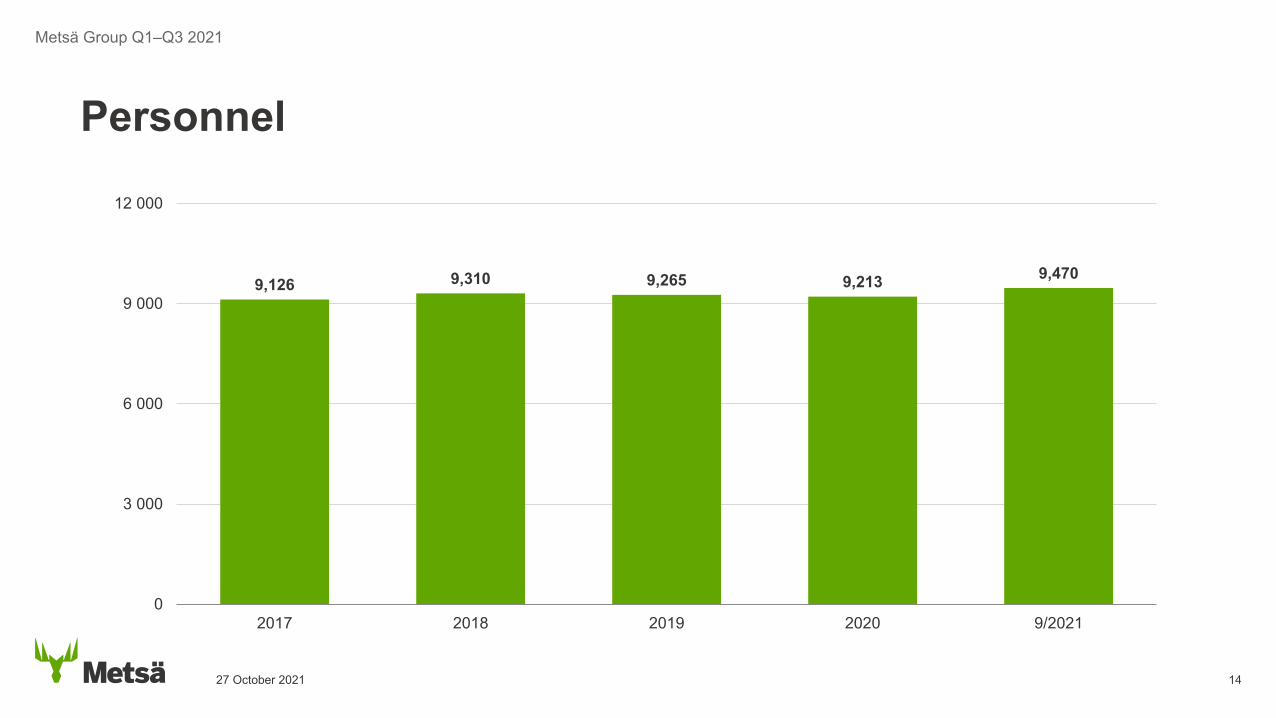
Personnel
9,126 9,310 9,265 9,213 9,470
0
3 000
6 000
9 000
12 000
2017 2018 2019 2020 9/2021
Metsä Group Q1–Q3 2021
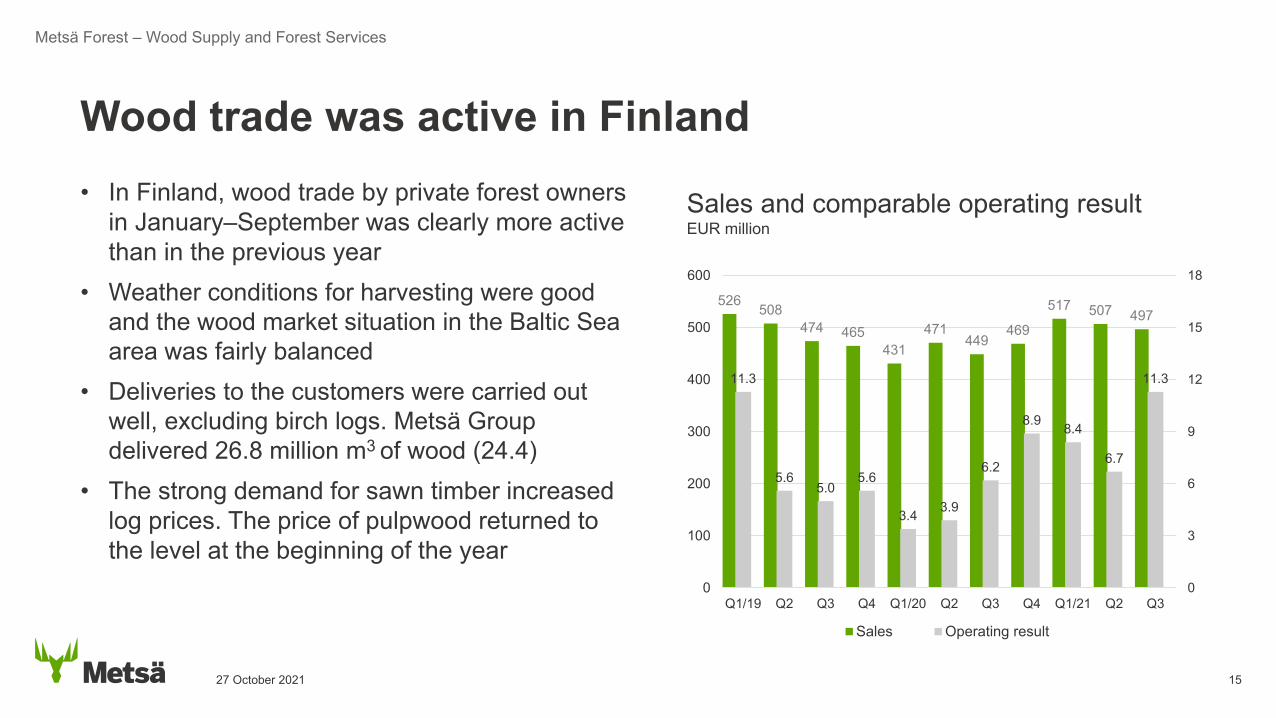
• In Finland, wood trade by private forest owners in January–September was clearly more active than in the previous year
• Weather conditions for harvesting were good and the wood market situation in the Baltic Sea area was fairly balanced
• Deliveries to the customers were carried out well, excluding birch logs. Metsä Group delivered 26.8 million m3 of wood (24.4)
• The strong demand for sawn timber increased log prices. The price of pulpwood returned to the level at the beginning of the year
27 October 2021 15
Wood trade was active in Finland
Metsä Forest – Wood Supply and Forest Services
Sales and comparable operating result EUR million
526 508474 465
431471
449469
517 507 497
11.3
5.65.0
5.6
3.4 3.9
6.2
8.9 8.4
6.7
11.3
0
3
6
9
12
15
18
0
100
200
300
400
500
600
Q1/19 Q2 Q3 Q4 Q1/20 Q2 Q3 Q4 Q1/21 Q2 Q3
Sales Operating result

• Metsä Wood’s sales and profitability increased from the previous year, due to the strong demand in all product categories and main markets
• The prices of spruce plywood and Kerto LVL increased. The prices of birch plywood were at the previous year’s level
• Increased raw material prices and challenges in the availability of birch logs affected profitability negatively
• Metsä Wood is planning a EUR 200 million Kerto LVL mill investment in Äänekoski. The investment decision requires the local detailed plan for the area and the environmental permit
27 October 2021 16
Good demand for engineered wood products
Metsä Wood – Wood Products Industry
111119
111
93 87
104
122 117
141156
142
1.83.3 3.1
-1.1-3.3
1.3
6.64.7
7.0 6.85.4
-4
0
4
8
12
16
20
-30
0
30
60
90
120
150
Q1/19 Q2 Q3 Q4 Q1/20 Q2 Q3 Q4 Q1/21 Q2 Q3
Sales Operating result
Sales and comparable operating result EUR million

• Demand for softwood pulp strengthened in Europe but in China declined seasonally during the summer
• USD-denominated market prices of long-fibre pulp increased by 38% in Europe and 55% in China, compared to Q1–Q3 2020
• Sales volumes of pulp and sawn timber increased substantially in Q1–Q3 2021 compared to corresponding period in 2020
• Market prices of sawn timber in Q1–Q3 2021 increased by 58% compared to the corresponding period in 2020
• Construction of the sawmill in Rauma and the bioproduct mill in Kemi is progressing as planned
27 October 2021 17
Demand for pulp and sawn timber was very strong
Metsä Fibre – Pulp and Sawn Timber Industry
623
556 567
490
412 428 459
528561
652693
122.4
83.1
33.29.9
-21.316.0 17.1
-8.0
72.1
168.0
225.9
-40
0
40
80
120
160
200
240
280
-100
0
100
200
300
400
500
600
700
Q1/19 Q2 Q3 Q4 Q1/20 Q2 Q3 Q4 Q1/21 Q2 Q3
Sales Operating result
Sales and comparable operating result EUR million

350
500
650
800
950
1100
1250
1400
350
500
650
800
950
1100
1250
1400
'10 '11 '12 '13 '14 '15 '16 '17 '18 '19 20 21
Long-fibre pulp, Europe, EUR
USD / EUR USD / EUR
18
Price of pulp (PIX) in Europe and China
Long-fibre pulp Europe, USD
Short-fibre pulp, Europe, USD
Short-fibre pulp, Europe, EUR Long-fibre pulp China, USD
Source: Fastmarkets Foex27 October 2021
Metsä Fibre – Pulp and Sawn Timber Industry

• Operating result improved due to the increased prices and delivery volumes for paperboards, and the increased average prices for market pulp
• Cost inflation was rapid. Prices of electricity and certain chemicals increased in particular
• Exchange rate fluctuations had a negative result impact of around EUR 40 million
• Renewal of Husum pulp mill is progressing as planned• Metsä Board invests EUR 210 million in increasing
folding boxboard capacity in the Husum mill in Sweden
27 October 2021 19
The paperboard market continued very strong
Metsä Board – Paperboard Industry
487 477 489 478 472 473 471 473494
556516
61.8
41.0 42.5 39.133.8
60.5 62.5 64.5
88.8 102.5104.0
0
20
40
60
80
100
120
0
100
200
300
400
500
600
Q1/19 Q2 Q3 Q4 Q1/20 Q2 Q3 Q4 Q1/21 Q2 Q3
Sales Operating result
Sales and comparable operating result EUR million

500
600
700
800
900
1000
1100
1200
500
600
700
800
900
1000
1100
1200
2009 2010 2011 2012 2013 2014 2015 2016 2017 2018 2019 2020 2021
Folding boxboard
White-top kraftliner
Market prices of paperboard in Europe
Sources: Fastmarkets RISI & Fastmarkets FOEX
EUR/ tonne EUR/ tonne
27 October 2021 20
Metsä Board – Paperboard Industry
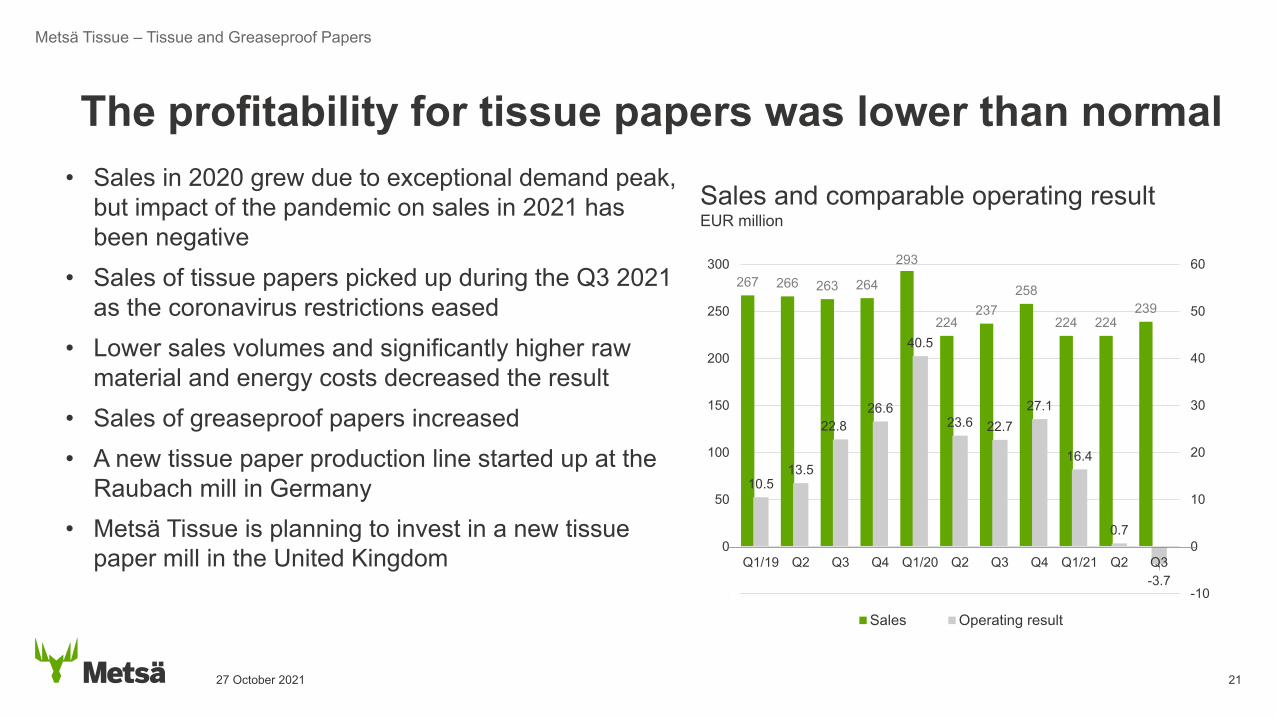
• Sales in 2020 grew due to exceptional demand peak, but impact of the pandemic on sales in 2021 has been negative
• Sales of tissue papers picked up during the Q3 2021 as the coronavirus restrictions eased
• Lower sales volumes and significantly higher raw material and energy costs decreased the result
• Sales of greaseproof papers increased • A new tissue paper production line started up at the
Raubach mill in Germany• Metsä Tissue is planning to invest in a new tissue
paper mill in the United Kingdom
27 October 2021 21
The profitability for tissue papers was lower than normal
Metsä Tissue – Tissue and Greaseproof Papers
267 266 263 264
293
224237
258
224 224239
10.513.5
22.826.6
40.5
23.6 22.727.1
16.4
0.7
-3.7-10
0
10
20
30
40
50
60
-50
0
50
100
150
200
250
300
Q1/19 Q2 Q3 Q4 Q1/20 Q2 Q3 Q4 Q1/21 Q2 Q3
Sales Operating result
Sales and comparable operating result EUR million

• Demand for engineered wood products remains strong in all product categories
• Demand for softwood pulp remains good in Europe. In China there are uncertainties related to market pulp consumption in Q4
• Demand for sawn timber is expected to decline seasonallytowards the winter
• Demand for paperboards is expected to remain good. The delivery volumes in Q4 2021 are expected to decline from Q3 2021 due to annual maintenance shutdowns, low inventory levels, and a potentially seasonally slower December
• Demand for tissue papers is expected to increase as the restrictions resulting from the pandemic are lifted
• Growth trend in greaseproof paper demand continues
Market outlook
27 October 2021
Summary

Metsä Group’s comparable operating result is in October–December 2021 expected to weaken from July–September 2021
Near-term result outlook
27 October 2021
Summary

Your partner in profitable growth