Election Campaigns An Introduction to Information Manipulation.
Methods of Election Manipulation and the Likelihood ofPost-Election Protest
January 17, 2017
Abstract
The risk of popular protest is one of the few deterrents against election manipulation in
authoritarian regimes and unconsolidated democracies, but why are some fraudulent elections
met with popular protest while others are not? We use data from elections in 108 countries,
from 1980 to 2004, to show that the regime’s choice of election manipulation tactics affects
the likelihood of post-election protest. Leaders signal their strength and resources by manip-
ulating elections, but some manipulation tactics send stronger signals than others. We find
that opposition groups are more likely to protest when relatively cheap administrative fraud
is employed, but not when more costly forms of manipulation—extra-legal mobilization and
voter intimidation—are used. This study demonstrates the importance of accounting for both
the choice of electoral manipulation tactics and the variation in the degree of regime strength
communicated by different manipulation tactics when analyzing post-election protests.
1
Beginning in late November 2004, tens of thousands of protesters took to the central square in
Kiev, Ukraine to protest the victory of Prime Minister Viktor Yanukovych in an allegedly fraudu-
lent presidential election. Sixteen years earlier in Mexico, as many as 250,000 people marched on
the capital’s main square to protest the results of a presidential election in which the challenger,
Cuauhtemoc Cardenas, had appeared on track to win until officials declared victory for the rul-
ing party after a suspicious computer crash brought the count to a halt. The protests in Mexico
bolstered opposition parties that would eventually unseat the ruling party. The Orange Revolution
in Ukraine, one of the most prominent recent examples of major post-election protest, led to the
annulment of the original results and victory for the opposition challenger in a re-vote.
Such dramatic examples are rare, however. Most manipulated elections in hybrid or authori-
tarian regimes pass by with little, if any, post-election protest. This paper investigates whether the
mix of election-manipulation tactics that governments employ affects the probability of protests
challenging the results. In particular, we argue that manipulation tactics that involve directly in-
fluencing voters (such as vote-buying and voter intimidation) send signals about the organizational
and financial strength of the incumbents—thus strong extra-legal voter mobilization or intimida-
tion efforts can deter protest by making it look less likely to succeed. By contrast, administrative
fraud of the kind seen in Mexico in 1988 and in Western Ukraine in 2004 communicates weakness,
making protest more likely.
We consider three broad categories of electoral manipulation: administrative fraud, extra-legal
voter mobilization, and voter intimidation. Administrative fraud is committed by election officials
and includes tactics such as vote padding, ballot stuffing, and tampering with ballots. Administra-
tive fraud does not involve voters, or the use of agents who interact with voters to ensure they vote
for a particular candidate. In contrast, extra-legal voter mobilization involves direct contact with
voters in the form of vote-buying, patronage, multiple-voting, and similar tactics. Similarly, voter
intimidation involves pressuring voters through party representatives, supervisors, or the security
services. All three tactics require organizational networks that link political leaders with voters,
2
mobilize and monitor clients, and distribute resources or penalties. While mobilization, intimida-
tion, and administrative fraud are our theoretical focus in this article, we control for other means by
which authoritarian leaders can control elections, including the fairness of the pre-election political
environment, prior political violence, and the level of repression.
The three types of manipulation that we emphasize require different investments of time and
money. Administrative manipulation is more cost-effective and easier for leaders to control than
extra-legal voter mobilization or intimidation. The latter pair of tactics rely on material rewards
or the application of political or legal pressure, which require the construction and monitoring of
complex patronage networks of voters and agents. We argue that, since they are based on such
networks, extra-legal mobilization and voter intimidation are costlier signals of the strength of the
ruling party than administrative manipulation. As a result, we predict that opposition parties and
activists are more likely to protest elections when leaders rely on administrative manipulation. We
test our claim with a statistical matching technique that allows us to approximate the benefits of
random assignment to treatment and control groups for observational data, along with additional
robustness checks.
This article contributes to a growing literature on election manipulation in two main ways.
First, much existing research focuses on the role ‘electoral manipulation’ as a general category
may have in sparking post-election protest (Tucker, 2007; Magaloni, 2010; Fearon, 2011; Little,
2012). This project acknowledges the possibility that this approach may lead to an aggregation er-
ror if different manipulation tactics, with their varying costs and benefits, affect protest in different
ways. This paper contributes to recent attempts to disaggregate the causes and effects of various
electoral manipulation tactics (Fortin-Rittberger, 2014; Harvey, 2016). Second, most existing re-
search focuses either on the role of authoritarian leaders in committing election fraud (Lehoucq,
2003; Howard and Roessler, 2006; Ziblatt, 2009), or on the capacity of opposition groups to mobi-
lize (Bunce and Wolchik, 2010; Magaloni, 2010) against it. We help bridge these two explanations
by considering how the incumbent’s choice of manipulation tactic can influence opposition groups’
3
evaluation of the strength of the incumbent.
The article proceeds as follows. In the next section, we situate our research question within the
literature on authoritarian institutional manipulation, electoral fraud, collective action, and protest.
Then, we develop a theory of electoral manipulation tactics and post-electoral protest. Next, we
test the theory using a series of empirical tests to assess the impact of administrative manipulation
and extra-legal voter mobilization on post-electoral protest. We conclude with a summary and
discuss the implications of our findings.
Elections, Electoral Manipulation, and Protest
Authoritarian Institutional Manipulation
Many authoritarian leaders confronted with the global spread of democracy brought in by the
third wave of democratization in the late 1990s responded by legalizing opposition parties and
allowing competitive elections. They did so, however, while manipulating the process in order
to maintain their hold on power (Howard and Roessler, 2006). Hybrid regimes, which combine
democratic and authoritarian elements (Diamond, 2002), are deliberately pseudodemocratic; they
use formally democratic political institutions to mask and legitimate authoritarian domination (Di-
amond et al., 1989). These regimes in the “gray zone” (Carothers, 2002) or “foggy zone” (Schedler,
2002) between democracy and dictatorship are often stable, though when they do collapse they are
more likely to shift toward democracy than toward renewed authoritarianism (Brownlee, 2009).
Scholars of hybrid regimes have classified them as “competitive authoritarian” (Levitsky and Way,
2002), “electoral authoritarian” (Diamond, 2002; Schedler, 2002), and “semi-authoritarian” (Ott-
away, 2003) regimes.
The manipulation of elections is one of several ways in which the leaders of hybrid regimes use
manipulative tools to inhibit institutional autonomy and assert their dominance over formally rep-
4
resentative institutions (Schedler, 2002). Authoritarian leaders often deploy strategies to control
the legislature, judiciary, media, civil society, and elections and use manipulative tools to minimize
the risk of losing elections. Schedler (2010) identifies different categories of manipulative tools
for elections. Leaders can disempower elected officials by removing particular policy areas from
their portfolio or giving veto powers to unelected actors. Rulers can also limit the choices avail-
able to voters with market restrictions: excluding opposition parties, denying the opposition fair
access to public spaces, and disenfranchising citizens. Leaders can use vote buying or threats of
violence to prevent voters from expressing their true preferences at the ballot box. Finally, rulers
can manipulate elections by distorting results through discriminatory practices or institutions.
As authoritarian elections have become increasingly common, researchers have devoted con-
siderable attention to understanding the roles that elections and political parties perform in settings
where those institutions do not directly determine the fates of incumbents. This growing area of
study has generally concluded that authoritarian elections are generally beneficial for incumbents,
but also carry some risk. Authoritarian elections have been shown to benefit rulers in a variety of
ways, including co-optation of the opposition (Gandhi and Przeworski, 2007, 2006), information-
gathering, and managing elite disagreements (Magaloni, 2006; Brownlee, 2007; Lust-Okar, 2006;
Blaydes, 2011; Reuter and Robertson, 2015). Yet, these institutions also allow for the possibility of
pro-opposition contestation. Authoritarian leaders face a dilemma: they set up liberal-democratic
institutions to help prop up their regimes and ensure their survival, but these same institutions can
become sites of resistance: “[U]nless political institutions are granted at least a minimal range of
power and autonomy, they cannot make an independent contribution to authoritarian governance
and survival. But as soon as political institutions are granted some power and autonomy, they can
turn against the dictator. They open up arenas of struggle and sites of resistance...where multiple
actors test in multiple ways the limits of the permissible” (Schedler, 2010, 77). Election manip-
ulation is part of a larger toolkit of strategies for authoritarian leaders (Birch, 2011); they choose
strategies from this toolkit to ensure that nominally democratic institutions - including multiparty
5
elections - remain under their control (Levitsky and Way, 2010).
Electoral Manipulation, Collective Action, and Protest
While elections and other representative institutions can serve as sites for opposition resistance,
collective action problems often block popular mobilization. All ordinary citizens living in an
abusive regime where citizens are unable to place appropriate limits on state (Weingast, 1997)
would benefit from joining together in resistance against the government, but people falsify their
preferences (Kuran, 1989), “shirk,” and tolerate political abuses. Individuals do not cooperate and
join in protest because they believe the cost of participating is too high and the likelihood of success
is too low. In addition, structural incentives to not share information lead to a belief that the size
of the population willing to protest is smaller than it is. A solution to this problem would need to
change participation costs, benefits of the goal, or beliefs about the likelihood of success (Chong,
1991).
Manipulated elections can provide a solution to this collective action problem (Tucker, 2007).
People normally face abusive actions on an individual level and have to decide to react alone.
Efforts at resisting day-to-day abuses are likely to be fruitless, and the chance and cost of pun-
ishment are too high. Electoral manipulation differs from day-to-day violations because everyone
experiences the same abusive act at the same time. The cost of participating in protests drops be-
cause people believe they are less likely to be individually punished as the number of protesters
increases. In addition to lowering the cost of participation, electoral manipulation also increases
beliefs in the likelihood of success. As Tucker (2007) notes, electoral fraud increases hopes about
success partly because a mass post-election protest will have a louder voice than any individual
acts of resistance or protest. More importantly, post-election protest offers the chance of changing
the country’s leadership: “if you are successful, the bums actually can be thrown out” (Tucker,
2007, 541). Thus, by reducing the cost of participation and increasing beliefs about the likelihood
of success, electoral manipulation provides a clear focal point for action (Schelling, 1960; Chong,
6
1991; Weingast, 1997).
Additionally, a sizable body of research shows that protest—especially electoral protest—is a
tool strategically utilized by political parties and social-movement organizers. Robertson (2010)
finds that regional elites in Russia activated patronage networks to stage protests against the cen-
tral government in the 1990s, while the Kremlin used the same tactics to stage pro-government
rallies throughout Vladimir Putin’s rule. The Color Revolutions in Serbia, Georgia, Ukraine, and
Kyrgyzstan were characterized by well-organized, experienced social movement organizations that
laid the groundwork for post-election protest and formed linkages with unified opposition groups
that called for post-election protests (Beissinger, 2007). Similarly, Bunce and Wolchik (2010) ar-
gue that, far from being spontaneous outpourings of discontent, major post-election protests are
carefully planned and organized by leaders and activists in parties and social activist groups. The
introduction of authoritarian elections creates an opportunity for a strategic alliance between ac-
tivist groups and political parties, which can work together to stage post-election mobilizations
(Trejo, 2014). Massive protests only take hold once a dedicated core of party and group activists
have decided to make a sustained push against incumbents (Kuran, 1989).
Finally, manipulated elections can communicate information about the strength and expected
durability of the government and ruling party. This view is primarily associated with Simpser
(2013), who argues that governments engage in excessive and blatant manipulation efforts in order
to convince other actors—bureaucrats, the armed forces and security services, opposition parties,
and citizens—that the the government has the resources and organizational capacity to remain in
power for the foreseeable future. This view has antecedents in findings which show that authoritar-
ian governments aim for supermajority victories (Magaloni, 2006) and that the ability to engage in
manipulation attracts ambitious, talented politicians to the ruling party (Greene, 2007). However,
none of this work investigates the possibility that different manipulation tactics might affect the
probability of protest.
7
Theory: Signals from Election Manipulation Tactics
The circumstances under which mass protests challenge election fraud can inform us about how
electoral manipulation works as an authoritarian tool. The risk that electoral manipulation might
spark popular protest by citizens and opposition parties is thought to be one deterrent in electoral
authoritarian states (Tucker, 2007; Magaloni, 2010; Fearon, 2011). In this paper, we test whether
the particular methods that leaders use to manipulate elections have an effect on the likelihood of
post-electoral protest. Our results help test and extend the signaling model of election manipu-
lation, which holds that authoritarian leaders manipulate elections—even when they would likely
win in the absence of election-day tampering—in order to display their organizational strength and
material resources to other political actors (Simpser, 2013). This theory suggests that simply en-
gaging in electoral manipulation is not a signal of regime weakness, since even popular and secure
incumbents regularly resort to manipulation to demonstrate their strength.
However, leaders have many different tactics at their disposal with which to manipulate elec-
tions (Schedler, 2002). These tactics vary in how strongly they signal regime strength and re-
sources. Extra-legal voter mobilization with material rewards (Lehoucq and Molina, 2002) and in-
timidation through workplace pressure (Frye et al., 2014) or physical violence (Fortin-Rittberger,
2014; Collier and Vicente, 2012) require investments in networks of brokers and clients, to mon-
itor voters, distribute rewards, and impose punishments. By contrast, administrative manipulation
involves relatively few people and produces publicly observable results. Direct manipulation of the
results using agents in the electoral administration is thus relatively cheap and easy for leaders to
monitor. We argue that extra-legal voter mobilization is a costly signal of strength and resources.
When leaders rely heavily on administrative manipulation, opposition parties and activists will be
more willing to challenge the elections in the streets.
Administrative fraud is more commonly employed in weaker states (Fortin-Rittberger, 2014).
It relies primarily on election commissioners who can falsify election protocols or adjust vote-
8
totals as needed. They can also stuff ballot boxes themselves or turn a blind eye when others do
so. In authoritarian countries, coercing or co-opting precinct officials is relatively straightforward;
electoral commissions can be dominated by the ruling party, facilitating large-scale manipulation
(Calingaert, 2006; Bader, 2012; Kovalov, 2014). Judicial punishment for electoral malfeasance
is likely to be rare where the ruling party controls the courts (Magaloni, 2010; Popova, 2006).
Under such conditions, large numbers of pro-government votes can be manufactured (or opposition
votes discarded) at relatively low cost. At higher levels of aggregation, this manipulation process
becomes more efficient and less costly in administrative resources. That is, wholesale manipulation
at the level of the central election commission requires the complicity of many fewer people than
’retail’ manipulation at the level of the precinct.
However, even at the retail level, administrative manipulation is often more cost-effective than
extra-legal mobilization or voter intimidation efforts. Administrative manipulation relies on the
cooperation of easily monitored officials on the state payroll. The number of individuals needed
to carry out administrative fraud of a given size is relatively small compared to that needed to
carry out extra-legal mobilization or intimidation efforts of equivalent size. For example, election
administrators in Russia have been observed adding hundreds or even thousands of votes to the
ruling party’s total in a single precinct (Golos, 2012). An equivalent vote-buying effort would re-
quire paying those hundreds or thousands of voters, as well as the dozens of brokers who each take
their own cut. Those brokers and voters also complicate the principal-agent problems associated
with election manipulation (Rundlett and Svolik, 2016); voters, not just brokers, may fail to follow
through with their instructions. Furthermore, some administrative tactics, such as failing to invest
in up-to-date voter registration lists or to provide a sufficient number of polling places for residents,
may end up being less costly than running a clean election (Birch, 2011).
Leaders use extra-legal mobilization to directly influence voters in several ways. Political ma-
chines can make payments directly to individuals in exchange for their support (Stokes, 2005;
Nichter, 2008), pay opposition voters to abstain (Gans-Morse et al., 2014), hire voters to vote
9
multiple times, and more. In any case, voters must be rewarded for behaving correctly. Conse-
quently, extra-legal mobilization of any kind requires the creation of patronage networks, whereby
patrons can monitor clients’ behavior, and punish or reward them appropriately. These networks
are usually mediated by layers of brokers, with individuals at each level responsible for overseeing
a larger number of actors at the level below (Knoke, 1990; Lazar, 2007; Auyero, 2007; Holzner,
2007). These pyramidal networks are inherently vulnerable to principal-agent problems, as brokers
and clients both may face incentives to shirk their responsibilities when monitoring is imperfect
(Kitschelt and Wilkinson, 2007).
The same sorts of networks may be used to engage in voter intimidation. Voter intimidation has
been known to carried out by organized militias in Nigeria (Bratton, 2008), hired thugs and party
supporters in Zimbabwe (Collier and Vicente, 2012), and employers and supervisors in Russia
(Frye et al., 2014). In a series of case studies in Argentina, Auyero et al. (2009) demonstrate that
patrons can activate their patronage networks in electoral and non-electoral contexts, mobilizing
clients in violent and non-violent political activity. Similar results have been shown in Indonesia
(Kalyvas, 2003) and India (Wilkinson, 2006). As Auyero et al. (2009) write, “Well-functioning
patronage networks can be purposively activated to conduct politics by other collective (and some-
times violent) means.”
The resulting networks are complex, costly, and inefficient. At every level of the network,
brokers must be prevented from diverting resources for their own private gain and clients must
be monitored (Kitschelt and Wilkinson, 2007). One study of vote-buying in a district election in
Taiwan illustrates the costliness of such efforts. Wang and Kurzman (2007) found that at least 45
percent of voters who had received a payment from the Kuomintang voted for a different candidate.
Motivating large numbers of voters to support the ruling party in one district in that election could
cost as much as $4 million, not including necessary payments to brokers (Wang and Kurzman,
2007). A survey of Nigerian voters found similar problems with defection by voters who had
been targeted by vote-buying and by intimidation efforts (Bratton, 2008). This problem does not
10
diminish with scale: a study of Costa Rica’s elections in the first half of the twentieth century found
that a major vote-buying effort in a presidential election could consume as much as twenty percent
of a candidate’s budget (Lehoucq and Molina, 2002; Lehoucq, 2007). Persistent principal-agent
problems and defections mean that extra-legal mobilization requires patrons to devote considerable
resources if they are to rely on this method to influence an election. Patronage networks are not
simply a function of state capacity; while incumbents who make use of this tactic are likely to be
well funded, they also need effective organizations, significant local knowledge, and consolidated
control over patronage pyramids built on a combination of local political machines, corporate
groups, and/or coercive elements of the state (Hale, 2014; Stokes et al., 2013). Thus, not all
incumbents are capable of using extra-legal mobilization; the decision to use any particular strategy
or set of strategies is shaped by the available access to resources.
Harvey (2016) argues that incumbents build up patronage networks in competitive areas in part
as a means of deterring contentious action by opposition parties and voters. Constructing these
networks under the control of the incumbent principal, by absorbing local patronage networks,
prevents local machines from agitating against the incumbent (Robertson, 2010; Hale, 2014). The
patronage networks used to mobilize and pressure voters at election time can be directed to de-
mobilize clients in times of protest, or to mobilize clients in defense of the regime. By building
or coopting local patronage networks, incumbents increase the difficulty and risk of opposition
mobilization. By utilizing their networks to influence elections, authoritarian incumbents send a
costly signal of the resource and organizational advantages of the ruling party. Harvey (2016) indi-
rectly tests the argument by showing that mobilizational forms of manipulation are more common
in competitive areas, while administrative fraud is more common in pro-regime strongholds. We
offer a more direct (and cross-national) test, by showing that post-election protest is more likely
when administrative fraud, rather than voter-mobilizing efforts, is used. Harvey’s findings also
help rule out the potentially confounding explanation that elevated competitiveness increases the
likelihood of protest. Since increased competitiveness has been shown to be associated with voter
11
intimidation and vote-buying, rather than with fraud, our argument that administrative fraud causes
protest should not be spuriously correlated with high competitiveness.
Consequently, we argue that administrative manipulation, like all forms of electoral manipula-
tion, creates grievances for voters. However, administrative fraud only weakly signals the incum-
bent regime’s capacity to marshal financial and organizational resources. By contrast, the ability
to manipulate large numbers of voters on election day indicates deep pockets and a deep bench
of allies. Administrative fraud, then, is a potential sign of weakness—the government needs to
manipulate the results in order to maintain control, but it may lack the organizational capacity to
back up the results if challenged by the opposition. Extra-legal voter mobilization and intimidation
efforts are just as contrary to the spirit of clean elections, but communicate different information
about the strength of the regime that may deter post-election protest. They are indicators of the
strength and stability of pro-incumbent patronage networks than can also be deployed outside the
electoral arena. This argument complements a recent finding that pre-election manipulation of the
electoral laws increases the likelihood of opposition protest (Chernykh, 2014), because adjustment
of the electoral laws communicates little information about the strength of the regime other than its
ability to control the legislative process. Finally, our model of electoral protest follows (Bunce and
Wolchik, 2010) in emphasizing the importance of strategic decision-making and cohesion among
opposition groups.
Hypotheses
Our theory generates the following three hypotheses.
H1: Higher levels of extra-legal voter mobilization will have no significant effect on the prob-
ability of post-election protest.
Extra-legal voter mobilization tactics have two simultaneous, countervailing effects. The ma-
12
nipulation of the election through voter mobilization does create a grievance for the opposition and
a potential rallying point for collective action (a positive effect). However, it also communicates
information about regime strength that serves to deter protest. We expect these two effects to can-
cel each other out: more extensive voter mobilization efforts produces stronger grievances, but also
send a greater signal of ruling-party organizational strength.
H2: Higher levels of voter intimidation will have no significant effect on the probability of
post-election protest.
Our expectation for voter intimidation is the same as for extra-legal voter mobilization because
it, too, produces both grievances and signals of regime strength that will cancel each other out.
H3: Elections with higher levels of administrative fraud will be associated with a higher prob-
ability of protest.
Administrative fraud creates an opportunity for opposition collective action; however, it sends
a much more tenuous signal of regime strength. As a result, we expect the probability of protest to
increase as administrative fraud worsens.
Data, Methods, and Results
To test these hypotheses, we combine existing data to create a dataset on the type and sever-
ity of electoral manipulation, underlying economic and political conditions, and protest. There
are two major sources for our dataset. First, the National Elections Across Democracy and Au-
tocracy (NELDA) dataset (Hyde and Marinov, 2012) provides data on post-election protest, our
dependent variable, and several controls. Second, the Data on International Election Monitoring
13

(DIEM) dataset (Kelley, 2012) provides the measures of electoral manipulation tactics that serve
as explanatory variables in our models. Political context is measured using data from the Polity
IV dataset (Marshall et al., 2014). Finally, additional data on unemployment and gross domestic
product are taken from the World Bank (World Bank, 2014). NELDA covers all elections from
1945-2010, while DIEM (which relies on monitoring organizations reports) includes data from
elections in 108 countries over the period from 1980 to 2004. Since the size of our dataset is lim-
ited by DIEM, our dataset covers those countries that accepted monitors during the period covered:
new democracies (e.g. Bulgaria), competitive authoritarian regimes (e.g. Russia), and some highly
authoritarian systems (e.g. Uzbekistan).
The combined dataset includes 593 observations of elections and protest from 1980 to 2004.
While there are 593 observation reports in our overall dataset, there are only 301 unique elections.
Duplicate elections exist where multiple monitoring organizations issued reports on the same elec-
tion. We eliminate duplicate observations by taking the highest (that is, the worst) score reported
by any observer mission for each DIEM variable. This approach has the benefit of incorporating
information from multiple observer missions. This procedure also helps compensate for downward
bias that has been found in observation mission reports, as observer organizations often face in-
centives to under-report allegations of manipulation (Kelley, 2012). It also reduces the number of
missing values, since any individual observation mission may have recorded no score for particular
variables.
We analyze the data using two complementary approaches, in addition to a robustness check
presented in the appendix. First, we use multiple imputation to account for non-random missing
data before conducting a logit analysis. Multiple imputation maximizes the number of observations
that can be employed in the model and helps correct for the potential bias associated with non-
random missing data. Separately, we employ a statistical matching technique before running the
logit analysis. By reducing bias and model dependence, matching allows us to better estimate the
causal effect of each electoral manipulation tactic on protest. Finally, as a robustness check, we
14
run a logit model of the raw data. All three approaches are supportive of our theory.1
Dependent Variable
The dependent variable for this study, post-election protest, comes from NELDA (Hyde and
Marinov, 2012), and records whether protests or riots occurred after the election. The codebook
states that these protests must be “at least somewhat related to the handling or outcome of the
election” in order to be counted. Because this is a binary variable, we employ a logit model to test
our hypotheses.
Explanatory Variables
Our predictions are tested using three variables from election-observation mission data coded
in DIEM. The first explanatory variable, administrative fraud, is operationalized as a measure of
problems in election-day vote processing. This variable estimates the severity of “vote padding,
ballot stuffing, tampering with ballots or the ballot box, and falsification of election protocols”. As
such, it captures the kind of electoral malfeasance that affects results directly, but does not involve
voters or signal the strength of patronage networks. The second explanatory variable, extra-legal
voter mobilization, is operationalized as a measure of problems such as multiple voting by indi-
viduals, voter impersonation, vote-buying, and the distribution of favors by political parties. The
third explanatory variable, intimidation covers a variety of behaviors, including political pressure
on voters, extraordinary tax inspections, administrative fines, intimidation of candidates, arrest
of voters, and martial law. Both extra-legal mobilization and intimidation measure the kinds of
manipulation that involve extensive organizational networks, resource distribution, and the mobi-
lization of actual voters. All three variables are categorical and measured on a scale from zero (no
problems) to three (major problems). We discuss the correlation between the explanatory variables
1It would be possible to combine matching with imputation: Hill (2004) proposes two methods for doing so.However, we do not do so in this case, in an attempt to limit complexity of the model.
15

in the upcoming section on statistical matching.
Since we are investigating the effect of electoral manipulation strategies on protest, we can only
include an election in our dataset if it was observed and evaluated by election monitors. Our dataset
thus excludes elections in which no monitors were present. Excluding un-monitored elections is
unlikely to bias our results for several reasons. First, over the time period we study, election
monitoring rapidly became entrenched as an international norm (Kelley, 2012), even among states
which intend to engage in manipulation (Hyde, 2011). The presence of election monitors does not
prevent regimes from manipulating elections. The set of monitored elections encompasses a wide
variety of total elections, as a result. Second, since we include only monitored elections, we hold
constant any effect monitors may have on the likelihood of post-election protest by publicizing
violations (Daxecker, 2012), on the type of manipulation employed by governments and political
parties seeking to avoid exposure (Simpser and Donno, 2012; Sjoberg, 2013), and on the long-
term incentives for leaders to hold democratic elections (Hyde and Marinov, 2014). Finally, it
does not appear that observers were more able to detect some forms of manipulation than others.
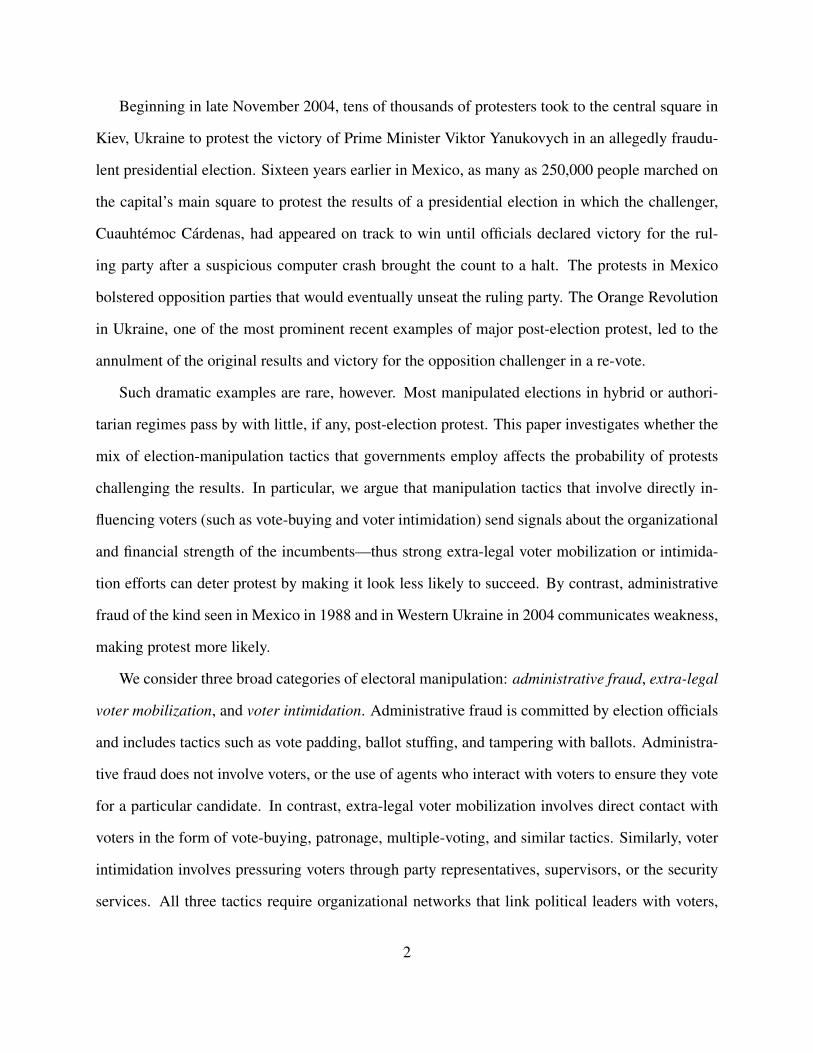
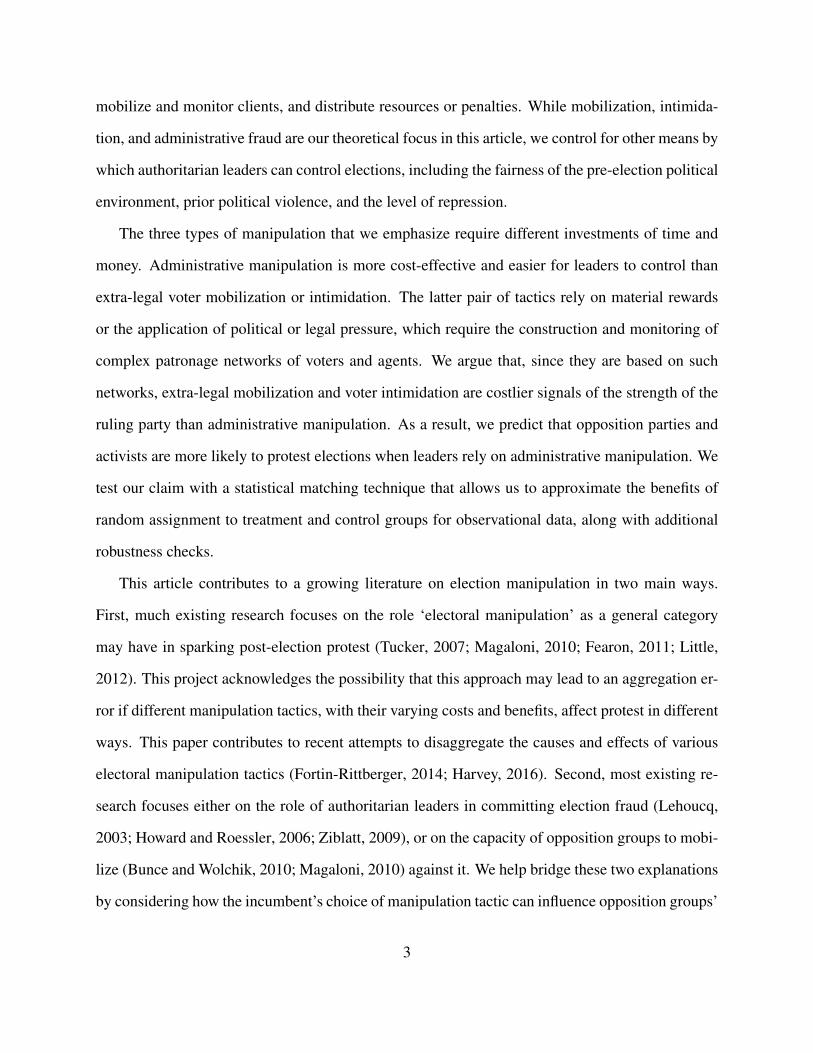
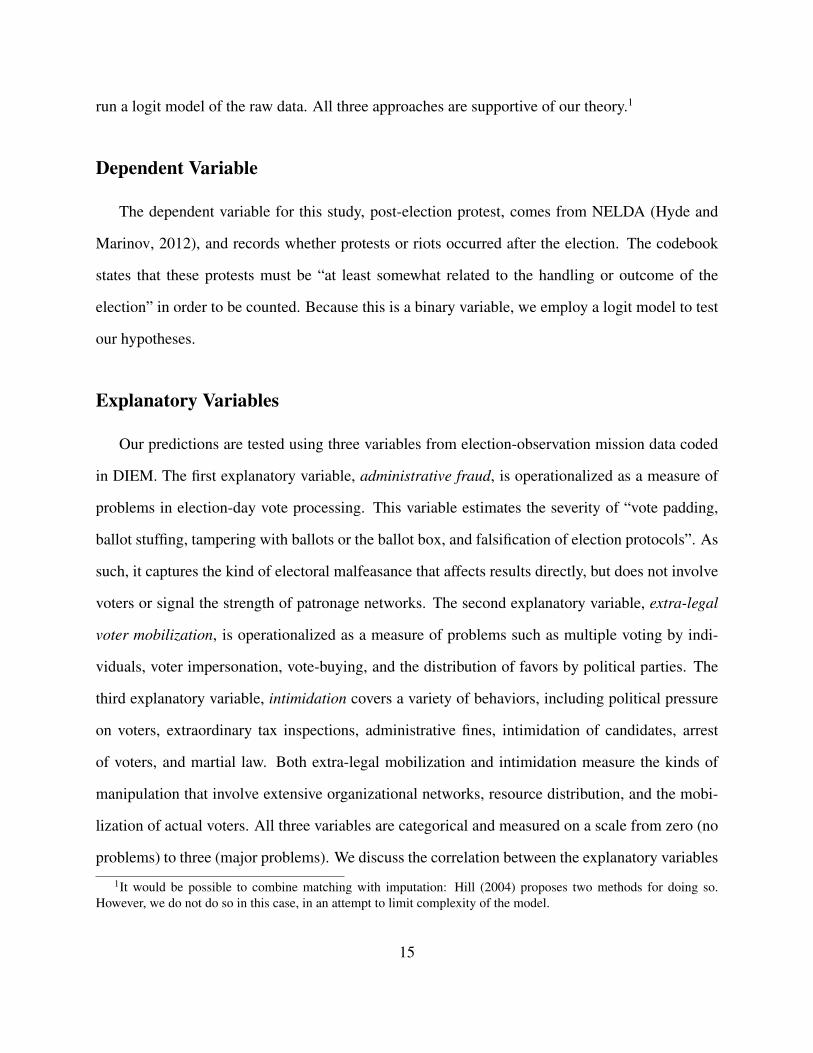
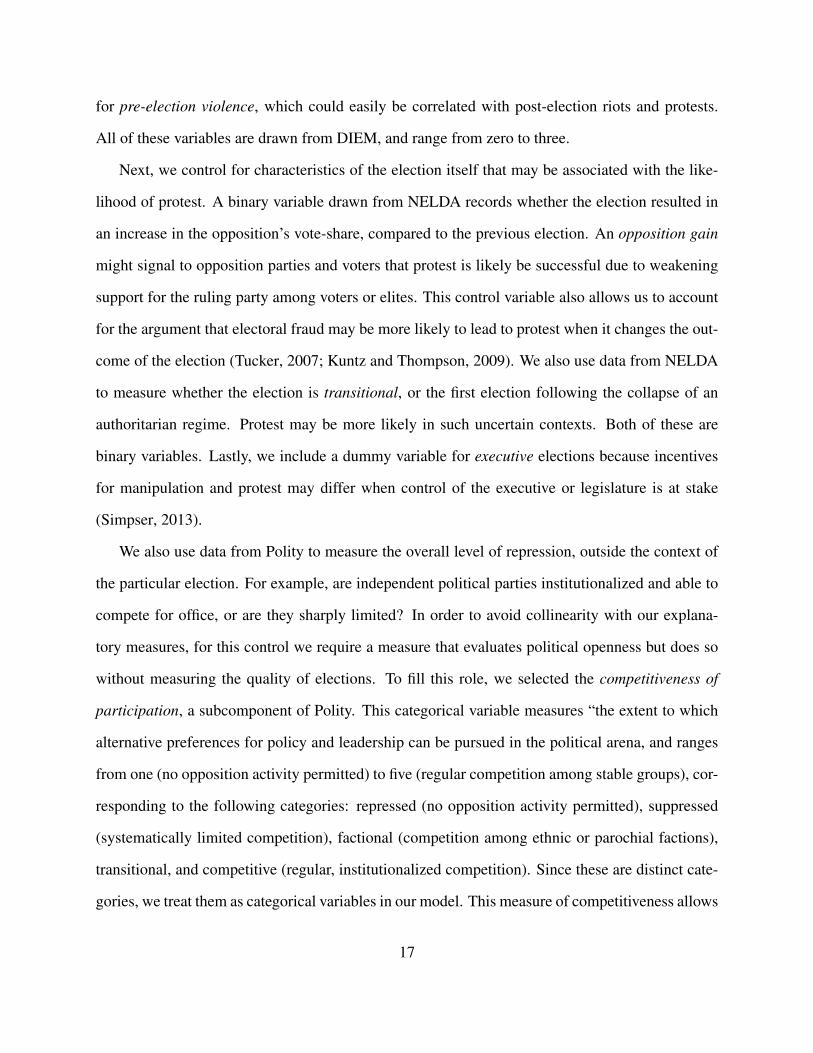
The median value for administrative fraud, extra-legal mobilization, and voter intimidation is 1,
and the mean values are 1.1, .83, and .95, respectively. Figures 1 and 2 illustrate the variation in
observations of fraud, mobilization, and intimidation.
Control Variables
We control for other types of manipulation, pre-election violence, and other relevant social and
political characteristics. First, we control for overall pre-election cheating, which evaluates pre-
election abuse of public funds, campaign freedom, media openness, and intimidation by public
authorities. Since these sorts of manipulation are often legal and less embedded in clientelistic
networks, they draw less international condemnation and may be less likely to spark mass protest
(Birch, 2011), though Chernykh (2014) finds pre-election manipulation of electoral rules was pos-
itively associated with post-election protest in post-communist countries. In addition, we control
16
for pre-election violence, which could easily be correlated with post-election riots and protests.
All of these variables are drawn from DIEM, and range from zero to three.
Next, we control for characteristics of the election itself that may be associated with the like-
lihood of protest. A binary variable drawn from NELDA records whether the election resulted in
an increase in the opposition’s vote-share, compared to the previous election. An opposition gain
might signal to opposition parties and voters that protest is likely be successful due to weakening
support for the ruling party among voters or elites. This control variable also allows us to account
for the argument that electoral fraud may be more likely to lead to protest when it changes the out-
come of the election (Tucker, 2007; Kuntz and Thompson, 2009). We also use data from NELDA
to measure whether the election is transitional, or the first election following the collapse of an
authoritarian regime. Protest may be more likely in such uncertain contexts. Both of these are
binary variables. Lastly, we include a dummy variable for executive elections because incentives
for manipulation and protest may differ when control of the executive or legislature is at stake
(Simpser, 2013).
We also use data from Polity to measure the overall level of repression, outside the context of
the particular election. For example, are independent political parties institutionalized and able to
compete for office, or are they sharply limited? In order to avoid collinearity with our explana-
tory measures, for this control we require a measure that evaluates political openness but does so
without measuring the quality of elections. To fill this role, we selected the competitiveness of
participation, a subcomponent of Polity. This categorical variable measures “the extent to which
alternative preferences for policy and leadership can be pursued in the political arena, and ranges
from one (no opposition activity permitted) to five (regular competition among stable groups), cor-
responding to the following categories: repressed (no opposition activity permitted), suppressed
(systematically limited competition), factional (competition among ethnic or parochial factions),
transitional, and competitive (regular, institutionalized competition). Since these are distinct cate-
gories, we treat them as categorical variables in our model. This measure of competitiveness allows
17

us to control for the scenario in which the level of opposition activity is limited to such an extent
that an opposition victory is nearly impossible and, as a result, the incumbent is not threatened and
electoral manipulation is not needed.
The final set of control variables measure economic conditions that may give rise to political
unrest. All economic control variables are measured for the year before the election. These are:
GDP per capita (logged), election-year unemployment, and election-year inflation (logged). We
take the natural logarithm of GDP per capita and election-year inflation because these variables
are very non-normal in their natural state and heavily influenced by distant outliers. Furthermore,
we include both logged inflation and its square in our models, in the understanding that moderate
inflation can be a sign of economic growth, while runaway inflation can be a source of instability.
See Table 1 for information on these variables.
Pre-Processing: Multiple Imputation
In order to make use of as much data as possible given the modest size of the dataset, we use
multiple imputation to estimate values for missing data. Without multiple imputation, almost half
of the data —137 observations —is lost due to missingness; after imputation, we can make use of
all 301 elections. Excluding observations with missing values reduces the amount of information
available and may also introduce worse problems. The bulk of the missing observations are at-
tributable to the economic variables: unemployment, inflation, GDP growth, and GDP per capita.
These values are more likely to be missing for developing countries. Dropping those observations
can lead to biased parameter estimates because the missingness is not random (King et al., 2001).
Because our data include multiple elections over time and across countries, we implement the
multiple imputation procedure for time-series cross-sectional data proposed by Honaker and King
(2010).
To reduce the risk that an outlier in the imputation process might drive the results, we created
five distinct imputed datasets (Rubin, 2004). Since the imputed observations are slightly differ-
18
ent for each imputation, the regression coefficients, standard errors, and significance levels will
vary across the five datasets. Combining the results from all five datasets according the proce-
dure laid out by (Rubin, 2004) accounts for variance within each estimate as well as across the
imputed datasets, and avoids cherry-picking results from a favored dataset. The imputed datasets
are analyzed using the same logit model employed in Models 1 through 3.
Results from Imputed Data
Table 2 shows the results from analysis of the multiple-imputation data. All three models pre-
sented here include our main variable of interest, administrative fraud. In order to demonstrate that
multicollinearity between voter mobilization and voter intimidation is not obscuring the effect of
those variables on protest, Model 1 drops intimidation, Model 2 drops mobilization, and Model 3
includes both. The results show that administrative fraud is positively and significantly associated
with post-election protest across all three models, while there is no statistically significant rela-
tionship between extra-legal mobilization or intimidation and protest in any of the models. Figures
presented in the appendix show these results graphically for each of the five imputed datasets for
Models 1 and 2.
Pre-Processing: Statistical Matching
Statistical matching techniques attempt to approximate the benefits of random assignment to
treatment and control groups for observational data (where random assignment is not possible).
There are a variety of techniques that attempt to match untreated and treatment observations with
regard to the control variables, in order to improve the balance of treatment and control groups.
Any unmatched observations are discarded. This pre-processed data is then used in place of the
full dataset when running the intended statistical analysis. Matching data in this way can reduce
estimation error, bias, and model dependence, and increase confidence in the causal nature of
19
statistical patterns found in observational data (Iacus et al., 2015). In our case, matching is used
to isolate the independent effect of each treatment variable on the probability of protest. We use
nearest-neighbor matching with Mahalanobis distance, the most common form of multivariate
matching (Sekhon, 2009), to pre-process the data before running the logistic regressions.
Matching is an important step in our research design because the severity of administrative
manipulation may correlate with the severity of extra-legal mobilization and intimidation. This
correlation between the variables of interest may result in imprecise estimates of the coefficients,
large standard errors, and regression results that are sensitive to small changes in the model or data.
Matching can enable us to tease out the independent effect of the treatment variable. For example,
consider a group of elections in which extra-legal mobilization was severe. In some of these cases
administrative manipulation also took place (treated units), while in others it did not (controls).
By matching similar treatment and control observations, and discarding the rest, we can more
accurately estimate the independent causal effect of administrative fraud on protest. Furthermore,
by swapping the treatment and control variable in a second model, we can test for the independent
effect of extra-legal mobilization controlling for administrative fraud.2
In order to determine the independent effect of administrative fraud, controlling for extra-legal
mobilization and intimidation, we conduct three separate analyses of post-election protest. In the
first, we designate administrative fraud as the treatment variable, and use measures of mobilization
and intimidation as controls after matching. In the second and third approaches, extra-legal mobi-
lization and intimidation serve as treatment variables (respectively), while administrative fraud is
used as a post-matching control. Note that treatment variables are not designated in the logit phase
of the analysis, but in the matching phase —observations are sorted into control and treatment
groups, and then matched based on their values for the control variables. Since both of our treat-
ment variables have four categories by default, we first collapse each one into a binary variable.
2The Pearson’s correlation coefficient between administrative fraud and extra-legal mobilization before matchingis .50. After matching, the correlation coefficient between the two raw variables is .35, and the correlation coefficientbetween the binary administrative fraud treatment variable and extra-legal mobilization is .27.
20
For each treatment variable, we marked elections that received a zero or one (no problems or minor
problems) as untreated, while elections that received a two or three (moderate or major problems)
were considered treated.
This division into binary treatments is theoretically justifiable based on the coding procedure
used in the DIEM dataset (Kelley, 2011). Minor problems were coded when election observation
reports noted a problem in passing, using words like rare, uncommon, unusual, exceptional, and so
on. These isolated incidents can have little impact on the outcome of the election or on the signal
sent to other political actors, and so we consider them untreated (along with elections in which no
problems were recorded). By contrast, elections were coded as experiencing moderate problems
if observation mission reports described violations that were “considerable” or “not uncommon”
—somewhere between “negligible” and “egregious”. We consider that such activities do have a
signaling effect and may affect the outcome of the election, especially given the incentives that
election monitors may have to downplay their findings (Kelley, 2012). Together with elections
coded as having major problems, we mark such elections as treated.3
Ho et al. (2007, 216) note that “[a]ll variables. . . that would have been included in a parametric
model without pre-processing should be included in the matching procedure”, with the exception
of variables that are themselves affected by the treatment (see also Stuart (2010)). They also rec-
ommend that binary variables with a large proportion of one outcome be excluded. We follow these
guidelines by matching treatment and control groups along all explanatory and control variables
with the exception of opposition vote-gain, transitional election, suppressed participation, factional
participation, and competitive participation. The first of these is excluded because it has the po-
tential to be affected by the level and type of manipulation employed, while the remaining four
variables are not matched because they are unevenly proportioned binary variables. As a result,
treatment and control groups were matched using GDP per capita, unemployment, inflation, exec-
3An alternative approach, coding an election as treated if any election manipulation at all was observed, yieldssubstantively similar results. However, this method produces far more treatment observations than controls, whichlimits the usefulness of matching.
21
utive elections, ‘transitional’ participation, pre-election cheating, pre-election violence, extra-legal
mobilization, and voter intimidation. Table 3 presents the percent improvement in the difference-
in-means between the treatment and control groups after matching compared to the un-processed
data, for Model 4 (shown below). Equivalent tables for the remaining models are available in the
appendix.
As the table shows, this technique finds one match for each of the 62 treated observations, and
prunes 40 control observations. Balance improves for most variables, as the difference between
the mean values of the treatment and control groups on those variables declines after matching.
Most importantly, balance along the extra-legal mobilization variables improves by twenty-seven
percent after matching. Improvement is similar in size for the other models which used matched
data.
Ho et al. (2007, 223) also advocate that, after matching, researchers should employ the same
parametric analysis they would have employed in the absence of pre-processing; a simple difference-
in-means between control and treatment groups is prone to omitted variable bias unless exact
matching is possible. In our case, we use a logit regression model that includes the treatment vari-
able as well as the controls provided above. A similar approach is employed by Daxecker (2012)
in her investigation of election monitoring and the likelihood of post-election violence. In this
case, there are only forty-two observations marked as treated, and only eighty-four observations
are matched as a result. Eighty control observations are pruned. Though the number of observa-
tions is much reduced, the matching process helps reduce bias without sacrificing much in terms
of variance (Ho et al., 2007; Smith, 1997).
Results from Matched Data
Despite the fact that the matching the data results in pruning roughly half of the observations
in both cases (and requires collapsing a four-level categorical variable into binary treatments),
analysis of the matched data supports the unmatched results. Table 4 and the Figure 3 below
22
present the results of the matched data. Models 4 through 6 use the binary administrative fraud
variable as the treatment. In Models 4 and 5, the four-level mobilization and intimidation variables
are used as controls; in Model 6, both are used. To test for the possibility that the other forms
of manipulation do not have their own independent effects on protest, Models 7 and 8 use binary
mobilization and intimidation variables as treatments. In all five models the most competitive
category of PARCOMP is excluded, due to the very small number of such observations in the
matched datasets.
The treatment condition in Models 4, 5, and 6—moderate or severe administrative fraud—has a
positive effect on the probability of protest compared to the control group. The effect is statistically
significant at the conventional p < .05 threshold in Model 4, and falls just short of this threshold in
Models 7 and 8. Nonetheless, we still consider this to be a supportive result given the challenges
of condensing a four-point treatment variable into a binary variable, sacrificing some variance
during the matching procedure by pruning observations, and the collinearity of the mobilization
and intimidation variables. That the size of the effect is fairly stable across all three models is also
reassuring. That the result holds while using matching techniques, despite the limitations of the
data, increases confidence that administrative fraud has an independent positive effect on protest,
controlling for mobilization and intimidation efforts.
That extra-legal mobilization and intimidation show no effect on protest when used as control
variables is not surprising, since in these models we have attempted to balance those variables
across treatment and control groups. In order to apply a stronger test of our hypothesis, we also
use these variables as matched treatments (balancing administrative fraud across treatment and
control groups, along with the other control variables). The results of these tests are presented in
Models 7 and 8.
In Model 7, extra-legal mobilization is the treatment variable along which observations are
matched. After balancing control variables, there is no significant difference in the probability of
protest in elections where extra-legal mobilization was moderate or severe compared to elections
23
where such mobilization was isolated or nonexistent. The same pattern holds true in Model 8: voter
intimidation has no effect as a treatment variable. By comparing matched samples in this way, we
help isolate the causal effect of administrative manipulation from that of extra-legal mobilization
or voter intimidation. These results support Hypotheses 1 through 3.
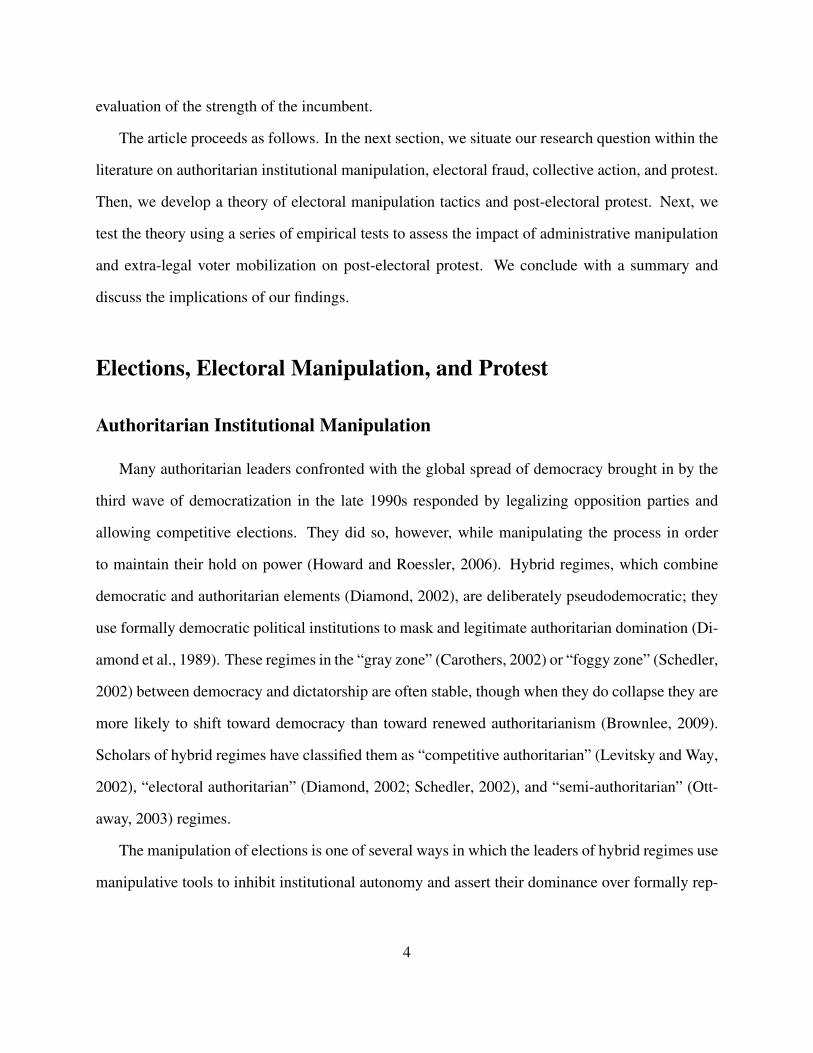
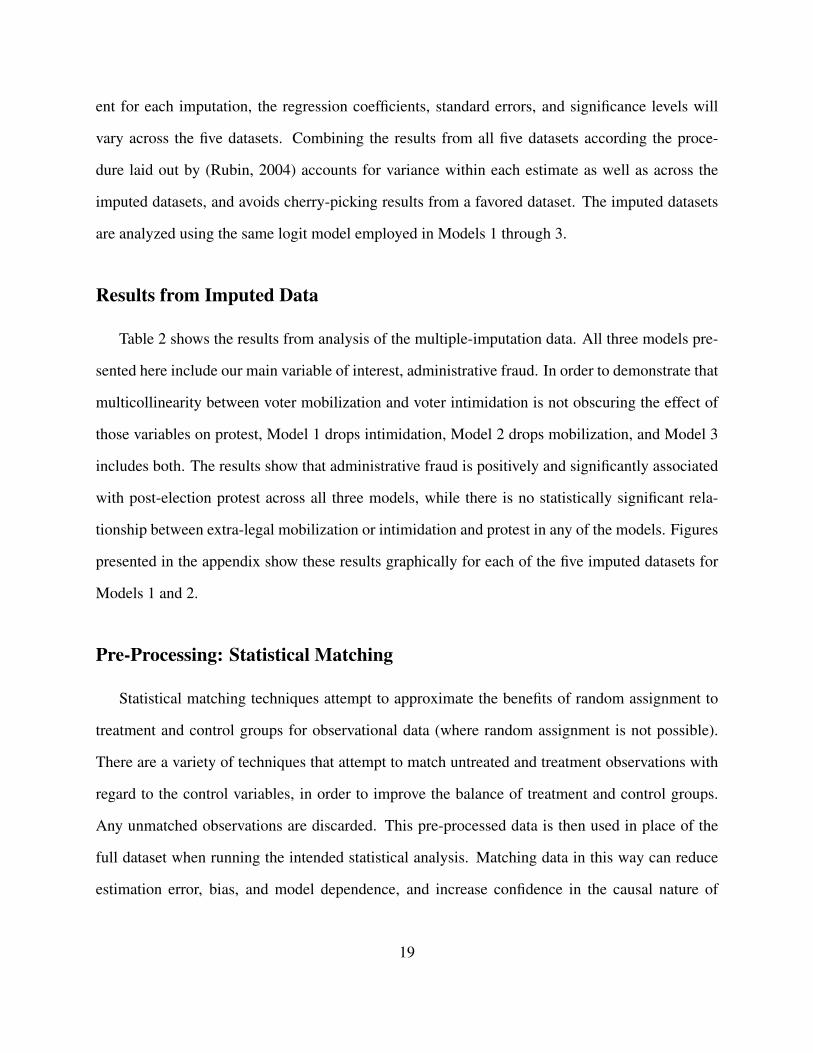
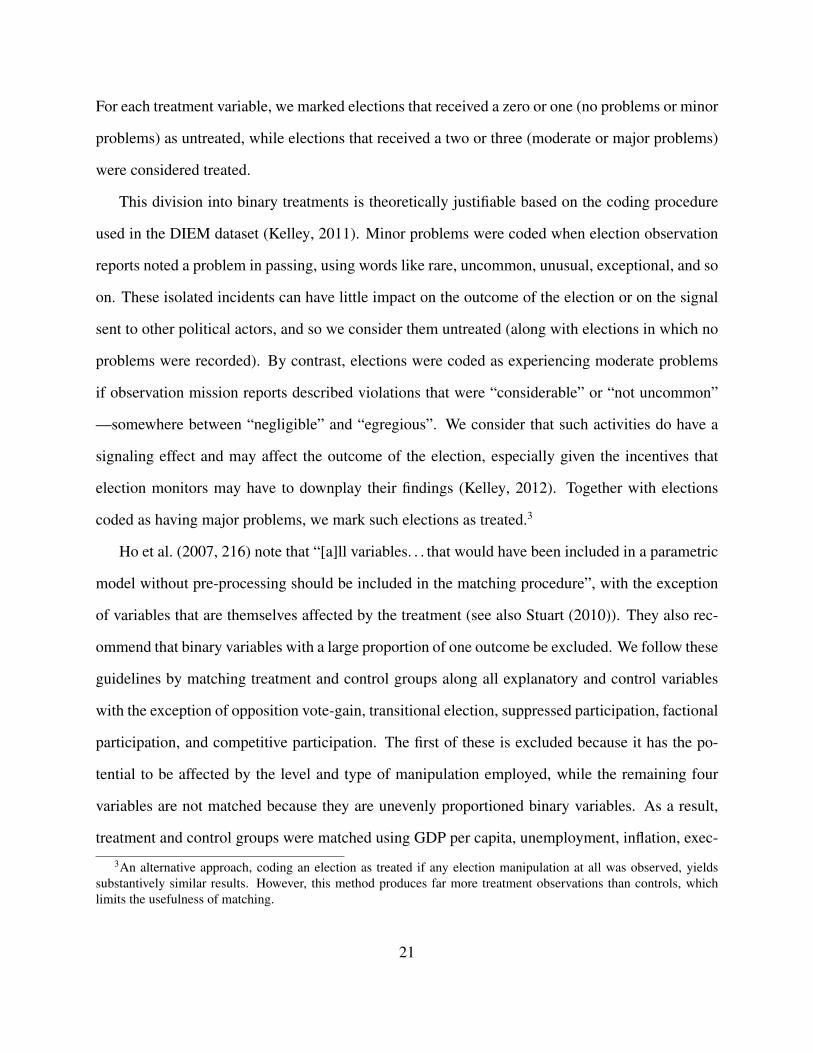
Figure 3 illustrates the results graphically. Most control variables have been excluded from
the figure, in order to present the results more clearly. The figure shows control variables that are
occasionally significant in Models 4 - 8, along with the the three theoretically important variables:
administrative fraud, mobilization, and intimidation. The points on the plot represent the coeffi-
cients for each variable estimated by the models, with 90% confidence intervals. As the figure
shows, administrative fraud always has a positive and significant effect, while mobilization and
intimidation never do (either as treatment or control variables).
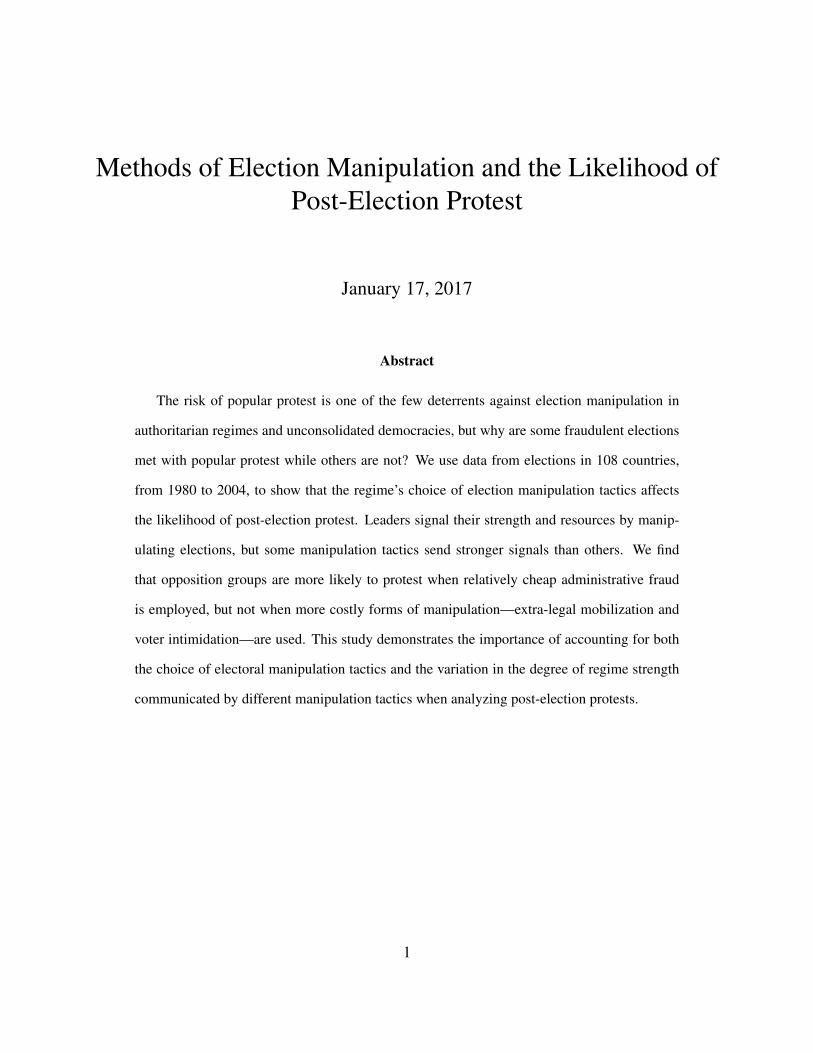
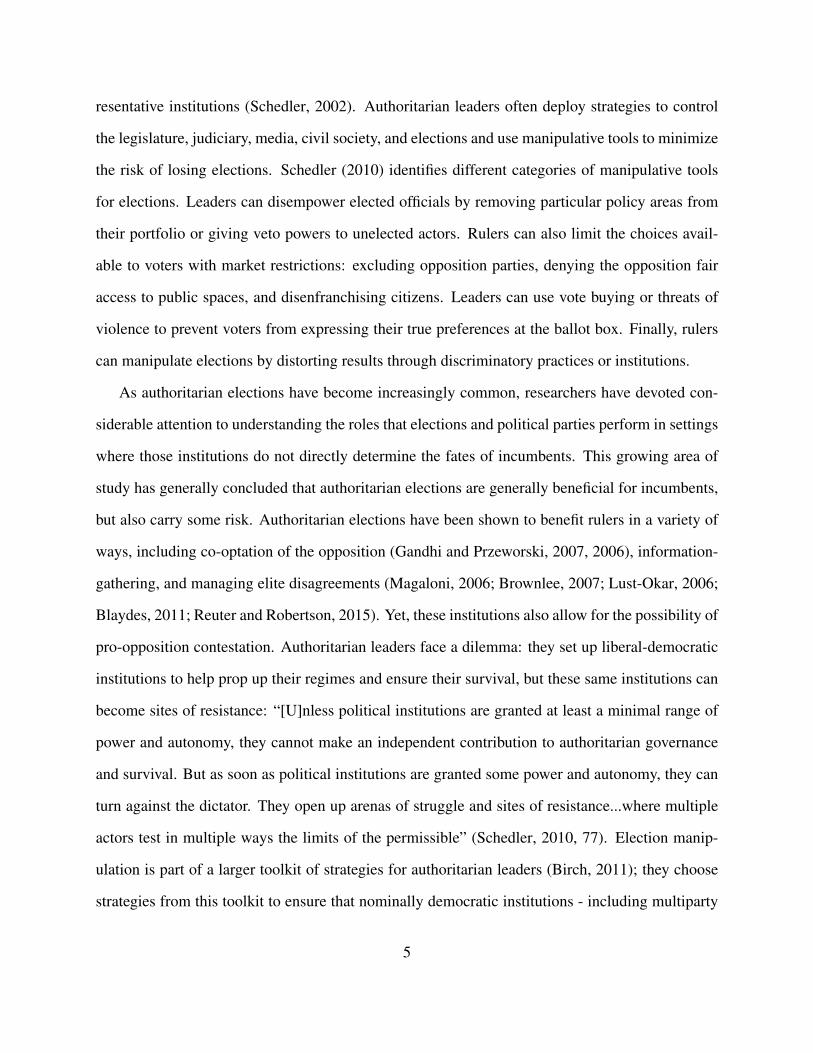
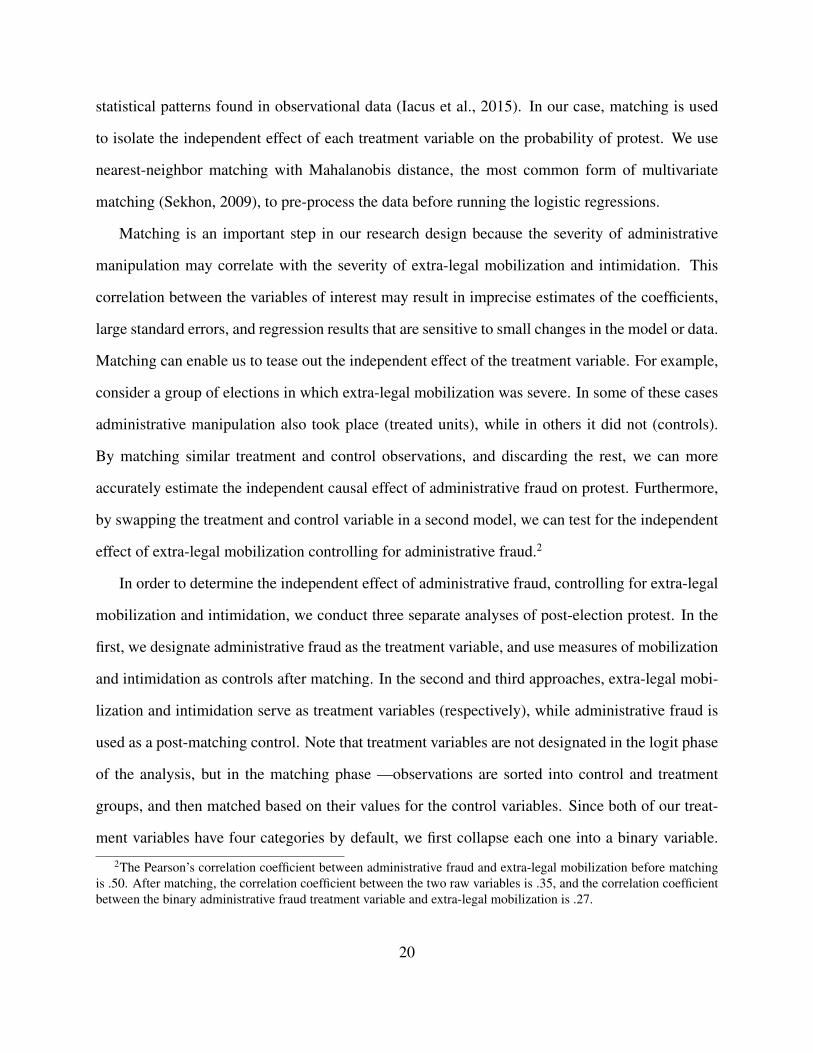
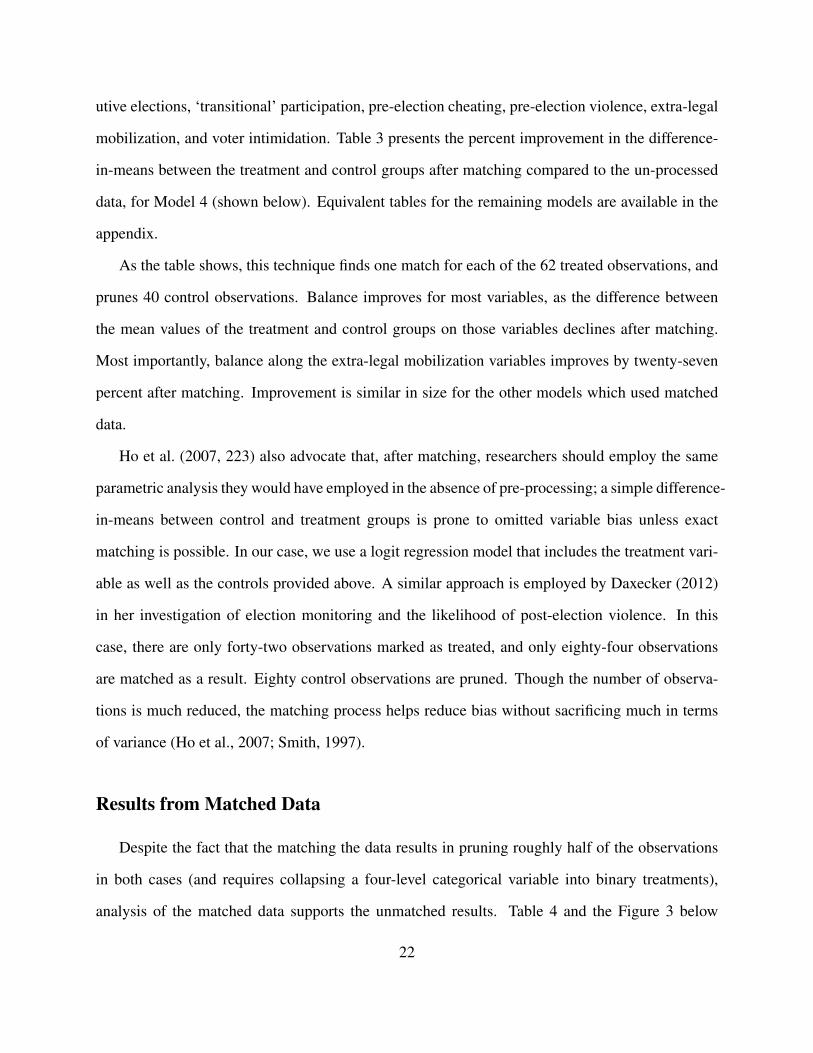
In order to better display the substantive relevance of this result, Figure 4 shows the predicted
probability of protest when the administrative fraud treatment is applied, compared to the control
condition. This analysis draws on the matched data, and holds the control variables constant at their
medians (for categorical variables) or means (for continuous variables), and assumes an executive
(or general) election. In particular, extra-legal mobilization and voter intimidation were assumed
by be minor. Though the confidence intervals on the predicted probabilities are wide, the point
estimates reveal the substantive importance of administrative fraud in provoking protest. Under
these conditions, in the absence of administrative fraud, the predicted probability of protest is
approximately fifteen percent, and the lower limit of the confidence interval is about six percent.
However, the predicted probability of protest increases when administrative fraud is employed,
rising to over forty-five percent with a confidence interval that bottoms out at twenty-five percent.
The probability of post-election protest following administrative fraud is significantly greater than
zero, an effect that other types of manipulation do not exhibit.
24
Discussion and Robustness Checks
Both the multiple imputation and matching approaches confirm our hypotheses, as does anal-
ysis of the raw data (in the appendix). That administrative fraud is found to be more likely to
provoke protest under these complementary approaches, while methods of manipulation that di-
rectly engage voters are not, increases the likelihood that the effect is real. Multiple imputation
compensates for a sizeable amount of non-random missing data, while statistical matching draws
on fewer observations but is better able to rule out potential effects of mobilization and intimi-
dation. The effect size under the matching procedure differs from those found in the unmatched
data due to the shift from categorical to binary explanatory variables, but in all cases the effect is
substantively meaningful.
These results are supportive of a broader theory of election manipulation, which holds that
political parties and governments can use their ability to influence elections to send signals of
organizational strength. Extra-legal mobilization on a large scale requires a significant investment
of resources, and shows the ability of the incumbent to mobilize people in support of the regime.
Those resources, networks, and individuals might be mobilized or demobilized during a major
protest event. By contrast, administrative fraud signals control over the electoral apparatus, and
carries little information about the resources the incumbent can deploy or the regime’s ability to
influence ordinary citizens. These signals then influence the behavior of other political actors—in
this case, by influencing the likelihood that citizens and opposition activists will engage in anti-
regime protests.
An alternative explanation for these findings could be that extra-legal mobilization transfers
some benefits to clients (via vote-buying, for example), which reduces voters’ inclination to protest.
This explanation does not involve signaling; instead, voters satisfied by the benefits of patronage
may be unmotivated to protest and unwilling to overcome the collective action problem. We find
this interpretation unlikely to be correct for two reasons. First, it is indeed possible that those
who receive clientelistic benefits will be more supportive of the party that pays them and less
25
likely to protest against that party. However, vote-buyers have no incentive to target opponents
of their party (Stokes et al., 2013) and are unlikely to target those with strong positive attitudes
toward democracy (Carlin and Moseley, 2015). These voters—opposition party supporters with
attachments to democracy —are more likely to be the constituents of a post-election protest, even
if those who received targeted benefits are satisfied. Second, our findings also hold for voter
intimidation, which would be harder to square with a hypothesis in which non-administrative forms
of electoral manipulation provide utility to voters.
Another caveat to consider is the likelihood that incumbents will rely on multiple types of
manipulation at once. Harvey (2016) finds that the Russian ruling party relied on administrative
fraud in its strongholds, but deployed mobilizational tactics elsewhere. While more research is
needed on how incumbents choose a mix of manipulation strategies, our matching approach helps
account for the issue by explicitly controlling for the level of the other forms of manipulation. As
an additional robustness check, we test an interactive hypothesis in the appendix. If our theory is
correct, we would expect that high levels of administrative fraud will be more likely to spark post-
election protest in the absence of a mobilizational effort that serves as a countervailing signal of the
ruling party’s strength. While the full results are presented in the appendix, Figure 5 illustrates the
relationship between administrative fraud and extra-legal mobilization. Increases in administrative
fraud drive the probability of protest upward for any given level of extra-legal mobilization; by
contrast, increases in mobilization push the probability of protest downward. Overall, the results
in the appendix show that, while the level of administrative fraud is the primary driver of post-
election protest, increasing levels of mobilization or intimidation reduce the size of administrative
fraud’s effect on protest.
This suggests, first, that ‘more’ manipulation does not lead to a greater likelihood of protest in
a straightforward way. Rather, more administrative fraud increases the risk of protest significantly,
while more expansive mobilizational efforts can actually reduce the risk of protest. This adds a
new dimension to Little (2012)’s argument that citizens discount electoral manipulation when eval-
26
uating the incumbent regime’s vulnerability to protest. First, our results imply that citizens more
readily discount administrative fraud, but can only partially discount mobilizational techniques,
since they demonstrate real sources of strength for the ruling party. Second, our results indicate
that regimes are most vulnerable to post-election instability when they apply administrative fraud
in the absence of a sizeable mobilization effort.
Conclusion
By considering the impact of different manipulation tactics on post-election protest, this ar-
ticle deepens our understanding of the role that electoral manipulation plays in maintaining (or
threatening) authoritarian stability. We have argued that taking manipulation tactics into account
helps explain why citizens sometimes decide to protest fraudulent elections, but often do not. Our
theory builds upon and expands the signaling model of election manipulation (Simpser, 2013), in
which authoritarian leaders manipulate elections in order to display their organizational strength
and material resources. Leaders can choose from many manipulation tactics; it is crucial that we
take into account the different costs, benefits and signals that are associated with each tactic when
evaluating the causes and effects of electoral manipulation.
In the traditional understanding of election manipulation, political parties and governments
tamper with elections in order to increase their likelihood of victory. Such attempts create an
opportunity for protest or other forms of collective action by the opposition - an opportunity that
opposition groups may seize if they are organized and united. We show that this is only part of the
story. As Simpser (2013) argues, electoral manipulation also sends signals about the organizational
capacity of the government; these signals can be read by voters, opposition activists, and wavering
elites when deciding whether to join in an anti-regime action. This study demonstrates that post-
election protest is most likely when the government’s reach exceeds its grasp; that is, when it seeks
to change the results of the election without demonstrating any organizational muscle outside the
27

context of the election administration.
We identify three categories of manipulation tactics, administrative fraud, extra-legal voter
mobilization, and voter intimidation. When the government alters the results of the election us-
ing administrative tools, it provides no additional information on te strength of the incumbent to
opposition parties and potential protesters. Such an approach communicates that the incumbents
needed administrative fraud in order to win the election, but may lack the organizational support to
counteract opposition protest. Public protest may appear like a reasonable option for overcoming
the collective action problem and confronting the regime in such circumstances. When elections
are manipulated using extra-legal mobilization or intimidation, however, opposition leaders and
potential protesters face a different calculus. When the regime has demonstrated its mobilizational
capacity in the election, taking to the streets may appear more likely to lead to violent confrontation
with the security forces or their proxies, or to clientelistic penalties for those who take part, such as
job loss. For this reason, protest is less likely in the context of such comprehensive manipulation
than when administrative fraud alone is employed.
Using data from approximately 300 elections around the world from 1980 to 2004, we find sup-
port for our hypotheses. Our results hold after analysis of the raw data, when statistical matching is
performed in order to isolate causal effects, and when multiple imputation is used to maximize the
amount of information available. The effect of manipulation tactics on protest is detectable even
when controlling for numerous other factors known to influence protest, including economic and
political factors. These findings support our theory that citizens and opposition parties respond to
the signals sent by manipulation tactics when they decide whether to protest a fraudulent election.
Consequently, we argue that the mix of tactics that incumbents use to manipulate elections is an
important cause of post-election protest (or the lack thereof), an understanding which helps explain
why some fraudulent elections lead to major social upheavals, while others do not.
These results improve our understanding of electoral manipulation and post-election protest.
They lend support to the theory that election manipulation is as much about influencing the broader
28
political environment as it is about winning elections. We also contribute to a literature on protest
against manipulated elections which emphasizes factors such as opposition unity and the resources
available to the opposition. To this, we add that opposition groups must weigh their chances in a
confrontation with the government over the outcome of the election, and do so in part by observing
the type and severity of manipulation employed. A government that has manipulated an election
by mobilizing large numbers of voters in an extra-legal way, or by deploying proxies to intimi-
date opposition voters, has displayed considerable patronage resources. The financial resources,
organizational capacity, and local knowledge necessary to manipulate the election could also be
deployed to counteract opposition protests. The revelation of this information about the strength
of the incumbent regime makes opposition groups less likely to protest, compared to elections in
which incumbents rely more heavily on cheaper administrative fraud. Future work should examine
why and when incumbents choose administrative fraud, or a mixture of administrative fraud and
extra-legal voter mobilization, instead of relying solely on extra-legal voter mobilization. It may
be the case that incumbents would prefer to use heavy-handed techniques like extra-legal voter
mobilization and manipulation, but resort to administrative fraud due to financial and organiza-
tional constraints. Studies focusing on electoral manipulation decision-making will enhance our
understanding further.
29
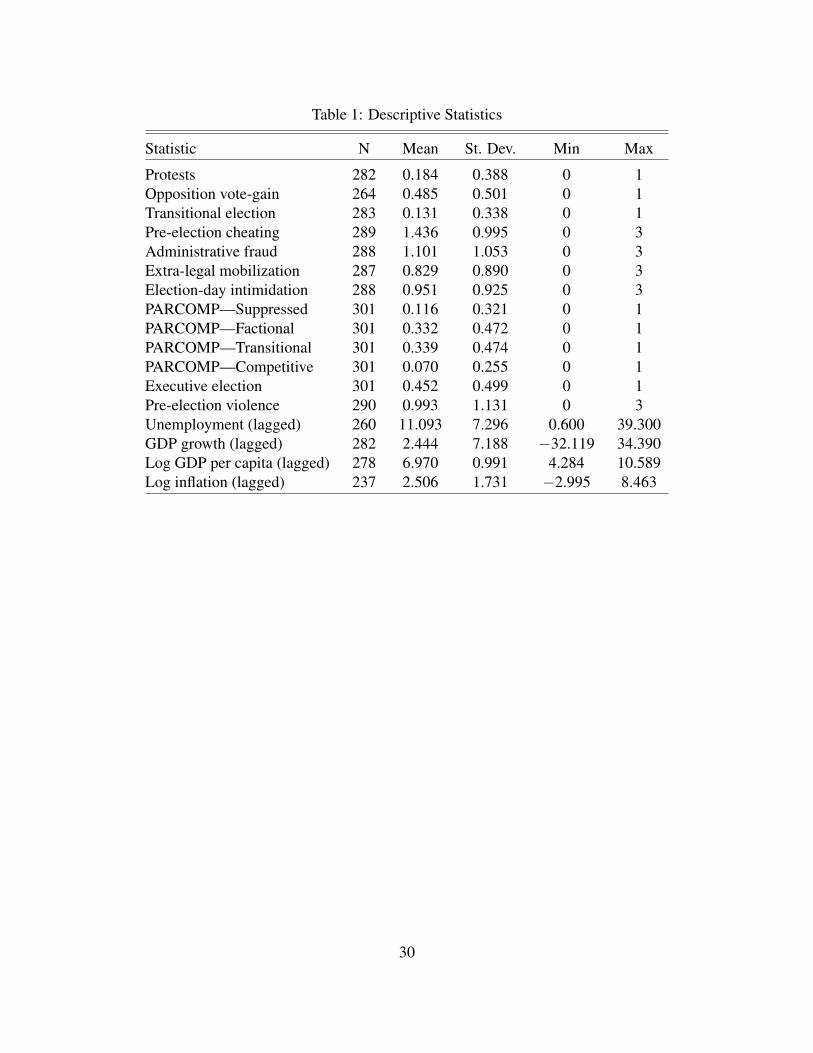
Table 1: Descriptive Statistics
Statistic N Mean St. Dev. Min Max
Protests 282 0.184 0.388 0 1Opposition vote-gain 264 0.485 0.501 0 1Transitional election 283 0.131 0.338 0 1Pre-election cheating 289 1.436 0.995 0 3Administrative fraud 288 1.101 1.053 0 3Extra-legal mobilization 287 0.829 0.890 0 3Election-day intimidation 288 0.951 0.925 0 3PARCOMP—Suppressed 301 0.116 0.321 0 1PARCOMP—Factional 301 0.332 0.472 0 1PARCOMP—Transitional 301 0.339 0.474 0 1PARCOMP—Competitive 301 0.070 0.255 0 1Executive election 301 0.452 0.499 0 1Pre-election violence 290 0.993 1.131 0 3Unemployment (lagged) 260 11.093 7.296 0.600 39.300GDP growth (lagged) 282 2.444 7.188 −32.119 34.390Log GDP per capita (lagged) 278 6.970 0.991 4.284 10.589Log inflation (lagged) 237 2.506 1.731 −2.995 8.463
30
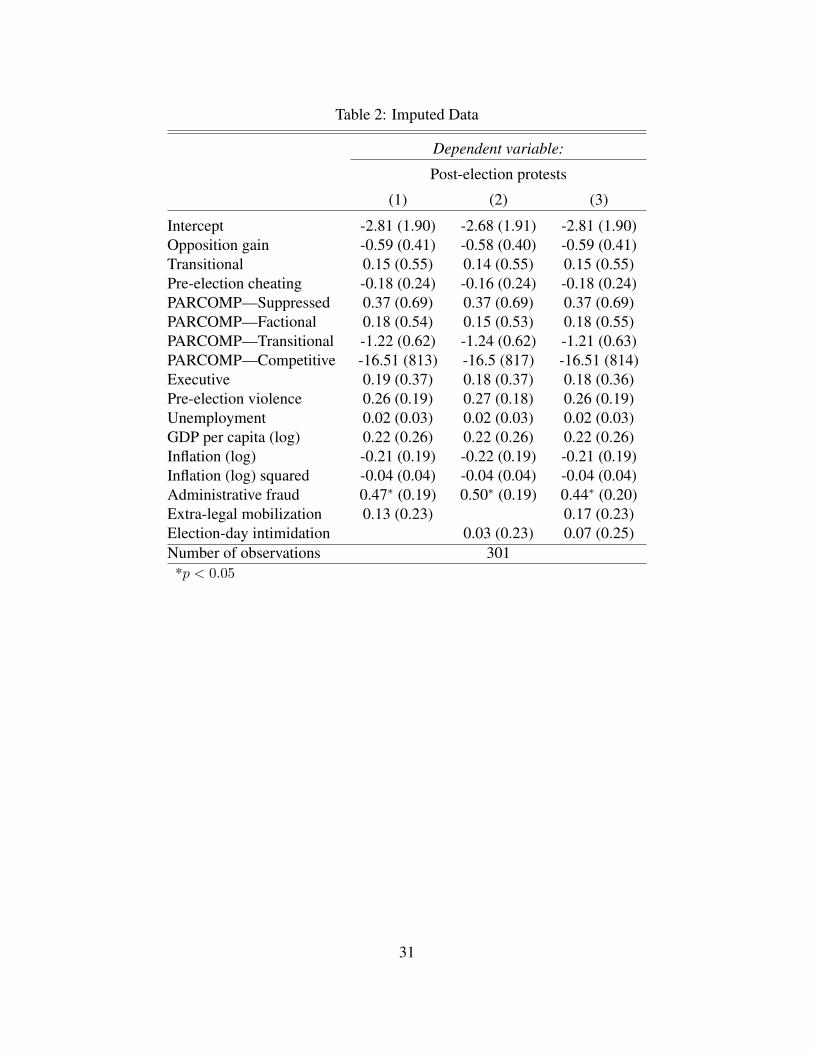
Table 2: Imputed Data
Dependent variable:
Post-election protests
(1) (2) (3)
Intercept -2.81 (1.90) -2.68 (1.91) -2.81 (1.90)Opposition gain -0.59 (0.41) -0.58 (0.40) -0.59 (0.41)Transitional 0.15 (0.55) 0.14 (0.55) 0.15 (0.55)Pre-election cheating -0.18 (0.24) -0.16 (0.24) -0.18 (0.24)PARCOMP—Suppressed 0.37 (0.69) 0.37 (0.69) 0.37 (0.69)PARCOMP—Factional 0.18 (0.54) 0.15 (0.53) 0.18 (0.55)PARCOMP—Transitional -1.22 (0.62) -1.24 (0.62) -1.21 (0.63)PARCOMP—Competitive -16.51 (813) -16.5 (817) -16.51 (814)Executive 0.19 (0.37) 0.18 (0.37) 0.18 (0.36)Pre-election violence 0.26 (0.19) 0.27 (0.18) 0.26 (0.19)Unemployment 0.02 (0.03) 0.02 (0.03) 0.02 (0.03)GDP per capita (log) 0.22 (0.26) 0.22 (0.26) 0.22 (0.26)Inflation (log) -0.21 (0.19) -0.22 (0.19) -0.21 (0.19)Inflation (log) squared -0.04 (0.04) -0.04 (0.04) -0.04 (0.04)Administrative fraud 0.47∗ (0.19) 0.50∗ (0.19) 0.44∗ (0.20)Extra-legal mobilization 0.13 (0.23) 0.17 (0.23)Election-day intimidation 0.03 (0.23) 0.07 (0.25)Number of observations 301
*p < 0.05
31
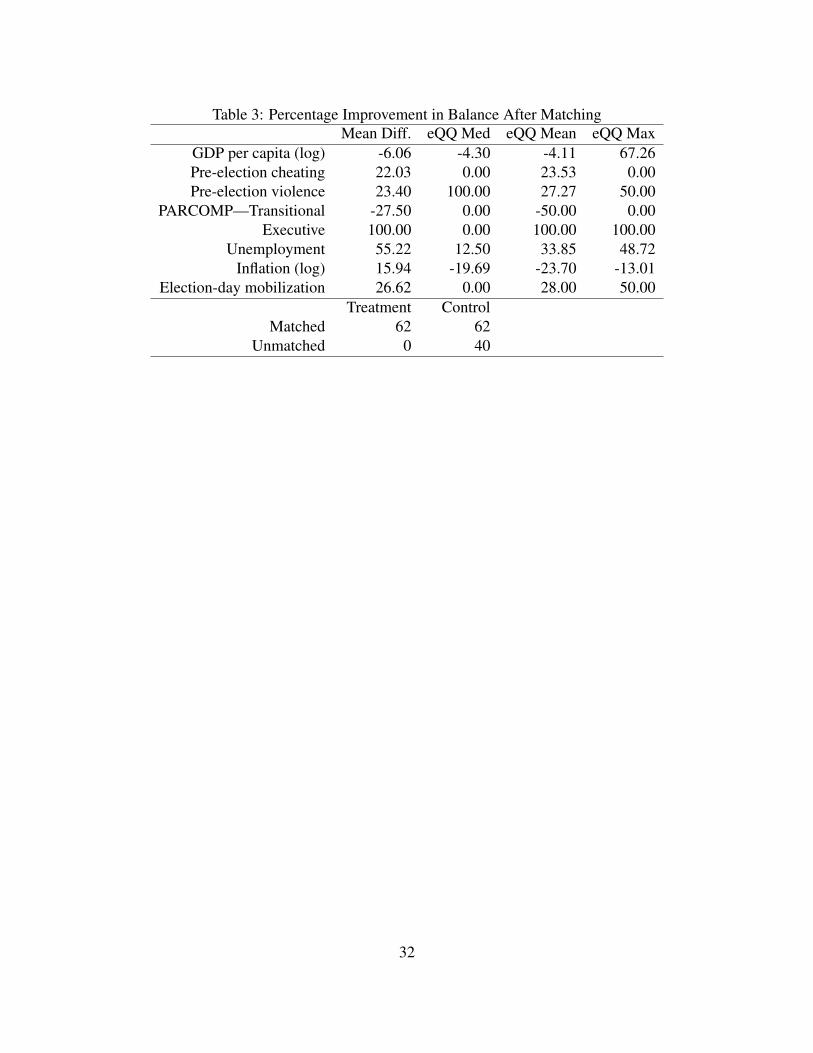
Table 3: Percentage Improvement in Balance After MatchingMean Diff. eQQ Med eQQ Mean eQQ Max
GDP per capita (log) -6.06 -4.30 -4.11 67.26Pre-election cheating 22.03 0.00 23.53 0.00Pre-election violence 23.40 100.00 27.27 50.00
PARCOMP—Transitional -27.50 0.00 -50.00 0.00Executive 100.00 0.00 100.00 100.00
Unemployment 55.22 12.50 33.85 48.72Inflation (log) 15.94 -19.69 -23.70 -13.01
Election-day mobilization 26.62 0.00 28.00 50.00Treatment Control
Matched 62 62Unmatched 0 40
32

Table 4: Matched Data
Dependent variable:
Post-election protest
(4) (5) (6) (7) (8)
Administrative fraud (binary) 1.463∗∗ 1.328∗ 1.330∗
(0.657) (0.685) (0.715)Extra-legal mobilization (binary) 0.367
(0.681)Election-day intimidation (binary) 0.144
(0.706)Administrative fraud (control) 0.950∗∗ 0.878∗∗
(0.453) (0.380)Extra-legal mobilization (control) −0.075 −0.004 −0.151
(0.307) (0.331) (0.350)Election-day intimidation (control) −0.269 −0.183 −0.783
(0.386) (0.413) (0.511)GDP per capita (log) −0.015 −0.111 0.207 0.015 1.050∗∗
(0.406) (0.398) (0.445) (0.473) (0.451)Pre-election cheating 0.259 −0.076 0.007 0.082 −0.410
(0.421) (0.420) (0.438) (0.523) (0.451)Pre-election violence 0.450 0.526∗ 0.570∗∗ 0.534∗ 0.748∗∗
(0.274) (0.270) (0.276) (0.309) (0.309)PARCOMP—Suppressed 0.128 0.201 0.478 −0.803 0.919
(1.129) (1.049) (1.103) (1.246) (1.200)PARCOMP—Factional 0.121 0.044 0.227 0.892 −0.001
(0.944) (0.845) (0.911) (1.161) (1.038)PARCOMP—Transitional −1.476 −2.076∗∗ −1.943∗ −1.458 −2.032∗
(0.988) (0.933) (1.016) (1.155) (1.130)Executive 1.386∗∗ 0.989∗ 0.999∗ 0.808 0.947∗
(0.609) (0.576) (0.584) (0.643) (0.564)Transitional 0.807 1.027 1.485 1.397 1.465
(0.959) (0.898) (0.967) (1.074) (0.906)Opposition gain 0.616 −0.123 −0.245 −0.785 −0.558
(0.703) (0.641) (0.680) (0.817) (0.703)Unemployment 0.001 0.034 0.032 −0.172∗∗ 0.007
(0.039) (0.042) (0.042) (0.083) (0.041)Inflation (log) −0.330 −0.329 −0.360 0.152 −0.405
(0.241) (0.261) (0.268) (0.390) (0.270)Inflation (log) squared 0.00000 −0.016 0.001 −0.063 −0.006
(0.056) (0.061) (0.057) (0.080) (0.056)Constant −3.093 −1.032 −3.751 −1.324 −9.327∗∗∗
(3.172) (2.963) (3.439) (3.605) (3.591)
Observations 124 124 124 84 120Akaike Inf. Crit. 124.917 128.392 126.162 106.764 125.052
Note: ∗p<0.1; ∗∗p<0.05; ∗∗∗p<0.01
33
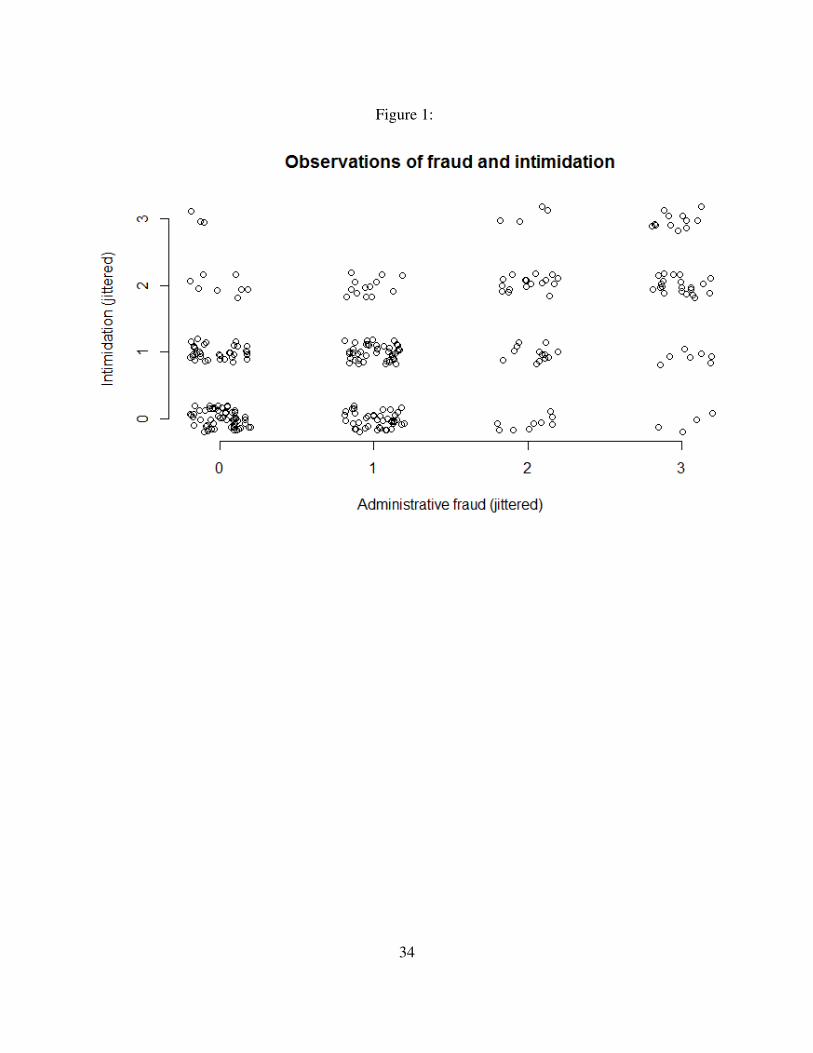
Figure 1:
34
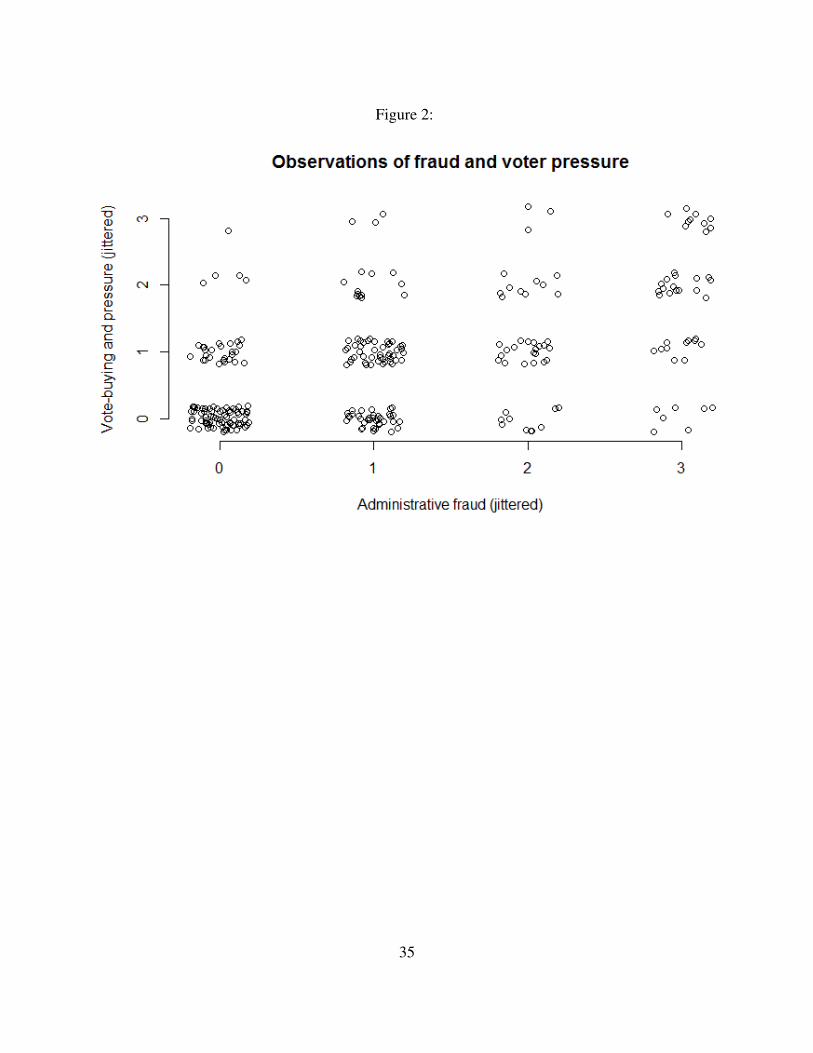
Figure 2:
35
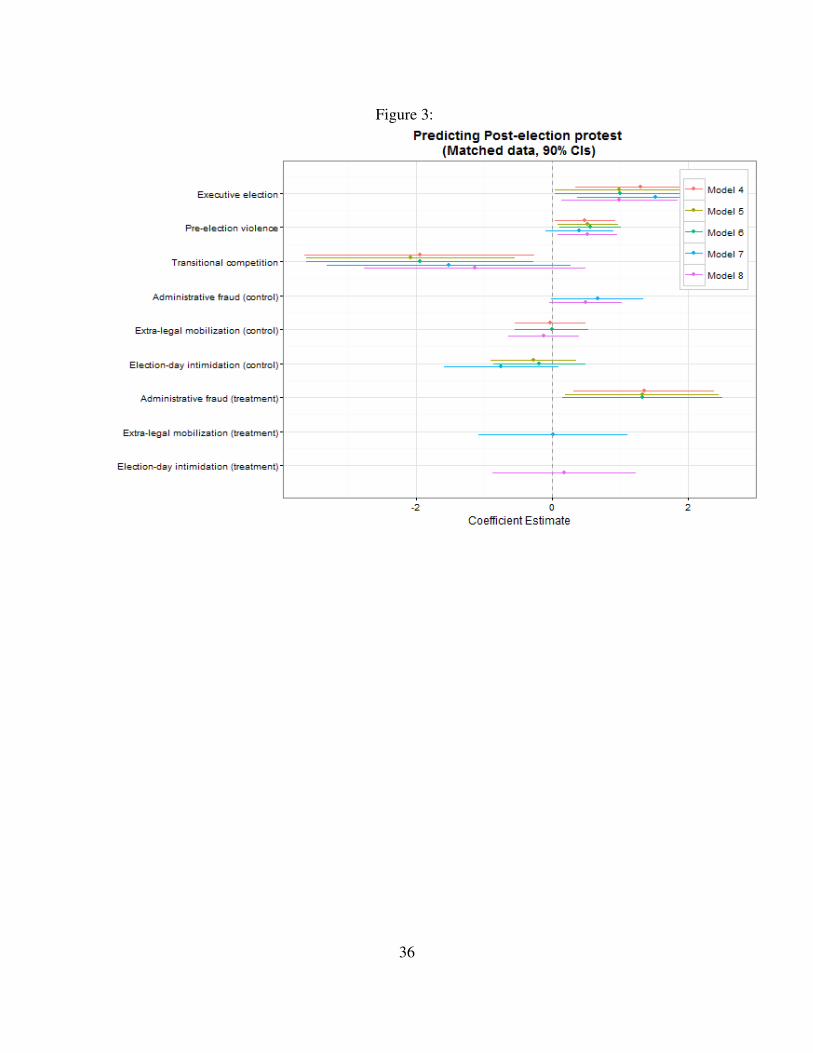
Figure 3:
36
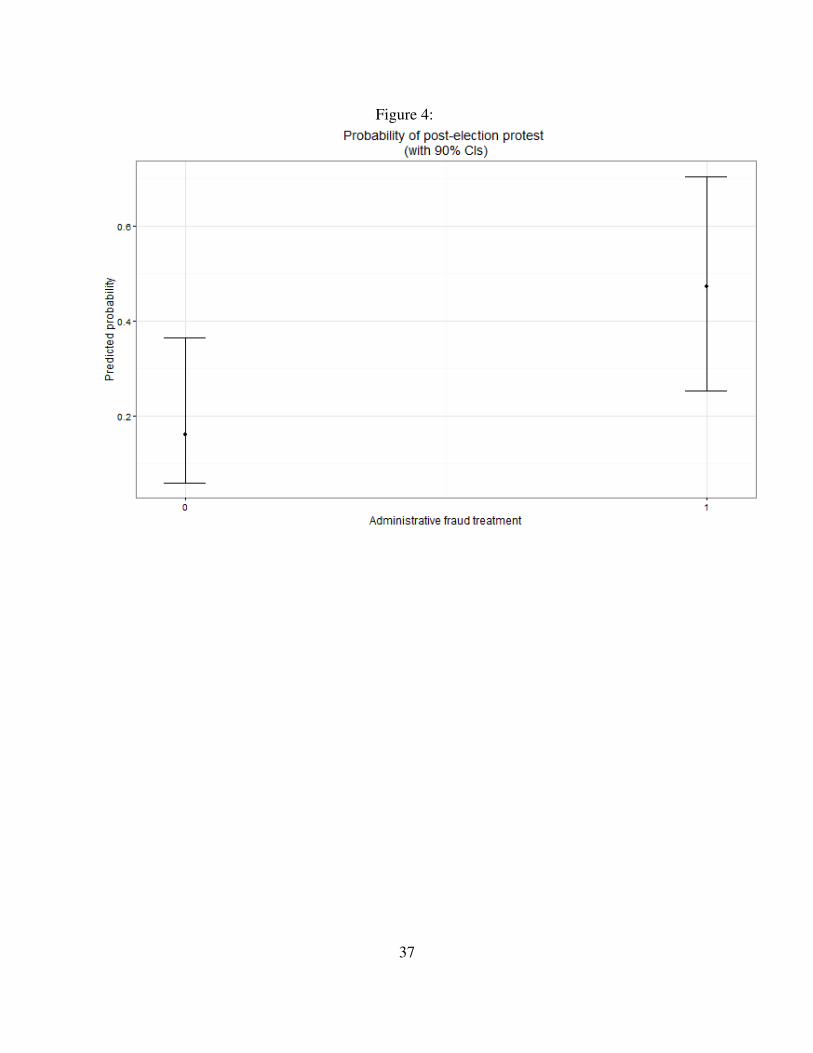
Figure 4:
37

Figure 5:
38
References
Auyero, J. (2007). Routine Politics and Violence in Argentina: The Gray Zone of State Power.
Cambridge University Press.
Auyero, J., Lapegna, P., and Poma, F. P. (2009). Patronage politics and contentious collective
action: A recursive relationship. Latin American Politics and Society, 51(3):1–31.
Bader, M. (2012). OSCE electoral assistance and the role of election commissions. Security &
Human Rights, 23(1):19–29.
Beissinger, M. R. (2007). Structure and Example in Modular Political Phenomena: The Diffusion
of Bulldozer/Rose/Orange/Tulip Revolutions. Perspectives on Politics, 5(2):259–276.
Birch, S. (2011). Electoral Malpractice. Oxford University Press, Oxford ;New York.
Blaydes, L. (2011). Elections and Distributive Politics in Mubarak’s Egypt. Cambridge University
Press.
Bratton, M. (2008). Vote buying and violence in nigerian election campaigns. Electoral Studies,
27(4):621 – 632.
Brownlee, J. (2007). Authoritarianism in an Age of Democratization. Cambridge University Press.
Brownlee, J. (2009). Portents of Pluralism: How Hybrid Regimes Affect Democratic Transitions.
American Journal of Political Science, 53(3):515–532.
Bunce, V. and Wolchik, S. (2010). Defeating dictators: Electoral change and stability in competi-
tive authoritarian regimes. World Politics, 62(1):43–86.
Calingaert, D. (2006). Election Rigging and How to Fight It. Journal of Democracy, 17(3):138–
151.
39

Carlin, R. E. and Moseley, M. (2015). Good Democrats, Bad Targets: Democratic Values and
Clientelistic Vote Buying. The Journal of Politics, 77(1):14–26.
Carothers, T. (2002). The End of the Transition Paradigm. Journal of Democracy, 13(1):5–21.
Chernykh, S. (2014). When Do Political Parties Protest Election Results? Comparative Political
Studies, 47(10):1359–1383.
Chong, D. (1991). Collective Action and the Civil Rights Movement. University of Chicago.
Collier, P. and Vicente, P. C. (2012). Violence, bribery, and fraud: The political economy of
elections in sub-saharan africa. Public Choice, 153(1/2):117–147.
Daxecker, U. E. (2012). The cost of exposing cheating: International election monitoring, fraud,
and post-election violence in Africa. Journal of Peace Research, 49(4):503–516.
Diamond, L. (2002). Thinking about Hybrid Regimes. Journal of Democracy, 13(2):21–35.
Diamond, L., Linz, J. J., and Lipset, S. M. (1989). Democracy in Developing Countries: Latin
America. Lynne Rienner.
Fearon, J. (2011). Self-Enforcing Democracy. The Quarterly Journal of Economics, 126(4):1661–
1708.
Fortin-Rittberger, J. (2014). The role of infrastructural and coercive state capacity in explaining
different types of electoral fraud. Democratization, 21(1):95–117.
Frye, T., Reuter, O. J., and Szakonyi, D. S. (2014). Political Machines at Work: Voter Mobilization
and Electoral Subversion in the Workplace. World Politics, 66(2).
Gandhi, J. and Przeworski, A. (2006). Cooperation, cooptation, and rebellion under dictatorships.
Economics & Politics, 18(1):1–26.
40

Gandhi, J. and Przeworski, A. (2007). Authoritarian Institutions and the Survival of Autocrats.
Comparative Political Studies, 40(11):1279–1301.
Gans-Morse, J., Mazzuca, S., and Nichter, S. (2014). Varieties of Clientelism: Machine Politics
during Elections. American Journal of Political Science, 58(2):415–432.
Golos (2012). Analytical report of the golos association on the december 4, 2011 elections.
http://archive.golos.org/asset/5878.
Greene, K. F. (2007). Why Dominant Parties Lose: Mexico’s Democratization in Comparative
Perspective. Cambridge University Press.
Hale, H. E. (2014). Patronal Politics. Cambridge University Press.
Harvey, C. J. (2016). Changes in the menu of manipulation: Electoral fraud, ballot stuffing, and
voter pressure in the 2011 russian election. Electoral Studies, 41:105 – 117.
Ho, D., Imai, K., King, G., and Stuart, E. (2007). Matching as Nonparametric Preprocessing for
Reducing Model Dependence in Parametric Causal Inference. Political Analysis, 15:199–236.
Holzner, C. A. (2007). The poverty of democracy: Neoliberal reforms and political participation
of the poor in Mexico. Latin American Politics and Society, 49(2):87–122.
Honaker, J. and King, G. (2010). What to do About Missing Values in Time Series Cross-Section
Data. American Journal of Political Science, 54(3):561–581.
Howard, M. M. and Roessler, P. G. (2006). Liberalizing Electoral Outcomes in Competitive Au-
thoritarian Regimes. American Journal of Political Science, 50(2):365–381.
Hyde, S. and Marinov, N. (2012). Which Elections Can Be Lost? Political Analysis, 20(2):191–
210.
41
Hyde, S. and Marinov, N. (2014). Information and self-enforcing democracy: The role of interna-
tional election observation. International Organization, 68:329–359.
Hyde, S. D. (2011). Catch Us If You Can: Election Monitoring and International Norm Diffusion.
American Journal of Political Science, 55(2):356–369.
Iacus, S., King, G., and Porro, G. (2015). A Theory of Statistical Inference for Matching Meth-
ods in Applied Causal Research. URL: http://gking.harvard.edu/publications/how-Coarsening-
Simplifies-Matching-Based-Causal-Inference-Theory.
Kalyvas, S. N. (2003). The ontology of political violence: Action and identity in civil wars.
Perspectives on Politics, 1:475–494.
Kelley, J. (2011). Data on International Election Monitoring: Three Global Datasets on Election
Quality, Election Events and International Election Observation: Version 1. Technical report.
Kelley, J. G. (2012). Monitoring Democracy : When International Election Observation Works,
and Why It Often Fails. Princeton University Press, Princeton, NJ, USA.
King, G., Honaker, J., Jospeh, A., and Scheve, K. (2001). Analyzing incomplete political science
data: An alternative algorithm for multiple imputation. American Political Science Review,
95(1).
Kitschelt, H. and Wilkinson, S. I. (2007). Patrons, Clients and Policies: Patterns of Democratic
Accountability and Political Competition. Cambridge University Press.
Knoke, D. (1990). Networks of political action: Toward theory construction. Social forces,
68(4):1041–1063.
Kovalov, M. (2014). Electoral Manipulations and Fraud in Parliamentary Elections The Case of
Ukraine. East European Politics & Societies, 28(4):781–807.
42
Kuntz, P. and Thompson, M. R. (2009). More than just the final straw: Stolen elections as revolu-
tionary triggers. Comparative Politics, 41(3):253–272.
Kuran, T. (1989). Sparks and prairie fires: A theory of unanticipated political revolution. Public
Choice, 61(1):41–74.
Lazar, S. (2007). El Alto, Rebel City: Self and Citizenship in Andean Bolivia. Duke University
Press.
Lehoucq, F. (2003). Electoral Fraud: Causes, Types, and Consequences. Annual Review of Political
Science, 6:233–256.
Lehoucq, F. (2007). When does a market for votes emerge? In FC Schaffer, editor, Elections for
Sale: The Causes and Consequences of Vote Buying, pages 33–45. Lynne Rienner Publishers.
Lehoucq, F. and Molina, I. (2002). Stuffing the Ballot Box: Fraud, Electoral Reform, and Democ-
ratization in Costa Rica. Cambridge University Press.
Levitsky, S. and Way, L. (2010). Competitive Authoritarianism: Hybrid Regimes After the Cold
War. Cambridge University Press.
Levitsky, S. and Way, L. A. (2002). The Rise of Competitive Authoritarianism. Journal of Democ-
racy, 13(2):51–65.
Little, A. T. (2012). Elections, fraud, and election monitoring in the shadow of revolution. Quar-
terly Journal of Political Science, 7(3):249–283.
Lust-Okar, E. (2006). Elections under authoritarianism: Preliminary lessons from Jordan. Democ-
ratization, 13(3):456–471.
Magaloni, B. (2006). Voting for Autocracy: Hegemonic Party Survival and its Demise in Mexico.
Cambridge University Press.
43
Magaloni, B. (2010). The Game of Electoral Fraud and the Ousting of Authoritarian Rule. Amer-
ican Journal of Political Science, 54(3):751–765.
Marshall, M. G., Gurr, T. R., and Jaggers, K. (2014). Polity iv project: Political regime character-
istics and transitions, 1800-2013. URL: http://www.systemicpeace.org/inscrdata.html.
Nichter, S. (2008). Vote Buying or Turnout Buying? Machine Politics and the Secret Ballot.
American Political Science Review, 102(01):19–31.
Ottaway, M. (2003). Democracy Challenged: The Rise of Semi-Authoritarianism. Carnegie En-
dowment for International Peace.
Popova, M. (2006). Watchdogs or attack dogs? The role of the Russian courts and the central
election commission in the resolution of electoral disputes. Europe-Asia Studies, 58(3):391–
414.
Reuter, O. J. and Robertson, G. B. (2015). Legislatures, Cooptation, and Social Protest in Contem-
porary Authoritarian Regimes. The Journal of Politics, 77(1):235–248.
Robertson, G. B. (2010). The Politics of Protest in Hybrid Regimes: Managing Dissent in Post-
Communist Russia. Cambridge University Press.
Rubin, D. B. (2004). Multiple Imputation for Nonresponse in Surveys. John Wiley & Sons.
Rundlett, A. and Svolik, M. W. (2016). Deliver the Vote! Micromotives and Macrobehavior in
Electoral Fraud. American Political Science Review, 110:180–197.
Schedler, A. (2002). The Menu of Manipulation. Journal of Democracy, 13(2):36–50.
Schedler, A. (2010). Authoritarianism’s Last Line of Defense. Journal of Democracy, 21(1):69–
80.
Schelling, T. C. (1960). The Strategy of Conflict. Harvard University Press.
44
Sekhon, J. S. (2009). Opiates for the matches: Matching methods for causal inference. Annual
Review of Political Science, 12:487–508.
Simpser, A. (2013). Why Governments and Parties Manipulate Elections: Theory, Practice, and
Implications. Cambridge University Press.
Simpser, A. and Donno, D. (2012). Can International Election Monitoring Harm Governance? The
Journal of Politics, 74(02):501–513.
Sjoberg, F. M. (2013). Autocratic adaptation : The strategic use of transparency and the persistence
of election fraud. Electoral Studies, pages 1–13.
Smith, H. L. (1997). Matching with multiple controls to estimate treatment effects in observational
studies. Sociological Methodology, 27(1):325–353.
Stokes, S. C. (2005). Perverse Accountability: A Formal Model of Machine Politics with Evidence
from Argentina. American Political Science Review, 99(03):315–325.
Stokes, S. C., Dunning, T., Nazareno, M., and Brusco, V. (2013). Brokers, Voters, and Clientelism:
The Puzzle of Distributive Politics. Cambridge University Press.
Stuart, E. A. (2010). Matching Methods for Causal Inference: A Review and a Look Forward.
Statistical Science, 25(1):1–21.
Trejo, G. (2014). The Ballot and the Street: An Electoral Theory of Social Protest in Autocracies.
Perspectives on Politics, 12(2):332–352.
Tucker, J. (2007). Enough! Electoral Fraud, Collective Action Problems, and Post-Communist
Colored Revolutions. Perspectives on Politics, 5(3):535–551.
Wang, C.-S. and Kurzman, C. (2007). Dilemmas of electoral clientelism: Taiwan, 1993. Interna-
tional Political Science Review, 28(2):225–245.
45
Weingast, B. R. (1997). The Political Foundations of Democracy and the Rule of Law. American
Political Science Review, 91(2):245–263.
Wilkinson, S. (2006). Votes and Violence: Electoral Competition and Ethnic Riots in India. Cam-
bridge Studies in Comparative Politics. Cambridge University Press.
World Bank (2014). World Bank Development Indicators. URL:
http://data.worldbank.org/indicator.
Ziblatt, D. (2009). Shaping Democratic Practice and the Causes of Electoral Fraud: The Case of
Nineteenth-Century Germany. American Political Science Review, 103(1).
46
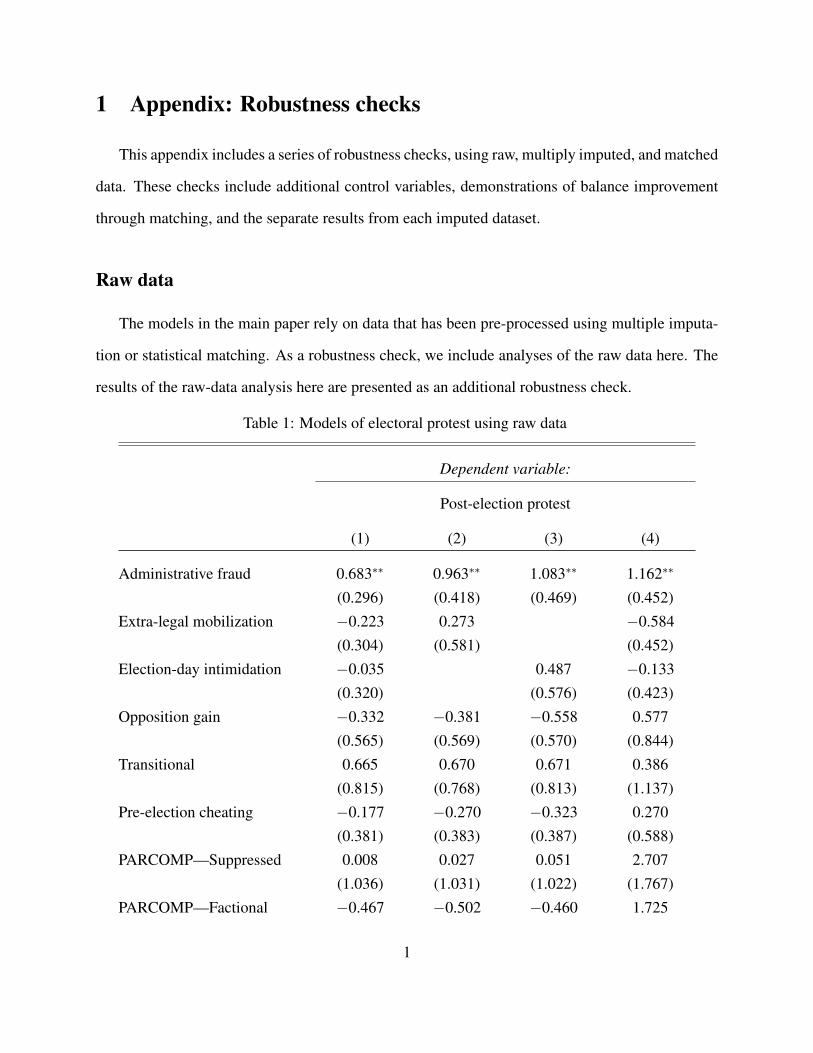
1 Appendix: Robustness checks
This appendix includes a series of robustness checks, using raw, multiply imputed, and matched
data. These checks include additional control variables, demonstrations of balance improvement
through matching, and the separate results from each imputed dataset.
Raw data
The models in the main paper rely on data that has been pre-processed using multiple imputa-
tion or statistical matching. As a robustness check, we include analyses of the raw data here. The
results of the raw-data analysis here are presented as an additional robustness check.
Table 1: Models of electoral protest using raw data
Dependent variable:
Post-election protest
(1) (2) (3) (4)
Administrative fraud 0.683∗∗ 0.963∗∗ 1.083∗∗ 1.162∗∗
(0.296) (0.418) (0.469) (0.452)Extra-legal mobilization −0.223 0.273 −0.584
(0.304) (0.581) (0.452)Election-day intimidation −0.035 0.487 −0.133
(0.320) (0.576) (0.423)Opposition gain −0.332 −0.381 −0.558 0.577
(0.565) (0.569) (0.570) (0.844)Transitional 0.665 0.670 0.671 0.386
(0.815) (0.768) (0.813) (1.137)Pre-election cheating −0.177 −0.270 −0.323 0.270
(0.381) (0.383) (0.387) (0.588)PARCOMP—Suppressed 0.008 0.027 0.051 2.707
(1.036) (1.031) (1.022) (1.767)PARCOMP—Factional −0.467 −0.502 −0.460 1.725
1
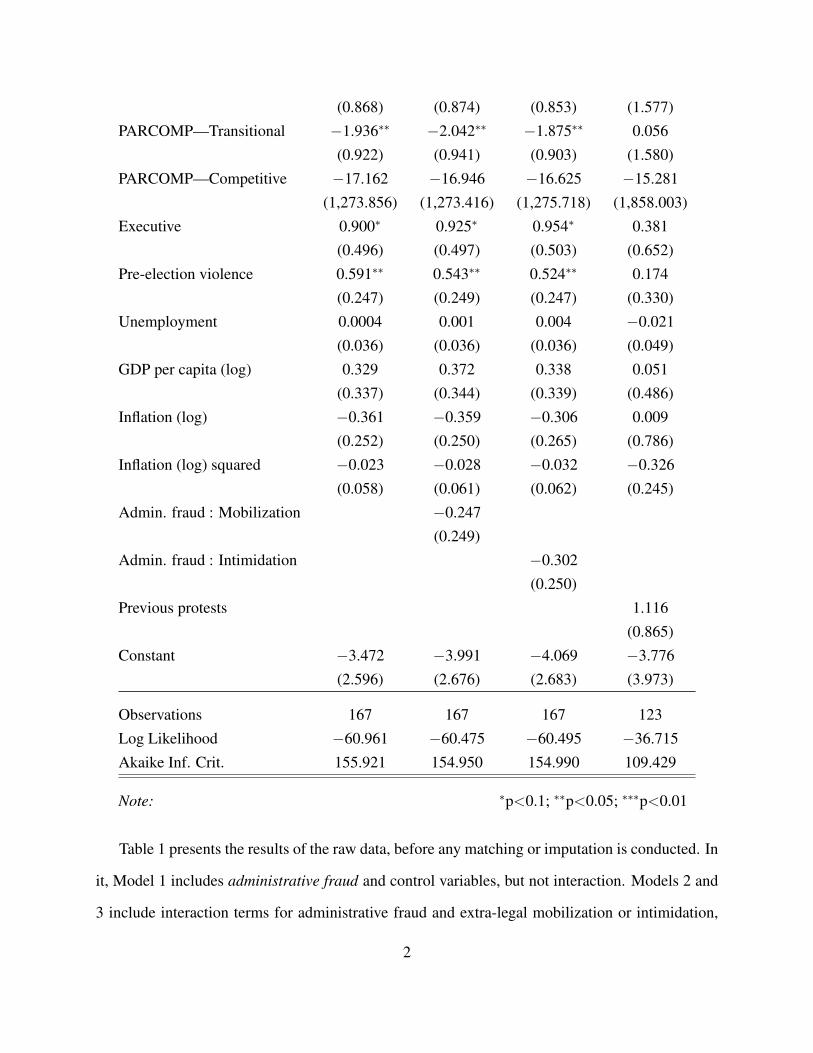
(0.868) (0.874) (0.853) (1.577)PARCOMP—Transitional −1.936∗∗ −2.042∗∗ −1.875∗∗ 0.056
(0.922) (0.941) (0.903) (1.580)PARCOMP—Competitive −17.162 −16.946 −16.625 −15.281
(1,273.856) (1,273.416) (1,275.718) (1,858.003)Executive 0.900∗ 0.925∗ 0.954∗ 0.381
(0.496) (0.497) (0.503) (0.652)Pre-election violence 0.591∗∗ 0.543∗∗ 0.524∗∗ 0.174
(0.247) (0.249) (0.247) (0.330)Unemployment 0.0004 0.001 0.004 −0.021
(0.036) (0.036) (0.036) (0.049)GDP per capita (log) 0.329 0.372 0.338 0.051
(0.337) (0.344) (0.339) (0.486)Inflation (log) −0.361 −0.359 −0.306 0.009
(0.252) (0.250) (0.265) (0.786)Inflation (log) squared −0.023 −0.028 −0.032 −0.326
(0.058) (0.061) (0.062) (0.245)Admin. fraud : Mobilization −0.247
(0.249)Admin. fraud : Intimidation −0.302
(0.250)Previous protests 1.116
(0.865)Constant −3.472 −3.991 −4.069 −3.776
(2.596) (2.676) (2.683) (3.973)
Observations 167 167 167 123Log Likelihood −60.961 −60.475 −60.495 −36.715Akaike Inf. Crit. 155.921 154.950 154.990 109.429
Note: ∗p<0.1; ∗∗p<0.05; ∗∗∗p<0.01
Table 1 presents the results of the raw data, before any matching or imputation is conducted. In
it, Model 1 includes administrative fraud and control variables, but not interaction. Models 2 and
3 include interaction terms for administrative fraud and extra-legal mobilization or intimidation,
2
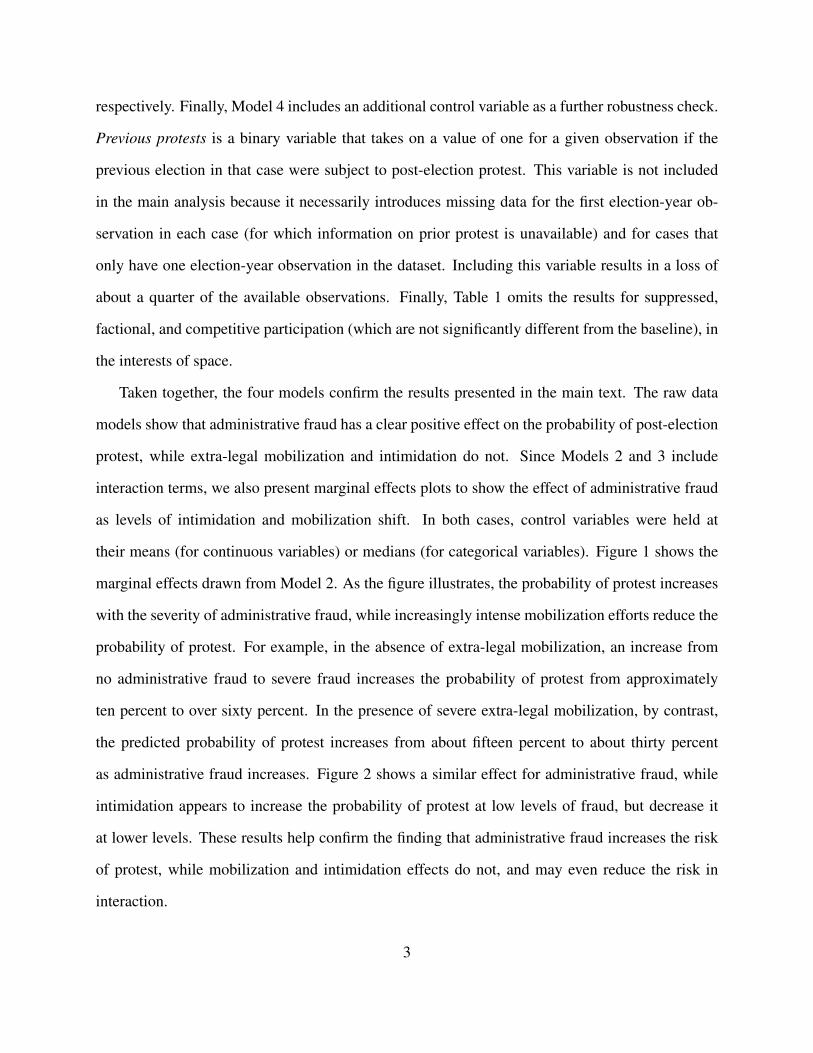
respectively. Finally, Model 4 includes an additional control variable as a further robustness check.
Previous protests is a binary variable that takes on a value of one for a given observation if the
previous election in that case were subject to post-election protest. This variable is not included
in the main analysis because it necessarily introduces missing data for the first election-year ob-
servation in each case (for which information on prior protest is unavailable) and for cases that
only have one election-year observation in the dataset. Including this variable results in a loss of
about a quarter of the available observations. Finally, Table 1 omits the results for suppressed,
factional, and competitive participation (which are not significantly different from the baseline), in
the interests of space.
Taken together, the four models confirm the results presented in the main text. The raw data
models show that administrative fraud has a clear positive effect on the probability of post-election
protest, while extra-legal mobilization and intimidation do not. Since Models 2 and 3 include
interaction terms, we also present marginal effects plots to show the effect of administrative fraud
as levels of intimidation and mobilization shift. In both cases, control variables were held at
their means (for continuous variables) or medians (for categorical variables). Figure 1 shows the
marginal effects drawn from Model 2. As the figure illustrates, the probability of protest increases
with the severity of administrative fraud, while increasingly intense mobilization efforts reduce the
probability of protest. For example, in the absence of extra-legal mobilization, an increase from
no administrative fraud to severe fraud increases the probability of protest from approximately
ten percent to over sixty percent. In the presence of severe extra-legal mobilization, by contrast,
the predicted probability of protest increases from about fifteen percent to about thirty percent
as administrative fraud increases. Figure 2 shows a similar effect for administrative fraud, while
intimidation appears to increase the probability of protest at low levels of fraud, but decrease it
at lower levels. These results help confirm the finding that administrative fraud increases the risk
of protest, while mobilization and intimidation effects do not, and may even reduce the risk in
interaction.
3

Additionally, we use the raw data to test another control variable that is not included in the
main analysis due to large amounts of missing data. Despite the availability of monitoring reports
in all our cases, and the understanding that election-manipulating parties and governments some-
times use such techniques to send visible signals of strength, we include a control variable from
NELDA which measures whether or not there were widespread public allegations of manipula-
tion following the election. We apply this variable first as a standalone control, and then as an
interaction variable with each of our three measures of electoral manipulation. As Table 2 shows,
administrative fraud retains its significant and positive effect in all models except Model 7, while
mobilization and intimidation have no significant effect.
Table 2: Analysis of raw data using allegations of manipula-tion
Dependent variable:
Post-election protests
(5) (6) (7) (8)
Administrative fraud 0.846∗∗ 1.565∗∗ 0.691∗ 0.810∗∗
(0.401) (0.685) (0.405) (0.397)Extra-legal mobilization −0.312 −0.381 0.431 −0.270
(0.404) (0.402) (0.785) (0.404)Election-day intimidation −0.405 −0.392 −0.308 0.109
(0.450) (0.450) (0.452) (0.768)Opposition gain 0.817 0.828 0.464 0.564
(0.811) (0.854) (0.889) (0.869)Transitional 1.945∗ 2.078∗ 1.749 2.063∗
(1.040) (1.084) (1.071) (1.079)Pre-election cheating −0.252 −0.225 −0.365 −0.293
(0.521) (0.539) (0.536) (0.521)PARCOMP—Suppressed 2.113 2.211 2.118 2.129
(1.396) (1.394) (1.402) (1.399)PARCOMP—Factional 1.885 1.962 1.870 1.801
4
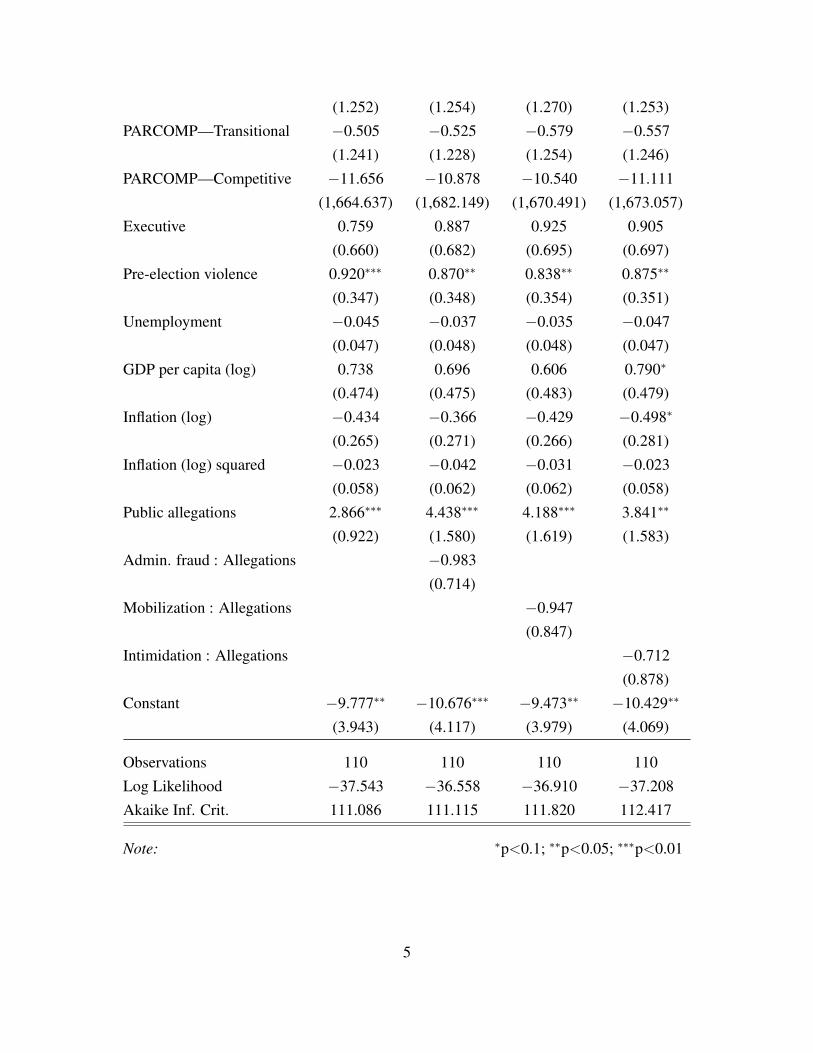
(1.252) (1.254) (1.270) (1.253)PARCOMP—Transitional −0.505 −0.525 −0.579 −0.557
(1.241) (1.228) (1.254) (1.246)PARCOMP—Competitive −11.656 −10.878 −10.540 −11.111
(1,664.637) (1,682.149) (1,670.491) (1,673.057)Executive 0.759 0.887 0.925 0.905
(0.660) (0.682) (0.695) (0.697)Pre-election violence 0.920∗∗∗ 0.870∗∗ 0.838∗∗ 0.875∗∗
(0.347) (0.348) (0.354) (0.351)Unemployment −0.045 −0.037 −0.035 −0.047
(0.047) (0.048) (0.048) (0.047)GDP per capita (log) 0.738 0.696 0.606 0.790∗
(0.474) (0.475) (0.483) (0.479)Inflation (log) −0.434 −0.366 −0.429 −0.498∗
(0.265) (0.271) (0.266) (0.281)Inflation (log) squared −0.023 −0.042 −0.031 −0.023
(0.058) (0.062) (0.062) (0.058)Public allegations 2.866∗∗∗ 4.438∗∗∗ 4.188∗∗∗ 3.841∗∗
(0.922) (1.580) (1.619) (1.583)Admin. fraud : Allegations −0.983
(0.714)Mobilization : Allegations −0.947
(0.847)Intimidation : Allegations −0.712
(0.878)Constant −9.777∗∗ −10.676∗∗∗ −9.473∗∗ −10.429∗∗
(3.943) (4.117) (3.979) (4.069)
Observations 110 110 110 110Log Likelihood −37.543 −36.558 −36.910 −37.208Akaike Inf. Crit. 111.086 111.115 111.820 112.417
Note: ∗p<0.1; ∗∗p<0.05; ∗∗∗p<0.01
5
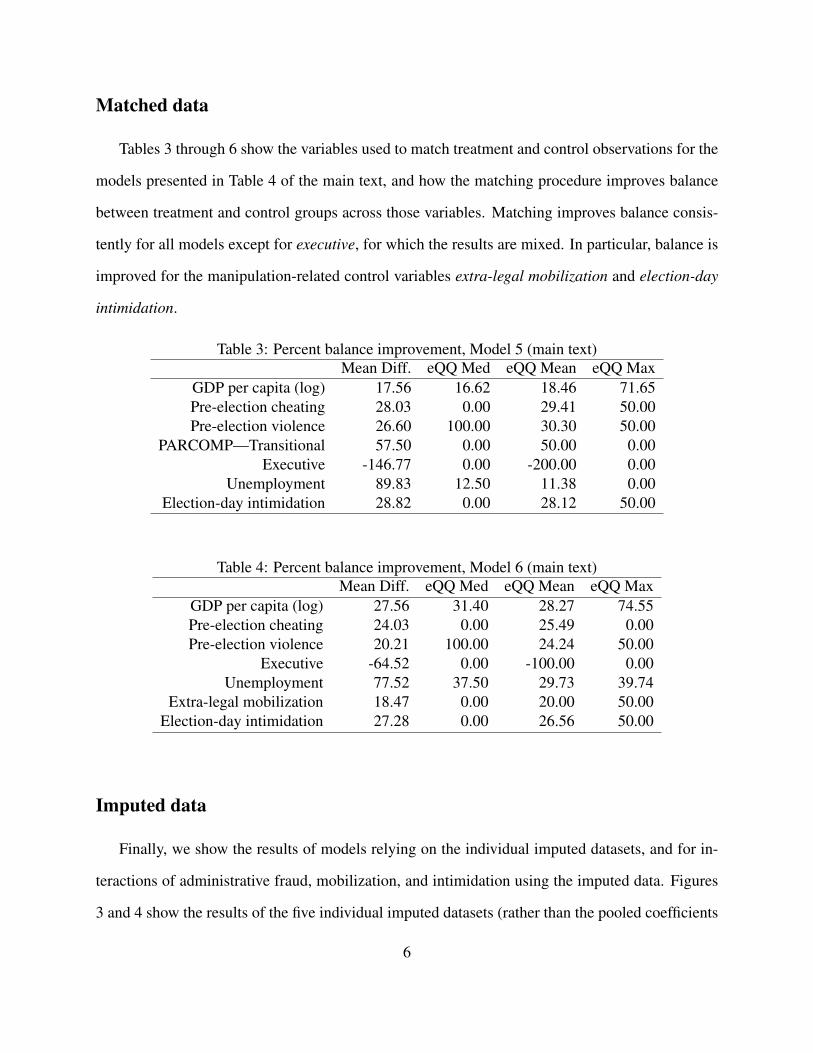
Matched data
Tables 3 through 6 show the variables used to match treatment and control observations for the
models presented in Table 4 of the main text, and how the matching procedure improves balance
between treatment and control groups across those variables. Matching improves balance consis-
tently for all models except for executive, for which the results are mixed. In particular, balance is
improved for the manipulation-related control variables extra-legal mobilization and election-day
intimidation.
Table 3: Percent balance improvement, Model 5 (main text)Mean Diff. eQQ Med eQQ Mean eQQ Max
GDP per capita (log) 17.56 16.62 18.46 71.65Pre-election cheating 28.03 0.00 29.41 50.00Pre-election violence 26.60 100.00 30.30 50.00
PARCOMP—Transitional 57.50 0.00 50.00 0.00Executive -146.77 0.00 -200.00 0.00
Unemployment 89.83 12.50 11.38 0.00Election-day intimidation 28.82 0.00 28.12 50.00
Table 4: Percent balance improvement, Model 6 (main text)Mean Diff. eQQ Med eQQ Mean eQQ Max
GDP per capita (log) 27.56 31.40 28.27 74.55Pre-election cheating 24.03 0.00 25.49 0.00Pre-election violence 20.21 100.00 24.24 50.00
Executive -64.52 0.00 -100.00 0.00Unemployment 77.52 37.50 29.73 39.74
Extra-legal mobilization 18.47 0.00 20.00 50.00Election-day intimidation 27.28 0.00 26.56 50.00
Imputed data
Finally, we show the results of models relying on the individual imputed datasets, and for in-
teractions of administrative fraud, mobilization, and intimidation using the imputed data. Figures
3 and 4 show the results of the five individual imputed datasets (rather than the pooled coefficients
6
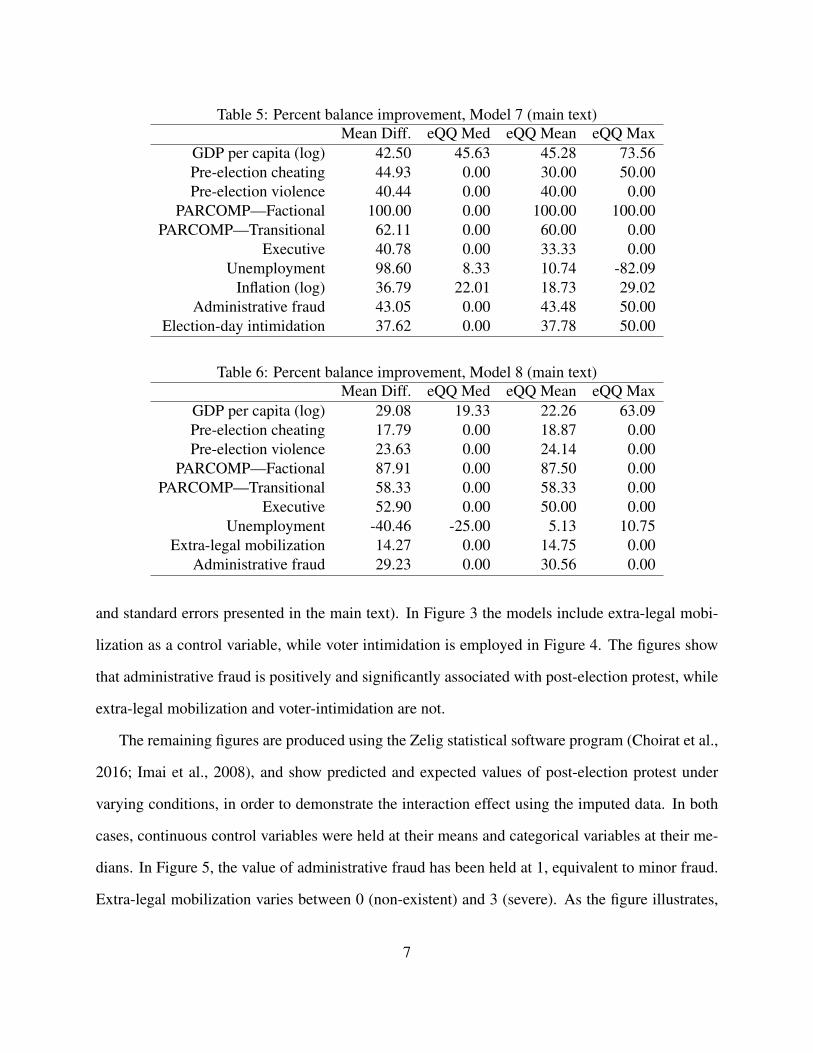
Table 5: Percent balance improvement, Model 7 (main text)Mean Diff. eQQ Med eQQ Mean eQQ Max
GDP per capita (log) 42.50 45.63 45.28 73.56Pre-election cheating 44.93 0.00 30.00 50.00Pre-election violence 40.44 0.00 40.00 0.00
PARCOMP—Factional 100.00 0.00 100.00 100.00PARCOMP—Transitional 62.11 0.00 60.00 0.00
Executive 40.78 0.00 33.33 0.00Unemployment 98.60 8.33 10.74 -82.09
Inflation (log) 36.79 22.01 18.73 29.02Administrative fraud 43.05 0.00 43.48 50.00
Election-day intimidation 37.62 0.00 37.78 50.00
Table 6: Percent balance improvement, Model 8 (main text)Mean Diff. eQQ Med eQQ Mean eQQ Max
GDP per capita (log) 29.08 19.33 22.26 63.09Pre-election cheating 17.79 0.00 18.87 0.00Pre-election violence 23.63 0.00 24.14 0.00
PARCOMP—Factional 87.91 0.00 87.50 0.00PARCOMP—Transitional 58.33 0.00 58.33 0.00
Executive 52.90 0.00 50.00 0.00Unemployment -40.46 -25.00 5.13 10.75
Extra-legal mobilization 14.27 0.00 14.75 0.00Administrative fraud 29.23 0.00 30.56 0.00
and standard errors presented in the main text). In Figure 3 the models include extra-legal mobi-
lization as a control variable, while voter intimidation is employed in Figure 4. The figures show
that administrative fraud is positively and significantly associated with post-election protest, while
extra-legal mobilization and voter-intimidation are not.
The remaining figures are produced using the Zelig statistical software program (Choirat et al.,
2016; Imai et al., 2008), and show predicted and expected values of post-election protest under
varying conditions, in order to demonstrate the interaction effect using the imputed data. In both
cases, continuous control variables were held at their means and categorical variables at their me-
dians. In Figure 5, the value of administrative fraud has been held at 1, equivalent to minor fraud.
Extra-legal mobilization varies between 0 (non-existent) and 3 (severe). As the figure illustrates,
7
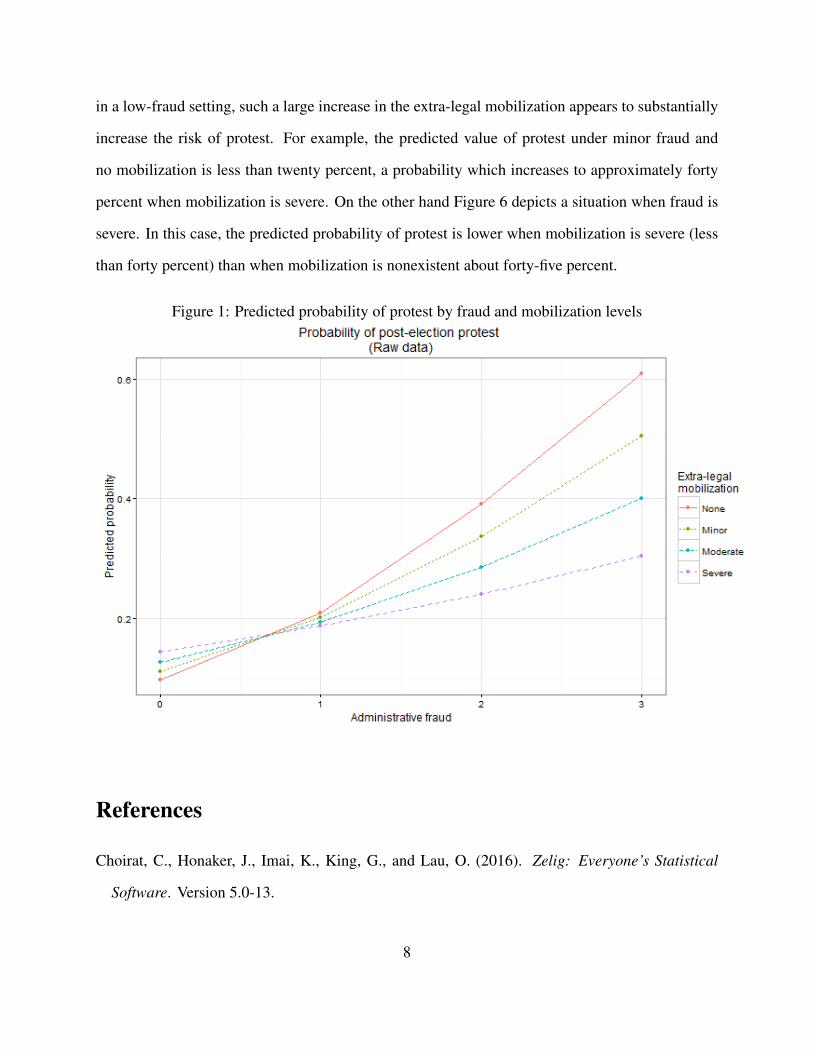
in a low-fraud setting, such a large increase in the extra-legal mobilization appears to substantially
increase the risk of protest. For example, the predicted value of protest under minor fraud and
no mobilization is less than twenty percent, a probability which increases to approximately forty
percent when mobilization is severe. On the other hand Figure 6 depicts a situation when fraud is
severe. In this case, the predicted probability of protest is lower when mobilization is severe (less
than forty percent) than when mobilization is nonexistent about forty-five percent.
Figure 1: Predicted probability of protest by fraud and mobilization levels
References
Choirat, C., Honaker, J., Imai, K., King, G., and Lau, O. (2016). Zelig: Everyone’s Statistical
Software. Version 5.0-13.
8
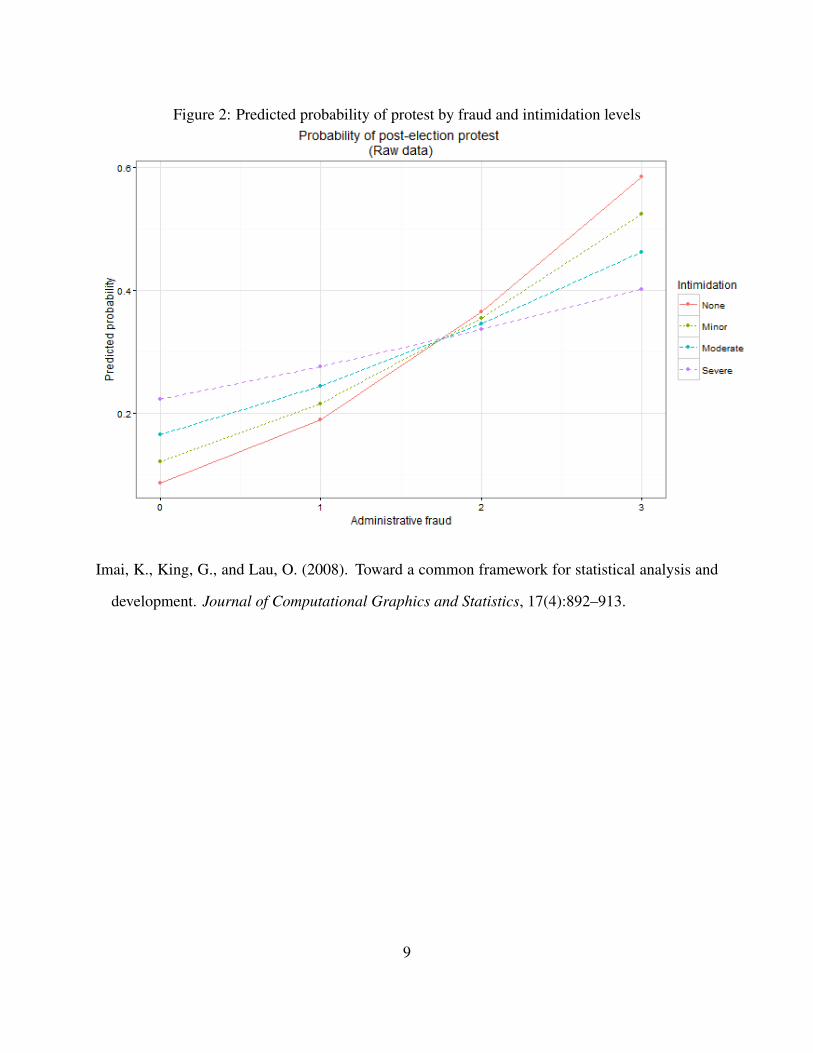
Figure 2: Predicted probability of protest by fraud and intimidation levels
Imai, K., King, G., and Lau, O. (2008). Toward a common framework for statistical analysis and
development. Journal of Computational Graphics and Statistics, 17(4):892–913.
9
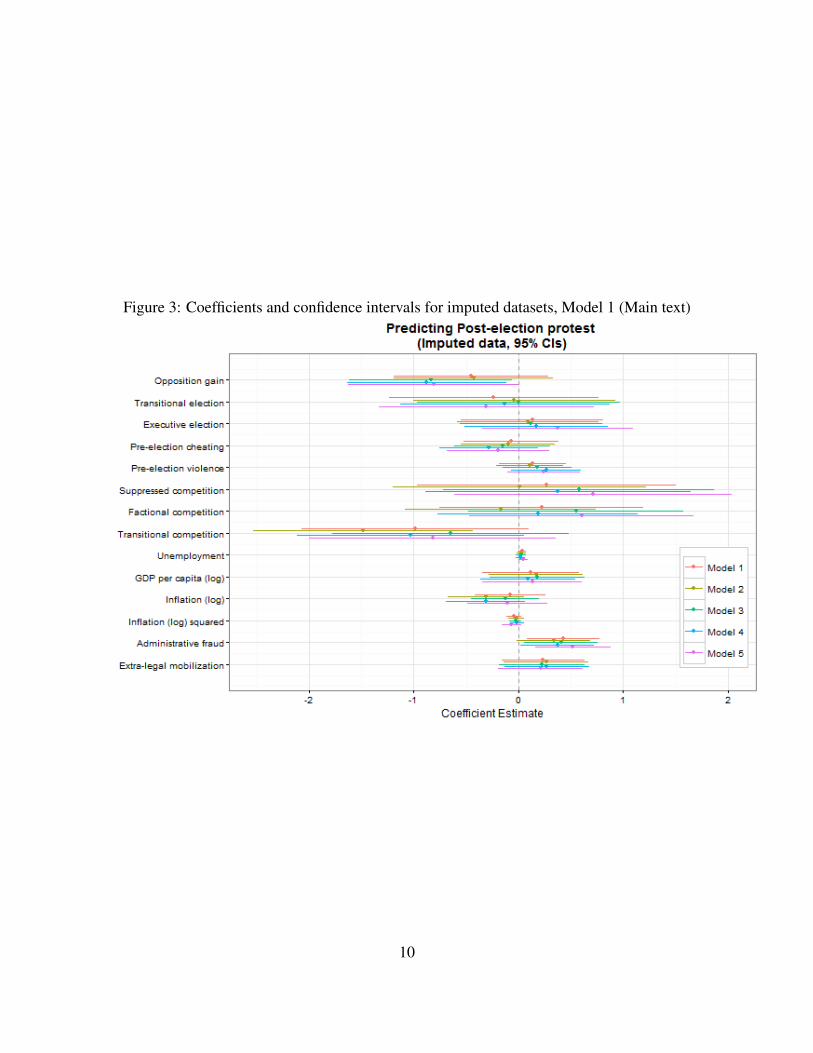
Figure 3: Coefficients and confidence intervals for imputed datasets, Model 1 (Main text)
10
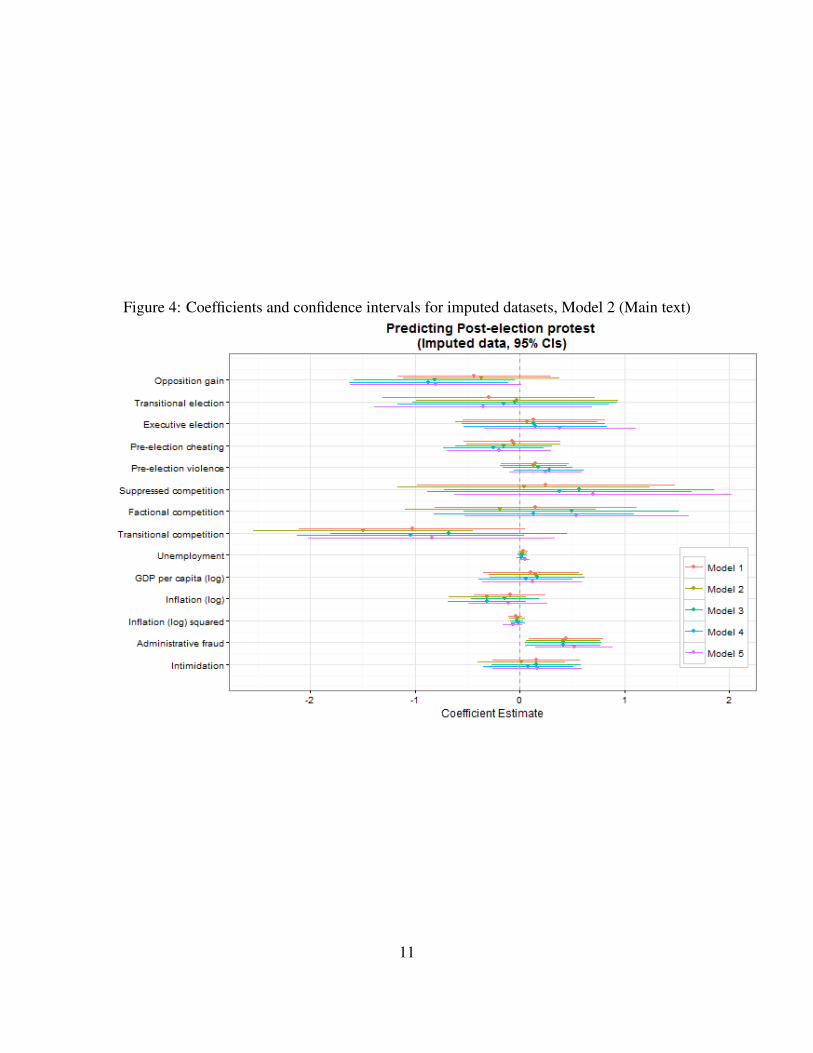
Figure 4: Coefficients and confidence intervals for imputed datasets, Model 2 (Main text)
11
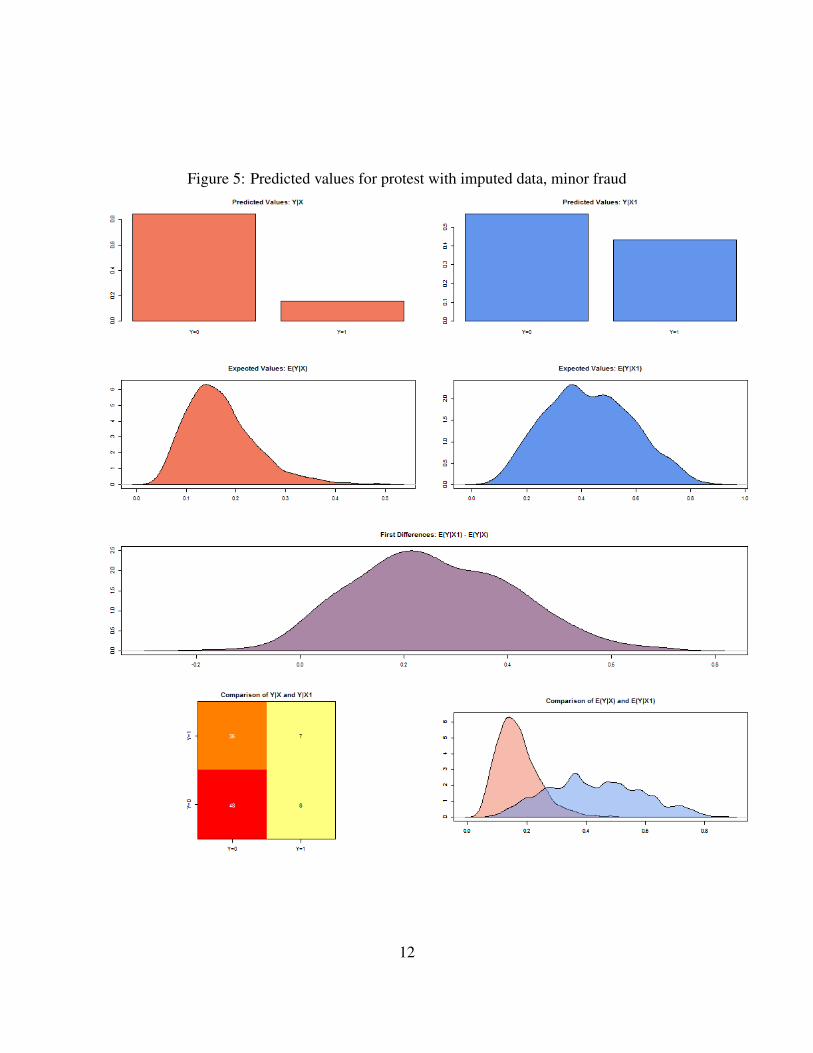
Figure 5: Predicted values for protest with imputed data, minor fraud
12
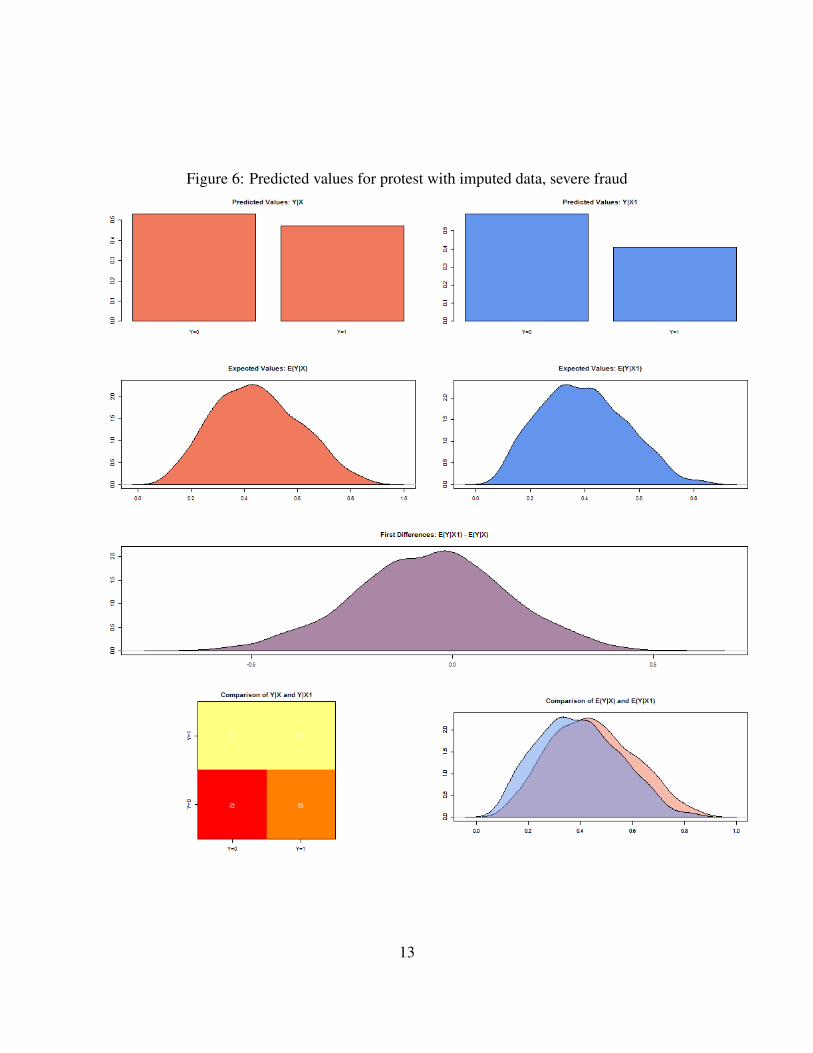
Figure 6: Predicted values for protest with imputed data, severe fraud
13